Article

The Impact of Impervious Surface on Water Quality and Its Threshold in Korea

1
Institute of Green Bio Science and Technology, Seoul National University, Gangwon 25354, Korea
2
Water Quality Assessment Research Division, National Institute of Environmental Research, Incheon 22689, Korea
*
Author to whom correspondence should be addressed.
Water 2016, 8(4), 111; https://doi.org/10.3390/w8040111
Submission received: 1 February 2016 / Revised: 16 March 2016 / Accepted: 17 March 2016 / Published: 23 March 2016

Abstract

:
The change in the impervious-pervious balance has significantly altered the stream water quality, and thus the threshold of the impervious surface area in the watershed has been an active research topic for many years. The objective of this study is to verify the correlation between impervious surfaces and water quality and to determine the threshold of the percentage of the impervious surface area (PISA) for diagnosing the severity of future stream water quality problems in the watershed as well as regulating the PISA in Korea. Statistical results indicated that the PISA is a suitable indicator of water quality at the watershed scale and can illustrate the water quality problems caused by the impervious surface. In addition, the results from this study suggest that controlling the PISA within about 10% in watersheds is a fundamental strategy to mitigate the degradation of water quality.

1. Introduction

Urbanization has led to the increase of impervious surfaces including roads, parking lots, sidewalks, roof tops, and other impermeable areas, resulting in the decrease of surfaces that can contribute to clean stormwater [1]. Impervious surfaces prevent rainfall from infiltrating into soil and ground water, which in turn increases the runoff to streams, and subsequently cause specific changes in the hydrology, habitat structure, water quality, and biodiversity of aquatic systems [2,3,4,5,6,7]. In particular, urban stormwater runoff has been regarded as a key contributor to water quality impairments as it flows across impervious areas, collecting and accumulating the detrimental pollutants [5,6].
The percentage of the impervious surface area (PISA), which is defined as the ratio of impervious surface area to the total surface area of the watershed, has for many years been regarded as one of the useful indicators to measure the impacts of land development on watershed environment. In addition, watershed managers, water quality regulators, economists, and stream ecologists are strongly interested in the relationship between the PISA and various indicators and the threshold of the PISA to prevent the adverse effects caused by the increased impervious area [8]. The PISA at which degradation of water quality begins is varied. Klein [9] suggested that the initial threshold of degradation of stream water quality was approximately 15%. Schueler [10] reported that the threshold was 10%–20%. Holland et al. [11] also reported that the adverse changes in physical, sediment, and water quality variables could be detected at 10% to 20%.
Although several studies have been done to define impervious area thresholds for water quality degradation, the chemical responses such as water quality parameters in relation to impervious surfaces in the watershed may vary depending on regional conditions [1]. The stream quality is a combination of the physical, chemical and biological health of a stream. The choice among the different types of stream quality depends on the concerns of the watershed planner, stream quality regulator, and policymakers in regions or countries. This may lead to the different PISA thresholds. In general, the thresholds for biotic measures including fish and macro invertebrate diversity and abundance ranged from 3.6% to 15%, while the chemical water quality tended to have higher impact levels with thresholds ranging from 7.5% to 50% [1]. In addition, the water quality standards to maintain the stream quality differ between countries, resulting in change in the thresholds. It is thus necessary to analyze the chemical responses under the regional conditions in a specific area in order to effectively develop the various strategies for minimizing the water quality degrading effects in a specific region. According to a recent research [12], the PISA in Korea increased from 3.0% in 1970 to 6.9% in 2010. In particular, certain areas including Seoul exceeded 50%. However, policymakers and watershed managers are experiencing difficulties in regulating land use in the watershed due to the lack of quantitative analyses of the PISA threshold in relation to water quality parameters. In addition, most current studies depend on observation of the relationship, not a quantitative threshold method [7]. Therefore, the purposes of this study are to assess the relationship between the PISA and the water quality by correlation and regression analyses and to determine the threshold of the PISA for diagnosing the severity of future stream water quality problems in the watershed as well as regulating the PISA in Korea using the diagnostic index-based test.

2. Materials and Methods
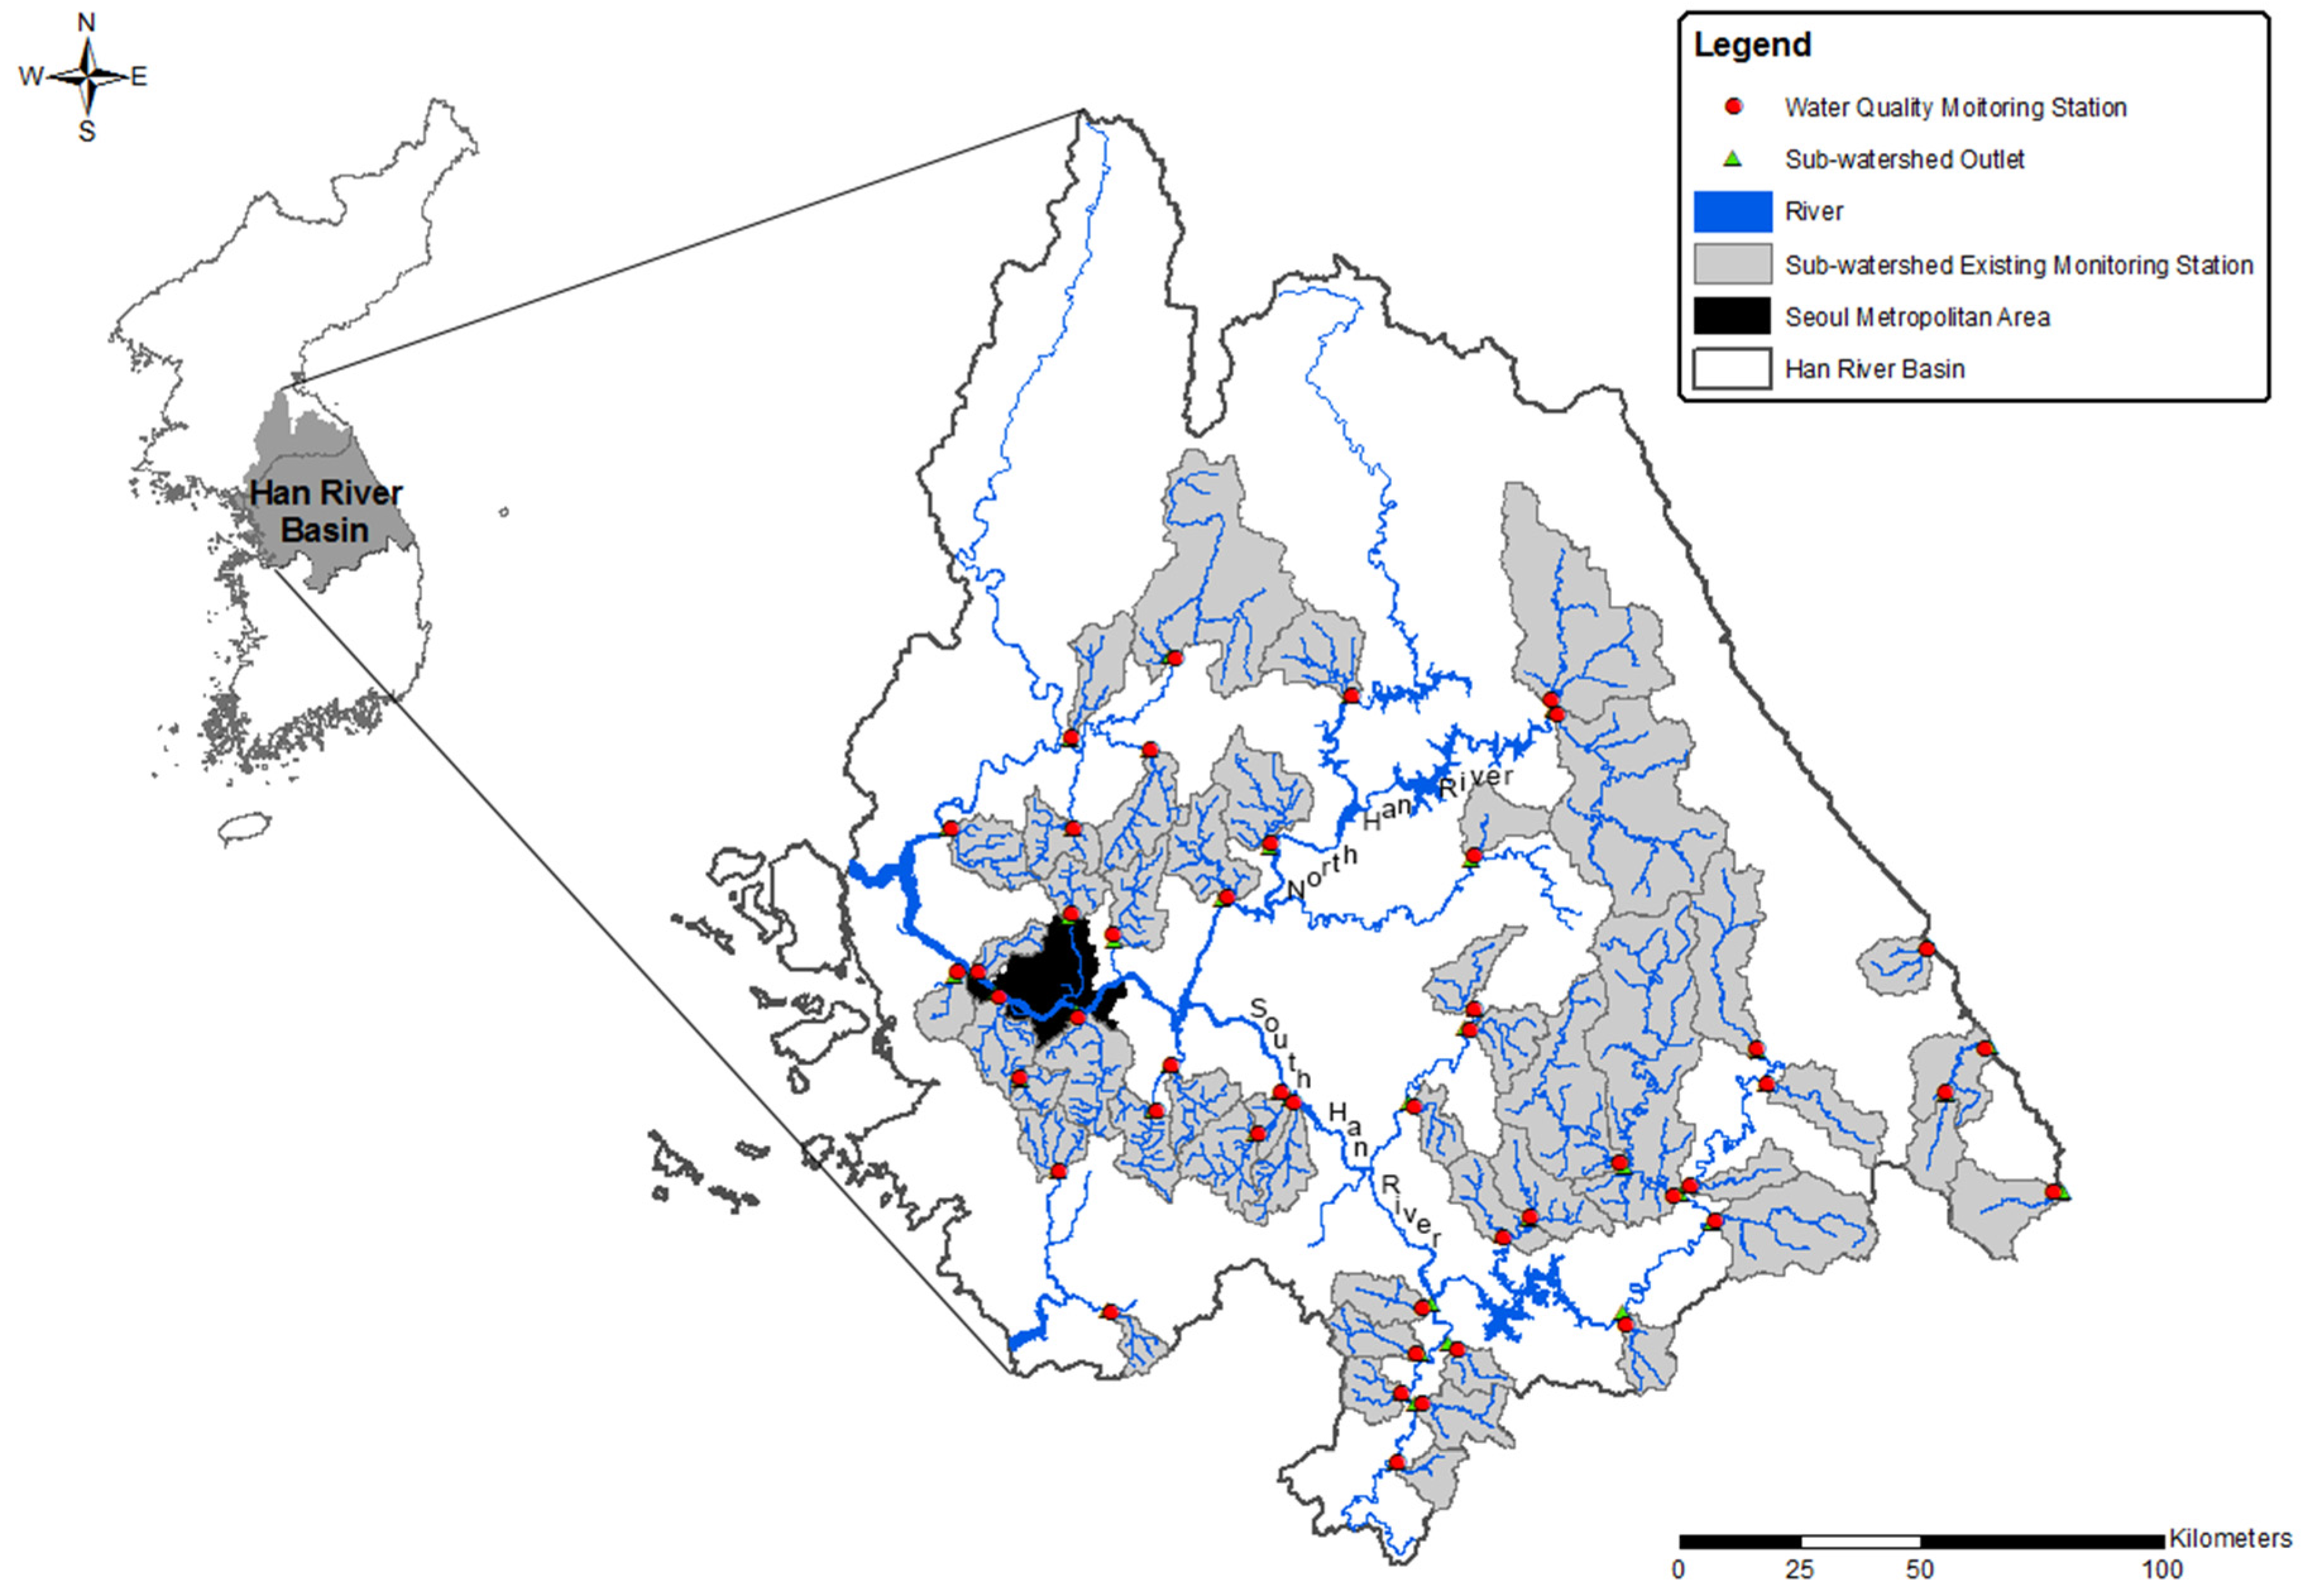
2.1. Study Area

This study was focused on the Han River Basin (HRB), which is located in the central part of the Korean Peninsula (Figure 1). The HRB is the largest river basin in South Korea, covering nearly 32,000 km2. The average annual precipitation in the HRB is about 1300 mm; approximately 70% of the annual precipitation is concentrated in the summer season (June–September) [13]. The North and South Han Rivers in the HRB are the major sources of drinking water for more than 24 million people including the residents of the densely populated Seoul metropolitan area. As land development pressure continues in the suburban areas in Seoul and its outskirts, the urban area is expected to be gradually expanded. Since urbanization leads to the increase in impervious surface areas, it is likely to cause a change in water quality in the watershed.

2.2. Selection of Sub-Watershed

Schueler et al. [8] demonstrated that the impervious cover model (ICM) based on the relationship between imperviousness and stream quality could not work well in sub-watersheds with major point sources of pollutant discharge, or extensive impoundments or dams located within the stream network. Therefore, in this study, the sub-watersheds with extensive impoundment or dams located within the stream network were excluded. The sub-watershed including the water quality monitoring station which is located in within 1 km from major point sources of pollutant discharge such as the wastewater treatment plant was also excluded to minimize the effect of major point sources on water quality observed from the monitoring stations. Among the sub-watersheds, 47 sub-watersheds were finally chosen for analysis in this study (Figure 1).

2.3. Impervious Surface Analysis

The data from the impervious surface analysis conducted by the Ministry of Environment (MOE) and Korea Environment Corporation (KECO) in 2013 [12] were used to analyze the impervious surface in each sub-watershed. In their study, the impervious surface area was extracted by overlapping the digital topographic map, digital cadastral map, and land use zoning map. The digital topographic map is designed to be used as a reference for policymaking, education and tourism, and it accurately portrays the various information of the Korean national territories including locations, geographical features, railways, streams, buildings, tributaries, institutions, topography, transportation networks, and administrative districts. Therefore, the digital topographic map is often utilized as a national fundamental map in various businesses including land management, urban information systems for the local government, and navigation of private sectors. In the digital topographic map, the roads, buildings, parking lots, and gas stations were defined as the impervious surface. The digital cadastral map provides information on location and land use category, and cadastral boundary of each land parcel. In the digital cadastral map, the roads, factories, parking lots, gas stations, and storehouses were classified as the impervious surface. The land use zoning map was produced to support the zoning regulation which regulates various aspects of how land can be used. In the land use zoning map, the residential, commercial, and industrial areas were defined as the impervious surface. Although all three maps provide the land use category, the land use was differently classified because each map was made for a different purpose. Therefore, the extracted impervious surface area generated by overlapping three maps could have relatively enhanced the accuracy of the impervious area estimation.

2.4. Water Quality Data

In this study, water quality parameters including biochemical oxygen demand (BOD), chemical oxygen demand (COD), total organic carbon (TOC), and total phosphorus (T-P) were used to represent the stream water quality. Water quality parameters were monitored and analyzed on a monthly basis at the watershed outlet by the National Institute of Environmental Research (NIER). The water quality data were collected from 2009 to 2013, and the five-year (2009–2013) average values for each water quality parameter were used as representative values for each water quality station.

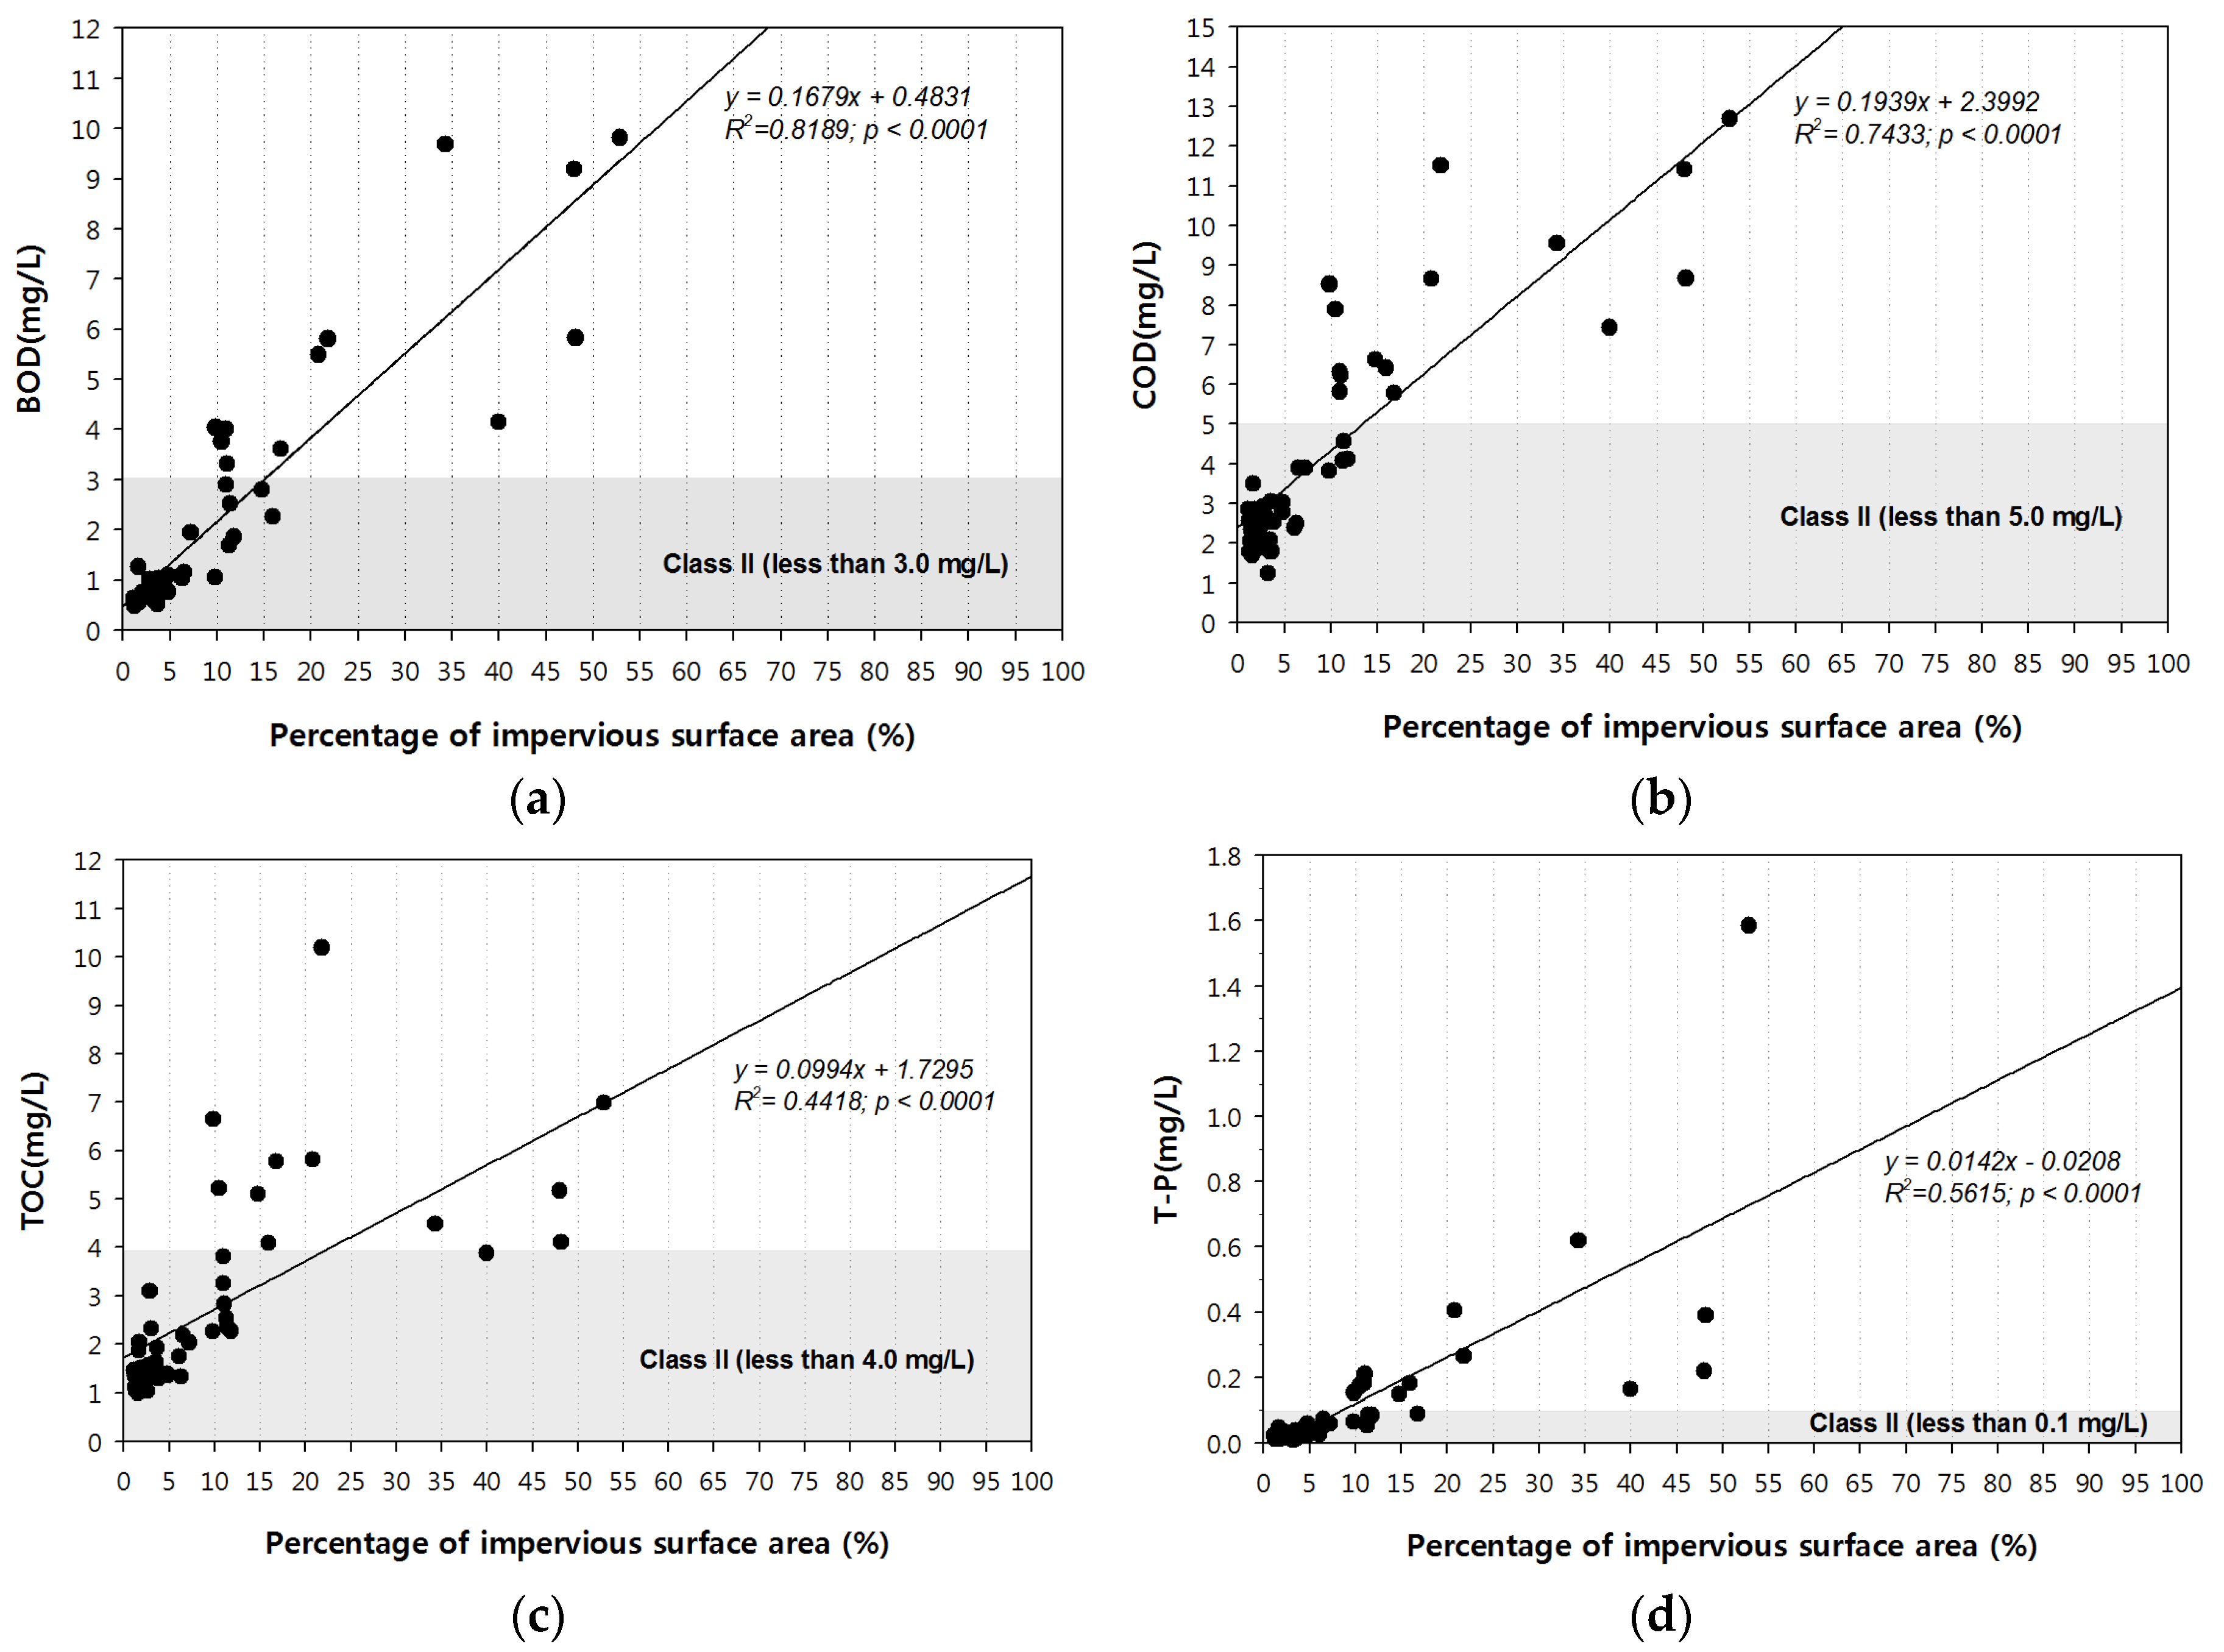
2.5. Relationship between PISA and Water Quality

To evaluate the relationship between stream water quality and PISA in the study area, the five-year average values and PISA values were retrieved from 47 water quality monitoring stations and corresponding sub-watersheds, respectively (Figure 1). The area of the sub-watersheds ranges from 77.2 to 1730.3 km2, while the PISA of those ranges from 1.1% to 52.9%. A simple linear regression analysis was conducted to quantify the relationship between PISA and water quality including BOD, COD, TOC, and T-P. All statistical analyses were conducted using the computer package Sigmaplot 10.0 (Systat Software Inc, Chicago, IL, USA). A p-value < 0.001 was considered statistically significant.

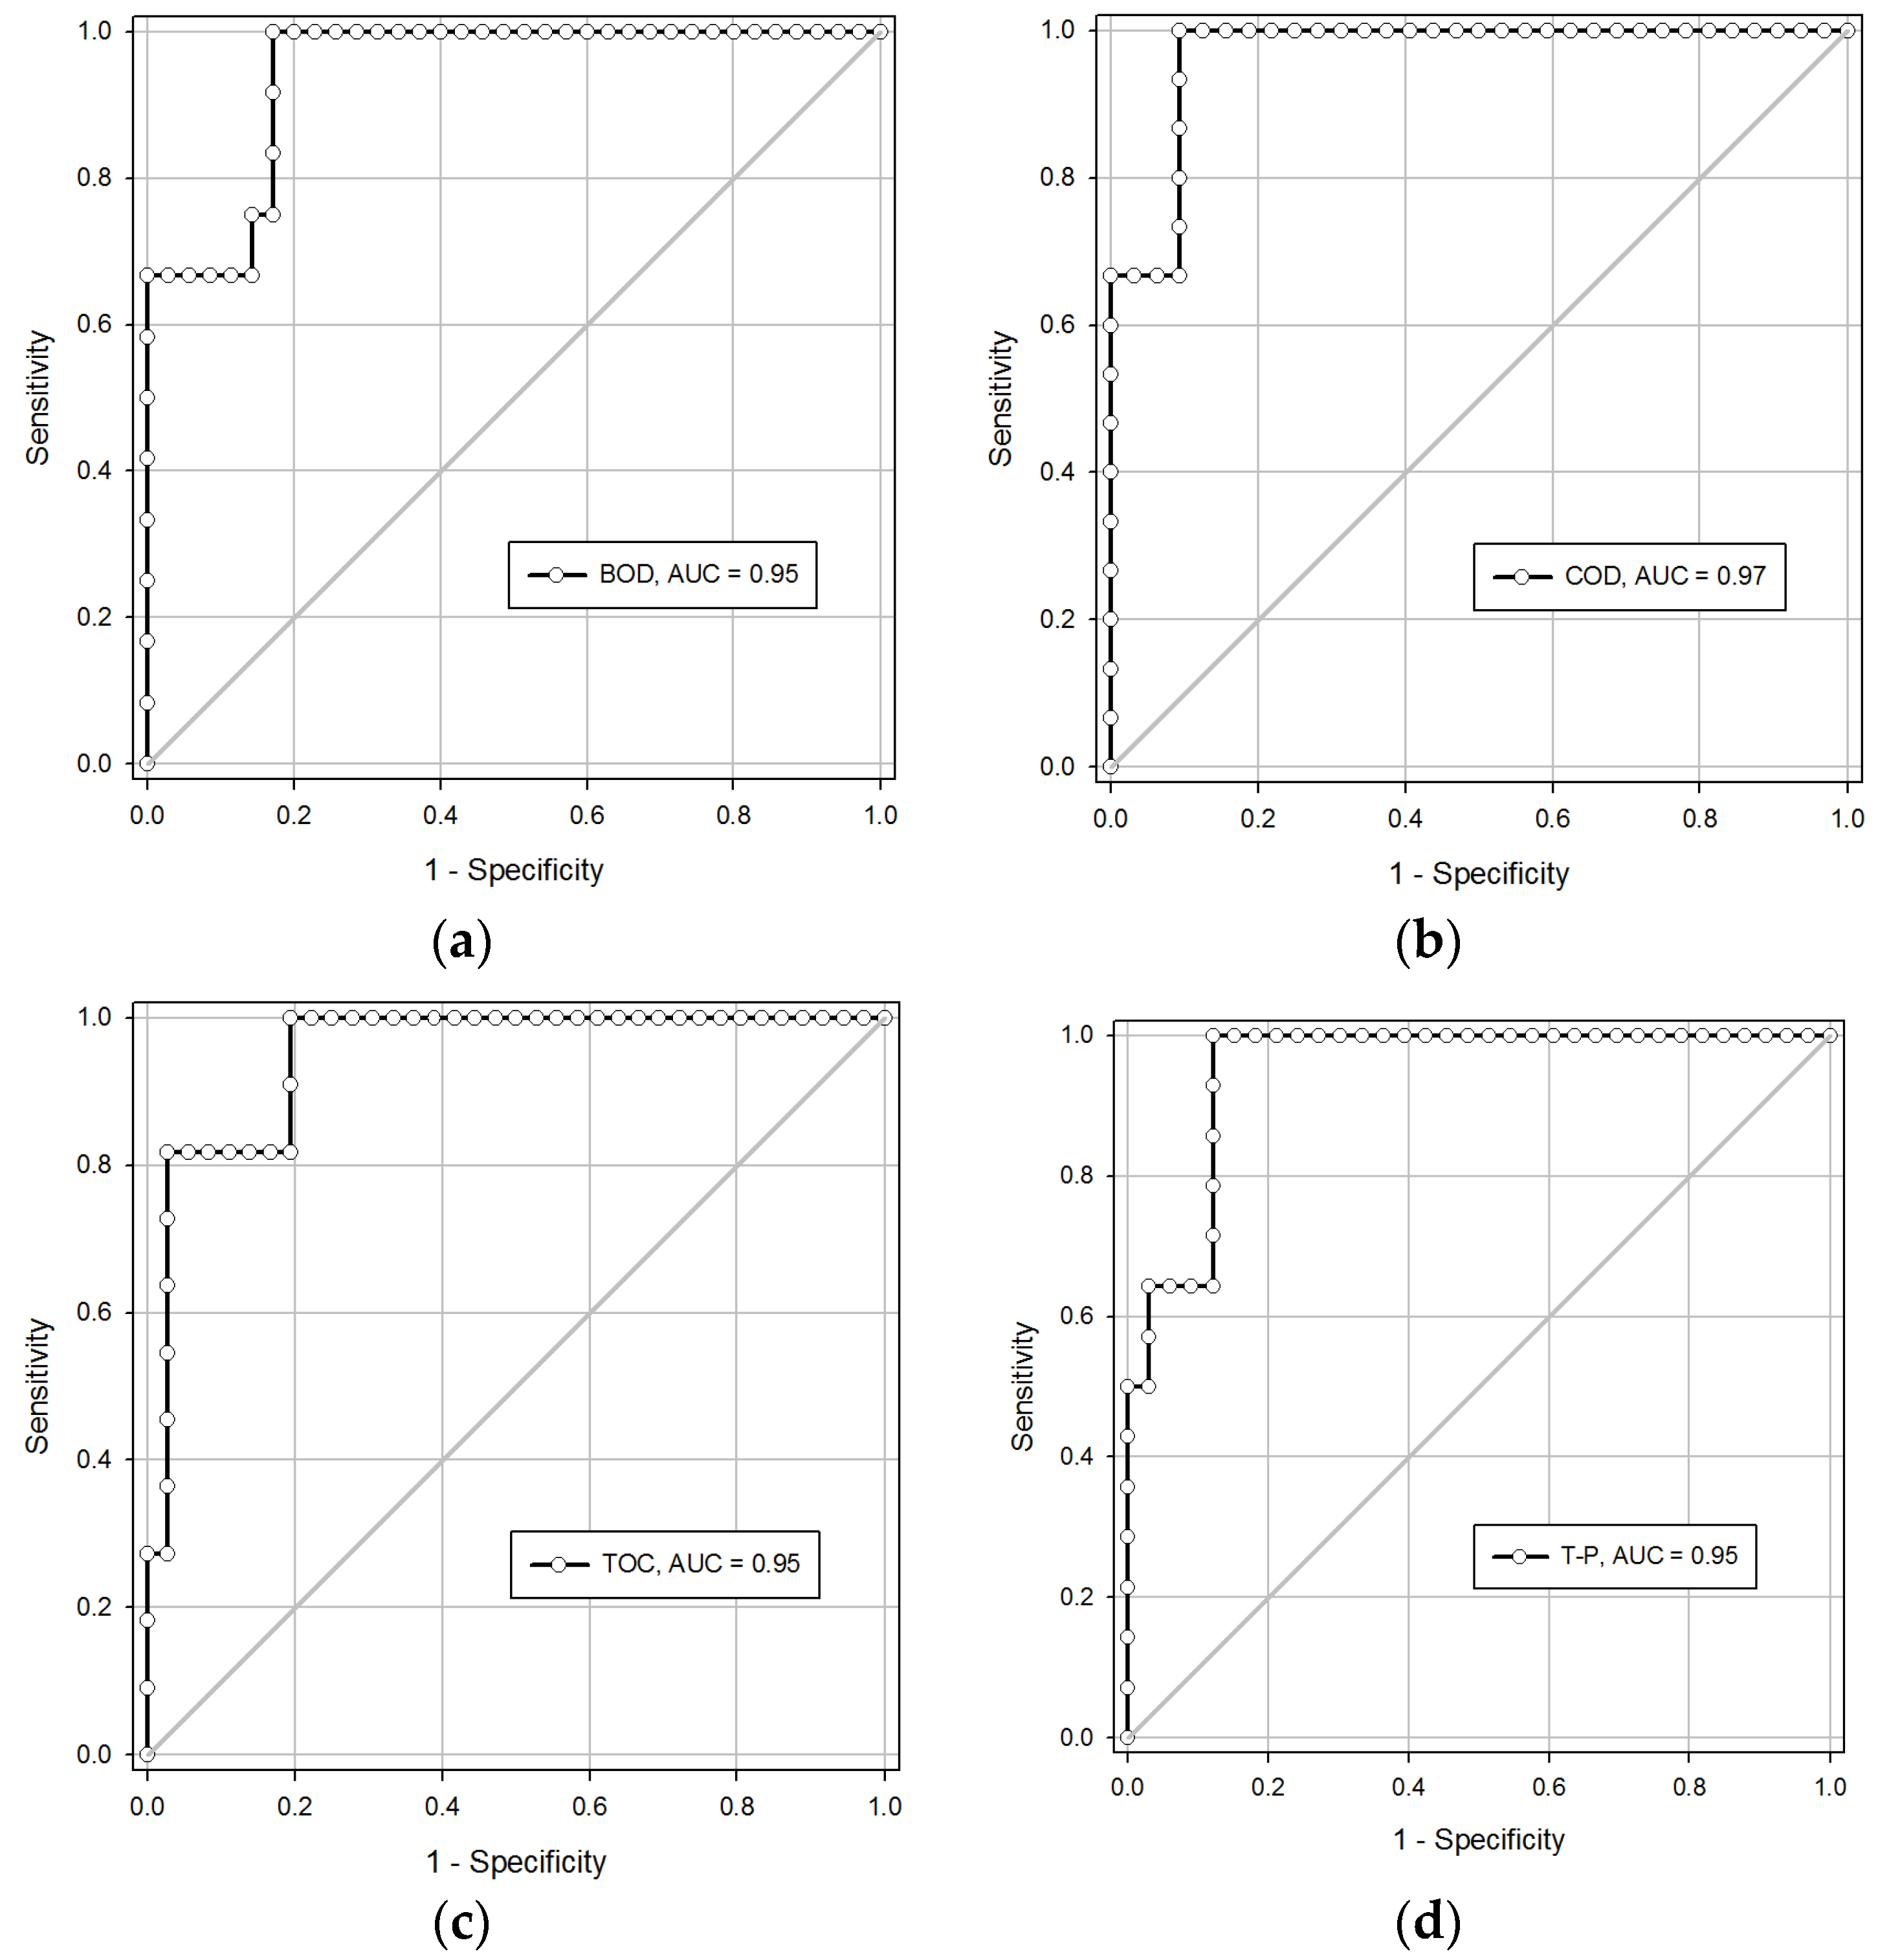
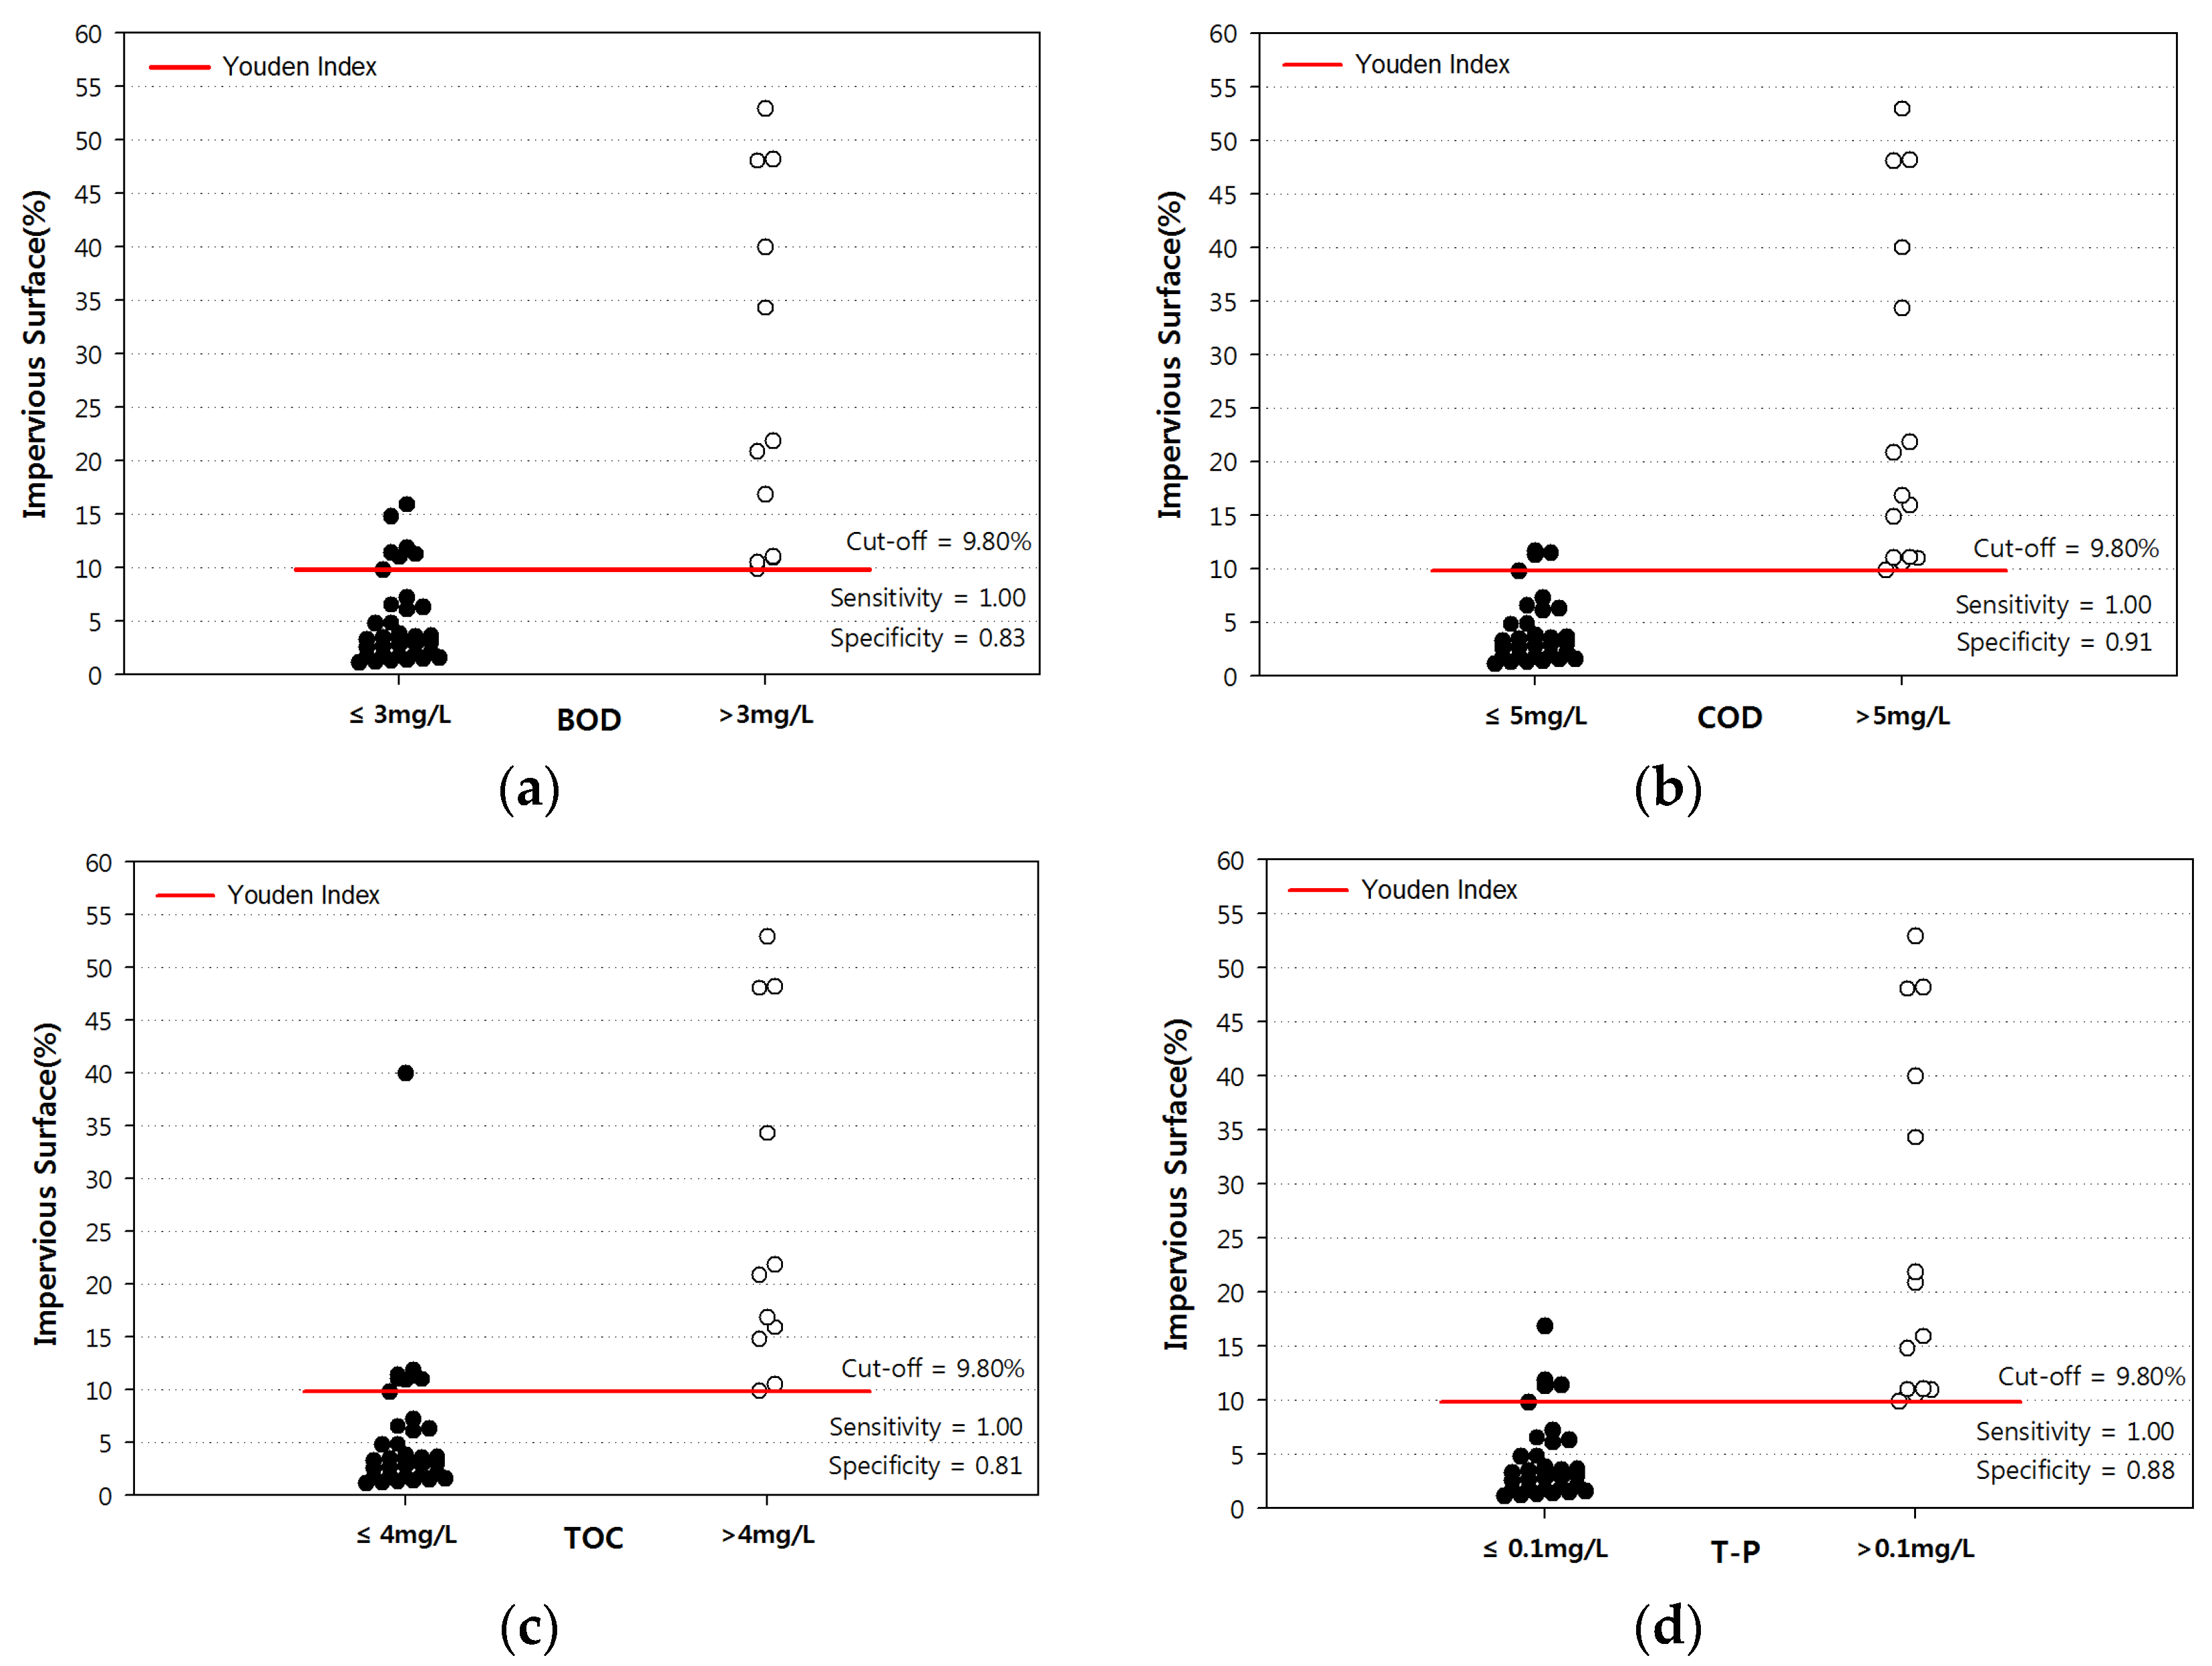
2.6. Threshold of PISA

In this study, the threshold of PISA was used to represent the point at which the water quality abruptly degrades in relation to PISA. The receiver operating characteristics (ROC) curve analysis was performed to evaluate the accuracy of the PISA index and determine the threshold of PISA. The ROC curve analysis has been frequently applied to evaluate diagnostic index-based tests and to identify the decision threshold or cut-off value [14,15,16]. The ROC curve shows how the true-positive proportion (sensitivity) on the Y-axis changes in relation to the false-positive proportion (1-specificity) on the X-axis, as the decision criterion (or cut point) is varied [17]. The area under the ROC curve (AUC) approximates the proportion of correct predictions. The AUC value ranges between 0 and 1 since its value is a portion of the area of the unit square. The higher values of the AUC indicate better test performance. Generally, the values of the AUC between 0.50 and 0.70 represent low accuracy (useless data), whereas higher values (between 0.70 and 0.90) represent high accuracy (useful data) [14]. The Youden index (J), a function of sensitivity and specificity, is often used in conjunction with the ROC curve analysis as a commonly used measure of overall diagnostic effectiveness [18]. The Youden index provides a criterion for choosing the optimal threshold value. The Youden index is defined by:
Youden index (J) = maximum {sensitivity(c) + specificity(c) − 1}
over all cut-off value(c). The Youden index ranges between 0 and 1, where values close to 1 indicate that the diagnostic effectiveness is relatively large and values close to 0 indicate that the effectiveness is limited [18]. In this study, the ROC curve analysis for the selection of cut-off values was performed using the Sigmaplot 10.0.
In Korea, the water quality standards define seven water quality classes for stream management. Class II indicates that the water quality is suitable for swimming and drinking after general treatment including filtration, deposition, and sterilization. Class II water is considered to be not polluted: the regulation levels of BOD, COD, TOC, and T-P are 3.0, 5.0, 4.0, and 0.10 mg/L, respectively. In this study, the water quality levels for Class II water were used to determine the PISA threshold value. The threshold value indicates that the water quality dropped below Class II due to the change in impervious surface area of the sub-watershed.

3. Results and Discussion

3.1. Relationship between PISA and Water Quality

The linear regression analysis and corresponding coefficient of determination (R2) indicated that there were statistically significant relationships between the PISA and average concentrations of BOD (R2 = 0.819, p < 0.0001), COD (R2 = 0.743, p < 0.0001), TOC (R2 = 0.442, p < 0.0001), and T-P (R2 = 0.562, p < 0.0001) (Figure 2). Since this study sampled the full range of possible PISAs within the HRB, not focusing on urbanizing sub-watersheds, the great concentration of sampling points was distributed near the origin of the axes as shown in Figure 2. This can affect the coefficient of determination as well as the relationship. However, the results with the full range of possible PISA values can help the watershed planner and policymakers understand the relationship between the PISA and water quality in the watershed as this study showed the effects of the change in the impervious-pervious surface balance in the watershed on water quality.
Among the sub-watersheds, some sub-watersheds had better or worse water quality than expected, given their level of PISA, as shown in Figure 2. To examine why this is the case, these sub-watersheds were further examined. In the case of sub-watersheds where the PISA values ranged from 10% to 15%, the impervious surface area including commercial and residential areas was extensively distributed within a closer proximity to the monitoring station. The impervious surface location within the watershed along the stream course may contribute to stream health. Generally, downstream disturbances will create more concentrated impacts, while upstream impacts will create disturbances over more stream miles [1]. In addition, the sewer systems for urban drainage were totally not provided in urban areas, leading to water quality degradation. The placement of impervious surface area and lack of sewer systems are likely the primary reasons why these sub-watersheds have worse water quality, given their PISA levels, compared to the other sub-watersheds. The sub-watershed, at which the T-P was 1.6 mg/L, has agricultural land which contributes the most nutrients. This can be one of the primary reasons why the concentration of T-P at this sub-watershed was relatively higher than other sub-watersheds, given the PISA level. In the sub-watershed, where the PISA value was about 22%, the concentrations of COD and TOC were 10.2 and 11.5 mg/L, respectively. Given the PISA level, the concentrations of COD and TOC were higher in comparison to the other sub-watersheds. The small-scaled industrial wastewater treatment plant is located about 10 km away from the monitoring station in this sub-watershed, which could result in the increase in concentrations of COD and TOC. On the other hand, some sub-watersheds had better water quality than expected, given their level of PISA ranging from 40% to 50%. In these sub-watersheds, for improving the stream health, projects including stream restoration and sewer system rehabilitation projects have been implemented, leading to the improvement in the water quality.
Although the water quality was influenced by other factors including the impervious surface location within the watershed, the program for improving the stream health, surrounding land use, and the point sources of pollutant discharge, the general trend in the relationship between the PISA and water quality indicated that the PISA considerably impacted the water quality parameters in HRB.

3.2. PISA Threshold

The ROC curves plotted for BOD, COD, TOC, and T-P are presented and the values of the AUCs for BOD, COD, TOC, and T-P were 0.95, 0.97, 0.95, and 0.95, respectively (Figure 3). This result indicated that the PISA is a useful indicator to discriminate two opposite categories of “good (better than Class II of the water quality standard)” and “polluted (worse than Class II of the water quality standard)” since all the AUC values were more than 0.95. The threshold value of the PISA at which the degradation of water quality starts was determined as the point with the highest Youden index. The threshold values of the PISA for BOD, COD, TOC, and T-P were all 9.80% (Figure 4). This result indicates that controlling the PISA to be under 9.8% can be a fundamental strategy to satisfy the water quality standards for Class II which is the target of the Korean government’s water quality management. The study by Liu et al. [7] showed that the PISA thresholds for BOD (4 mg/L), COD (6 mg/L), and T-P (0.2 mg/L) were 33.4%, 41.9%, and 38.9%, respectively. The threshold values in their study were higher than those in this study. This difference in thresholds may be attributed to a number of factors including the placement of impervious surface area, runoff characteristics among different types of impervious and pervious surface areas, stream characteristics, and surrounding land use. In Korea, residential and commercial areas are densely mixed over the city. In particular, most of the impervious surface areas including those areas are located close to the stream without buffer zones. The distance between the impervious cover and stream channel may be one of the primary reasons causing the difference in thresholds because the placement of the impervious surface area determines a lot of changes in stream functioning including the speed with which flow enters the stream and the possible absorption by pervious surface areas [1].
Many previous studies have found that the stream quality starts to be impacted and degraded when the PISA value of a watershed is between 7% and 20% [8,11]. The results in this study correspond to the results of the previous studies. Therefore, Class II as the target for water quality management might be effective for controlling stream health. However, since many other studies considering biotic water quality indicators, including fish and micro invertebrate diversity and abundance, showed much lower thresholds than the impact threshold from this study, which only used abiotic measurements, there needs to be a more careful regulation or management to assure the health of the water environment [1,8].

4. Conclusions

In this study, correlation and regression analyses were conducted to assess the relationship between the PISA and the water quality parameters including BOD, COD, TOC, and T-P. In addition, the threshold of the PISA for diagnosing future stream water quality problems with the expansion of impervious surfaces in the watershed was suggested. The results indicated that the PISA can be an appropriate indicator for water quality at the watershed scale since significant positive linear relationships were found between the PISA and the average concentrations of BOD, COD, TOC, and T-P. In addition, the results of the ROC curve analysis indicated that controlling the PISA within about 10% in watersheds is a fundamental strategy to prevent the degradation of water quality.
Since stream water quality in the watershed is influenced by many factors such as meteorological conditions and anthropogenic activities, only considering the PISA value cannot perfectly represent the status of stream water quality within the watershed. However, this study demonstrated that the PISA can potentially serve as one of the important indicators to help determine the status of stream water quality. In particular, the threshold method described in this study can be useful in assessing how the change in impervious surface area impacts the water quality of the stream in the watersheds where agricultural and forested lands are rapidly converted into urban land uses including roads, parking lots, sidewalks, and roof tops with urbanization.

Acknowledgments

This study was financially supported by the National Institute of Environmental Research (NIER).

Author Contributions

Hakwan Kim and Hanseok Jeong performed the statistical analyses, produced the figures and tables, and wrote the paper. Jihye Jeon and Seungjong Bae helped with the GIS analysis, which includes choosing a proper method for data display and producing the final figures. Hakkwan Kim, Hanseok Jeong, Jihye Jeon, and Seungjong Bae all read and made improvements to the manuscript.

Conflicts of Interest

The authors declare no conflict of interest.

References

  1. Brabec, E.; Schulte, S.; Richards, P.L. Impervious surface and water quality: A review of current literature and its implications for watershed planning. J. Plann. Lit. 2002, 16, 499–514. [Google Scholar] [CrossRef]
  2. Arnold, C.L.; Gibbons, C.J. Impervious surface coverage: The emergence of a key environmental indicator. J. Am. Plan. Assoc. 1996, 62, 243–258. [Google Scholar] [CrossRef]
  3. Shuster, W.D.; Bonta, J.; Thurstron, H.; Warnemuende, E.; Smith, D.R. Impacts of impervious surface on watershed hydrology: A review. Urban Water J. 2005, 2, 263–275. [Google Scholar] [CrossRef]
  4. Moring, J.B. Effects of Urbanization on the Chemical, Physical, and Biological Characteristics of Small Blackland Prairie Streams in and near the Dallas-Fort Worth Metropolitan Area, Texas; Geological Survey Scientific Investigations Report 2006-5101-C; U.S. Geological Survey: Austin, TX, USA, 2009. [Google Scholar]
  5. Li, H.; Sharkey, L.J.; Hunt, W.F.; Davis, A.P. Mitigation of impervious surface hydrology using bioretention in North Carolina and Maryland. J. Hydrol. Eng. 2009, 14, 407–415. [Google Scholar] [CrossRef]
  6. O’Driscoll, M.; Clinton, S.; Jefferson, A.; Manda, A.; McMillan, S. Urbanization effects on watershed hydrology and in-stream processes in the Southern United States. Water 2010, 2, 605–648. [Google Scholar] [CrossRef]
  7. Liu, Z.; Wang, Y.; Li, Z.; Peng, J. Impervious surface impact on water quality in the process of rapid urbanization in Shenzhen, China. Environ. Earth Sci. 2013, 68, 2365–2373. [Google Scholar] [CrossRef]
  8. Schueler, T.R.; Fraley-McNeal, L.; Cappiella, K. Is impervious cover still important? Review of recenty research. J. Hydrol. Eng. 2009, 14, 309–315. [Google Scholar] [CrossRef]
  9. Klein, R.D. Urbanization and stream quality impairment. Water Resour. Bull. 1979, 15, 948–963. [Google Scholar] [CrossRef]
  10. Schueler, T.R. The importance of imperviousness. Watershed Prot. Tech. 1994, 1, 100–111. [Google Scholar]
  11. Holland, F.; Sanger, D.M.; Gawle, C.P.; Lerberg, S.B.; Santago, M.S.; Riekerk, G.H.M.; Zimmerman, L.E.; Scott, G.I. Linkages between tidal creek ecosystems and the landscape and demographic attributes of their watersheds. J. Exp. Mar. Biol. Ecol. 2004, 298, 151–178. [Google Scholar] [CrossRef]
  12. Ministry of Environment (MOE) and Korea Environment Corporation (KECO). Estimation of impervious Surface Area in Korea; MOE: Sejong, Korea; KECO: Seoul, Korea, 2014. [Google Scholar]
  13. Chang, H. Spatial analysis of water quality trends in the Han River basin, South Korea. Water Res. 2008, 42, 3285–3304. [Google Scholar] [CrossRef] [PubMed]
  14. Greiner, M.; Pfeiffer, D.; Smith, R.D. Principles and practical application of the receiver-operating characteristic analysis for diagnostic tests. Prev. Vet. Med. 2000, 45, 23–41. [Google Scholar] [CrossRef]
  15. Faucett, T. An introduction to ROC analysis. Pattern Recogn. Lett. 2006, 27, 861–874. [Google Scholar] [CrossRef]
  16. Dos Santos, D.A.; Molineri, C.; Reynaga, M.C.; Basualdo, C. Which index is the best to assess stream health? Ecol. Indicat. 2008, 8, 588–598. [Google Scholar] [CrossRef]
  17. Storey, J.E.; Rowland, J.T.J.; Basic, D.; Conforti, A. A comparison of five clock scoring methods using ROC (receiver, operating characteristic) curve analysis. Int. J. Geriatr. Psychiatry 2001, 16, 394–399. [Google Scholar] [CrossRef] [PubMed]
  18. Schisterman, E.F.; Perkins, N.J.; Liu, A.; Bondell, H. Optimal cut-point and its corresponding Youden index to discriminate individual using pooled blood samples. Epidemiology 2005, 16, 73–81. [Google Scholar] [CrossRef] [PubMed]
Figure 1. Location of the Han River Basin and water quality monitoring stations.
Water 08 00111 g001
Figure 2. Plots of linear regression relationships of (a) BOD; (b) COD; (c) TOC; and (d) T-P in relation to the percentage of impervious surface area (PISA).
Water 08 00111 g002
Figure 3. The results of ROC curve analysis for (a) BOD; (b) COD; (c) TOC; and (d) T-P.
Water 08 00111 g003
Figure 4. The cut-off values for (a) BOD; (b) COD; (c) TOC; and (d) T-P.
Water 08 00111 g004

