1. Introduction
The South American Altiplano is one of the largest high plateaus in the world. The highland is faced with extreme climatic variability that determines the region´s poverty and harsh living conditions [
1]. The area covers about 192,000 km
2, and presents a north–south gradient variation with an annual precipitation decreasing from 1100 mm to 200 mm [
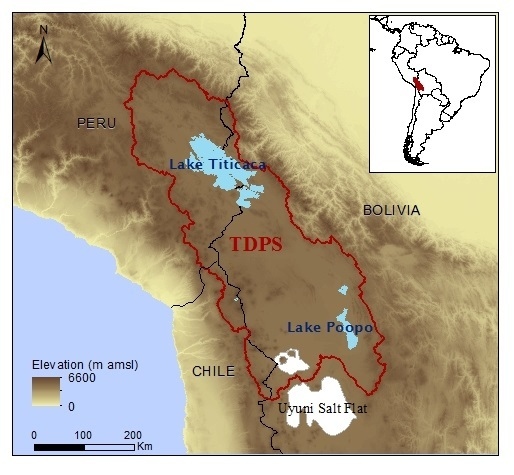
2] and about 1800 mm average annual potential evaporation. The Altiplano contains two large lakes, Lake Titicaca in the northern part and Lake Poopó in the central part. The two lakes are connected through the Desaguadero River and salt content in the water is gradually increasing from north to south, with Lake Poopó’s extremely salty water. This is due to increasing upstream irrigation leading to a more salty return flow and lower precipitation occurrence in the southern part of the system. The total water storage is about 936 km
3. The water in Lake Titicaca represents about 99% of the total surface water in the Altiplano, meaning that this lake supplies a major part of water and humidity into the southern arid region. Together, the semiarid region around Lake Titicaca, the arid region around Lake Poopó, and the saltpans constitute a large watershed, called the Lake Titicaca, Desaguadero River, Lake Poopó, and Coipasa Salt Flat System (TDPS hydrologic system;
Figure 1).
The TDPS system has an average elevation of about 4000 m above mean sea level (amsl). It extends from the Amazon and La Plata basins to the east and the Atacama Desert, influenced by the southeast Pacific anticyclone to the west, along the central portion of the Andes cordillera [
3,
4]. The Andes cordillera, the longest mountain chain in the world, runs through the western part of the continent (between latitudes ~10° N and 53° S). In contrast to its length, it is relatively narrow (~200 km). However, at its widest point it is divided into two mountain ranges surrounding the Altiplano. The highest peak in the Bolivian Altiplano is the Sajama volcano which is 6542 m amsl (18°06’ S, 68°53’ W) [
5]. The TDPS system covers an area of approximately 144,590 km
2, with 34% in Peru, 61% in Bolivia, and 5% in Chile (
Figure 1). The Desaguadero River is Titicaca’s only outlet that flows into Lake Poopó. Sporadic overflow from Lake Poopó in turn ends up in the Coipasa Saltpan (e.g., [
6]). The world’s largest salt desert, the Salar de Uyuni, is located south of the TDPS system [
7].
The total population of the TDPS system was about 2.5 million in 2003 (48% Peruvians and 52% Bolivians) [
8]. In 2009, the population had increased to more than 3 million [
9]. The principal economic activities in the TDPS system are agriculture, industry, and trade [
10]. The common agricultural production is focused on fishing, cattle, and crops, such as quinoa and potato [
8]. Generally, the agricultural productivity in the Altiplano is low due to the high susceptibility to climate, poor soils, and manual labor. The high evaporative demand and the erratic distribution of rainfall increase the agricultural vulnerability. In addition, the precipitation dependency of rain-fed agriculture and the high frost risk limit the farming production to the moist austral summer [
11].
Important constraints to agricultural development in the Altiplano are the lacking data on climatic variability and related water resources availability. Lacking data are also hampering the scientific publications for the region and restrict the accessibility of climatological and hydrological information. The situation is not improved by the lack of collaboration between scientists, local populations, and governmental and non-governmental organizations [
12,
13]. Most of the research has been carried out for the Lake Titicaca and Desaguadero River basins. The spatially-uneven meteorological and hydrological data collection restricts the water resources assessment for the rest of the TDPS system and for sub-basin scales. In spite of the scarce data situation and little knowledge on rainfall-runoff relationships for the arid catchments along the Altiplano, with common problems of flash floods, rivers are now being diverted and dams are being built at a large scale. The Bolivian government plan for 2015–2020 includes building dams along intermittent rivers. With the present lack of knowledge of the area’s hydrology, the ecological and environmental consequences of such large-scale infrastructure are difficult to foresee.
In view of the above, it is clear that the Altiplano poses specific intricacies regarding topography and climatic variability. This, in combination with significant data scarcity, makes it a difficult area to model hydrologically. Henceforth, the objective of this study is to produce a state of the art review of the research with respect to climate and water resources in the TDPS hydrological system, define important research gaps in hydrological data information of the region, and the key role that these have for the sustainable development in view of climate change and population increase.
2. Living Conditions and Environment
The Central Andes are mainly inhabited by people of indigenous origin. These communities have developed cultures and technologies adapted to the harsh climate conditions in the region [
14]. An example of adaptive agricultural technology is the agrodiversity system. This means that agricultural practices are managed over diverse ecological zones and the social organization relates to this diversification. The prosperous Tiwanaku civilization (300 BC–AD 300) developed agrodiversity to successfully deal with three principal problems in the Altiplano, namely; poor soil, aridity, and frost. The Tiwanakus thus created micro-climates for a sustainable agriculture by use of raised terraced fields, called “camellones”. The camellones or canals brought water and nutrients to the fields and acted as heat storages during the night [
15]. Nevertheless, at present, poverty is the major barrier to overcome in order to improve living conditions. The limited availability of local resources and services, like water and sanitation access (about 20%), compel the rural population to migrate to cities [
8].
The traditional quinoa cultivation extends along the high Andes, and it is one of the most important crops of the region. The quinoa production in Bolivia increased from 34,000 ton in 2009 to 84,000 ton in 2014, with an export rise from 43,000 to 196,000 USD, respectively [
16]. This increase improved farmers’ income, and increased national and international trade. The demand was especially pronounced in 2013, named the International Year of Quinoa by the United Nations. In 2013, Bolivia and Peru supplied over 95% of the global quinoa production. The quinoa price fell from 6,600 USD/ton in 2013 to 4,500 USD/ton in 2014, due to the increase in production, especially in Peru, that surpassed Bolivia as the largest exporter of quinoa in the world [
17].
3. Climate Variability
Two factors play a main role for the extreme climate of the Altiplano. The first is the Bolivian High that acts as a buffer against moist air inflow to the region. The second is the orographic barrier of the Andes that affects not only the regional climate, but also the world climate [
18]. The Altiplano summertime (DJFM) precipitation variability, and its relationship to the atmospheric circulation, were investigated by among others Thibeault
et al. [
19], Lenters and Cook [
20], Vuille [
5], and Garreaud and Aceituno [
21]. Easterly flow transports humid air from the lowlands east of the Altiplano, while westerly flow inhibits moisture transport from the east. This mechanism affects the precipitation variability and relates to changes in the mid- and upper-level wind patterns [
19]. Summertime precipitation variability of the Altiplano relates to the strength and position of the upper-level anticyclone called the Bolivian High. This affects the direction of low-level flow east of the Altiplano [
20,
22]. Northward (southward) displacement of the Bolivian High is associated with low-level southerly (northwesterly) flow and dry, stable (humid, unstable) conditions that are unfavorable (favorable) for convection in the Altiplano [
19]. During the austral summer establishment of the upper-level Bolivian High is centered at 17° S and 70° W [
23].
The TDPS system within the Altiplano area is a semiarid to arid region, where the seasonal distribution of rain is similar throughout the region. The rainy season occurs generally from December to March, and the dry season from May to August [
24]. Annual rainfall can fluctuate 50% from the mean. The largest rainfall in the TDPS System occurs in and around the Lake Titicaca [
25]. Outside the Lake Titicaca area, the northern part of the system (surrounding Coata and Ramis Rivers) has an annual precipitation of about 800 to 1400 mm [
24]. However, in the southern part of the TDPS system the annual precipitation decreases to about 200 mm along the southwestern part of the system (Salar de Coipasa). Along the east, precipitation is caused by moisture lifting from the Amazon through the Cordillera.
The Bolivian Altiplano wet season takes place from November to March (
Figure 2) [
3]. Over 60% of the annual precipitation fall during the summer months (DJF) in association with the South American Monsoon (SAM) and inter-annual variations are large (e.g., [
3,
26]). During the winter months cool and dry westerly flow is present along the Altiplano. During austral summer, warm, moist, easterly flow spans the central Andes, providing abundant moisture and instability at low levels [
5,
26,
27]. By way of these eastern humidity fluxes, rainfall on the Lake Titicaca Basin is about 550 mm during the rainy season and represents about 70% of the average annual rate (800 mm) [
28]. During the austral winter, westerly winds become the predominant flux, transporting dry air from the Pacific Ocean. The average precipitation during the dry eight months over the Lake Titicaca is about 250 mm. The annual precipitation over the Lake Poopó in the northern part of the basin is about 420 mm and, in the southern part, 270 mm [
29].
In the Altiplano, drought and frost are frequent, with consequences in yield reductions, leading to shortages of food production [
11]. Vizy and Cook found that rainfall variability over the central Andes is not directly controlled by moisture changes in the Amazon basin [
31]. Drought presents a decadal variation related to the Pacific Decadal Oscillation in Bolivia, with a higher frequency in the Altiplano, that is affected principally by the El Niño Southern Oscillation (ENSO) anomalies [
32]. Furthermore, due to the increase of evaporation, the Altiplano shows a trend towards drier conditions, and consequently an increase in the magnitude and duration of drought events.
Previous studies have shown a relationship between the Altiplano precipitation anomaly and the Southern Oscillation. Wet (dry) summers relate to cooling (warming) of the tropical troposphere and associated changes in the upper-level zonal flow during La Niña (El Niño) events [
3,
19,
21]. Garreaud
et al. found that the inter-annual variability in South America is manly influenced by ENSO [
33]. The same study determined anomalies during the ENSO phases with an annual decrease (increase) of 1 °C in temperature during La Niña (El Niño) events and higher (lower) precipitation in austral summer over the tropical Andes. Seiler
et al. investigated impacts of ENSO on temperature and precipitation from 1960 to 2009, with generally warmer temperatures leading to drier conditions with more variable precipitation during the austral summer (DJF) in the Andes [
34]. Thibeault
et al. showed that the La Niña causes dry (wet) anomalies in the central (western) Pacific [
19]. López-Moreno
et al. studied the inter-annual variability of air temperature from 1945 to 2012 over the Altiplano in Peru and Bolivia, concluding that the Southern Oscillation Index (SOI) and the maximum temperature have significant negative (positive) correlations during the austral summer (winter). Minimum temperature and SOI presented lower correlation coefficients [
35].
4. Water Resources Utilization
The fragile TDPS system is experiencing an increasing water demand from both Bolivia and Peru (
Figure 3; [
6]). The TDPS surface water represents the most important water source for the entire Altiplano. The possibilities for extended groundwater use are not well known at present. For instance water supply in Oruro city (with more than 500,000 inhabitants [
9]) comes mainly from groundwater. Pressure from the population is mainly related to water extraction for irrigation purposes rather than for mining. Equitable distribution between Bolivia and Peru regarding the TDPS system goes back to 1987 when the two countries signed a joint agreement on the Binational General Master Plan for the Development of the Integrated Region of the Lake Basin. In 1988, an agreement to maintain the TDPS as a unit was added. The PELT (Proyecto Especial del Lago Titicaca) project ran from 1989 to1993 and the outcome of this project is still the most important source of hydrological information. At the end of the project the two countries established the Authority of the Lake Titicaca (ALT-Autoridad para el Lago Titicaca; [
6]). However, since 1993, especially for the downstream of the Lake Titicaca, not many hydrological studies or increase in hydrological knowledge of the region have been achieved.
The PELT project defined a flow rate of 20 m
3/s to be equally shared between the two countries. The flow rate was established from water balance calculations for the upper part of the hydraulic network of TDPS just downstream of the Lake Titicaca [
38]. In addition, a hydrological study of the TDPS was delimited to the upstream of the Chuquiña discharge station (located on the Desaguadero, upstream of Lake Poopó) due to the lack of hydrological observations in the southern part of the TDPS. Moreover, the water supply capacity requires an updated analysis, considering possible climate and land use changes in the region.
Lake Titicaca in the upper part of TDPS is the most important reservoir of fresh water for the Altiplano with 56,270 km
2 of drainage area. The mean water level is 3810 m amsl with a corresponding surface area of 8400 km
2 [
39]. The lake is fed by ten main tributaries and direct rainfall on the lake mainly during the rainy season between March and April. From the total river inflow, five rivers contribute about 67% of inflow (Ramis, Coata, Ilave, Huancane, and Suches) [
40]. The only single outlet from the lake is the Desaguadero River, where discharge appears to have decreased during the last decades according to
Table 1. Generally, the maximum discharge occurs in April [
28,
41]. During April 1986 a water level peak was recorded at 3811.7 m amsl. A minimum of 3807.4 m amsl was recorded in 1996 (
Figure 4). The Titicaca drainage area receives the highest annual precipitation of the TDPS (from 800 to 1400 mm) [
42], and the evaporation rate from the lake is close to 1500 mm/year.
From Lake Titicaca via the Desaguadero River water is transported about 300 km to the shallow lakes of Poopó and Uru-Uru. Here, the average areal precipitation is about 350 mm/year [
29], concentrated to four months (DJFM). The strong seasonal rainfall defines the intermittent flows in the regional rivers. Pillco and Bengtsson found that the long-term Lake Poopó water level can be predicted using a simple regression equation with the Lake Titicaca water level (
Figure 4) [
29]. They also found that the Lake Poopó water storage depends on 65% of the Desaguadero River discharge. On the other hand, most of this discharge represents outflow from Lake Titicaca. The rest depends on the drainage area contribution between Titicaca and Poopó. According to
Figure 4, the water level fluctuation in the Lake Titicaca is greater as compared to the Lake Poopó in terms of seasonal and annual variation. The highest water level fluctuation in Titicaca occurred from 1980 to 1992. This was not noted in the Lake Poopó, due to rapid outflow to the southern basins. During the last century, only during 1986–1987 the entire TDPS system, including the salt flat areas, have displayed continuous discharge in all parts of the drainage basin.
Four main contributors define the discharge at the outlet of Desaguadero River. From upstream to downstream, the first is Lake Titicaca discharge (see
Figure 5) with the highest outflow in 1986, reaching 380 m
3/s. The second is the Desaguadero-Alto catchment with a drainage area of 3616 km
2. The third most important river contributor is Mauri, with an area of 9803 km
2 and with a mean discharge of 15 m
3/s at its outlet at Mauri-Calacoto. The fourth contributor is the Desaguadero-Bajo catchment upstream the Chuquiña discharge point, with a total area of 10,564 km
2. The mean discharge from these areas is 70 m
3/s.
Table 1 shows a comparison of flow using available data and comparing the mean annual discharge of the periods 1965–1989 and 1965–2012. From the relation Q
b/Q
a, it can be seen that the Lake Titicaca contribution to the Desaguadero River has experienced a major change of the average water flow for the period 1965–2012 (35.0 m
3/s) compared to the period 1965–1989 (51.3 m
3/s). This change shows an important need to update the water budget of the TDPS system, in order to redefine the water distribution in the TDPS system.
The Lake Poopó subsystem comprises two interconnected lakes, the Uru-Uru and the Poopó. Lake Poopó is remarkably shallow with a depth ranging from only 1.30 to 2.37 m. Thus, between wet and dry seasons the surface water area varies from 1000 to 2,500 km
2 [
45]. In addition, Pillco and Bengtsson found that the lake area reduces by more than 50% during the dry season as compared to the wet season [
45]. The lake has dried out at several occasions. The longest period of such an event occurred from 1994 to 1997. This situation destroyed the lake biomass and strongly affected fishermen’s income. Otherwise, the temporal Lake Uru Uru represents on average a surface area of about 280 km
2, a volume of 0.08 km
3, and a depth of 0.8 m when the Lake Poopó surface area is about 3011 km
2, with a volume close to 4 km
3. Conversely, Lake Uru-Uru dries out when Lake Poopó water level is less than 1.62 m.
5. Climate Change Scenarios
In recent years, several studies have tried to decipher climate change in the Andes (e.g., [
12,
46,
47,
48,
49,
50]). Regional Climate Models (e.g., [
50]) and Global Climate Models ([
46]) were used to predict the future climate in the region. Urrutia and Vuille noted that the climate in tropical South America at the end of the 21st century is likely to be dominated by a significant warming over the entire area, with temperatures increasing between 2 and 7 °C depending on the location and scenario considered [
50]. Rabatel
et al. concluded the precipitation has not displayed a significant and spatially-coherent trend in the tropical Andes since the middle of the 20th century [
47]. Bradley
et al. showed changes in mean annual air temperature projections between 1990–1999 and 2090–2099, using the A2 IPCC Special Report on Emissions Scenario (SRES) considered in AR4 (see [
51]), likely to increase by 4 to 5 °C along the tropical Andes, where the maximum temperatures are projected to occur over the high mountains [
52].
Seiler
et al. simulated precipitation and temperature changes over Bolivia using 35 GCMs (23 GCMs corresponding to CMIP3 contributing to AR4, see [
51]; and 12 GCMs corresponding to CMIP5 contributing to AR5, see [
53]) with IPCC SRESs: B1, A1B, A2, RCP4.5, and RCP8.5 [
46]. The study projected an increase in temperature (2.5–5.9 °C) and shortwave radiation (1% to 5%). The changes in annual precipitation in the Andes showed a decrease of 3% for CMIP3 while the CMIP5 GCMs projected an increase by 3%. The monthly precipitation in the Andes may decrease 9% according to CMIP3 GCMs, while CMIP5 forecasts an increase by 20% for the wet season. Furthermore, Escurra
et al. predicted a considerable decrease of precipitation (−5% to −25%), and evapotranspiration (−5% to −25%) in the south part of the Lake Titicaca Basin and a general trend toward less rainfall along the Altiplano based on CMI from 17 GCMs (SRES A2 projected for 2050) considered in AR4 [
12].
Regarding hydrological projections, the same authors studied climate change effects for rural water balances. The study concluded that the climate change projections (17 GCMs for A2 SRES by 2050) show a general decrease in the total annual renewable water in Bolivia. In addition, the projected precipitation and evapotranspiration may decrease significantly (−5% to −10%) in the southern part of the Lake Titicaca. Thus, the study indicated drier future conditions, but not excluding higher probability of flood occurrence. However, Seiler
et al. projected an increase of precipitation according to CMIP5 (12 GCMs for RCP4.5 and RCP8.5 SRES by 2100; see [
53]) in the Andes [
46]. As a result, the Altiplano could present wetter conditions and the runoff could also increase. However, the temperature has increased during the last decades over the Altiplano [
34,
54], and it is projected that this trend will continue in the future [
50,
51,
52]. Thus, in a warmer environment, the water losses through evapotranspiration could also increase. Climate modelling of the TDPS system presents similar results as for the Altiplano. Whereas climate models projections, in general, agree on a temperature increase over the area, there is significant discrepancy in the precipitation projections (e.g., [
13,
55,
56]). Moreover, the climate change analysis at basin scale in mountainous regions presents major challenges due to the complex topography and locally-distinct microclimates influencing environmental factors.
6. Climatic Effects on Socioeconomy
The Altiplano vulnerability to climate is reflected by the sensitivity to hazardous events. The recurrent extreme events in the region are droughts, floods, and frosts, with a significant socioeconomic and environmental impact (
Table 2; [
13]). The Southern Oscillation strongly affects the rainfall pattern over the Altiplano. Generally, El Niño events result in reduced rainfall, while La Niña (LN) shows the opposite effects, causing above-average precipitation. The EN events of 1982/83 and 1997/98 and LN events of 2007/08 affected thousands of people leading to millions of US$ economic losses [
56]. Droughts and floods have significant environmental, social, and economic impact on the TDPS system. In the 1990s, droughts caused economic losses estimated at US$ 216 million, while the great flood in 1986–1987 inundated 46,000 ha of the shores of Lake Titicaca and caused losses totaling US$ 125 million throughout the TDPS system. Both were due to imbalances caused by the decreasing storage capacity of the basins as a result of poor land use and inappropriate location of productive activities and infrastructure [
6]. The EN phenomenon is important for the Lake Poopó water levels. In 1983 the lake water level presented a fast decline, as well as from 1992 to 1996 [
29].
During the last decades the occurrence of extreme events in Bolivia is becoming more frequent. In 2006/2007 and 2009/2010 the EN episodes affected 562,000 and 459,000 people, with economic losses of US$ 443 million and US$ 236 million, respectively, and LN event in 2007/2008 caused US$ 273 million of economic losses in the country [
56].
7. Water Resources Management
In the Altiplano, an increasing population means a rising demand for the water supply for drinking water, water used in agriculture, and power generation [
52]. In addition, the under-developed water infrastructure (leaking pipes and illegal water distribution pipes) and low storage capacity reduce water availability [
57]. Furthermore, water sustainability and management in arid regions face new challenges, caused by climate change and glacier recession. The glacial meltwater in the Andes provides river flow during the dry season [
58]. Surrounding the TDPS system, the Occidental and Oriental Cordilleras represent numerous glaciers at an altitude higher than 5000 m amsl, (e.g., Palomani Grande (5330 m), Illampu (6383 m), Huayna Potosí (6094 m), and Illimani (6490 m) [
25]. The glacier meltwater is generally used in agriculture, water consumption, and electricity generation [
57]. Glaciers in the Andes have been retreating at an increasing rate since the late 1970s. The retreat of tropical glaciers in the Andes accelerated in the late 1970s, in the mid-1990s, and in the early 2000s [
47]. The magnitude of glacier mass loss is directly related to the size and elevation of the glacier, and those located below 5400 m amsl are the most vulnerable to loss of water [
47].
In the TDPS system, the demand for drinking water, irrigation, mining, industry, livestock, and others is higher than the available flow [
6]. Lake Titicaca’s main tributary is the Ramis River and the main outflow is the Desaguadero River [
8]. The inflow is mostly used to maintain the lake water level, itself, considering the high water volume loss through evaporation, reaching an annual mean of 1450 mm at Lake Titicaca and 1900 mm along the south of the TDPS system [
6]. In addition, the Desaguadero River shows high salinity and low water quality [
59]. The pollution of the TDPS system’s water resources is caused by wastewater and solid waste from Puno (to Lake Titicaca), Oruro (to Lake Uru Uru and Poopo), Juliaca (to Coata River), and El Alto (to Seco River) [
24]. This organic and bacteriological contamination causes eutrophication in the Puno bay. Wastewater and solid waste are frequently discharged into water bodies without treatment [
25]. Heavy metals from mining residues generate chemical pollution in Lake Poopó and Uru Uru, part of the Desaguadero River, and Coata River [
24]. Therefore, the water of the rivers is used for irrigation, but is not recommended for domestic consumption. In consequence, the population extracts groundwater and spring water to cover the water demand especially during the dry season. Inventories identified 900 wells throughout the TDPS system. Generally the well depth is less than 10 m, and the deepest is 110 m [
6].
Adaptation measures to climate change and variability involve water supply conservation and protection, improving water usage in agriculture, and implementation of water reservoirs [
52]. The physical adaptation should improve existing systems for management and distribution, with a designed technology that could be replicated in the Andean communities and self-run by local organizations [
57].
8. Research Needs
The lack of hydrological and climatological long-term data is the largest barrier for the research of the Altiplano basins. The records of the hydro-meteorological stations show large gaps. In addition, these stations are unevenly distributed, with higher station density around the Lake Titicaca and lower station density in the southern part of the TDPS system. Scientific publications mainly deal with the subject of large-scale climatology in the Altiplano and hydrological studies are concentrated the Lake Titicaca region in the northern part of the Altiplano. There is an important need to develop hydroclimatological studies related to water availability, management, quality, and supply in order to provide this information to policy-makers and local stakeholders. Improving the interaction and communication between all stakeholders could be possible way to achieve a better water management and information exchange. In consequence, the improvement of the hydrological and climatological knowledge could be achieved through teamwork, data-sharing, knowledge development, and communication between researchers, policy-makers, and local people.
To improve the understanding of hydrology and climate over the Altiplano basins, research investment is required across a broad range of disciplines, reducing uncertainties related to the physical and human-induced processes that are affected by the hydro-climatic system. This review demonstrates the continued need for high-quality data and observations, analysis of Earth system processes and changes, and modeling that increases hydrological understanding and climate change projections at different scales. Hydro-climatic research is also essential to improve the understanding of water use and land use, as well as impacts of climate change. Assessing the hydrology and climate requires understanding of the roles of the hydrologic cycle, water resources, environmental watershed sustainability, climate variability, and change that are driven by the hydro-climatic system.
Through research investments, it would be possible to install hydrological and climatological observation systems and collect much needed data. Other accessible source of information are remote sensing and reanalysis data, for hydro-climatological analysis and monitoring network. During previous years, remote sensing and GIS techniques have been used in hydrological assessment issues, such as water resource management, water quality, and hydrological modelling (e.g., [
60,
61,
62]). In addition, reanalysis data products could generate data sets, as the Tropical Rainfall Measuring Mission (TRMM) Multi-satellite Precipitation Analysis (TMPA) that produced almost two decades of precipitation data.
In addition, regionalization studies could develop hydrological models for estimating continuous streamflow used in transferring hydrological information from gauged to ungauged basins [
63]. On the other hand, groundwater is an important source of water supply in the highlands. As the demand for water increases, a better knowledge of groundwater resources is needed to manage and develop sustainable water management. In the TDPS system, fresh water is mainly supplied by aquifers (e.g., Oruro city). However, there is an important need to understand the groundwater characteristics, such as water quality and aquifer recharge. In addition, the wetlands, known as “bofedales” in the Andes, are also an important water reservoir that act as natural filters of water, improving its quality. The study of the hydro-climatological impact on these reservoirs also requires scientific research.
9. Summary and Conclusions
The TDPS is highly sensitive and vulnerable to climate variability and change impacts for its water availability. Changes in temperature and precipitation will significantly affect the hydrological cycle in the Andes. The climate change adaptation, however, faces political and financial barriers. Long-term solutions to regional water challenges require inter-disciplinary approaches between scientists and local stakeholders (e.g., [
57]). Climate variability and change impacts increase social and economic inequalities and affect people´s exposure to climatic hazards. There is evidence of recurrent droughts and floods that negatively affect important economic activities. There are already now negative impacts of rising temperature, increased variability, and weather extremes on crops and livestock of indigenous people in the Altiplano [
64].
The lack of observations and monitoring of climate systems and water supplies over the Andean region limit the effectiveness of water resources management [
57]. Additionally, the coarse spatial resolution of the present generation of GCMs limits the validity of climate model results in the Andes [
12]. Scarce data with high spatial and temporal variability represent a challenge to correctly simulate the hydrology of the Altiplano [
65]. Moreover, this simulations are concentrated in the northern part of the system. Considering this, the water distribution between Peru and Bolivia requires a water balance update, including the anthropogenic and climate change impacts. It is necessary to include the entire TDPS area for future hydrological studies, taking into account that the southern part has often been excluded.
Consequently, there is an important need to improve the understanding of water resources in the current and future climate over the TDPS system and to provide better information that can be used in improved decision-making. For this propose, improving the observation data network of the TDPS is required. In addition, it is possible to apply new techniques (e.g., remote sensing tools and data reanalysis), for developing hydrological and climatological research in data-scarce regions.


