Article

Time Series Analysis of Floods across the Niger River Basin

1
Potsdam Institute for Climate Impact Research, 14473 Potsdam, Germany
2
Agence du Bassin du Fleuve Niger (ABFN), Mali Republic
3
Institute of Ecology, Technical University of Berlin, Ernst-Reuter-Platz 1, 10587 Berlin, Germany
*
Author to whom correspondence should be addressed.
Water 2016, 8(4), 165; https://doi.org/10.3390/w8040165
Submission received: 7 November 2015 / Revised: 4 April 2016 / Accepted: 8 April 2016 / Published: 21 April 2016

Abstract

:
This study analyses the increasing number of catastrophic floods in the Niger River Basin, focusing on the relation between long term hydro-climatic variability and flood risk over the last 40 to 100 years. Time series for three subregions (Guinean, Sahelian, Benue) show a general consistency between the annual maximum discharge (AMAX) and climatic decadal patterns in West Africa regarding both trends and major changepoints. Variance analysis reveals rather stable AMAX distributions except for the Sahelian region, implying that the changes in flood behavior differ within the basin and affect mostly the dry Sahelian region. The timing of the floods within the year has changed only downstream of the Inner Niger Delta due to retention processes. The results of the hydro-climatic analysis generally correspond to the presented damage statistics on people affected by catastrophic floods. The damage statistics shows positive trends for the entire basin since the beginning in the 1980s, with the most extreme increase in the Middle Niger.

1. Introduction

In the last two decades, the occurrence of extensive catastrophic flooding has increased drastically in the Niger River Basin (NRB) [1,2,3,4]. Kundzewicz et al. [5] put the regional flooding, also for Africa, in a global perspective, mentioning that losses have increased greatly globally and regional assessments are needed. Tarhule [6] addressed the catastrophic flooding in the Sahelian region scientifically for the first time, calling the floods “the other Sahelian hazard”, alluding to the lesser significance of catastrophic floods in the face of the dominant water scarcity in the region. Since then, several studies have contributed to the discussion from different perspectives studying either climatic or hydrological time series or both for the entire West Africa or varying regions.
Paeth et al. [6] looked at the macro weather situation that led to the extreme flooding of 2007 and connected it to a La Niña event. Panthou et al. [1], Ozer et al. [7] and Lebel and Ali [8]detected changes in rainfall patterns in the region and an end of the Sahel drought at the beginning of the 1990s. Mahé et al. [9] analyzed rainfall time series in the Sahel until 2006 and found increasing trends since the 1990s. Okpara et al. [10] analyzed general rainfall discharge relations, however without considering data after 2002. The studies of Panthou et al. [11,12] analyzed changes in rainfall and heavy rainfall, concluding that there has been a recent increase in heavy precipitation. Due to the increase in heavy precipitation and flooding in the recent past, Casse et al. [13] analyzed satellite rainfall products in order to predict flood events of the Niger at Niamey. Jury [14] analyzed streamflow trends in Africa, including one station in the NRB (Niamey), and found an increase in streamflow that matched their general finding of a “return to wet conditions” in Africa in recent decades.
Tarhule et al. [15] analyzed the hydroclimatic variability between 1901 and 2006 in the NRB, and found a general changepoint in the year 1969, after which both rainfall and streamflow time series show a positive trend in the NRB, confirming the wetting trend. Pouyard et al. [16] described the spatial and temporal variability of the water balance in the region by analyzing the relation of rainfall and runoff in small to large catchments. Albergel et al. [17] found that due to surface processes, heavy rains cause more surface runoff during dry periods than during wet periods [16]. Several studies like Amogu et al. [18], Descroix et al. [3,19] and Mahé et al. [20,21] examined increasing river discharges in the Sahel and came to the conclusion that adverse land-use change and crusting of soils have led to an increase in surface runoff as the climate in the region tends to become drier. Descroix et al. [22] and Amogu et al. [2] also addressed this phenomenon, finding an increasing trend for streamflow of rivers in the Sahelian zone. Using modelling approaches, Aich et al. [23] and Séguis et al. [24] also found a strong influence of land use change effects on the flood trends in the region in addition to increasing rainfalls. Sighomnou et al. [25] backs up their findings and attributed the extreme flooding of 2012 to the aforementioned changes in land use and crusting for the region around Niamey. Another explanation for increasing flows in the Sahelian part of the Niger is introduced by Mamadou et al. [26]. They found that the runoff increase triggered a positive feedback, thus former endorheic ponds are more and more connected to the main river and contribute increasingly to the streamflow. The study of Tschakert et al. [27] summarized the discussion for floods in the Sahel and added the vulnerability perspective, concluding with a call “to lay to rest the desertification narrative (and) acquaint our minds to the possibility of both floods and droughts”. Whilst mean discharges have been evaluated extensively, the relation of rainfall trends and extreme flows in the region has been addressed for the first time by Nka et al. [28]. They compared time series of floods in West African with rainfall and vegetation indices and found mainly increasing trends for the Sahel with a correlation with rainfall but not with vegetation. For the NRB the role of climatic variability for the flood risk has not been addressed systematically; neither has the associated impact on people been systematically collected and quantitatively evaluated.
This study aims to contribute to this discussion with an analysis of the trends in flooding and relate these trends to the reported impacts of catastrophic flooding on the local population in the NRB. The specific objectives were a) to assess changes and trends of rainfall and annual maximum discharge (AMAX) over the last 40 to 100 years using changepoint and variance analysis methods, b) to detect changes in the timing of annual flood peaks, and c) to assess and relate damage statistics on the impacts of floods to the results of this flood analysis.
In order to take the regional heterogeneity of the NRB into account, we differentiate between a Guinean, a Sahelian and the Benue subcatchment according to their main source areas and data availability (Figure 1). Specific emphasis is put on the Sahelian sub-catchment in the Middle Niger, where two annual flood peaks occur (generally called the Guinean and Sahelian floods). The results are then discussed with a holistic view of the increasing flood risk, taking into account the changes in the hydroclimatic hazards, vulnerability and exposure.

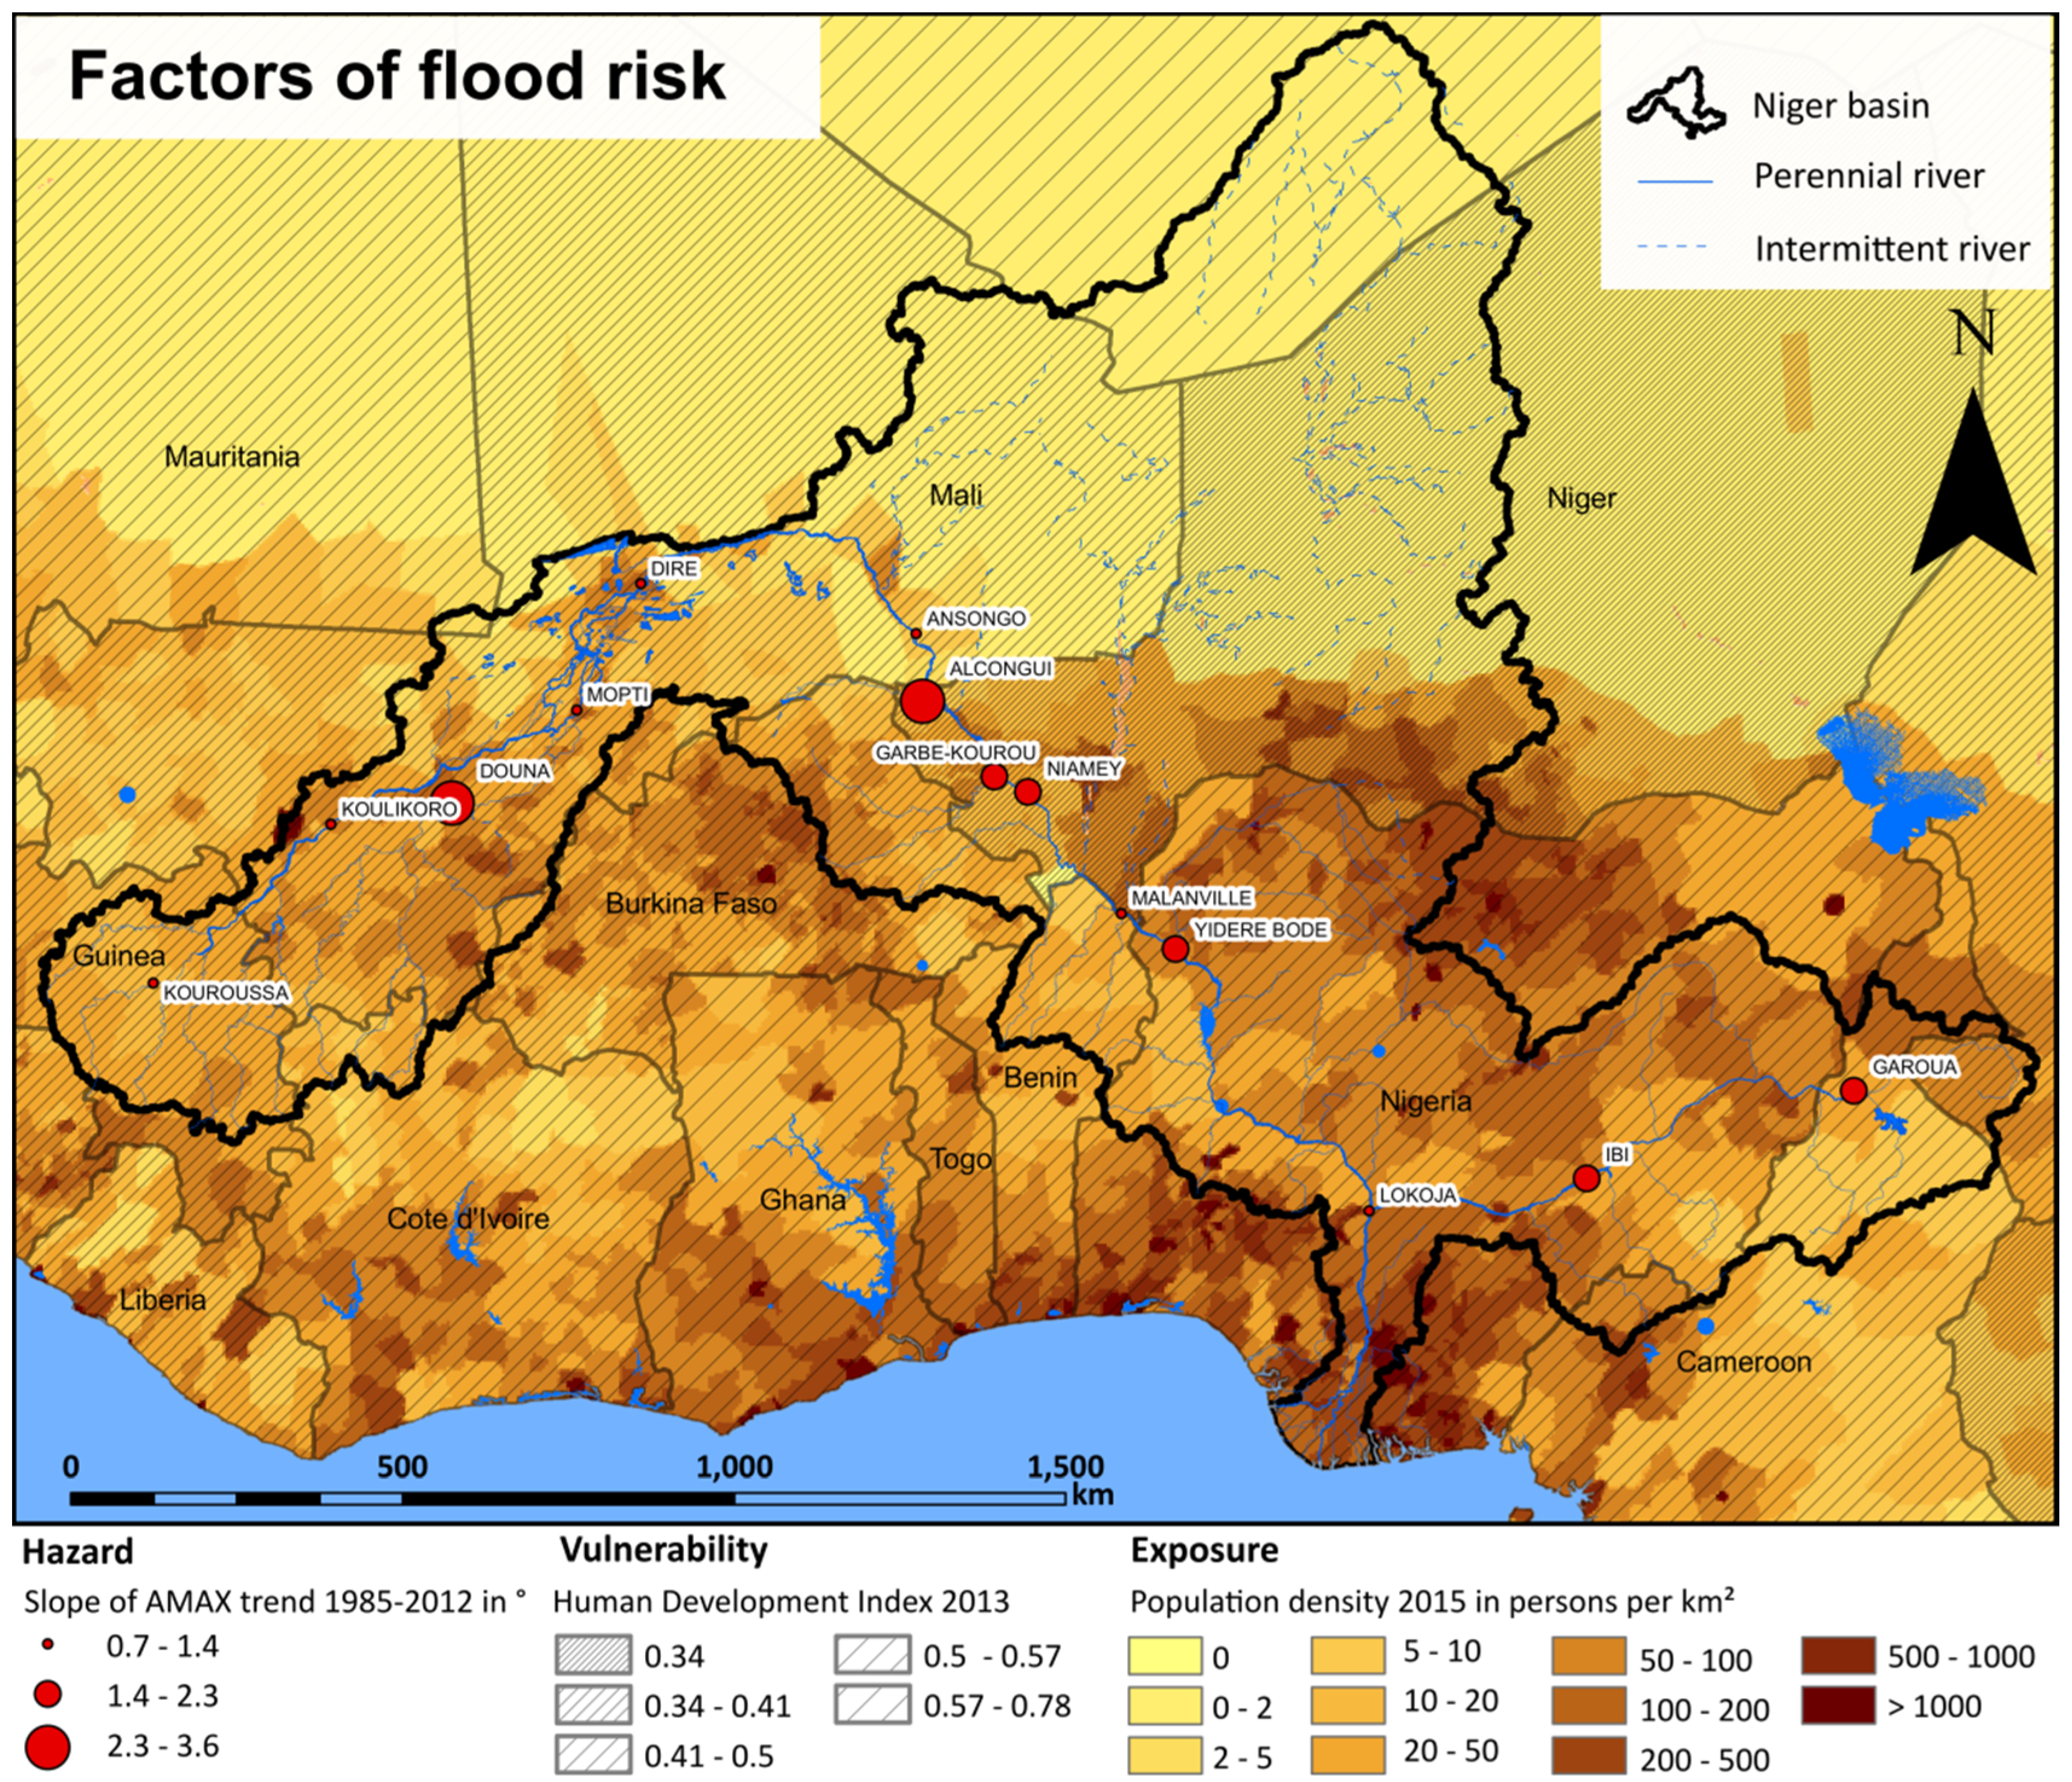
2. Niger River Basin

The NRB covers a total area of approximately 2,156,000 km², of which only approximately 1,270,000 km² contribute to the river discharge (Figure 1) [33]. The whole basin is spread over the territory of ten countries: Guinea, Côte d´Ivoire, Mali, Burkina Faso, Algeria, Benin, Niger, Chad, Cameroon and Nigeria [34]. It extends over different agro-climatic and hydrographic regions with individual topographic and drainage characteristics. The Niger runoff regime is affected by different types of reoccurring floods, which result from the geographic locations and characteristics of their main source areas. The first one is the Guinean Flood, which originates from the headwaters of the Niger in the low-altitude plateaus known as the Guinean highlands during the rainy season between July and November. The flood originating in the Guinean highlands experiences its peak usually around October. From here, the Niger and Bani Rivers flow into the Inner Niger Delta (IND). This vast wetland covers an area of approximately 36,000 km2 in central Mali and comprises lakes and floodplains that are regularly flooded with large annual variations. It influences the hydrological regime of the Niger significantly by flattening and slowing down the peak of the annual flood [35,36]. Due to the increasing distance and the buffering/retention effect of the wetlands, the flood peak leaves the IND with a delay of approximately three months. Therefore, it arrives in the middle section of the Niger around January, although rainfall in the Sahelian region falls at the same time as in the Guinean highlands. Thus, here the Guinean and Sahelian regimes generate a flood which can usually be clearly distinguished (an example is shown for the Niger at Niamey in Figure 2).
Most of the inflow in the middle section of the NRB comes from the plateaus of the right-bank subbasins. The vast subbasins to the left reach up into the central Sahara but only contribute a minor amount of inflow, and local tributaries are endorheic most of the time [2]. The annual peak during the rainy season (July to November) in the mid-section of the Niger downstream of the IND is called the “Red Flood” or “Sahelian Flood”, the latter of which will be used in this study for the second subregion. It is defined as subcatchment between Ansongo and Niamey. The third flood we focus on here is the flooding of the Benue River, which flows into the Niger at the Nigerian city of Lokoja. Coming from a high-altitude plateau, it is the largest tributary in terms of discharge and surpasses the Niger by about one-third at the confluence near Lokoja. This part of the NRB will henceforth be referred to as “Benue”. Finally, the Niger flows into the Gulf of Guinea, forming the Niger Delta, a flat region characterized by swamps and lagoons [37]. As no discharge data were available for the region between Yidere Bode and the confluence of the Benue, nor for the part after the confluence, these parts are not included in the analysis.
The population density in the NRB ranges from less than one person per km² in the deserts of the North to over 1000 in rural areas in Nigeria and Mali (Figure 3) [38]. Of the three regions on which this study focuses, Benue is the most densely populated, with many regions containing over 100 persons per km². Also in the areas along the Niger River, however, many regions in the Upper NRB and the Middle Niger have similar population densities with over 100 persons per km². The population growth rate in the countries of the NRB is extreme, ranging from 2% to 3.5% increase per year with the highest growth rate in the Sahelian countries of Mali and Niger [39].

3. Methodology

3.1. Data

3.1.1. Discharge, Precipitation Data and Atlantic Multidecadal Oscillation Data

Observed river discharge at a daily resolution was provided by the Global Runoff Data Centre [41] and the Niger Basin Authority (NBA) [42]. In order to analyze the annual maximum discharge time series (AMAX) of the different regions, the data of available gauges of the respective regions are grouped (Guinean: Kouroussa, Koulikoro, Douna, Mopti; Sahelian: Ansongo, Alcongui, Garbe-Kourou, Niamey; Benue: Garoua, Ibi, Lokoja; see Figure 1). A list with details on the availability of data for the different gauges is added to the Supplementary Material, Table S1. The Alcongui station at the Gorouol River and the Garbe-Kourou station at the Sirba River (Figure 1) were not available in their entirety from Global Runoff Data Center (GRDC) data, and the missing years have been read-out from hydrographs which are available from the “Niger-HYCOS” project [43]. The Sahelian peaks are limited to August through October and do not occur every year. Therefore, the AMAX time series for the Sahelian flood at these gauging stations along the Niger River have gaps for years where a separate peak could not be distinguished. Due to these gaps, the time series were not be analyzed statistically. Therefore, two gauging stations at Sahelian tributaries to the Niger River, which are not influenced by the Guinean flood and therefore have no gaps, were used for statistical analysis.
To analyze precipitation in the regions, reanalysis data from the WATCH Forcing data ERA 40 (WFD) [44] (1960 to 2001) and the WATCH Forcing data ERA interim (WFDEI) [45] (1979–2012) has been used. The precipitation variable of both data sets are derived from ERA40 [46] respectively ERA-Interim [47] reanalysis data and statistically corrected using observation data from the Global Precipitation Climatology Center (GPCC) [48,49]. They are sampled on a 0.5 × 0.5 grid. For the analysis of heavy precipitation, the 95th percentile of the daily precipitation is derived for each year. Both parameters of the reanalysis time series of WFD and WFDEI were validated with observed rainfall data. For each region the data was compared with GPCC gridded observation data (see Supplementary Material Figure S1) and additionally the data was compared to selected weather stations from the World Meteorological Office Global Summary of the Day (GSOD) [50] for all subregions (Bamako in Mali, Gao in Mali, Niamey in Niger, Maradi in Niger, and Garoua in Cameroon, Figure 1) (Supplementary Material to Section 3.1, Figure S2). For this exercise, the reanalysis data was interpolated via the inverse distance weighting method to the location of the stations. The comparison showed differences in absolute values for both parameters and intermediate deviations for single years or short periods. However, the general trends are similar and since only relative changes are analyzed in the study, both data sets are sufficient for the analysis.

3.1.2. Data on People Affected by Floods and Vulnerability

Data on people affected by catastrophic flooding were derived from three different sources: the NatCatService of the Munich Reinsurance Company [29], the EM-disaster database of the University of Leuven, Brussels [30] and the Global Active Archive of Large Flood Events of the Darthmouth flood observatory [31]. All data are based on media reviews of the respective organization and the collection of data from official sources. The latter archive derives additional information from remote sensing data. Only the period from 1979 to 2012 is considered for the analysis, since for this period consistent climatic reanalysis of WFDEI are available. All three sources provide additional information on whether the flood was a flash or river flood. The EM-disaster database distinguishes between “general river flood” and “flash flood”, the NatCatService and the dataset of the Darthmouth flood observatory between “flood” and “flash flood”. None of them are specific about the exact definition of flash flooding. Since the majority of the information is derived from the media, the discrimination between flood types is most probably not homogeneous; however, the rough differentiation is assumed to be correct. The data for West Africa is not systematically and uniformly collected. Some reports are on the village level whereas others are on the regional or even national level. The numbers of people affected by floods for the whole NRB or the individual regions have been summed up from the provincial or village level. For the Sahelian zone, most of the data was grouped and could not be distinguished from other regions in the Middle Niger. Therefore, the data also comprises the people affected for the whole Middle Niger until Yideré Bodé (Figure 1). Since most of the reports come from the media, the numbers reported are not verifiable and often differ substantially between sources. Another open question concerns a bias in media coverage, which might have increased during the last few decades and could result in an increasing number of flood reports. Tarhule [6] compared flood reports in the media for the region around Niamey with rainfall data. The study concluded that the quality of the environmental reporting of the newspapers is reasonable for the Niamey region from 1970 to 2000, allowing some confidence on data consistency over the last decades. Another aspect of the media coverage bias is the better coverage of urban areas compared to rural areas. However, as we do not analyze the spatial distribution of the flooding on the subregional scale, this bias does not affect the analyses directly. In sum, the data of people affected by floods are uncertain and should be interpreted with caution. Still, they are the best available source for damage data on catastrophic floods in West Africa, and even though their absolute numbers might be uncertain, the general trend of the combined three data sets are assumed to be reliable.
Data on population density, which is used as a proxy for exposure, was derived from the latest estimation of the Food and Agriculture Organization [38]. Since there is no specific flood vulnerability index for the region available, the Human Development Index ranking (HDI) [40] is used in this study as an indicator for the spatial distribution of vulnerability (as depicted in Figure 2). Data for the Human Development Index on country level as indicator was derived from the latest Human Development Index ranking of the United Nations for 2013 [40]. The index is based on the three key dimensions of human development, i.e., life expectancy, education, national income per capita. These factors are then aggregated into a composite index using the geometric mean. Since underdevelopment is closely linked to high vulnerability to disasters such as flooding the HDI can be seen as a proxy for flood vulnerability (e.g., [51]). However, it should interpreted with caution since it is no specific measure for flood vulnerability and has distinct shortcomings in this regard—for example, not representing inequalities in the nations.

3.2. Statistics

In order to visualize tendencies in the data more clearly, the local regression-fitting technique LOESS was used [52]. It is a nonparametric regression method that combines multiple regression models in a k-nearest-neighbor-based meta-model. When plotted, it generates a smooth curve through a set of data points (LOESS Curve).
For analyzing the relation between time series, Spearman's rank correlation was applied with ρ as rank coefficient of a size n and d i is the difference between the ranks
ρ = 1 6 d i 2 n ( n 2 1 )
This is a nonparametric measure of the statistical dependence between two variables and is widely used to assess monotonic relationships.
Monotonic linear trends in the precipitation, discharge and damage data were identified using the Mann-Kendall test [53]. This is a robust nonparametric test in which each element is compared with its successors and ranked as larger, equal or smaller. On this basis, it is possible to test the statistical significance of rejecting the null hypothesis (for all tests α = 0.05). The linear trend was estimated using the Theil-Sen approach [54,55]. It computes the slope for all pairs of the ordinal time points of a time series and then used the median of these slopes as an estimate of the complete slope. Since serial independence is a requirement of the Mann-Kendall test, we checked beforehand for autocorrelations in all precipitation and hydrologic time series using the Durbin-Watson statistic test [56,57]. If an autocorrelation of the first order was found, trend-free pre-whitening was applied according to the method proposed by Yue et al. [58] First, the trend estimated with the Theil-Sen approach was removed from the time series. Then, the first-order autocorrelation coefficient was calculated and subtracted from the time series. Finally, the trend was added back to the autocorrelation data and the Mann-Kendall test was applied in order to test for its significance.

3.2.1. Changepoint Identification

Since the West African climate is strongly dominated by a decadal pattern (e.g., [59,60]) changepoints are identified in order to see whether the AMAX follows this decadal pattern as well. For changepoint analysis, the cumulative sums method given by Page [61] is a common approach. Combined with an algorithm to minimize the cost Function (1), it is able to detect multiple changepoints [62]:
i = 1 m + 1 [ C ( Y ( t i 1 + 1 ) : t i ) ] + β f ( m )
C is the cost function of the time series segment Y ( t i 1 + 1 ) : t i and β f ( m ) and is the penalty function. The cost function relates to the cost of segmentation. Different algorithms exist to minimize this function, and for this study the segmented neighborhood (SN) method of Auger and Lawrence [63] is appropriate because it is an exact approach and the datasets are relatively small so that the generally high computational cost of this method is acceptable. The cost functions for all possible segments are iteratively calculated. By that means, SN is able to compute the segments; however, it does not provide information about the number of segments which would be identical with the number of observations without restrictions. In order to prevent this overfitting, the penalty function was introduced. In this study, we used Akaike's Information Criterion (AIC) [64]:
A I C = 2 k 2 ln ( L )
where k is the number of parameters in the model and L is the maximized value of the likelihood function.

3.2.2. Non-Stationary Generalized Extreme Value Distribution

In order to detect non-linear and non-stationary trends in the AMAX time series, non-stationary Generalized Extreme value models (NSGEV) [65] have been used. This method has proven to be an effective tool, not only to detect trends in the flood average, but also in flood variability (e.g., [66,67]). The method is described in detail by Delgado et al. [66] and is based on the generalized extreme value function (GEV), which is cumulatively written as:
F ( x ) =   { e x p [ ( 1 ξ σ ( x μ ) ) 1 ξ ]   i f   ξ 0 e x p [ e x p ( x μ σ ) ]   i f   ξ = 0
with μ as the location parameter, σ as the scale parameter and ξ as the shape parameter. This cumulative distribution is then fitted systematically with different combinations of linear, second- and third-degree time-dependent parameters, but only for the location and scale parameters. These time-dependent parameters were then inserted into a maximum likelihood function.
L =   t = 1 n σ ( t ) 1   e x p [ ( 1 ξ x ( t ) μ ( t ) σ ( t ) ) ]
Instead of the different parameters, the linear or second- or third-degree terms were inserted into the likelihood function. In order to identify the parameter setting which best fits with the data, a likelihood deviance statistic was applied. By this means, it could be tested whether the model of higher complexity from stationary to third-degree is an improvement, and whether this improvement is not just obtained by chance but is instead significant. So, each model M 1 was tested against the simpler model   M 0 . The deviance statistic of the models M 0 M 1 is defined as
D = 2 { 1 ( M 1 )   0 ( M 0 ) }
where 1 ( M 1 ) and 0 ( M 0 ) are the maximized log-likelihoods for the models. The distribution D is asymptotic, and its degree of fit can be tested with a Chi-square test ( χ k 2 ). The degrees of freedom k express the difference in dimensionality between   M 0 and M 1 . So, larger values of D suggest that model M 1 explains the variation in the data better than M 0 and is therewith accepted as the NSGEV distribution.

3.2.3. Wavelet Analysis of Annual Maximum Discharge Time Series

In order to see if the results of the NSGEV analysis are in line with general behavior of the variance/frequency of the AMAX time series, a wavelet power spectrum [68] is applied. This can be described as a correlation coefficient between a dataset and a given function. This function slides over the dataset and is scaled to account for different frequencies. In our case, we used the Morlet function, a complex nonorthogonal function which is commonly used for hydrographical time series (e.g., [66]). The wavelet analysis is a powerful tool used to show changes in the frequency over time, and indicates whether trends exist in the variance of the time series. The wavelet coefficient is symbolized with specific colors. Changes in the coefficient between the Morlet function and the time series are therefore visible by a changing color patterns on the time axis for a certain period (year). Changing colors on a certain period are therefore related to changes in variance.

3.2.4. Periods and Time Series Analyzed

With regard to periods for the analysis, the longest possible period was always selected. For the changepoint analysis, the analysis of the shift in timing of AMAX and the NSGEV probability distributions, only AMAX data is needed and therefore the complete period of available data is used (changepoint and shift analysis: Guinean 1907–2012, Sahelian 1956–2012, Benue: 1970–2012. For the NSGEV, an analysis of the mean for all stations in one subregion might balance out changes in the frequency, the most complete time series for each subregion was selected for the trend detection. For the Guinean region, Kouroussa was selected because the flow is not influenced by the IND. For the Benue region, no time series was long enough for the analysis. In order to avoid the complex distributions of the whole time series that change their directions several times, the analysis was limited to the period after the changepoint around 1970 which was identified by the changepoint analysis in all regions and also by Tarhule et al. [15]. For the comparison of trends of AMAX, annual precipitation and heavy precipitation, the period from 1979–2012 is used since the used WFDEI data is available only for this period and due to the absolute differences of the data set, it is not possible to use WFD and WFDEI complementarily.

4. Results

4.1. Analysis of Long-Term Dynamics of Rainfall and Annual Flood Peaks

4.1.1. Analysis of Trends of Rainfall and Annual Flood Peaks

Considering a longer time period (although with incomplete data records), Figure 4 depicts the rainfall values and AMAX values of all available years and all single investigated stations of the three regions. The precipitation from 1960 to 2001 from the Watch Forcing Data (WFD) and from 1979 to 2012 from the Watch Forcing Data ERA Interim (WFDEI) show the same pattern in the three regions of the Niger: the mean annual rainfall decreases until the mid-1980s up to −10% and again increases afterwards by around 10%. The anomalies in the Sahelian region are with more than +/− 30% the most distinct ones.
The longest times series of the Guinean region (1907–2012) shows an increase of AMAX from 1910 to the 1950s, a decrease of AMAX until the mid 1980s for the last 35 years. AMAX of the current period are generally smaller than the AMAX values which were reached in the peak period of the 1950s. The shorter time series from Benue (1970–2012) shows a decrease of AMAX until the mid 1980s, followed by an increase. All AMAX, annual precipitation and additionally heavy precipitation (95th percentile) time series have been tested for trends for the time period 1979–2012 and all showed significant increases (α = 0.05) (see Figure S3 in the Supplementary Material to Section 4.1.1). In addition heavy precipitation and annual precipitation are significantly correlated with AMAX in each region (Table 1).
The AMAX time series of the Sahelian region (1950–2012) shows a decrease until the 1970s and a continuous increase since then, which is not in accordance with the rainfall trends. For the Sahelian Zone, this effect of increasing discharge despite decreasing rainfall is called the “Sahelian Paradox” and depicted in detail in Figure 5. The evolution of AMAX for both flood peaks at Niamey is plotted in relation to the annual precipitation in the corresponding source area. For the Sahelian flow peak the mean of the AMAX time series of Garbe-Kourou and Alcongui are additionally depicted since for the Niamey time series it is not possible to identify the peak of the Sahelian flood (see Section 3.1.1). Heavy precipitation is plotted for the Sahelian region only because the source area for the Guinean peak is located in the Guinean highlands and approximately 1500 km away from the gauge in Niamey, where these events do not have a noticeable effect. The positive trend in the AMAX of the Sahelian peak started already in the 1970s. In contrast, the related rainfall data shows a further decrease and then stabilization in annual precipitation until the middle of the 1980s. The data for heavy precipitation in the region show similar trends and minima to annual precipitation. For the Guinean peak the evolution of the AMAX series corresponds to the annual precipitation.

4.1.2. Analysis of Changepoints of Annual Flood Peaks

Changepoint analysis was carried out to assess if the changes of AMAX are related to the longer-term climatic pattern of West Africa. In the literature, three main climatic periods are commonly distinguished for the second half of the 20th century in West Africa or particularly the Sahel region [7,8]. The first period during the 1950s and 1960s was above-average wet and followed by a dry period during the 1970s and 1980s. During the 1990s, the rainfalls increased again. Corresponding changepoints were detected for the AMAX series of all three regions (Figure 4); for the longer time series in Guinean region, a corresponding changepoint was detected before the 1950s. For the Guinean and the Sahelian a changepoint can be detected at the end of the 1970s. In the Benue, the time series only starts in the 1970s but its changepoint corresponds with the beginning of the third period in the 1990s. This last change is also reflected by the changepoints of the Guinean and the Sahelian region. This correspondence shows that the identified periods of higher and lower AMAX are roughly consistent with the West African decadal pattern.

4.1.3. Analysis of Changes in the Variance of Annual Flood Peaks

In contrast to the trend analysis, the AMAX time series have been analyzed using non-stationary generalized extreme value functions (NSGEV) in Figure 6, in order to see if there are changes in their variability. For the Guinean region, a model with a constant scale parameter but a third-degree location parameter has the highest value in the Chi-square test and is therefore the most suitable for explaining the distribution of probabilities for the AMAX time series. The curve changed from higher (approx. 1200 m³·s−1) discharge in 1969 to lower (approx. 500 m³·s−1) discharges in the 1970s and 1980s, and then half-way back up (approx. 800 m³·s−1) by 2012. This implies that the frequency of the AMAX in the Guinean subregion changed rather linearly.
In contrast, the time series of the Sahelian tributaries Gorouol (Alcongui) and Sirba (Garbe-Kourou) can be explained with the best model fit by second degree location parameters and linear scale parameters. The NSGEV for these time series show not only the same characteristics but also similar probability values, which adds confidence to the result. For both stations, the peak moved from approximately 150 m³·s−1 to 300 m³·s−1, with an increasing rate at the end. The distributions of both of the latter stations become linearly flatter over time, which implies that the probability of the highest peak is decreasing but the probabilities of distinctly higher or distinctly lower discharges are increasing. In addition, the peak of the distribution is moving to more discharge with increasing intervals over time, implying an exponential increase.
In order to verify the results of the NSGEV, wavelet power spectra are applied to the same time series (Figure S4, Supplementary Material). For the Guinean time series wavelet, there is no significant change in variance during the last four decades. This supports the finding that no changes in variability occurred in the AMAX of this region, but only linear trends for the flood magnitude. The wavelet analysis for the time series of Garbe-Kourou also confirms the findings of the NSGEV. There is a change in frequency during the 1970s and 1980s and a return to the patterns of the 1950s and 1960s afterwards. This return to wet conditions is reflected in the change in probability of the NSGEV for this station beginning in 1969 and lasting until 2012. The results show that only in the dry catchments of the Middle Niger can a significant change of the variability towards more extreme AMAX be detected.

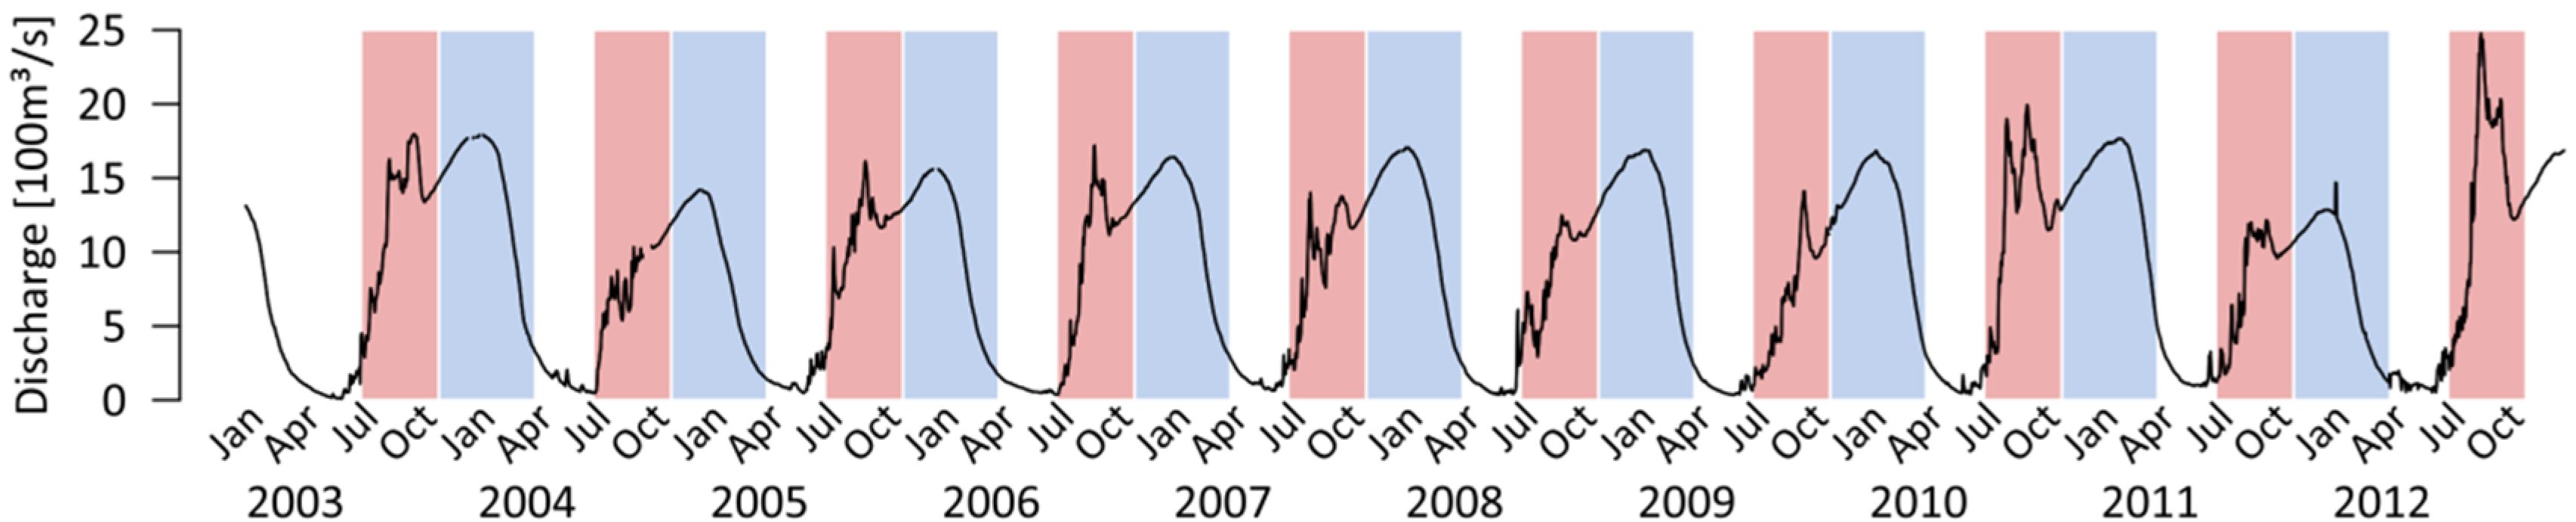
4.2. Analysis of Changes in the Timing of Annual Flood Peaks

The temporal occurrence of AMAX (day of the year) was analyzed for all regions. No significant trend could be detected except for the stations downstream of the IND (Figure 7). Here, AMAX timing of the Guinean flood shifted from February/March in the 1950s and 1960s to December/January in the 1970 to 1980s, and since then occurs again slightly later during January/February (see e.g., for the Malanville station in Figure 7). Due to the absence of temporal shift in other parts, the temporal shift of AMAX downstream of the IND is very unlikely to be a result of shifts in the rainfall regime, but may be explained by retention processes within the IND: water from the Guinean subregion accumulates in the delta and only a limited amount can pass through its outlet near Diré at any time. In the time periods of generally lower AMAX (as e.g., during the 1980s to 1990s), the floods reached the downstream stations considerably earlier in the year, whereas higher AMAX values as observed in the 1950s or 2010 resulted in a delay of the AMAX at gauging stations affected by the retention processes of the IND.
In summary, the timing of AMAX for the period 1910–2012 changes for the stations downstream of the IND where the Guinean flood occurs and depends on the total amount of water stored in the Delta.

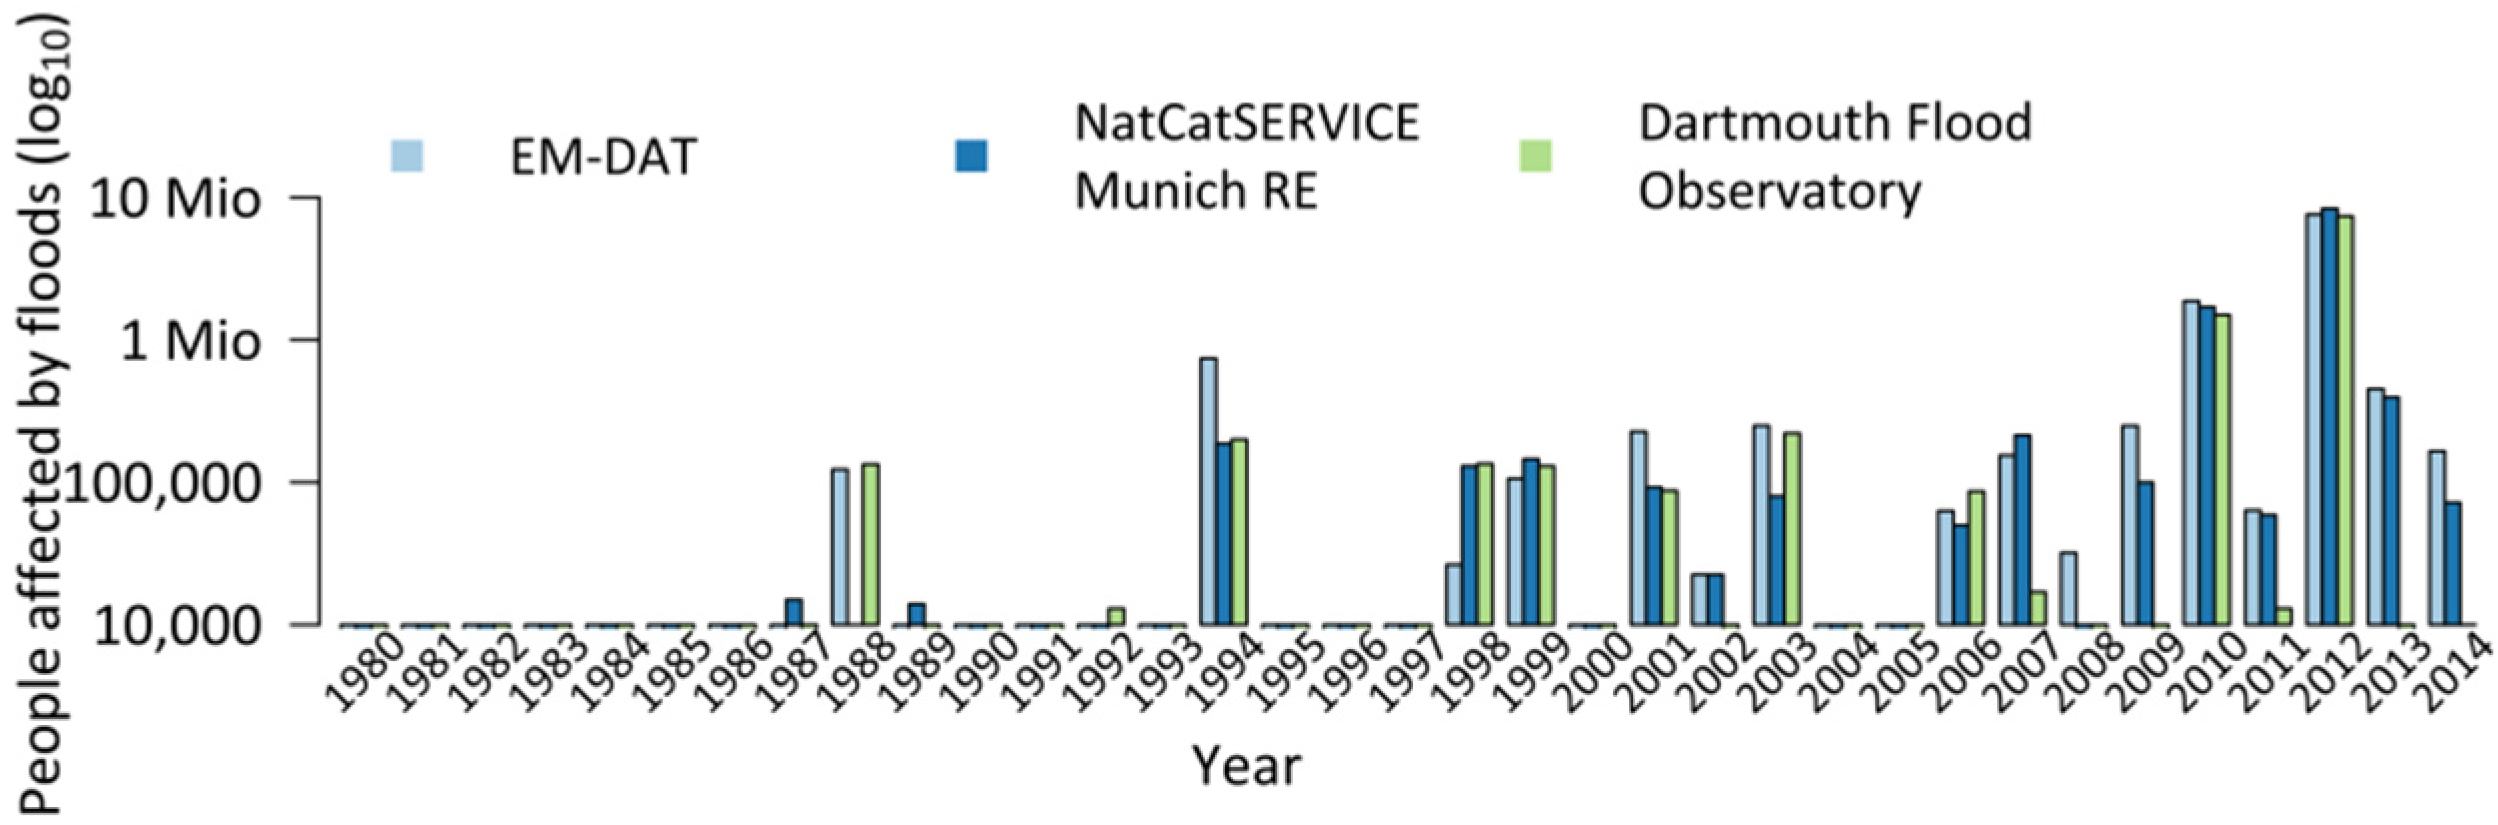
4.3. Analysis of Damage Statistics

The locations with the largest number of catastrophic floods between 1980 and 2012 were reported along the main stem of the Niger River, e.g., around the cities of Bamako, Niamey, Maradi and in the upper Benue, while they were less frequent in the Delta. The number of people affected by catastrophic floods in the NRB per year for the period from 1980 to 2014 is displayed in Figure 8. The differences between the numbers for the three employed sources (see Section 3.1.2) is small for most of the years, though for some years at least one source has strong underestimations, e.g., the NatCatService for 1988 or the Darthmouth Flood Observatory data for 2009 and 2011. The increase in frequency of hazardous floods since the new millennium is striking. During the 1980s, around 120,000 people were affected by catastrophic flooding according to the reports, over 500,000 in the 1990s, and well over 10 million from 2000 until 2012.
In Figure 1, the reported locations of catastrophic floods are plotted and flash floods were separated from areal and river floods, since both have different underlying mechanisms according to the differentiation of the three data sources (as detailed in Section 3.1.2). The majority of the floods are river and areal floods and only a small proportion of the catastrophic floods are flash floods. For the trend and correlation analysis, only the data on people affected by river floods were considered. Figure 1 also shows that floods in the NRB were relatively homogeneously distributed along the river and its main tributaries.
For the individual regions, the number of people affected by catastrophic floods is plotted in Figure 4. Please note that it was not possible to distinguish the numbers of the Sahelian region from the other parts of the Middle Niger in the data sources because information was, in many cases, not clearly localized in the data sources (see Section 3.1.2). The scale is logarithmic, but a distinct positive trend is nevertheless visible for the Sahelian and Benue regions. It is not visible for the Guinean region, but in all three regions there is a statistically significant linear trend when tested with the Mann-Kendall test.
The relation between the increase in flood magnitude and the number of people affected by floods was tested with a correlation test (Figure 9). For the Sahelian and Benue regions it shows a strong correlation between AMAX and the number of people affected (Spearman’s ρ: 0.67, 0.63). For the Guinean region, the correlation is still moderate at ρ = 0.37. Cases with high AMAX anomalies and no or few people affected might be explained either by missing reports, slowly rising water that allowed the population to prepare for the flood prevent damage or strong regional differences in AMAX levels.

5. Discussion

The presented results related to research question on the long term statistics of rainfall and AMAX dynamics showed that the previously established high variability of rainfall and mean discharge also holds true for large floods, as was shown for the AMAX time series; the results also revealed a remarkably strong regional heterogeneity for the latter of the three.
The period from approximately 1970 to approximately 1990 was, in general, exceptionally dry in West Africa. In the Sahelian and Benue regions, the mean rainfall during this period was approximately 35% lower compared to the period before 1970. This dry period is followed by a return to wetter conditions in West Africa (e.g., [14,15]). During the return to a wet phase, the annual precipitation up to 2012 did not exceed values that had been measured during the 1960s. The trends for AMAX are mainly consistent with the rainfall trends and the correlation between precipitation and AMAX is strong for all regions (Table 1). The variation of AMAX and the detected changepoints during the analyzed period of up to 100 years follow the decadal climatic pattern in West Africa. However, the magnitude of the trends is only consistent for the Guinean region, where the levels of AMAX do not exceed values from the 1950s and 1960s. For the Benue subregion, there is only one changepoint detectable and therefore the antecedent periods before 1970 cannot be compared.
In the Sahelian region, however, the AMAX levels of recent decades exceed the levels of the 1960s. Particularly remarkable is the increase in frequency and magnitude of Sahelian flooding, which was also found by Descroix et al. [3]. Even during the wet 1960s, the Guinean flood peak was always higher than the Sahelian peak. Starting in 1980, the Sahelian flood was higher than the Guinean in nine of the years. In Niamey, the flood peak of 2012 was the highest peak since the beginning of the records in 1929. This particular case of the Sahelian region is also reflected by the probability distribution. While the scale of the distribution stays constant for the Guinean region, it causes a flattening of the curve in the Sahelian region, implying that rare floods with a certain return period at the tail of the curve are more extreme during wet periods. Inaccuracies in the precipitation data as explanation for this inconsistency are unlikely, since the data has shown during the validation that general trends are robust. The most likely explanation for the more strongly increasing AMAX compared to precipitation is therefore a stronger effect of land-use change compared to other regions [23]. This effect was found by several detailed studies on effects of land-use changes for the Sahel region [3,69,70,71]. However, the role of the groundwater in the region is also very complex and should be addressed systematically in order to see how it influences high flows [72,73].
The identified “Sahel Paradox” was first described by Albergel [17] and later addressed by several studies [2,20,21,22,74]. The systematic detection of the Sahelian peak supports the finding of the mentioned studies. The AMAX regime in the middle section of the Niger has changed distinctively over the past 30 years. Since the minima of the AMAX time series is distinctly before the minima of precipitation and heavy precipitation, it cannot explain the paradox of increasing discharge. However, from the end of the 1980s, all three trends show the same direction and, hence, there is currently no more paradox, even if the underlying process might still be continuing. For the time series of the Guinean flood peak, the minima for AMAX and precipitation are located in the middle of the 1980s, i.e., analogues to the precipitation and the regime can therefore likely be explained with the precipitation regime.
The results for research question on temporal shifts in the AMAX revealed a shift of the AMAX timing of the Guinean flood downstream of the IND. This shift is very likely not related to the timing of the rainfall regime, but rather to the amount of rainfall and a related retention process in the IND. The IND is responsible for a basin effect, where large Guinean floods occur up to 3 months later than small floods. The trend of the timing of the Guinean flood downstream of the IND reflects therefore the long-term trend of AMAX magnitudes.
The answer on the research question on the links between the increasing AMAX trends and the impact of catastrophic floods is complex. The results of the correlation analysis between AMAX and the people affected by floods, but also the visual comparison of trends of Figure 4 suggest a strong effect of the increasing flood magnitudes on the flood risk in the NRB. In the Guinean region only, the correlation is only moderate. However, the fact that the number of people affected by floods seems to have increased exponentially cannot be explained by the flood magnitudes. Therefore other factors influencing the flood risk, i.e., exposure and vulnerability [75,76,77,78] have to be taken into account.
In West Africa, the population has multiplied by a factor of approximately 2.5 since 1980 [79]; the increase in population is matching the trend of people affected by floods for the same period. For all countries in the NRB, the population growth rate is over 2%, and for the Sahelian countries of Mali and Niger even more than 3% [39]. In the Sahelian subbasin, where the strongest increasing trend in people affected by floods occurs, the population increase is also about one percentage point greater compared to the other subregions; Figure 2 shows the spatial distribution of population density for 2015 [39].
Increasing vulnerability despite ongoing development in the region was found by Di Baldassarre et al. [80]. They showed that a kind of “levee-effect” increased vulnerability in the Niger basin, even absent the construction of levees. The “levee-effect” describes the fact that levees or other flood protections may actually increase flood losses because they encourage new development and settlement in the floodplain. When man-made flood protections fail in an extremely high flood, damages are higher than they would have been, had the protective measures not been installed [81]. In the Niger, the present research indicates that the extreme natural variability with its fluctuation of wet and dry periods has caused this effect. During the dry 1970s and 1980s, people settled in flood plains and other places that have traditionally been avoided for settlement due to flood risk and therefore increase their vulnerability [27]. Figure 2 provides an overview on current factors of flood risk in the NRB, taking into account the three described dimensions of flood risk hazard (changes in AMAX), vulnerability (HDI) and exposure (population density).

6. Conclusions

In all regions analyzed in the study, the number of people affected by catastrophic floods increased drastically. This increase can only partly be explained by increasing flood magnitudes and frequencies. Our results denote that the increasing flood risk in the NRB is caused by flood attributes such as intensity and frequency but not solely. Most likely an increase of exposure and vulnerability especially in the Middle Niger also contributes to the increase of flood risk. The substantial increase in inhabitants affected by floods in the Middle Niger is the result of the greatest increase in all of these factors in this subregion. Our statistical analysis confirms previous studies regarding a general return to wet conditions since the end of the 1980s and, moreover, detects an increase in annual maximum discharge (AMAX) in the NRB for the same time period. However, the relationship between the climatic drivers and discharge is complex and varies significantly between the regions of the basin. Several studies have shown that the changes in precipitation patterns in the region are very heterogeneous (e.g., [1,8]). This holds also for the sensitivity of the catchments in terms of changes. The dry Sahelian region is more sensitive to changes compared to the Guinean or Benue regions. The AMAX amplitude for dry (e.g., 1970s–1980s) and wet (e.g., 1950s–1960s, 2000s–2012) periods differ substantially between the regions, and the discharge regime of the Sahelian catchment shows the strongest reactions compared to the wetter regions. Only in the dry Sahelian part, the AMAX variability increases significantly during wet periods, and more extreme flood magnitudes become more probable. In order to account for dynamics of the entire basin and include climate change induced flood risk, detailed modelling studies on a subregional level are a prerequisite in order to project future flood risks in the NRB and discuss uncertainties [82]. Such an effort should include land-use change, population density and vulnerability, all of which are very likely strong factors for flood risk in the basin.
Other implications can be derived from the decadal AMAX patterns. Since West Africa is currently experiencing a period of relative wetness, the likelihood of above average AMAX in the coming years remains high, taking into account the consistent decadal patterns. This implies that short-term responses are needed in order to halt the trend of increasing flood risk, especially in the Middle Niger. A promising way includes the ongoing research activities on short- and medium-term hydrological forecasting systems, which should be connected with a flexible early-warning system. In the longer run, the existing action plan of the NBA should be implemented, which includes, for example, more dams for flood control. These measures on the supranational level need to be accompanied by complementary actions from the national to the household level.

Supplementary Materials

The following are available online at www.mdpi.com/2073-4441/8/4/165/s1. Table S1 and Figures S1–S4.

Acknowledgments

We thank the IMPACT2C project for financing this study and the Niger Basin Authority (NBA) for providing data. In addition we thank Munich RE, the Centre for Research on the Epidemiology of Disasters (CRED) of the University of Leuven and the Darthmouth Flood Observatory for sharing their data on people affected by floods.

Author Contributions

Valentin Aich, Bakary Koné, Eva N. Paton and Fred Hattermann conceived wrote the paper. Valentin Aich analyzed the data.

Conflicts of Interest

The authors declare no conflict of interest.

References

  1. Panthou, G.; Vischel, T.; Lebel, T. Recent trends in the regime of extreme rainfall in the Central Sahel. Int. J. Climatol. 2014, 34, 3998–4006. [Google Scholar] [CrossRef]
  2. Amogu, O.; Descroix, L.; Yéro, K.S.; Le Breton, E.; Mamadou, I.; Ali, A.; Vischel, T.; Bader, J.-C.; Moussa, I.B.; Gautier, E.; et al. Increasing River Flows in the Sahel? Water 2010, 2, 170–199. [Google Scholar] [CrossRef]
  3. Descroix, L.; Genthon, P.; Amogu, O.; Rajot, J.-L.; Sighomnou, D.; Vauclin, M. Change in Sahelian Rivers hydrograph: The case of recent red floods of the Niger River in the Niamey region. Glob. Planet. Chang. 2012, 98–99, 18–30. [Google Scholar] [CrossRef]
  4. Mahé, G.; Lienou, G.; Descroix, L.; Bamba, F.; Paturel, J.E.; Laraque, A.; Meddi, M.; Habaieb, H.; Adeaga, O.; Dieulin, C.; et al. The rivers of Africa: Witness of climate change and human impact on the environment. Hydrol. Process. 2013, 27, 2105–2114. [Google Scholar] [CrossRef]
  5. Kundzewicz, Z.W.; Kanae, S.; Seneviratne, S.I.; Handmer, J.; Nicholls, N.; Peduzzi, P.; Mechler, R.; Bouwer, L.M.; Arnell, N.; Mach, K.; et al. Flood risk and climate change: global and regional perspectives. Hydrol. Sci. J. 2013, 59, 1–28. [Google Scholar] [CrossRef]
  6. Paeth, H.; Fink, A. H.; Pohle, S.; Keis, F.; Mächel, H.; Samimi, C. Meteorological characteristics and potential causes of the 2007 flood in sub-Saharan Africa. Int. J. Climatol. 2011, 31, 1908–1926. [Google Scholar] [CrossRef]
  7. Ozer, P.; Hountondji, Y.; Manzo, O.L. Evolution des caractéristiques pluviométriques dans l’est du Niger de 1940 a 2007. Geo-Eco-Trop 2009, 33, 11–30. [Google Scholar]
  8. Lebel, T.; Ali, A. Recent trends in the Central and Western Sahel rainfall regime (1990–2007). J. Hydrol. 2009, 375, 52–64. [Google Scholar] [CrossRef]
  9. Mahé, G.; Paturel, J.E. 1896–2006 Sahelian annual rainfall variability and runoff increase of Sahelian Rivers. Comptes Rendus Geosci. 2009, 341, 538–546. [Google Scholar] [CrossRef]
  10. Okpara, J.N.; Tarhule, A.A.; Perumal, M. Study of Climate Change in Niger River Basin, West Africa: Reality Not a Myth. In Climate Change—Realities, Impact over Ice Cap, Sea leval and Risks; Singh, B.R., Ed.; InTech: Rijeka, Croatia, 2013. [Google Scholar]
  11. Panthou, G.; Vischel, T.; Lebel, T.; Blanchet, J.; Quantin, G.; Ali, A. Extreme rainfall in West Africa: A regional modeling. Water Resour. Res. 2012, 48. [Google Scholar] [CrossRef]
  12. Panthou, G.; Vischel, T.; Lebel, T.; Quantin, G.; Pugin, A.-C.F.; Blanchet, J.; Ali, A. From pointwise testing to a regional vision: An integrated statistical approach to detect nonstationarity in extreme daily rainfall. Application to the Sahelian region. J. Geophys. Res. Atmos. 2013, 118, 8222–8237. [Google Scholar] [CrossRef]
  13. Casse, C.; Gosset, M.; Peugeot, C.; Pedinotti, V.; Boone, A.; Tanimoun, B.A.; Decharme, B. Potential of satellite rainfall products to predict Niger River flood events in Niamey. Atmos. Res. 2015, 163, 162–176. [Google Scholar] [CrossRef]
  14. Jury, M.R. A return to wet conditions over Africa: 1995–2010. Theor. Appl. Climatol. 2013, 111, 471–481. [Google Scholar] [CrossRef]
  15. Tarhule, A.; Zume, J.T.; Grijsen, J.; Talbi-Jordan, A.; Guero, A.; Dessouassi, R.Y.; Doffou, H.; Kone, S.; Coulibaly, B.; Harshadeep, N.R. Exploring temporal hydroclimatic variability in the Niger Basin (1901–2006) using observed and gridded data. Int. J. Climatol. 2015, 35, 520–539. [Google Scholar] [CrossRef]
  16. Pouyaud, B. Variabilité spatiale et temporelle des bilans hydriques de quelques bassins versants d’Afrique de l'Ouest en liaison avec les changements climatiques. In Actes du Symposium de Vancouver: Climate Change and Climatic Variability; Orstom: Montpellier, France, 1987; Volume 168, pp. 447–461. [Google Scholar]
  17. Albergel, J. Sécheresse, désertification et ressources en eau de surface—Application aux petits bassins du Burkina Faso. In The Influence of Climate Change and Climatic Variability on the Hydrologic Regime and Water Resources; International Association of Hydrological Sciences (IAHS): Wallingford, UK, 1987; Volume 168, pp. 355–441. [Google Scholar]
  18. Amogu, O.; Esteves, M.; Vandervaere, J.-P.; Malam Abdou, M.; Panthou, G.; Rajot, J.-L.; Souley Yéro, K.; Boubkraoui, S.; Lapetite, J.-M.; Dessay, N.; et al. Runoff evolution due to land-use change in a small Sahelian catchment. Hydrol. Sci. J. 2014, 60, 78–95. [Google Scholar] [CrossRef]
  19. Descroix, L.; Esteves, M.; Souley Yéro, K.; Rajot, J.-L.; Malam Abdou, M.; Boubkraoui, S.; Lapetite, J.M.; Dessay, N.; Zin, I.; Amogu, O.; et al. Runoff evolution according to land use change in a small Sahelian catchment. Hydrol. Earth Syst. Sci. Discuss. 2011, 8, 1569–1607. [Google Scholar] [CrossRef]
  20. Mahé, G.; Paturel, J.-E.; Servat, E.; Conway, D.; Dezetter, A. The impact of land use change on soil water holding capacity and river flow modelling in the Nakambe River, Burkina-Faso. J. Hydrol. 2005, 300, 33–43. [Google Scholar] [CrossRef]
  21. Mahé, G.I.L.; Leduc, C.; Seryat, E.; Dezetter, A. Augmentation récente du ruissellement de surface en région soudano-sahélienne et impact sur les ressources en eau. In Hydrology of the Mediterranean and Seminarial Regions IAHS Publ. 278; Servat, E., Najem, W., Leduc, C., Shakeel, A., Eds.; International Association of Hydrological Sciences (IAHS): Wallingford, UK, 2003; Volume 1, pp. 215–222. [Google Scholar]
  22. Descroix, L.; Mahé, G.; Lebel, T.; Favreau, G.; Galle, S.; Gautier, E.; Olivry, J.-C.; Albergel, J.; Amogu, O.; Cappelaere, B.; et al. Spatio-temporal variability of hydrological regimes around the boundaries between Sahelian and Sudanian areas of West Africa: A synthesis. J. Hydrol. 2009, 375, 90–102. [Google Scholar] [CrossRef]
  23. Aich, V.; Liersch, S.; Vetter, T.; Andersson, J.; Müller, E.; Hattermann, F. Climate or Land Use?—Attribution of Changes in River Flooding in the Sahel Zone. Water 2015, 7, 2796–2820. [Google Scholar] [CrossRef]
  24. Séguis, L.; Cappelaere, B.; Milési, G.; Peugeot, C.; Massuel, S.; Favreau, G. Simulated impacts of climate change and land-clearing on runoff from a small Sahelian catchment. Hydrol. Process. 2004, 18, 3401–3413. [Google Scholar] [CrossRef]
  25. Sighomnou, D.; Descroix, L.; Genthon, P.; Mahé, G.; Moussa, I.B.; Gautier, E.; Mamadou, I.; Vandervaere, J.-P.; Bachir, T.; Coulibaly, B.; et al. La crue de 2012 à Niamey: un paroxysme du paradoxe du Sahel? Sci. Chang. Planétaires Sécheresse 2013, 24, 3–13. [Google Scholar]
  26. Mamadou, I.; Gautier, E.; Descroix, L.; Noma, I.; Bouzou Moussa, I.; Faran Maiga, O.; Genthon, P.; Amogu, O.; Malam Abdou, M.; Vandervaere, J.-P. Exorheism growth as an explanation of increasing flooding in the Sahel. Catena 2015, 131, 130–139. [Google Scholar] [CrossRef]
  27. Tschakert, P.; Sagoe, R.; Ofori-Darko, G.; Codjoe, S.N. Floods in the Sahel: An analysis of anomalies, memory, and anticipatory learning. Clim. Change 2010, 103, 471–502. [Google Scholar] [CrossRef]
  28. Nka, B.N.; Oudin, L.; Karambiri, H.; Paturel, J.E.; Ribstein, P. Trends in floods in West Africa: Analysis based on 11 catchments in the region. Hydrol. Earth Syst. Sci. 2015, 19, 4707–4719. [Google Scholar] [CrossRef]
  29. MunichRe NatCatSERVICE. Available online: http://www.munichre.com/en/reinsurance/business/non-life/georisks/natcatservice/default.aspx (accessed on 1 July 2015).
  30. EM-DAT The OFDA/CRED International Disaster Database. Available online: www.emdat.be (accessed on 1 July 2015).
  31. Brakenridge, G.R. Global Active Archive of Large Flood Events. Available online: http://floodobservatory.colorado.edu/Archives/index.html (accessed on 1 July 2015).
  32. GRDC BfG The GRDC—Global Runoff Database. Available online: http://www.bafg.de/nn_266934/GRDC/EN/01__GRDC/03__Database/database__node.html?__nnn=true (accessed on 1 July 2015).
  33. Ogilvie, A.; Mahé, G.; Ward, J.; Serpantié, G.; Lemoalle, J.; Morand, P.; Barbier, B.; Diop, A.T.; Caron, A.; Namarra, R.; et al. Water, agriculture and poverty in the Niger River basin. Water Int. 2010, 35, 594–622. [Google Scholar] [CrossRef]
  34. Zwarts, L.; van Beukering, P.; Kone, B.; Wymenga, E. The Niger, a Lifeline: Effective Water Management in the Upper Niger Basin; Altenburg & Wymenga Ecologisch Onderzoek BV: Leylstad, The Netherlands, 2005. [Google Scholar]
  35. Zwarts, L. Will the Inner Niger Delta Shrivel up due to Climate Change and Water Use Upstream; A & W Report 1537; Altenburg & Wymenga Ecologisch Onderzoek: Feanwâlden, The Netherland, 2010; p. 43. [Google Scholar]
  36. Liersch, S.; Cools, J.; Kone, B.; Koch, H.; Diallo, M.; Reinhardt, J.; Fournet, S.; Aich, V.; Hattermann, F.F. Vulnerability of rice production in the Inner Niger Delta to water resources management under climate variability and change. Environ. Sci. Policy 2013, 34, 8–33. [Google Scholar] [CrossRef]
  37. Andersen, I.; Dione, O.; Jarosewich-Holder, M.; Olivry, J.-C. The Niger Basin: A Vision for Sustainable Management; Golitzen, K.G., Ed.; World Bank Publications: Washington, DC, USA, 2005; Volume 34518. [Google Scholar]
  38. Food and Agriculture Organization (FAO) GeoNetwork. Global Population Density Estimates (2015 (FGGD)); FAO: Rome, Italy, 2015. [Google Scholar]
  39. Central Intelligence Agency The World Factbook 2013-14. Available online: https://www.cia.gov/library/publications/the-world-factbook/index.html (accessed on 1 July 2015).
  40. Malik, K. Human Development Report 2014: Sustaining Human Progress: Reducing Vulnerabilities and Building Resilience; Human Development Report for United Nations Development Programme: New York, NY, USA, 2014. [Google Scholar]
  41. Fekete, B.M.; Vorosmarty, C.J.; Grabs, W. Global, Composite Runoff Fields Based on Observed River Discharge and Simulated Water Balances; Water System Analysis Group, University of New Hampshire, and Global Runoff Data Centre, The German Federal Institute of Hydrology (BfG): Koblenz, Germany, 1999; Volume 22. [Google Scholar]
  42. Niger Basin Authority. Niger Basin Authority, (NBA) NIGER-HYCOS. Available online: http://nigerhycos.abn.ne/user-anon/htm/ (accessed on 1 March 2012).
  43. Niger Basin Authority, (NBA) Nigerhycos. Available online: http://nigerhycos.abn.ne/user-anon/htm/ (accessed on 15 November 2014).
  44. Weedon, G.P.; Gomes, S.; Viterbo, P.; Shuttleworth, W.J.; Blyth, E.; Österle, H.; Adam, J.C.; Bellouin, N.; Boucher, O.; Best, M. Creation of the WATCH Forcing Data and Its Use to Assess Global and Regional Reference Crop Evaporation over Land during the Twentieth Century. J. Hydrometeorol. 2011, 12, 823–848. [Google Scholar] [CrossRef]
  45. Weedon, G.P.; Balsamo, G.; Bellouin, N.; Gomes, S.; Best, M.J.; Viterbo, P. The WFDEI meteorological forcing data set: WATCH Forcing data methodology applied to ERA-Interim reanalysis data. Water Resour. Res. 2014, 50, 7505–7514. [Google Scholar] [CrossRef]
  46. Uppala, S.M.; KÅllberg, P.W.; Simmons, A.J.; Andrae, U.; Bechtold, V.D.C.; Fiorino, M.; Gibson, J.K.; Haseler, J.; Hernandez, A.; Kelly, G.A.; et al. The ERA-40 re-analysis. Q. J. R. Meteorol. Soc. 2005, 131, 2961–3012. [Google Scholar] [CrossRef]
  47. Dee, D.P.; Uppala, S.M.; Simmons, A.J.; Berrisford, P.; Poli, P.; Kobayashi, S.; Andrae, U.; Balmaseda, M.A.; Balsamo, G.; Bauer, P.; et al. The ERA-Interim reanalysis: Configuration and performance of the data assimilation system. Q. J. R. Meteorol. Soc. 2011, 137, 553–597. [Google Scholar] [CrossRef]
  48. Schneider, U.; Fuchs, T.; Meyer-Christoffer, A.; Rudolf, B. Global Precipitation Analysis Products of the GPCC; Global Precipitation Climatology Centre (GPCC): Offenbach, Germany, 2008; Volume 112. [Google Scholar]
  49. Schneider, U.; Becker, A.; Finger, P.; Meyer-Christoffer, A.; Ziese, M.; Rudolf, B. Global Precipitation Climatology Centre monthly precipitation dataset. Theor. Appl. Climatol. 2014, 115, 15–40. [Google Scholar] [CrossRef]
  50. National Centers for Environmental Information Global Surface Summary of the Day—GSOD. Available online: http://gis.ncdc.noaa.gov/geoportal/catalog/search/resource/details.jsp?id=gov.noaa.ncdc:C00516 (accessed on 1 July 2015).
  51. Yamin, F.; Rahman, A.; Huq, S. Vulnerability, adaptation and climate disasters: A conceptual overview. IDS Bull. 2005, 36, 1–14. [Google Scholar] [CrossRef] [Green Version]
  52. Cleveland, W.S.; Devlin, S.J. Locally Weighted Regression: An Approach to Regression Analysis by Local Fitting. J. Am. Stat. Assoc. 1988, 83, 596–610. [Google Scholar] [CrossRef]
  53. Mann, H.B. Nonparametric Tests Against Trend. Econometrica 1945, 13, 245–259. [Google Scholar] [CrossRef]
  54. Sen, P. Estimates of the regression coefficient based on Kendall’s tau. J. Am. Stat. Assoc. 1968, 63, 1379–1389. [Google Scholar] [CrossRef]
  55. Theil, H. A rank-invariant method of linear and polynomial regression analysis. In Henri Theil’s Contributions to Economics and Econometrics; Springer Netherlands: Dordrecht, The Netherlands, 1950; pp. 386–392. [Google Scholar]
  56. Durbin, J.; Watson, G. Testing for serial correlation in least squares regression. I. Biometrika 1950, 37, 409–428. [Google Scholar] [PubMed]
  57. Durbin, J.; Watson, G. Testing for serial correlation in least squares regression. II. Biometrika 1951, 38, 159–178. [Google Scholar] [CrossRef] [PubMed]
  58. Yue, S.; Pilon, P.; Phinney, B.; Cavadias, G. The influence of autocorrelation on the ability to detect trend in hydrological series. Hydrol. Process. 2002, 16, 1807–1829. [Google Scholar] [CrossRef]
  59. Nicholson, S.E.; Some, B.; Kone, B. An Analysis of Recent Rainfall Conditions in West Africa, Including the Rainy Seasons of the 1997 El Niño and the 1998 La Niña Years. J. Clim. 2000, 13, 2628–2640. [Google Scholar] [CrossRef]
  60. Sarr, M.A.; Zoromé, M.; Seidou, O.; Bryant, C.R.; Gachon, P. Recent trends in selected extreme precipitation indices in Senegal—A changepoint approach. J. Hydrol. 2013, 505, 326–334. [Google Scholar] [CrossRef]
  61. Page, E. Continuous inspection schemes. Biometrika 1954, 41, 100–114. [Google Scholar] [CrossRef]
  62. Killick, R.; Eckley, I.A.; Ewans, K.; Jonathan, P. Detection of changes in variance of oceanographic time-series using changepoint analysis. Ocean Eng. 2010, 37, 1120–1126. [Google Scholar] [CrossRef] [Green Version]
  63. Auger, I.; Lawrence, C. Algorithms for the optimal identification of segment neighborhoods. Bull. Math. Biol. 1989, 51, 39–54. [Google Scholar] [CrossRef] [PubMed]
  64. Akaike, H. A new look at the statistical model identification. IEEE Trans. Automat. Contr. 1974, 19, 716–723. [Google Scholar] [CrossRef]
  65. Coles, S.; Bawa, J.; Trenner, L.; Dorazio, P. An Introduction to Statistical Modeling of Extreme Values; Springer London: London, UK, 2001. [Google Scholar]
  66. Delgado, J.M.; Apel, H.; Merz, B. Flood trends and variability in the Mekong river. Hydrol. Earth Syst. Sci. 2010, 14, 407–418. [Google Scholar] [CrossRef]
  67. Hundecha, Y.; St-Hilaire, A.; Ouarda, T.B.M.J.; El Adlouni, S.; Gachon, P. A Nonstationary Extreme Value Analysis for the Assessment of Changes in Extreme Annual Wind Speed over the Gulf of St. Lawrence, Canada. J. Appl. Meteorol. Climatol. 2008, 47, 2745–2759. [Google Scholar] [CrossRef]
  68. Torrence, C.; Compo, G.P. A Practical Guide to Wavelet Analysis. Bull. Am. Meteorol. Soc. 1998, 79, 61–78. [Google Scholar] [CrossRef]
  69. Boulain, N.; Cappelaere, B.; Séguis, L.; Favreau, G.; Gignoux, J. Water balance and vegetation change in the Sahel: A case study at the watershed scale with an eco-hydrological model. J. Arid Environ. 2009, 73, 1125–1135. [Google Scholar] [CrossRef]
  70. Cappelaere, B.; Descroix, L.; Lebel, T.; Boulain, N.; Ramier, D.; Laurent, J.-P.; Favreau, G.; Boubkraoui, S.; Boucher, M.; Bouzou Moussa, I.; et al. The AMMA-CATCH experiment in the cultivated Sahelian area of south-west Niger—Investigating water cycle response to a fluctuating climate and changing environment. J. Hydrol. 2009, 375, 34–51. [Google Scholar] [CrossRef]
  71. Favreau, G.; Cappelaere, B.; Massuel, S.; Leblanc, M.; Boucher, M.; Boulain, N.; Leduc, C. Land clearing, climate variability, and water resources increase in semiarid southwest Niger: A review. Water Resour. Res. 2009, 45. [Google Scholar] [CrossRef]
  72. Leduc, C.; Favreau, G.; Schroeter, P. Long-term rise in a Sahelian water-table: The Continental Terminal in South-West Niger. J. Hydrol. 2001, 243, 43–54. [Google Scholar] [CrossRef]
  73. Mahé, G. Surface/groundwater interactions in the Bani and Nakambe rivers, tributaries of the Niger and Volta basins, West Africa. Hydrol. Sci. J. 2009, 54, 704–712. [Google Scholar] [CrossRef]
  74. Descroix, L.; Bouzou, I.; Genthon, P.; Sighomnou, D.; Mahe, G.; Mamadou, I.; Vandervaere, J.-P.; Gautier, E.; Faran, O.; Rajot, J.-L.; et al. Impact of Drought and Land—Use Changes on Surface—Water Quality and Quantity: The Sahelian Paradox. In Current Perspectives in Contaminant Hydrology and Water Resources Sustainability; Bradley, P., Ed.; InTech: Rijeka, Croatia, 2013; pp. 243–271. [Google Scholar]
  75. Kron, W. Flood Risk = Hazard • Values • Vulnerability. Water Int. 2005, 30, 58–68. [Google Scholar] [CrossRef]
  76. Merz, B. Hochwasserrisiken: Möglichkeiten und Grenzen der Risikoabschätzung; E. Schweizerbartsche Verlagsbuchhandlung: Stuttgart, German, 2006. [Google Scholar]
  77. Kim, S.H.; Edmonds, J.; Lurz, J.; Smith, S.J.; Wise, M. The ObjECTS framework for integrated assessment: Hybrid modeling of transportation. Energy J. 2006, 27, 63–91. [Google Scholar] [CrossRef]
  78. IPCC. Managing the Risks of Extreme Events and Disasters to Advance Climate Change Adaptation. A Special Report of Working Groups I and II of the Intergovernmental Panel on Climate Change; Field, C.B., Barros, V., Stocker, T.F., Qin, D.J., Dokken Ebi, K.L., Mastrandrea, M.D., Mach, K.J., Plattner, G.-K., Allen, S.K., Tignor, M., et al., Eds.; Cambridge University Press: Cambridge, UK; New York, NY, USA, 2012. [Google Scholar]
  79. United Nations Department of Economic and Social Affairs (DESA). World Population Prospects: The 2012 Revision, Key Findings and Advance Tables; Working Paper No. ESA/P/WP.227; DESA: New York, NY, USA, 2013. [Google Scholar]
  80. Di Baldassarre, G.; Montanari, A.; Lins, H.; Koutsoyiannis, D.; Brandimarte, L.; Blschl, G. Flood fatalities in Africa: From diagnosis to mitigation. Geophys. Res. Lett. 2010, 37. [Google Scholar] [CrossRef]
  81. Di Baldassarre, G.; Viglione, A; Carr, G.; Kuil, L.; Yan, K.; Brandimarte, L.; Blöschl, G. Debates—Perspectives on sociohydrology: Capturing feedbacks between physical and social processes. Water Resour.Res. 2015, 51, 4770–4781. [Google Scholar] [CrossRef]
  82. Döll, P.; Jiménez-Cisneros, B.; Oki, T.; Arnell, N.W.; Benito, G.; Cogley, J.G.; Jiang, T.; Kundzewicz, Z.W.; Mwakalila, S.; Nishijima, A. Integrating risks of climate change into water management. Hydrol. Sci. J. 2014, 60, 4–13. [Google Scholar] [CrossRef]
Figure 1. Niger River Basin: Source areas of floods in the Guinean, Sahelian and Benue regions, with location and number of catastrophic floods plotted for river and areal floods [29,30,31]. Discharge gauging stations used for analysis are marked in green and reservoirs as red ovals [32].
Water 08 00165 g001
Figure 2. Hydrograph of the Niamey gauging station with Sahelian flooding (red) and Guinean flooding (blue) for the period from 2003 to 2012.
Water 08 00165 g002
Figure 3. Three factors of flood risk in the Niger River Basin: hazard as annual maximum discharge trend for gauging stations 1985–2012; population density of 2015 as proxy for exposure [38], and the Human Development Index 2013 [40] as proxy for the general vulnerability distribution.
Water 08 00165 g003
Figure 4. Top: Annual maximum discharge (AMAX), precipitation and people affected by floods in the NRB, separated for the three subregions. Detected changepoints for the mean AMAX in each region are plotted as black dashed lines. Note that for the Sahelian region the numbers of people affected by catastrophic floods are plotted for the whole Middle Niger (see Section 3.1.2). Please also note for the Sahelian region that only stations on the tributaries (Alcongui, Garbe-Korou) have been used for the Loess curve. The station Niamey has gaps where the red flood was covered by the Guinean flood in the hydrograph.
Water 08 00165 g004
Figure 5. Sahel Paradox depicted with annual/ heavy precipitation from WFD and WFDEI and AMAX for the Sahelian flood peak at Niamey, and the mean of Alcongui and Garbe-Kourou. The AMAX of the Guinean flood peak at Niamey is depicted with the respective precipitation in order to illustrate the difference. All time series as anomalies in % with Loess curves and global minima.
Water 08 00165 g005
Figure 6. Non-stationary extreme value probability distributions for (a) Kouroussa; (b) Alcongui and (c) Garbe-Kourou.
Water 08 00165 g006
Figure 7. Shift in day of AMAX for the stations influenced by the Inner Niger Delta for the Guinean flood.
Water 08 00165 g007
Figure 8. People affected by catastrophic floods per year in the Niger River Basin from 1980 to 2014 for three different data sources. Note that the scale of the y-axis is logarithmic.
Water 08 00165 g008
Figure 9. Correlation between AMAX and people affected by floods for the subregions of the Niger basin, (a) Guinean, (b) Sahelian and (c) Benue. The scales for people affected by floods for the Sahelian region and the Benue are logarithmic. Please note that the number of people affected for the Sahelian basin comprises the whole Middle Niger (See Section 3.1.2).
Water 08 00165 g009
Table 1. Correlation of AMAX with heavy precipitation (95th percentile) and annual precipitation derived from WFDEI for the period from 1979–2012. All correlations are significant (α = 0.05).
GuineanSahelianBenue
Heavy precipitation0.720.640.71
Annual precipitation0.720.60.65

