Article

Effects of Wash-Out Dynamics on Nitrifying Bacteria in Aerobic Granular Sludge During Start-Up at Gradually Decreased Settling Time

1
Division of Water Environment Technology, Department of Civil and Environmental Engineering, Chalmers University of Technology, Gothenburg SE-41296, Sweden
2
Department of Chemistry and Molecular Biology, University of Gothenburg, Gothenburg SE-40530, Sweden
*
Author to whom correspondence should be addressed.
Water 2016, 8(5), 172; https://doi.org/10.3390/w8050172
Submission received: 11 January 2016 / Revised: 18 April 2016 / Accepted: 20 April 2016 / Published: 27 April 2016

Abstract

:
The aerobic granular sludge process is a promising technology for the removal of nutrients and organic contaminants from wastewater. However, a large amount of the sludge is often washed out during the start-up of granular reactors, which results in reduced process performance and a protracted start-up phase. In this study, the possibility of a rapid start-up of the nitrification process through a stepwise decrease of the settling time was investigated, and the bacterial population dynamics in two lab-scale sequencing batch reactors were studied. The results demonstrated that the stepwise decrease of the settling time enabled fast granulation and rapid start-up of the process. Small cores of granules were already observed after 10 days of operation, and the biomass was dominated by granules after 28 days. The removal of organic matter and ammonium was >95% after one day and 14 days, respectively. The bacterial community composition changed rapidly during the first 21 days, resulting in strongly reduced richness and evenness. The diversity increased at a later stage, and the bacterial community continued changing, albeit at a slower pace. The rate of the stepwise decrease in settling time strongly affected the abundance of nitrifying organisms, but not the general composition of the bacterial community. The results of this study support the idea that a stepwise decrease of the settling time is a successful strategy for the rapid start-up of aerobic granular sludge reactors.

1. Introduction

Wastewater treatment by means of aerobic granular sludge is a promising high-rate technology first reported in the 1990s [1,2]. Granules are self-immobilized microbial aggregates with a strong, compact structure, and good settleability, which ensures optimum solid-liquid separation and thus high biomass retention [3]. Extensive research has revealed that aerobic granules can be effective in removing nutrients and organic compounds, even at high loading rates, allowing treatment of municipal, industrial, and toxic wastewaters [4]. Although two decades have passed since the initial reports, our understanding of the granulation process remains incomplete [5]. Current selection pressure theories consider settling time, volume exchange ratio, and hydrodynamic shear force as the most important operational parameters affecting the granulation process [5,6]. Studies investigating the effect of settling time (e.g., [7,8,9,10]) or of hydrodynamic shear force (e.g., [11,12,13,14]) have mostly focused on the process performance in addition to the physical and chemical properties of the granules, while not analyzing the microbial population dynamics. However, these parameters can affect the bacterial community composition considerably. McSwain et al. [15] obtained entirely different microbial consortia in the steady-state samples from two parallel reactors operated with different settling times (2 and 10 min). These differences in the community composition were not reflected in the measured process parameters as the removal efficiency of organic matter and the oxygen uptake rate were similar in the two reactors. Nitrogen removal was, however, not investigated in their study.
During start-up, reduced nutrient removal efficiency is often reported, which is hypothesized to be a consequence of harsh wash-out conditions [16]. Decreasing sludge retention time (SRT), a result of excessive biomass wash-out, is disadvantageous for slow-growing bacterial guilds, such as ammonium or nitrite oxidizers. The subsequent impact of biomass loss is deteriorated nitrogen removal efficiency. Rapid changes in the microbial population have also been documented during start-up [17,18]; however, very few studies have examined the abundance and dynamics of the nitrifying community during granulation [19]. Based on a modeling approach, Su et al. [20] suggested that a stepwise decrease of settling time can be an effective method for optimizing biomass discharge during start-up, but their study did not investigate the nutrient removal during granulation.
The aim of the present study was to explore the performance of the nitrification process, the bacterial community dynamics, and the wash-out of nitrifying organisms during the start-up of aerobic granular sludge reactors with a gradually decreased settling time. Our hypothesis was that the stepwise decrease of settling time would enable good retention of nitrifying organisms and thus a rapid start-up of nitrification in the reactors. The sensitivity of the start-up process to the rate of the stepwise decrease in settling time was investigated by means of the parallel operation of two reactors with different rates.

2. Materials and Methods

2.1. Reactor Set-Up

Two sequencing batch reactors (R1 and R2) were operated in parallel for 112 days. Column reactors constructed of poly(methyl methacrylate) with a working volume of three liters, a diameter of 6 cm, a total height of 132 cm, a liquid height of 110 cm, and a volume exchange ratio of 43% were used. The air was introduced from the bottom through a diffuser stone, with a superficial upflow air velocity of 1.5 cm/s, which resulted in saturated dissolved oxygen levels during the aerobic phase. The influent entered the reactor from the bottom. The reactors were operated in 4 h cycles, consisting of 5 min anaerobic filling, 200–228 min aerobic phase, 2–30 min settling time, and 5 min effluent withdrawal. The settling time was decreased stepwise from 30 min to two minutes in both reactors over the first 21 days (Figure 1). The rate of decrease differed in the two reactors, thus the ratio of the discharged to the retained sludge biomass also varied. In R1, the discharge ratio was between 0.01 and 0.07, i.e., 1%–7% of the sludge was discharged with the effluent in one cycle. In R2, the biomass discharge ratio, varying between 0.02 and 0.14, was always twice as high compared to R1. After day 21, the settling time was kept constant at two minutes in both reactors until the end of the experiment. The reactors were seeded with 3 L aerobic/anoxic activated sludge (2 g TSS/L) from a full-scale municipal wastewater treatment plant (Gryaab) in Gothenburg, Sweden.

2.2. Medium

The reactors were fed with synthetic wastewater consisting of 640.6 mg/L NaCH3COO, 12.5 mg/L MgSO4·7H2O, 15.0 mg/L CaCl2, 10.0 mg/L FeSO4·7H2O, 100.0 mg/L NH4Cl, 22.5 mg/L K2HPO4, and 1 mL/L micronutrient solution (as described in Tay et al. [21]) in deionized water. All chemicals (VWR or Fisher Scientific) were of reagent grade. The organic loading rate (OLR) was 1.5 kg COD/m3/day, and the nitrogen load was 0.075 kg NH4-N/m3/day, resulting in a COD:N ratio of 100:5. The hydraulic retention time was 9.3 h. The pH of the synthetic wastewater was approximately 8.0. The pH and the temperature in the reactors were not regulated and varied in the range of 7.95–9.05 (Figures S7 and S8) and 19–21 °C, respectively.

2.3. Chemical Analysis and Microscopy

During the aerobic phase, mixed liquid samples of 150 mL were manually removed from the reactors using a flexible plastic tube (ø 1 cm) and a syringe for chemical, microscopic, and DNA analysis. The concentrations of mixed liquid suspended solids (MLSS) and mixed liquid volatile suspended solids (MLVSS) were measured according to Standard Methods [22]. Granulation was investigated using an Olympus BX60 light microscope(Olympus Sverige AB, Solna, Sweden). The effluent chemical oxygen demand (COD) concentration was analyzed spectrophotometrically with HACH COD test kits (HACH LANGE). The total suspended solids (TSS) concentration of the effluent was measured according to Standard Methods [22]. NH4-N, NO2-N, and NO3-N concentrations in the effluent were analyzed using a FIAstar 5000 analyzer (FOSS Tecator AB, Sweden), and the total nitrogen (TN) concentration was calculated as the sum of these.

2.4. DNA Extraction and Quantitative Polymerase Chain Reaction (qPCR)

Biomass samples were removed twice a week as described in Section 2.3, and the DNA was extracted using the FastDNA spin kit for soil (MP Biomedicals), in accordance with the manufacturer’s protocol. The qPCR was carried out in 25 µL total volume using 12.5 µL of the SYBR Green PCR supermix (Bio-Rad), 10 ng template and 0.3 µM of each primer (forward and reverse). Primer pairs, references, and annealing temperatures are presented in Table S1. All the samples were measured in duplicate, using the Bio-Rad iQ5 real-time PCR detection system. The qPCR protocols for all primer pairs were as follows: 3 min enzyme activation at 95 °C, followed by 40 cycles of denaturation (95 °C; 15 s), annealing (Table S1; 30 s), elongation (72 °C; 30 s), and data acquisition (80 °C; 30 s), concluding with a final elongation (72 °C; 7 min) and a melting curve (72–95 °C with 0.5 °C increments, each for 30 s). Decimal dilutions of linearized plasmid target gene inserts were used as a standard.

2.5. PCR Amplification and Terminal Restriction Fragment Length Polymorphism (T-RFLP)

The 16S rRNA genes were amplified using the HotStarTaqPlus PCR kit (Qiagen, Hilden, Germany), with 10 ng template, 0.5 µM bacterial primers 27F (6-FAM labeled) and 1492R [23], 0.2 µM dNTPs, and 1.25 U DNA polymerase. The PCR reaction was carried out in triplicate, using a Biometra T3000 thermocycler, starting with 5 min of enzyme activation at 95 °C, followed by 25 cycles of denaturation (94 °C, 45 s), annealing (52 °C, 45 s) and elongation (72 °C, 105 s), concluding with a 7 min final elongation at 72 °C. The replicate PCR products were pooled and purified using the QIAquick PCR purification kit (Qiagen), following the manufacturer’s protocol. The samples were then digested with mung bean nuclease (New England Biolabs, Ipswitch, MA, USA) in order to remove pseudoterminal fragments, purified again (QIAquick), and finally, approx. 160 ng DNA was separately digested overnight at 37 °C using the restriction enzymes RsaI and MspI (New England Biolabs). The digested products were purified using the Agencourt AMPure system (Beckman Coulter, Fullerton, CA, USA) and analyzed with a 3730 fragment analyzer (Applied BioSystem).
The results were quantified with the software GeneMapper (Applied Biosystems, Foster City, MA, USA) and analyzed based on the relative peak area using the Microsoft Excel template Tools for T-RFLP data analysis [24]. The results from the MspI and RsaI enzyme digestions were then pooled, and after square root transformation, a Bray-Curtis dissimilarity matrix was generated using the software R [25]. Ordination employing non-metric multidimensional scaling (NMDS) was performed in the R-package vegan [26]. The diversity of the bacterial community in each sample was assessed by species richness (the number of species) and by the evenness of the species’ abundances. The Margalef richness and Pielou’s evenness indices [27] were calculated based on the number and relative peak areas of the terminal restriction fragments (TRFs), using Microsoft Excel.

3. Results and Discussion

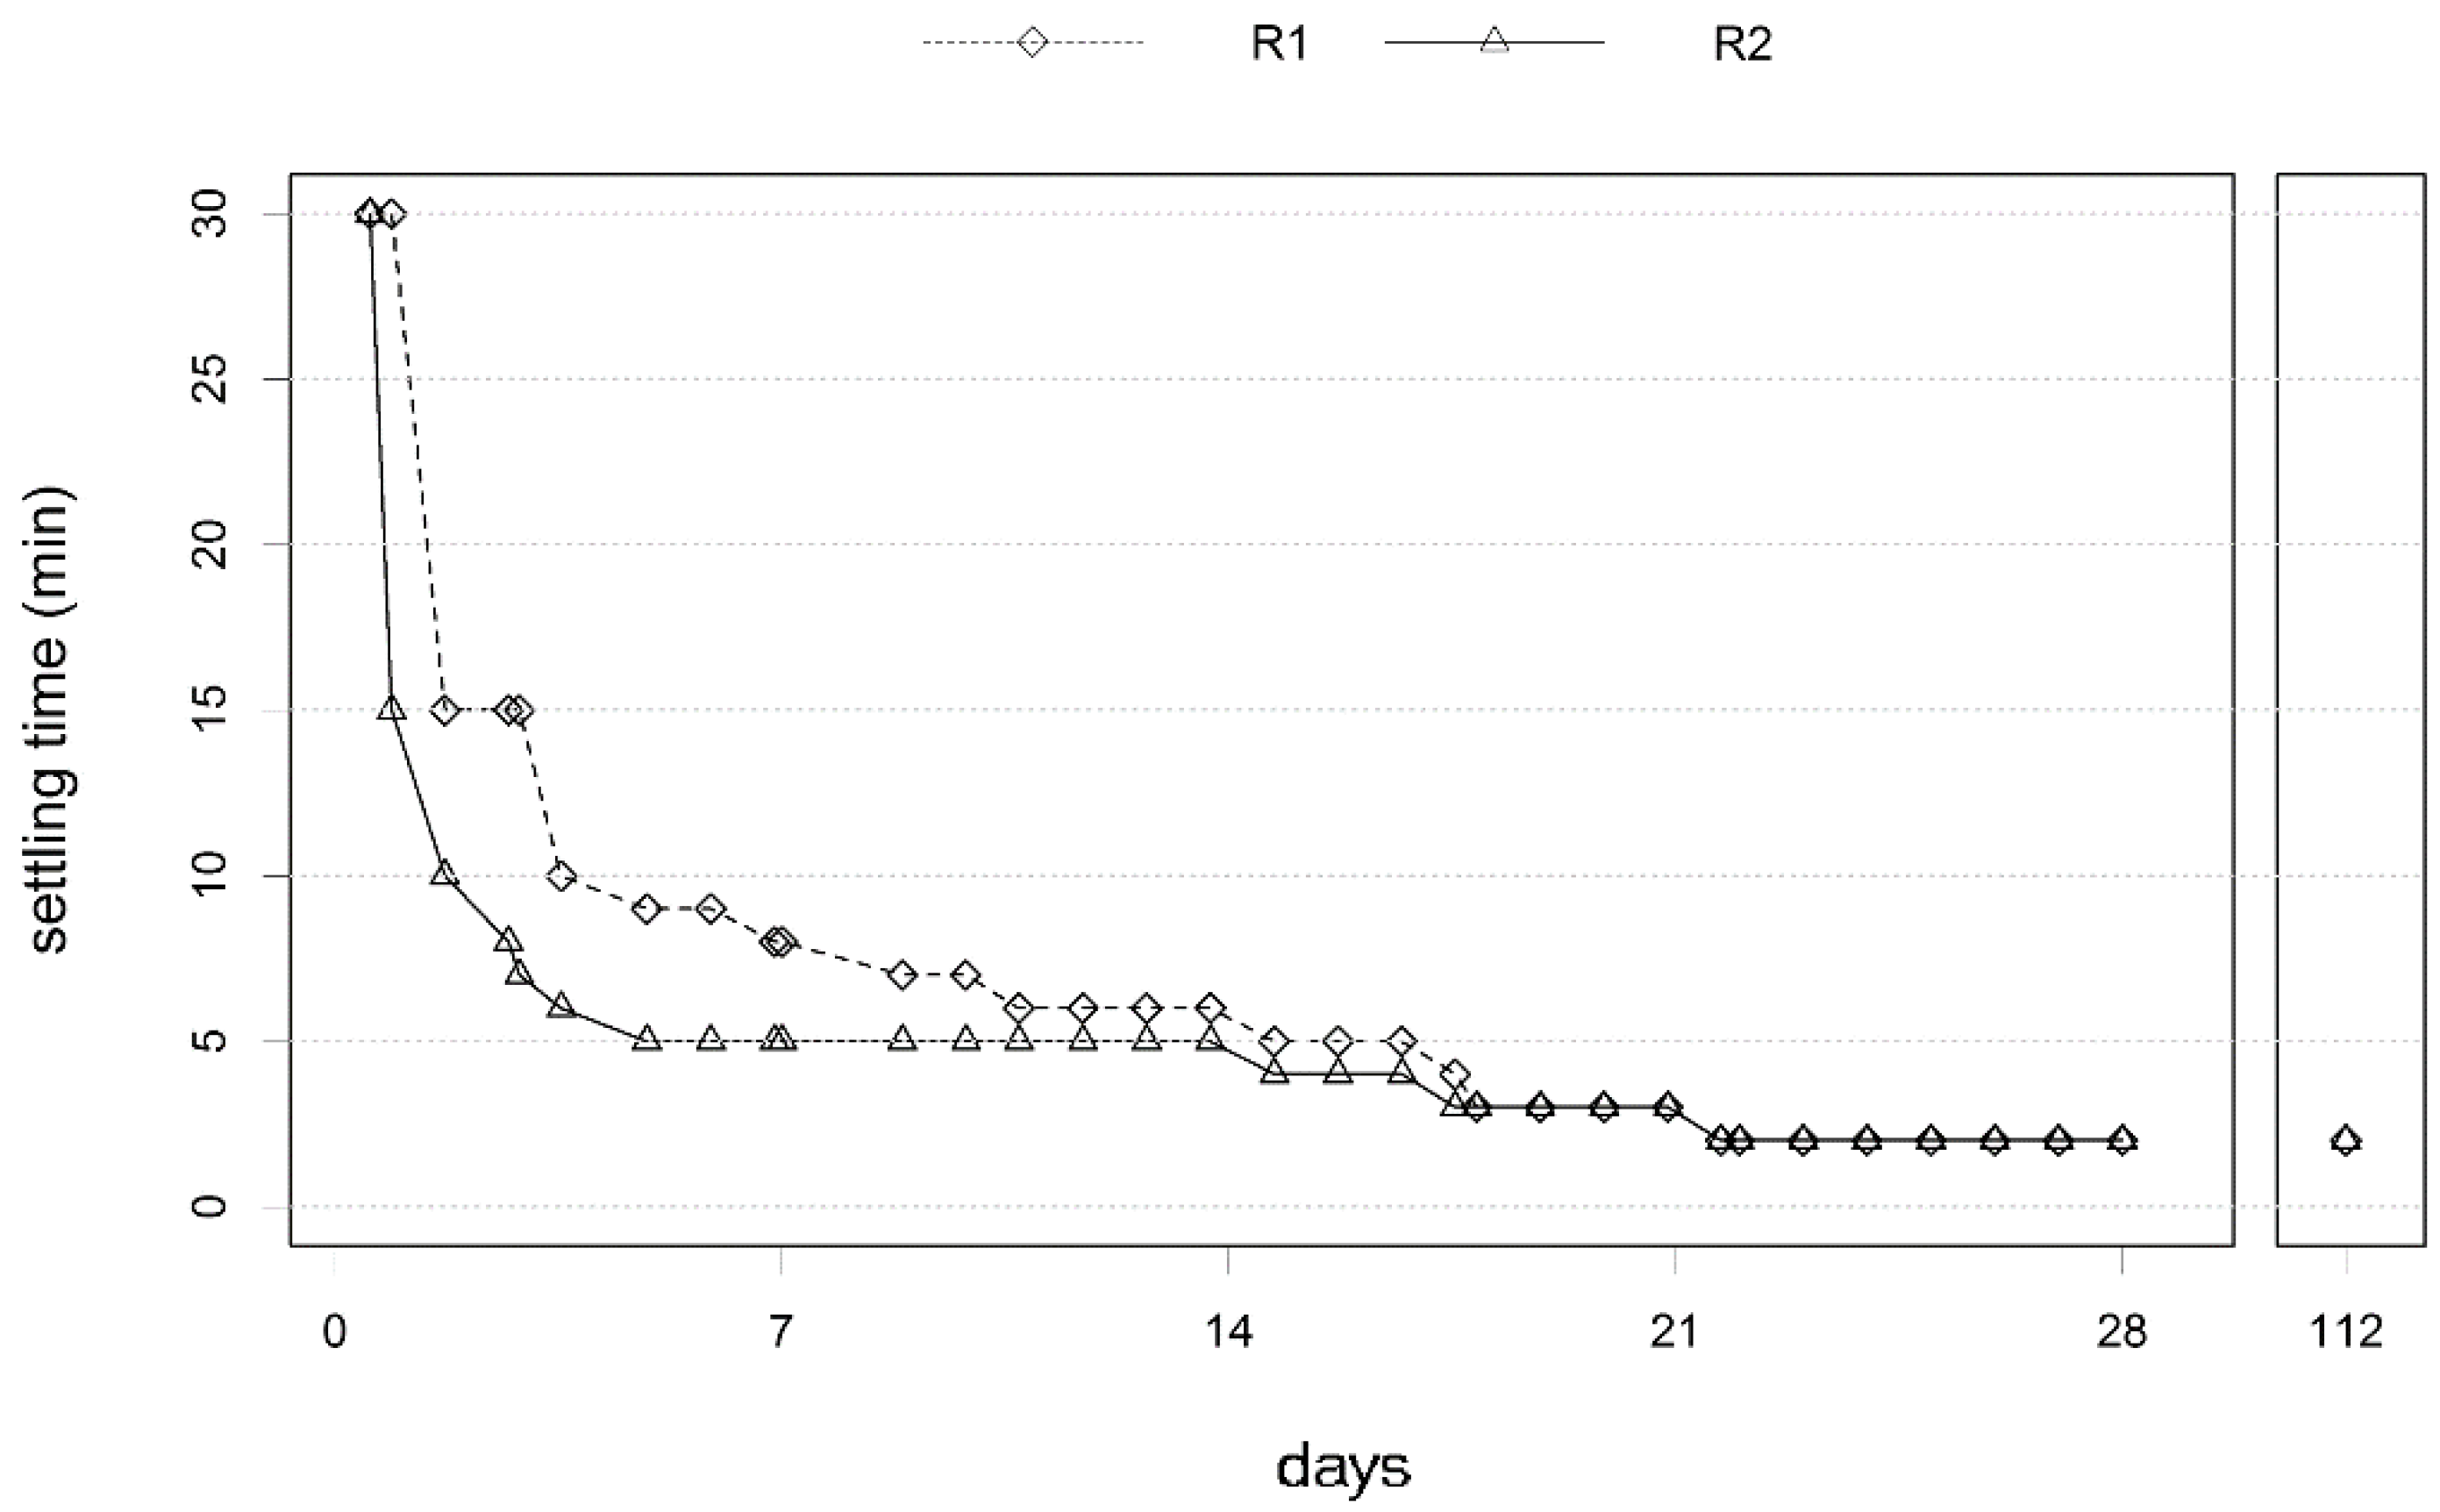
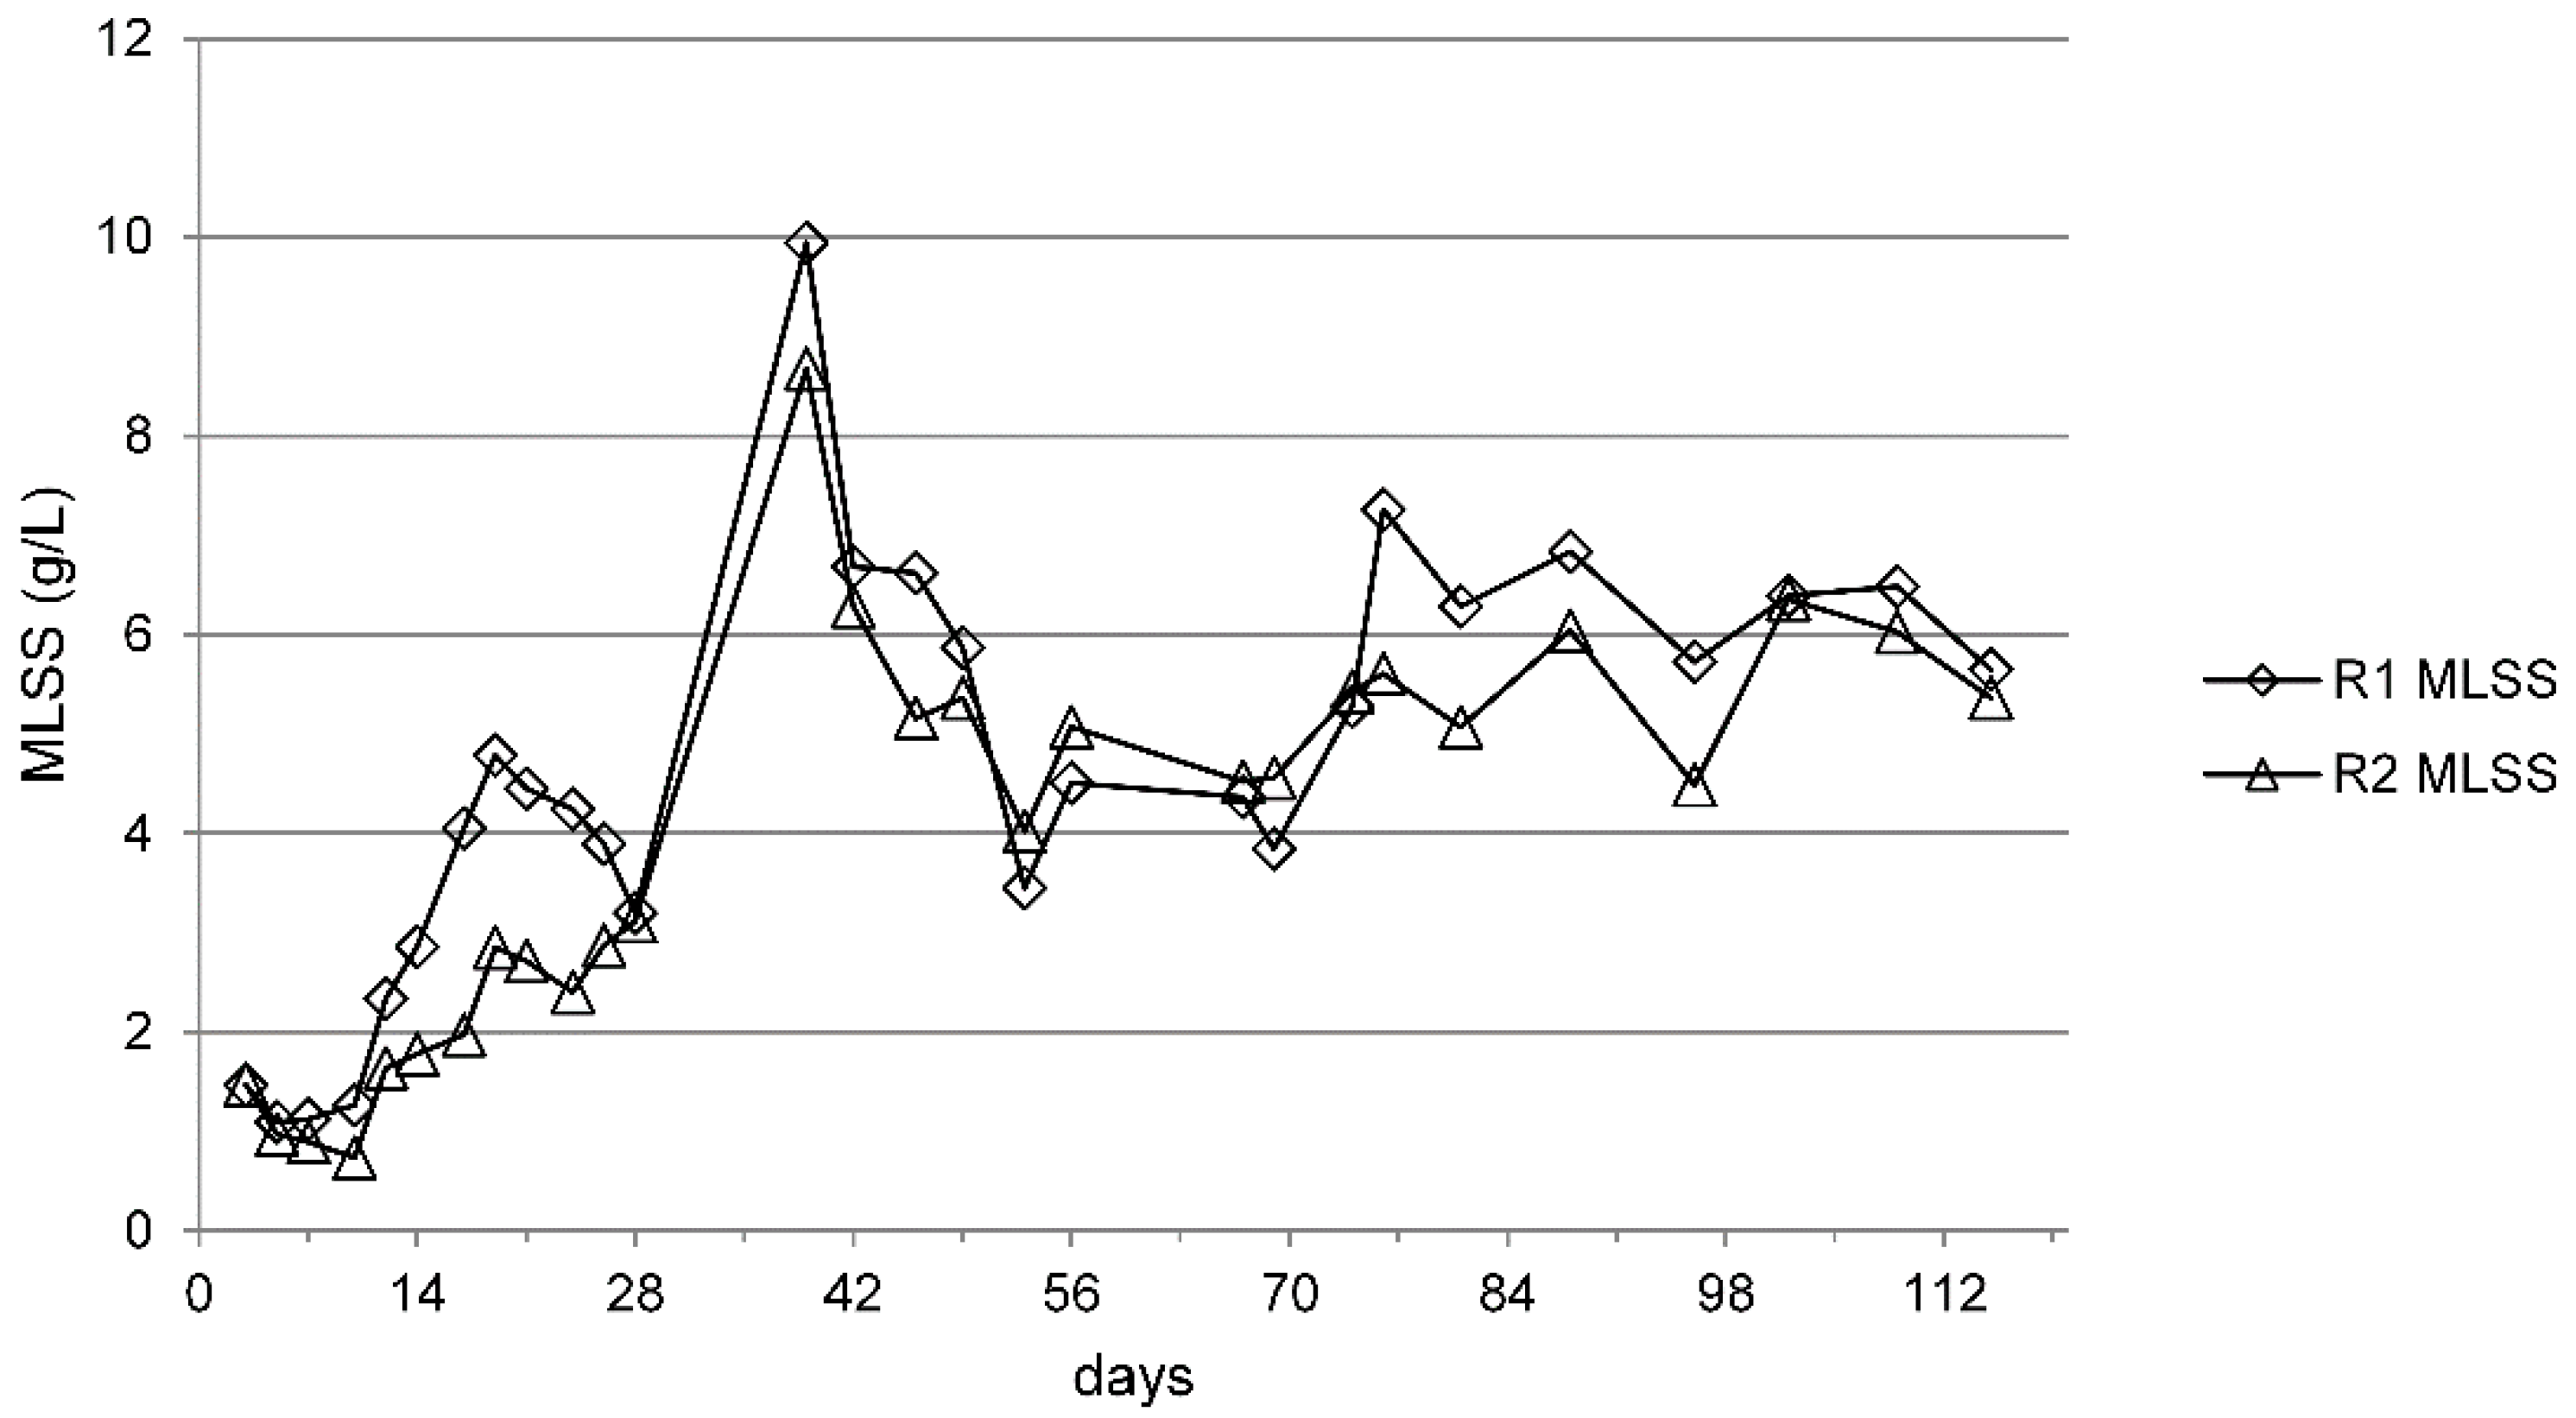
3.1. Biomass Retention and Granulation

During the start-up period of our experiment (the first 28 days), the settling time was reduced stepwise to promote granulation and, simultaneously, retain a large fraction of the biomass in the reactors. The settling time was reduced more rapidly in reactor 2 than in reactor 1 (Figure 1). As a consequence, the settled sludge volume and the biomass concentration were lower in R2 than in R1 during the first 28 days (Figure 2). After the settling time was reduced to 2 min in R1 (day 21), the biomass concentration started to decrease and reached the same value as that in R2 within seven days. In both reactors, small granules emerged after 10 days, as revealed by microscopy (Figure S1). The average size of the microbial assemblages (sludge and granules) during start-up increased over time with no clear difference between R1 and R2 (Figure S2). This indicated that the different rates of decrease in settling time had minimal impact on the granulation process. After 28 days, granules dominated the biomass in the reactors.
While in early experiments the settling time was kept constant at a low level from the time of the first cycle [28], studies have recently been published in which the settling time was gradually decreased. For example, Sadrzadeh et al. [9] decreased the settling time very slowly, reaching a 5 min settling time after 95 days, and therefore the biomass remained floccular, despite having good settling properties. Weissbrodt et al. [16] also decreased the settling time in a stepwise manner, but the rate of decrease was significantly faster, reaching the final 3 min settling time within 10 days. This led to severe biomass wash-out on day 8, leaving the reactor with a settled sludge blanket of only 1 cm. Therefore, to prevent severe biomass wash-out, or the formation of well-settling flocs instead of granules, a balanced strategy for decreasing the settling time is required during the start-up of granular sludge reactors. Su et al. [20] suggested that a stepwise decrease of the settling time based on the biomass discharge ratio could be a successful strategy for achieving fast and effective granulation. According to their model simulations, the optimal control strategy would be to keep the biomass discharge ratio between 0.01 and 0.05. This is in good agreement with the discharge ratio in R1 in our investigation, which hereby confirms experimentally that the control strategy proposed by Su et al. [20] is indeed successful. Although R2 was operated with twice as high biomass discharge ratios during start-up (first 28 days), this approach was still effective in retaining biomass (Figure 2) while facilitating granulation.

3.2. Process Performance

The COD concentration in the effluent was below 50 mg/L from the first day of operation, i.e., the removal efficiency was >95% (Figure 3a). The effluent TSS concentration fluctuated between 0.03 and 0.23 g/L in both reactors (Figure S5). The ammonium concentration in the effluent started to decrease after seven days of operation, and the ammonium removal efficiency reached >95% after 14 days in both reactors (Figure 3b). The appearance of both nitrate and nitrite indicated that autotrophic nitrification took place, although it is likely that heterotrophic assimilation also contributed to the ammonium removal. The nitrite concentration peaked after 10 days and then decreased, indicating higher ammonium oxidizing bacteria (AOB) activity, followed by an increase in the activity of nitrite oxidizing bacteria (NOB) that converted nitrite into nitrate (Figure 3c). From day 21 to day 42, the effluent nitrate concentration fluctuated between 5 and 10 mg/L (Figure 3d), and the TN removal efficiency was between 60% and 75%. In summary, the stepwise decrease in the settling time allowed the reactors to achieve >95% COD and ammonium removal, and 60%–75% TN removal within a mere 21 days.
Results from previous studies that applied a stepwise decrease of the settling time have varied considerably. Weissbrodt et al. [16] reported reduced nitrogen removal efficiency due to severe biomass wash-out; the ammonium and nitrogen removal recovered after 40 days (to 77% and 60%, respectively). Liu et al. [17] achieved complete ammonium removal after 49 days, while Zhao et al. [29] obtained the same after 21 days with simultaneous stepwise decreased settling time and gradually increased COD and N-load. However, the authors did not provide information about the strategy applied for decreasing the settling time. Even a gradually decreased settling time does not always lead to the prompt start of nitrification. Ebrahimi et al. [30] observed no nitrification in a reactor operated at 20 °C for more than 60 days, although the settling time was decreased gradually, at a similar rate to that used in the present study. Although there are still too few examples from which to draw any comprehensive conclusions, it is clear that the decrease rate must be adjusted to the operational conditions and configuration of the reactor in order to achieve the goal of rapid nitrification start-up.

3.3. Abundance of AOB and NOB

The results of the qPCR analyses are presented in Figure 4. The abundance of AOB, as measured by 16S rRNA gene copy numbers, decreased dramatically in both reactors during the first seven days (Figure 4a), despite the gradually decreased settling time (Figure 1) and the low biomass discharge (Figure 2). In R1, the AOB copy number per reactor volume decreased by one order of magnitude, even though the settling time was reduced slowly and the biomass discharge ratio was less than 7%. In R2, the settling time decrease (Figure 1) resulted in even lower AOB abundance (a decrease of two orders of magnitude compared to the seed sludge). During the remaining 21 days of the start-up period (i.e., between days 7 and 28), the abundance of AOB increased considerably, as did the ammonium oxidizing activity (Figure 3). The observed AOB abundances, as measured by 16S rRNA gene copy numbers (Figure 4a), were confirmed by a parallel measurement of the AOB amoA gene copy numbers (Figure S3) that showed identical trends. The temporal variations of the NOB (Nitrospira) abundance (Figure 4b) were similar to those of the AOB abundance, exhibiting a dramatic decrease in the first seven days followed by a steady increase in the subsequent 21 days. No Nitrobacter NOB were detected (Table S1).
The observed connection between the process performance and AOB/NOB abundance correlates well with the results published by Val del Río et al. [31], who found that a sludge retention time in excess of five days is necessary to obtain a nitrification efficiency close to 100%. In our reactors, the SRT was below six days (R1) and three days (R2) during the first 10 days of operation (Figure S6). During the rest of the start-up period, the SRT was sufficiently high to allow nitrifier abundance to increase, and, consequently, enabled 100% nitrification efficiency.
After day 29, the increased sludge concentration in both reactors (Figure 2) was attributed to not sampling the reactors for 10 days. Because of the low relative abundance and the slow growth rate of the nitrifying organisms, the increased sludge concentration was likely a result of heterotrophic growth. Therefore, while the absolute abundance of AOB remained approximately the same (Figure 4), their relative abundance decreased in both reactors (two-fold in R1 and 1.3-fold in R2, calculated from the AOB and the universal 16S rRNA gene copy numbers). Even though the relative abundance decreased, the nitrification process performance was not affected because the unchanged absolute abundance of AOB ensured full ammonium removal until day 40.
An immediate decrease in the sludge concentration and an unexpected disturbance of the nitrification process was observed after the sampling was resumed on day 40. In R1, the increase in nitrite concentration on days 43 and 47 implied decreasing NOB activity (Figure 3). The following increase in the ammonium concentration (days 52–54) and a concomitant decrease in the nitrate concentration implied decreasing AOB activity. In R1, the TN removal dropped to as low as 1%, and 28 days were needed for the reactor to fully recover its performance. R2 appeared less sensitive to the disturbance; the nitrite and ammonium concentrations peaked later than in R1 (day 54 and 57, respectively), and the peaks were significantly smaller. In R2, the TN removal only dropped to 30%, and the reactor’s performance recovered within 14 days.
Our hypothesis was that (a) the resumption of the sampling of the reactor content resulted in a dramatic decrease in sludge concentration and hence a reduction of AOB abundance, and (b) that the slow growth rate of the nitrifying bacteria delayed the recovery of the nitrification process. The restart of the regular sampling procedure decreased the biomass content to less than half of the preceding concentrations (Figure 2) in both reactors within 14 days (between days 40 and 54). The removal of the biomass resulted in the elimination of a large part of the AOB community, over 90% and over 70% in R1 and R2, respectively (Figure 4a). In R1, the abundance of NOB decreased by more than 50% from day 40 to day 46; however, in R2, the minor disturbance in nitrite conversion was not a direct consequence of the sludge removal, but likely a result of the fragile balance between the mutualistic guilds of NOB and AOB [32].
The simultaneous shifts in AOB abundance and ammonium turnover suggest that autotrophic nitrification was the main ammonium removal pathway in this study, despite the very low relative abundance of AOB (0.001%–0.09%) in both reactors throughout the experiment.

3.4. Bacterial Community Structure

During the initial 21 days, the microbiome changed rapidly (Figure 5), adapting to the operational conditions in the lab-scale reactors (different from those of the full-scale activated sludge process) and initiating granulation. Diversity, measured as species richness and evenness, decreased during the start-up period (Figure 6). Until day 8, R2 was dominated by two TRFs (TRF 23 and 151, see Figure S4), while R1 exhibited slightly higher diversity (although TRF 23 was still abundant). After day 13, two other TRFs (TRF 54 and 118) appeared in both reactors and they dominated until day 40. On day 40, the resumption of sampling the reactor content likely contributed to the following evolution of the community: the abundance of the dominant TRFs decreased, as well as species diversity increased and continued to increase until the termination of the study period (Figure 6). The dissimilarity between the bacterial community of the seed sludge and that of the granules continued to increase (Figure 5).
During start-up, decreased richness and evenness compared to the seed sludge has been previously reported [16,30]. The decreased diversity is presumably a consequence of the wash-out conditions typical of the start-up in granular sludge reactors. However, the diversity of steady-state granular sludge can be remarkable. In a study by Winkler et al. [33], the microbial community of a pilot-scale steady-state aerobic granular sludge reactor exhibited similar richness and evenness as that for a full-scale activated sludge reactor. Granular sludge provides different ecological niches due to its compact structure and the substrate gradients (which evolve as the granule size increases). The variety of niches together with the high biomass retention time facilitates high species diversity [33]. Therefore, it can be speculated that the increasing diversity after day 40 in the present study is related to an increase in nitrate respiration (denitrification), as indicated by the concomitant decrease in effluent nitrate concentration in R2 (Figure 3d).
Despite the somewhat different start-up conditions, both reactors exhibited a similar trend in richness and evenness (Figure 6), as well as a similar evolution of the bacterial community (Figure 5). This is in contrast to the study by McSwain et al. [15], in which entirely different bacterial communities developed in reactors operated with settling times of 2 min and 10 min. These authors reported that the constant 2 min settling time from the first day of operation resulted in severe biomass wash-out. Hence, the large difference in settling time coupled with biomass wash-out presumably caused different communities to evolve in the work reported by McSwain et al. [15], while in the present study the selection pressure was far more similar in the two reactors.

4. Conclusions

A stepwise decrease in settling time based on the biomass discharge allowed for the selection of a balanced microbial population during wash-out. This resulted in rapid granulation and quick start-up of nitrification in both reactors. The settling time in reactor 2 was decreased more steeply than in reactor 1, resulting in much lower AOB and NOB abundances in R2. However, this did not lead to any noticeable difference in performance as the nitrification process started at the same time in both reactors. The reactors’ performance and the bacterial community composition were strongly affected by an operational disturbance (i.e., the interruption and the subsequent resumption of the biomass sampling), with consequences similar to a severe wash-out, indicating the importance of rigorous control of biomass retention.

Supplementary Materials

The following are available online at www.mdpi.com/2073-4441/8/5/172, Figures S1–S8 and Table S1.

Acknowledgments

This research was funded by a grant from FORMAS (216-2010-1716), The Swedish Research Council for Environment, Agricultural Sciences and Spatial Planning. The funders had no role in study design, in the collection, analysis and interpretation of data, in the writing of the manuscript, or in the decision to submit the article for publication. We thank Fred Sörensson for valuable comments on the manuscript.

Author Contributions

E.Sz., F.P. and B-M.W. conceived and designed the experiments; E.Sz., F.P. and B-M.W. performed the experiments; E.Sz. analyzed the data; M.H. and O.M. contributed reagents/materials/analysis tools; E.Sz., M.H., O.M., F.P and B-M.W. contributed to the writing of the manuscript.

Conflicts of Interest

The authors declare no conflict of interest.

Abbreviations

The following abbreviations are used in this manuscript:
AOBammonium oxidizing bacteria
CODchemical oxygen demand
MLSSmixed liquid suspended solids
MLVSSmixed liquid volatile suspended solids
NMDSnon-metric multidimensional scaling
NOBnitrite oxidizing bacteria
OLRorganic loading rate
qPCRquantitative polymerase chain reaction
SRTsludge retention time
TNtotal nitrogen
TRFterminal restriction fragment
T-RFLPterminal restriction fragment length polymorphism
TSStotal suspended solids

References

  1. Mishima, K.; Nakamura, M. Self-Immobilization of aerobic activated sludge-a pilot study of the aerobic upflow municipal sewage treatment. Water Sci. Technol. 1991, 23, 981–990. [Google Scholar]
  2. Morgenroth, E.; Sherden, T.; van Loosdrecht, M.C.M.; Heijnen, J.J.; Wilderer, P.A. Aerobic granular sludge in a sequencing batch reactor. Water Res. 1997, 31, 3191–3194. [Google Scholar] [CrossRef]
  3. Show, K.-Y.; Lee, D.-J.; Tay, J.-H. Aerobic granulation: Advances and challenges. Appl. Biochem. Biotechnol. 2012, 167, 1622–1640. [Google Scholar] [CrossRef] [PubMed]
  4. Khan, M.Z.; Mondal, P.K.; Sabir, S. Aerobic granulation for wastewater bioremediation: A review. Can. J. Chem. Eng. 2013, 91, 1045–1058. [Google Scholar] [CrossRef]
  5. Bindhu, B.K.; Madhu, G. Selection pressure theory for aerobic granulation-an overview. Int. J. Environ. Waste Manag. 2014, 13, 317–329. [Google Scholar] [CrossRef]
  6. Zhu, L.; Dai, X.; Lv, M.; Xu, X. Correlation analysis of major control factors for the formation and stabilization of aerobic granule. Environ. Sci. Pollut. Res. Int. 2013, 20, 3165–3175. [Google Scholar] [CrossRef]
  7. Adav, S.S.; Lee, D.-J.; Lai, J.-Y. Aerobic granulation in sequencing batch reactors at different settling times. Bioresour. Technol. 2009, 100, 5359–5361. [Google Scholar] [CrossRef]
  8. Qin, L.; Liu, Y.; Tay, J.H. Effect of settling time on aerobic granulation in sequencing batch reactor. Biochem. Eng. J. 2004, 21, 47–52. [Google Scholar] [CrossRef]
  9. Sadrzadeh, F.; Dulekgurgen, E. Improving the settling properties of activated sludge by gradually decreasing the settling time. Desalin. Water Treat. 2014, 52, 2465–2471. [Google Scholar] [CrossRef]
  10. Su, K.Z.; Wang, C.; Fang, H. Cultivation of Aerobic Granular Sludge under Selective Pressure in a Sequencing Batch Reactor. Adv. Mater. Res. 2011, 255, 3037–3041. [Google Scholar] [CrossRef]
  11. Liu, Y.; Tay, J.-H. The essential role of hydrodynamic shear force in the formation of biofilm and granular sludge. Water Res. 2002, 36, 1653–1665. [Google Scholar] [CrossRef]
  12. Sturm, S.M.S.; Irvine, R.L. Dissolved oxygen as a key parameter to aerobic granule formation. Water Sci. Technol. 2008, 58, 781–787. [Google Scholar] [CrossRef]
  13. Tay, J.H.; Liu, Q.S.; Liu, Y. The effect of upflow air velocity on the structure of aerobic granules cultivated in a sequencing batch reactor. Water Sci. Technol. 2004, 49, 35–40. [Google Scholar]
  14. Liu, Y.-Q.; Tay, J.-H. Cultivation of aerobic granules in a bubble column and an airlift reactor with divided draft tubes at low aeration rate. Biochem. Eng. J. 2007, 34, 1–7. [Google Scholar] [CrossRef]
  15. McSwain, B.S.; Irvine, R.L.; Wilderer, P.A. The influence of settling time on the formation of aerobic granules. Water Sci. Technol. 2004, 50, 195–202. [Google Scholar] [PubMed]
  16. Weissbrodt, D.G.; Lochmatter, S.; Ebrahimi, S.; Rossi, P.; Maillard, J.; Holliger, C. Bacterial Selection during the Formation of Early-Stage Aerobic Granules in Wastewater Treatment Systems Operated Under Wash-Out Dynamics. Front. Microbiol. 2012, 3, 332. [Google Scholar] [CrossRef] [PubMed]
  17. Liu, Y.Q.; Kong, Y.H.; Zhang, R.; Zhang, X.; Wong, F.S.; Tay, J.H.; Zhu, J.R.; Jiang, W.J.; Liu, W.T. Microbial population dynamics of granular aerobic sequencing batch reactors during start-up and steady state periods. Water Sci. Technol. 2010, 62, 1281–1287. [Google Scholar] [CrossRef] [PubMed]
  18. Li, A.; Yang, S.; Li, X.; Gu, J. Microbial population dynamics during aerobic sludge granulation at different organic loading rates. Water Res. 2008, 42, 3552–3560. [Google Scholar] [CrossRef]
  19. Zhang, B.; Chen, Z.; Qiu, Z.G.; Jin, M.; Chen, Z.Q.; Chen, Z.L.; Li, J.W.; Wang, X.; Wang, J.F. Dynamic and distribution of ammonia-oxidizing bacteria communities during sludge granulation in an anaerobic-aerobic sequencing batch reactor. Water Res. 2011, 45, 6207–6216. [Google Scholar]
  20. Su, K.-Z.; Ni, B.-J.; Yu, H.-Q. Modeling and optimization of granulation process of activated sludge in sequencing batch reactors. Biotechnol. Bioeng. 2013, 110, 1312–1322. [Google Scholar] [CrossRef] [PubMed]
  21. Tay, J.H.; Liu, Q.S.; Liu, Y. Microscopic observation of aerobic granulation in sequential aerobic sludge blanket reactor. J. Appl. Microbiol. 2001, 91, 168–175. [Google Scholar] [CrossRef] [PubMed]
  22. Standard Methods for the Examination of Water and Wastewater; American Public Health Association: Washington, DC, USA, 1995.
  23. Lane, D.J. 16S/23S rRNA sequencing. In Nucleic Acid Techniques in Bacterial Systematics; Stackebrandt, E., Goodfellow, E., Eds.; John Wiley & Sons Ltd: Chichester, UK, 1991; pp. 115–175. [Google Scholar]
  24. Fredriksson, N.J.; Hermansson, M.; Wilén, B. Tools for T-RFLP data analysis using Excel. BMC Bioinform. 2014, 15, 1–18. [Google Scholar] [CrossRef] [PubMed]
  25. R Core Team. R: A language and environment for statistical computing. R Foundation for Statistical Computing, Vienna, Austria. Available online: http://www.R-project.org/ (accessed on 21 April 2016).
  26. Oksanen, J.; Blanchet, F.G.; Kindt, R.; Legendre, P.; Minchin, P.R.; O’Hara, R.B.; Simpson, G.L.; Peter, S.M.; Henry, H.S.; Helene, W. Vegan: Community Ecology Package. R package version 2.0–10. Available online: http://CRAN.R-project.org/package=vegan (accessed on 21 April 2016).
  27. Clarke, K.R.; Warwick, R.M. Change in Marine Communities : An Approach to Statistical Analysis and Interpretation; PRIMER-E Ltd.: Plymouth, UK, 2001. [Google Scholar]
  28. Liu, Y.; Wang, Z.-W.; Qin, L.; Liu, Y.-Q.; Tay, J.-H. Selection pressure-driven aerobic granulation in a sequencing batch reactor. Appl. Microbiol. Biotechnol. 2005, 67, 26–32. [Google Scholar] [CrossRef] [PubMed]
  29. Zhao, Y.; Huang, J.; Zhao, H.; Yang, H. Microbial community and N removal of aerobic granular sludge at high COD and N loading rates. Bioresour. Technol. 2013, 143, 439–446. [Google Scholar] [CrossRef] [PubMed]
  30. Ebrahimi, S.; Gabus, S.; Rohrbach-Brandt, E.; Hosseini, M.; Rossi, P.; Maillard, J.; Holliger, C. Performance and microbial community composition dynamics of aerobic granular sludge from sequencing batch bubble column reactors operated at 20 °C, 30 °C, and 35 °C. Appl. Microbiol. Biotechnol. 2010, 87, 1555–1568. [Google Scholar] [CrossRef] [PubMed]
  31. Val del Río, Á.; Morales, N.; Figueroa, M.; Mosquera-Corral, A.; Campos, J.L.; Méndez, R. Effect of coagulant-flocculant reagents on aerobic granular biomass. J. Chem. Technol. Biotechnol. 2012, 87, 908–913. [Google Scholar] [CrossRef]
  32. Graham, D.W.; Knapp, C.W.; Van Vleck, E.S.; Bloor, K.; Lane, T.B.; Graham, C.E. Experimental demonstration of chaotic instability in biological nitrification. ISME J. 2007, 1, 385–393. [Google Scholar] [CrossRef] [PubMed]
  33. Winkler, M.K.H.; Kleerebezem, R.; de Bruin, L.M.M.; Verheijen, P.J.T.; Abbas, B.; Habermacher, J.; van Loosdrecht, M.C.M. Microbial diversity differences within aerobic granular sludge and activated sludge flocs. Appl. Microbiol. Biotechnol. 2013, 97, 7447–7458. [Google Scholar] [CrossRef] [PubMed]
Figure 1. Settling time in reactor 1 (R1) and reactor 2 (R2). The settling time was decreased stepwise from 30 min to two min over the first 21 days of the experiment and maintained at two min until the end of the experiment.
Water 08 00172 g001
Figure 2. MLSS concentration in the reactors. The MLVSS concentration varied between 79% and 94% of the MLSS in both reactors.
Water 08 00172 g002
Figure 3. Influent and effluent concentrations of (a) COD; (b) ammonium; (c) nitrite; and (d) nitrate in the reactors.
Water 08 00172 g003
Figure 4. Results of the qPCR analyses. Gene copy numbers of (a) AOB 16S rRNA; and (b) Nitrospira (NOB) 16S rRNA. The y-axis on both graphs is shown in a logarithmic scale.
Water 08 00172 g004
Figure 5. Non-metric multidimensional scaling (NMDS) ordination based on the T-RFLP dataset. Samples are indicated with the identifier of the reactor (R1 or R2) and the number of days since start-up. SS = seed sludge. The black circle marks the period when the community composition was relatively unchanged (after start-up but before the resumption of sampling).
Water 08 00172 g005
Figure 6. bacterial community, as measured by T-RFLP. (a) Richness; and (b) evenness.
Water 08 00172 g006

