Article

Impacts of Climate and Land Use/Cover Change on Streamflow Using SWAT and a Separation Method for the Xiying River Basin in Northwestern China

1
College of Water Resources and Architectural Engineering, Northwest A&F University, Yangling 712100, China
2
Department of Biological & Agricultural Engineering, Texas A&M University, Texas, 77843 TX, USA
*
Author to whom correspondence should be addressed.
Water 2016, 8(5), 192; https://doi.org/10.3390/w8050192
Submission received: 8 March 2016 / Revised: 26 April 2016 / Accepted: 29 April 2016 / Published: 7 May 2016
(This article belongs to the Special Issue Tackling Complex Water Problems in China under Changing Environment)

Abstract

:
A better understanding of the effects of climate change and land use/cover change (LUCC) on streamflow promotes the long-term water planning and management in the arid regions of northwestern China. In this paper, the Soil and Water Assessment Tool (SWAT) and a separation approach were used to evaluate and separate the effects of climate change and LUCC on streamflow in the Xiying River basin. The SWAT model was calibrated by the hydro-meteorological data from 1980–1989 to obtain the optimum parameters, which were validated by the subsequent application to the period between 1990–2008. Moreover, streamflow under several scenarios with different climate change and land use conditions in 1990–2008 and 2010–2069 were further investigated. Results indicate that, in the period of 1990–2008, the streamflow was dominated by climate change (i.e., changes in precipitation and temperature), which led to a 102.8% increase in the mean annual streamflow, whereas LUCC produced a decrease of 2.8%. Furthermore, in the future period of 2010–2039, the mean annual streamflow will decrease by 5.4% and 4.5% compared with the data of 1961–1990 under scenarios A2 and B2, respectively, while it will decrease by 21.2% and 16.9% in the period of 2040–2069, respectively.

1. Introduction

The global hydrological cycles are significantly influenced by the average global land-surface air temperature (LSAT) which has been rising since the late 19th century due to human activities [1,2]. The speed at which climate and land use/cover have changed has accelerated as a direct result of population growth and human-induced economic developments, thereby affecting the interception, infiltration, and evaporation processes of the hydrological cycles in wide spatial and temporal domain [3,4,5,6]. As a result, the generation and distribution of streamflow and water resources are deeply affected due to the changes of precipitation, temperature, and evapotranspiration in the hydrological processes [7,8]. Therefore, a better understanding of the contributions of climate change and land use/cover change (LUCC) to the streamflow contributes to the long-term planning and management of water resources.
Generation mechanisms and flow routing processes of the natural watershed runoff are related to human activities. Thus, the clarification of the driving factors and their impacts on the change of regional runoff has drawn attention from the fields of hydrology, geology, and ecology [3,4,9,10,11,12,13]. Three methods are generally utilized to quantitatively analyze the effects of climate change and LUCC on the characteristics of regional hydrology, including the experimental watershed investigation approach, long time series analysis based on hydro-meteorological data, and simulation based on hydrological models [14,15]. With the further development of computer science and information technology, simulations based on hydrological models are becoming more and more popular due to the advantages of adaptability, convenience, efficiency, and cost saving.
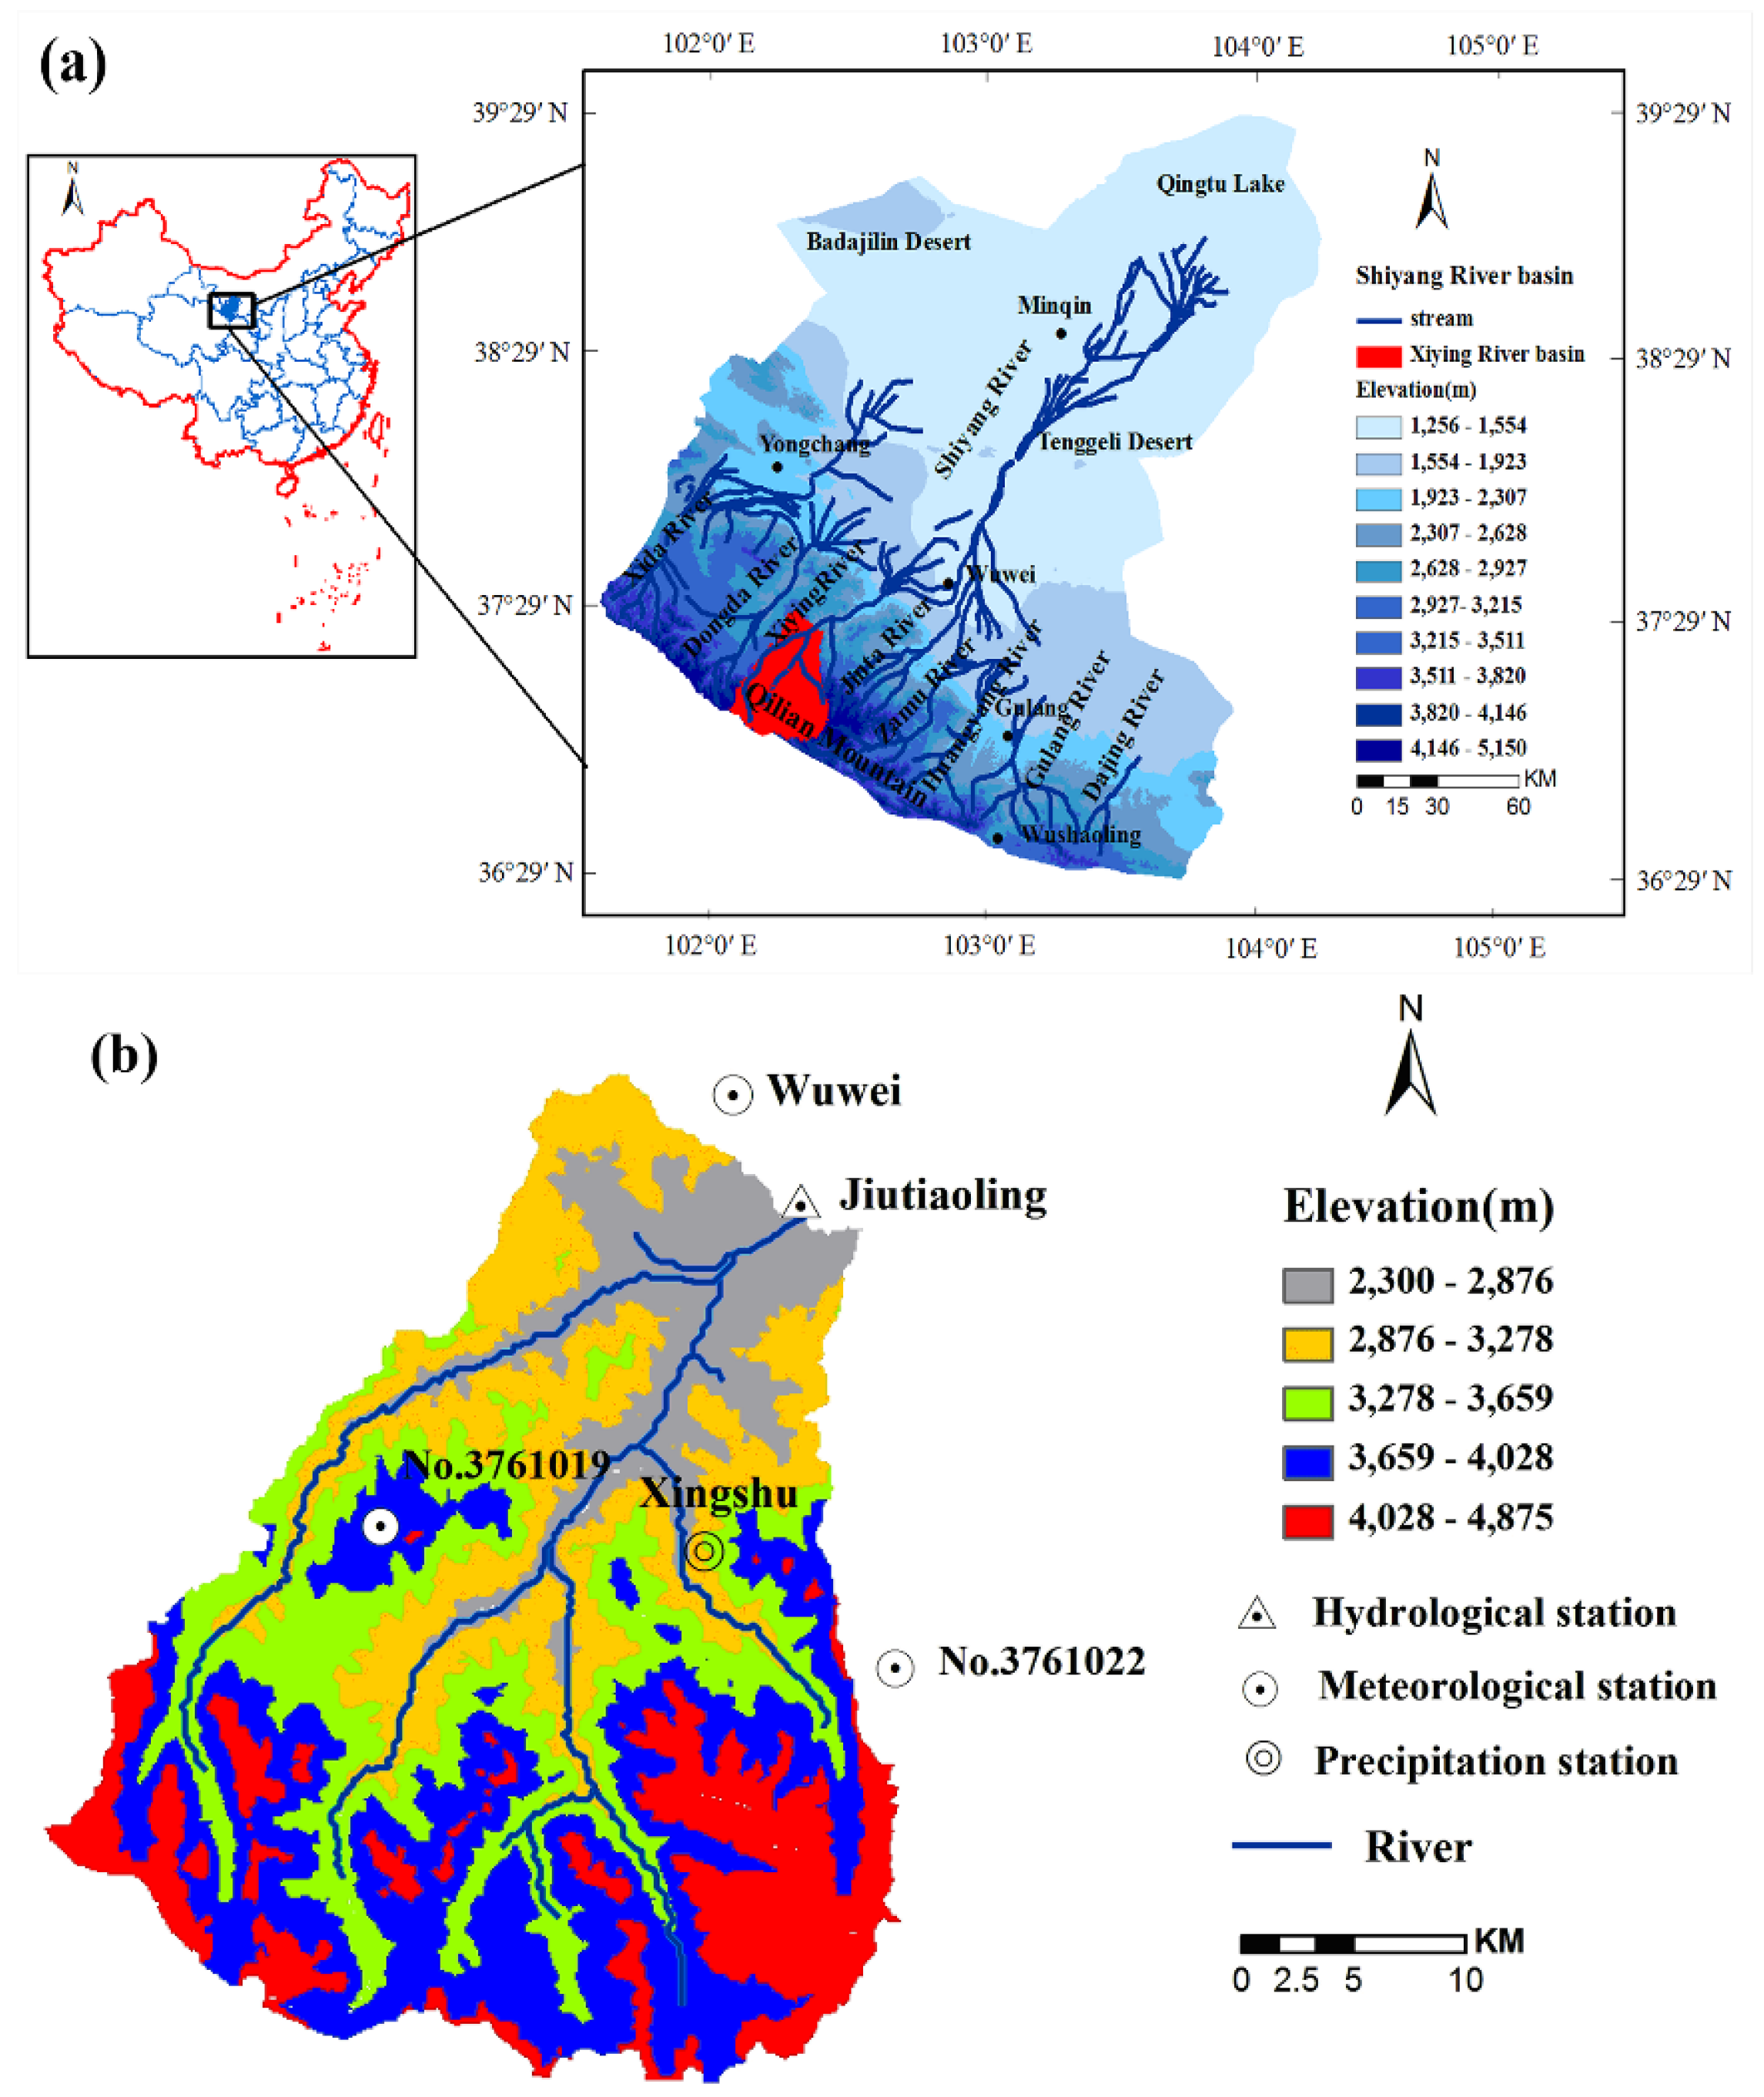
Xiying River basin is one of the eight tributary basins of the Shiyang River basin in northwestern China. It is located in a typical arid inland basin. In this arid region, runoff is generated from the upstream mountainous watersheds and disappears at the plains because of irregular topography and distinctive hydrological systems. Consequently, runoff from the upper reaches directly affects the balance of the ecological system and human activities such as agriculture development in the downstream of the Xiying River basin; as such, it is important to predict streamflow accurately, especially under the influences of global climate change and human activities. However, it is a challenge to simulate streamflow in mountainous contributing areas in respect of complex topography and hydrological processes. Meanwhile, investigations on the quantitative analysis and separation of the impacts of climate change and LUCC on streamflow in this river basin were rarely reported. Li [16] simulated the changing trends of runoff under different climate scenarios using a hydrological statistical method. The influences of precipitation and temperature were investigated by means of an incremental scenario method, showing that the annual runoff of Xida River increased with increasing annual precipitation and decreased with rising annual temperature. However, the future climate and LUCC was not taken into account. Wang et al. [17] analyzed the effects of climate change on streamflow of the Xiying and Zamu rivers in the Shiyang River basin by using regional climate model data from the providing regional climates for impacts studies (PRECIS) under scenarios A2 and B2 based on the SWAT model. Recently, there has been a rapidly increasing number of investigations devoted to the separation of the impacts of climate change and human activities on streamflow using the climate elasticity method based on the Budyko hypothesis [18,19,20]. Mann-Kendall test and change point analysis were applied to identify trends and change points of the hydrometeorological variables, and then the impacts of climate variation and human activities on runoff were further discussed quantitatively utilizing climate elasticity method [21,22,23,24], this research strategy is also can be found in several other references [25,26,27]. Errors introduced by the first-order approximation (first-order Taylor expansion) of the Mezentsev-Choudhury-Yang equation (which is an analytical solution for the coupled water-energy balance on long-term time and catchment scales based on the Budyko hypothesis) were also investigated to improve the theoretical framework [28,29]. However, the climate elasticity method assumes that climate variation and human activities are independent of each other [30], which is different from the fact that human activities would be affected by climate variation in respect to land use and vegetation. Meanwhile, human activities such as extensive urbanization and expanded population may cause changes in climate, such as through increasing greenhouse gas concentration, for example. Moreover, elastic parameter n [31,32], representing the land surface condition, is affected by factors including vegetation coverage, soil properties, topographical features, snow index, and precipitation intensity which would change during the study period, and the value of n is usually determined subjectively based on the Budyko hypothesis. In addition, hydrometeorological variables such as potential evapotransporation (PET), runoff, and actual evapotransporation (AET) may be influenced because a limited number of hydro-meteorological stations can be used in the climate elasticity method which is based on long-term hydro-meteorological observation data.
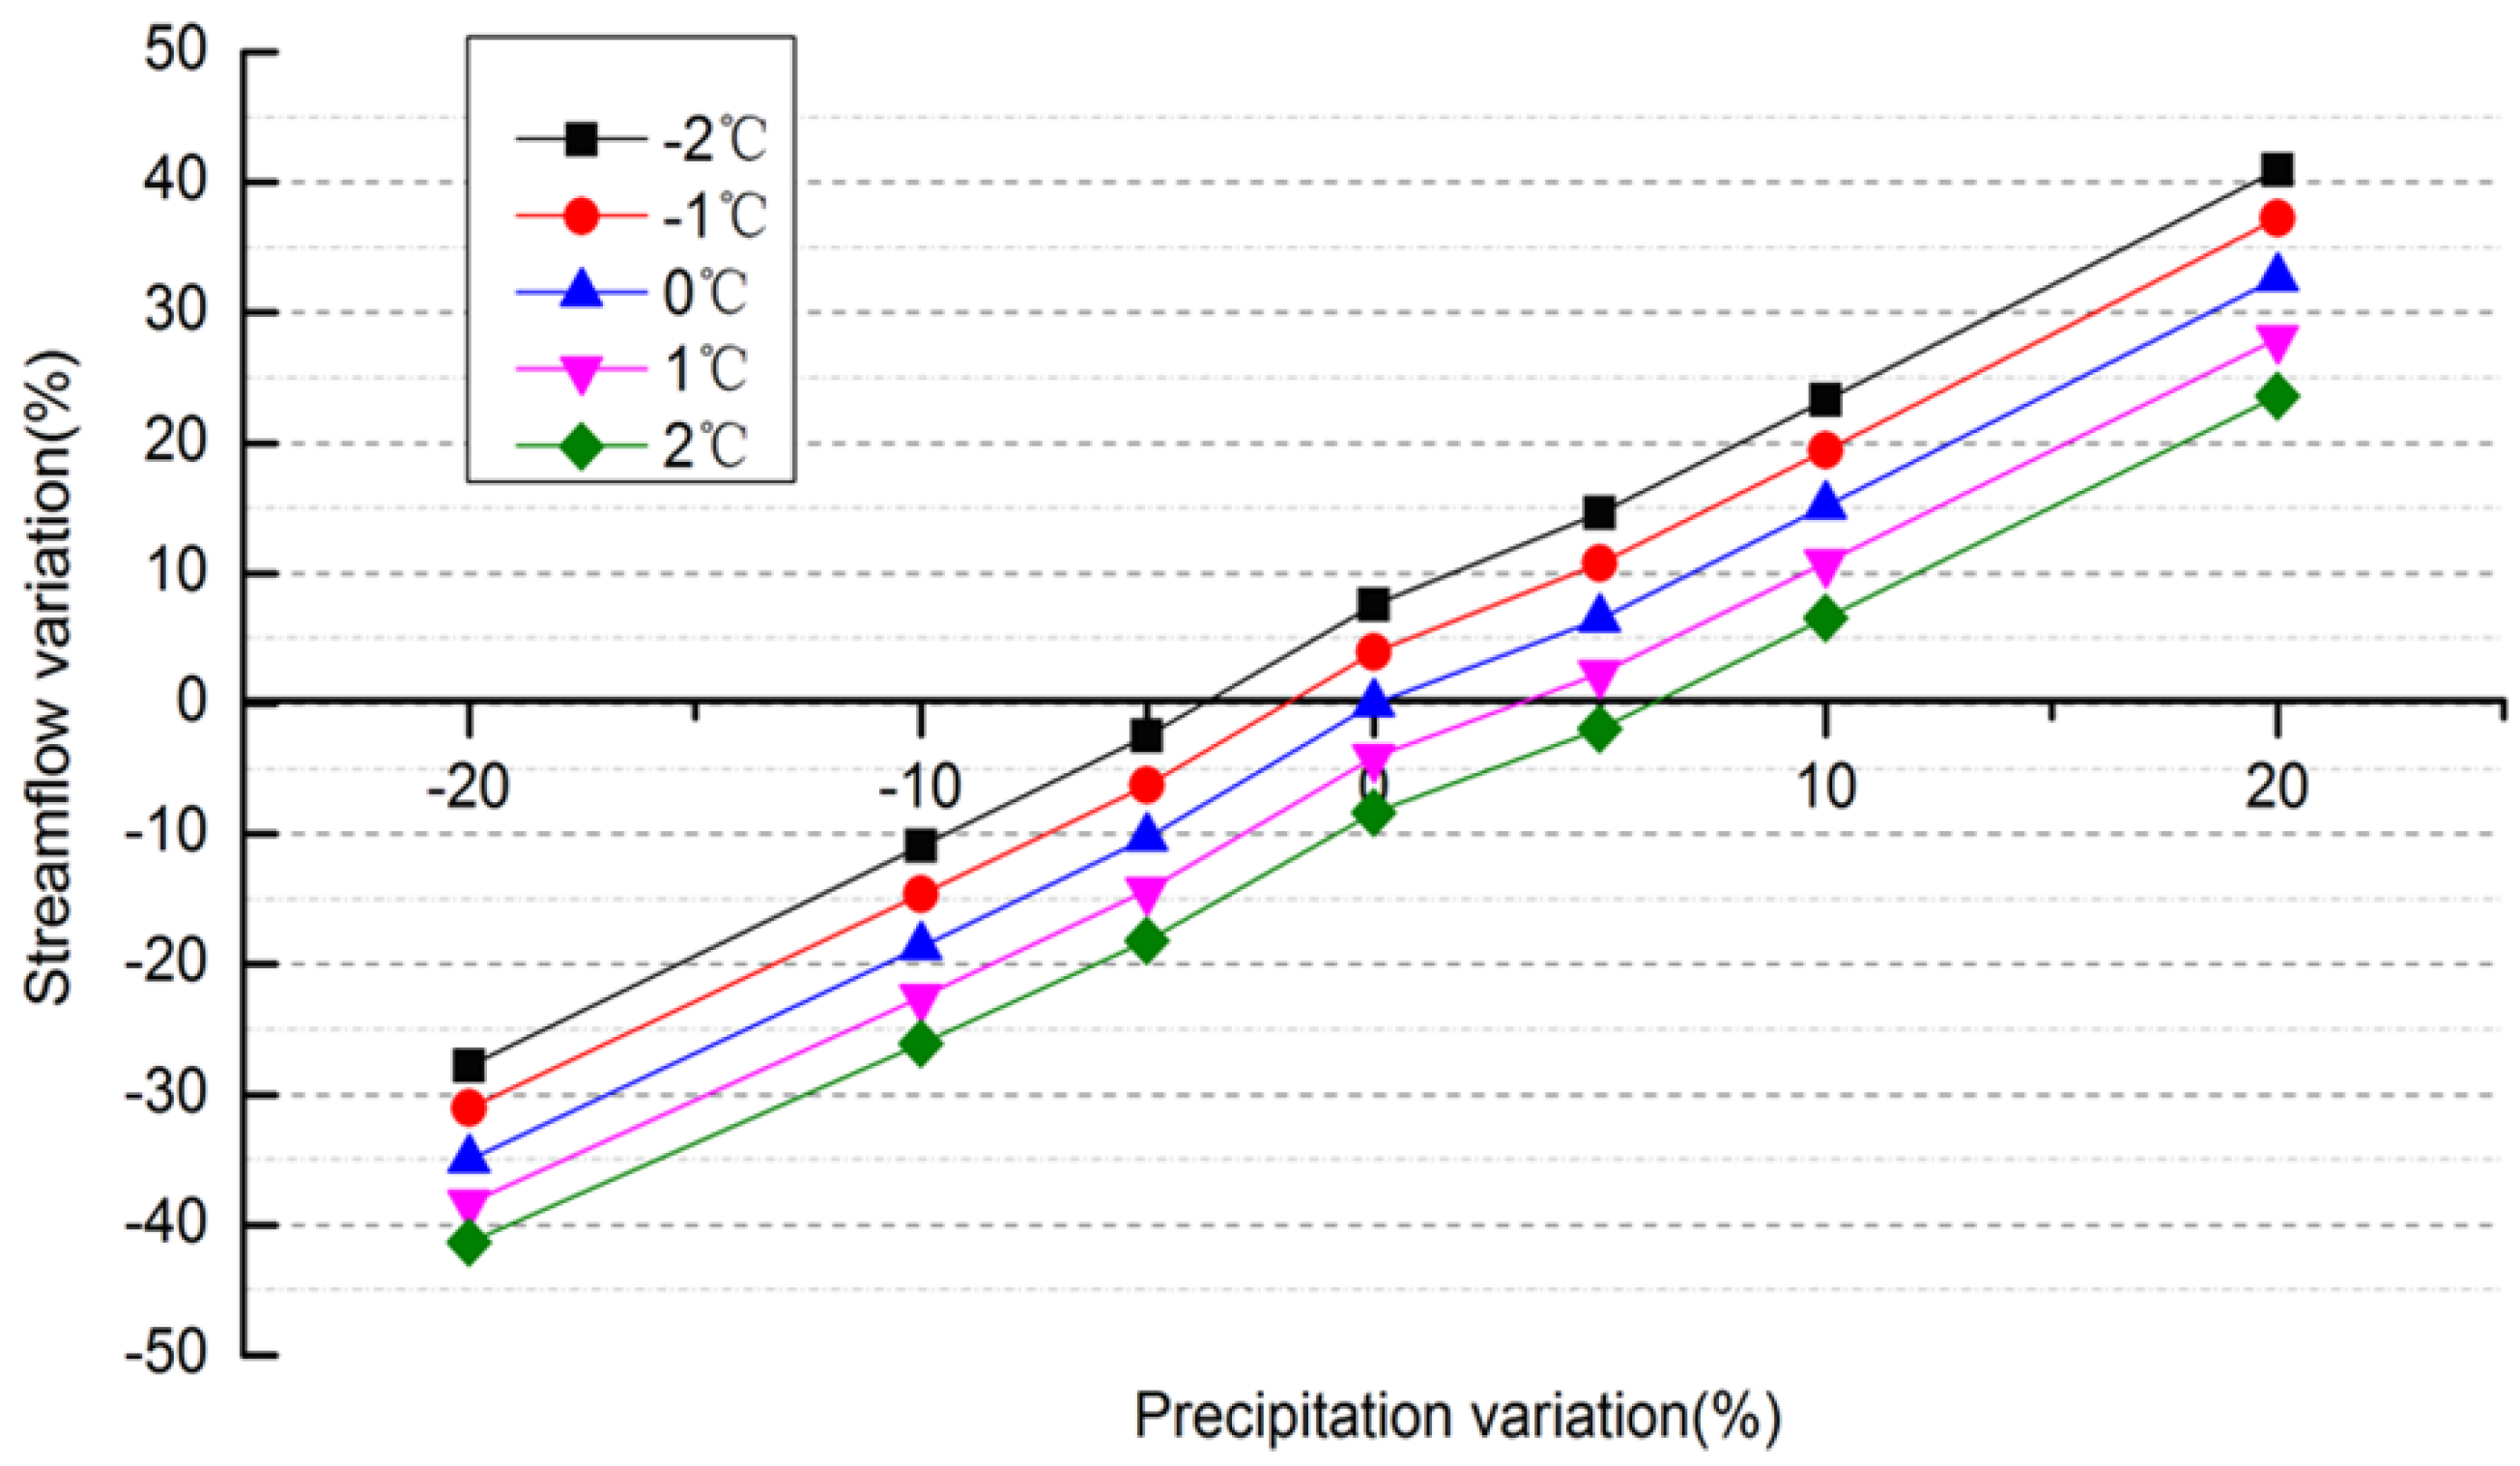
Therefore, the objective of this study is to quantitatively evaluate the impacts of climate change and LUCC on the streamflow in Xiying River basin using SWAT and a hydrological statistical method. Impact factors of n, including the vegetation coverage, soil properties, and topographical features conditions, were taken into consideration in the streamflow simulation by SWAT, and the hydrological statistical method was used to assess the effects of climate change and land use change on streamflow quantitatively. Thus, more accurate results can be obtained by using this research strategy than only using one hydrological statistical method, such as the climate elasticity method which can be easily influenced by the change of land surface condition and other factors. Moreover, three modeling scenarios were considered in detail, including (a) incremental change in precipitation and temperature, (b) four situations consisting of hydro-meteorological data from the periods between 1990–1999 and 2000–2008, and land use data from 2000 and 2008, and (c) projected climate data for 2010–2069 under A2 (medium-high emissions) and B2 (medium-low emissions) scenarios produced by the Hadley Centre coupled model (HadCM3). Subsequently, the individual contribution of climate change and LUCC to the streamflow in the Xiying River basin was analyzed based on the simulation results, and the future dependence of streamflow on the climate change in the Xiying River basin was further obtained and discussed.

2. Materials and Methods

2.1. Meteorological and Hydrological Data Collection

The Xiying River basin covers an area of 1077 km2 and is one of the eight tributaries of the Shiyang River basin (36°29′–39°27′ N, 101°41′–104°16′ E) which is located in Gansu Province and covers an area of 41,400 km2 originating from Qilian Mountain and ending at the Minqin oasis, as shown in Figure 1a. The depth of annual average streamflow is 291 mm and the altitude of the Xiying River basin ranges from 2300 m to 4875 m and with an average altitude of 3493 m, as shown in Figure 1b. The annual average precipitation in the Xiying River basin is 518 mm, however, it is less than 150 mm at the downstream portion of the Shiyang River basin. Xiying River is the largest tributary and accounts for 24% of the total runoff in the Shiying River basin.
The basic data needed for the investigations in this paper consists of seven main parts, including (1) digital elevation model (DEM) data, which was obtained from the topographical data at the scale of 1:250,000 pixel resolution of 90 × 90 m2 [33]; (2) a digital soil map, which was derived from the Harmonized World Soil Database developed by the Food and Agriculture Organization (FAO) and International Institute for Applied Systems Analysis (IIASA), scale of 1:1,000,000 pixel resolution of 1 km × 1 km was used [34]; (3) land use/cover maps, which were extracted from the satellite remote sensing image data of Landsat TM with a scale of 1:100,000 pixel resolution of 30 m × 30 m provided by the Company of Geographical Information Monitoring Cloud Platform, 30 m × 30 m [35], information for the years of 1990, 2000 and 2008 were considered; (4) basic meteorological data, which was made up of precipitation, temperature, wind speed, solar radiation, and relative humidity, obtained from three stations (i.e., the Wuwei weather station (102°42′ E, 37°54′ N) in the meteorological data sharing service system of China [36], No. 3761019 (101°54′ E, 37°42′ N), and No. 3761022 (102°12′ E, 37°36′ N) from the SWAT official website [37] and the Xingshu precipitation station (102°18′ E, 37°43′ N), shown as Figure 1b); (5) monthly streamflow from the period of 1955–2008, which was obtained from the Jiutiaoling hydrological station (102°0′ E, 37°52′ N) at the Hydrology and Water Resources Bureau of Gansu Province; (6) re-analysis data from National Centers (i.e., the National Weather Services for United States) for Environmental Prediction (NCEP) [38], which contains 26 daily atmospheric predictor variables for the period of 1961–2000; (7) daily data from the period of 1961–2099 obtained under A2 and B2 scenarios by HadCM3, which is a coupled atmosphere-ocean general circulation model (AOGCM) developed at the Hadley Centre in the United Kingdom (more details can be obtained in references [39]).
Figure 2 shows the geographic distributions of land use at 1990, 2000, and 2008. It can be noted from Figure 2a that there are ten types of soil in the Xiying River basin; 66.9% of the soil is classified as gelic leptosols and 13.8% is classified as calcic kastanozems. The classifications of land use are listed in Table 1. Moreover, it is found that the main categories are middle covered grassland, unused land, shrubbery, and high covered grassland. The data that has been written in bolded font in Table 1 is to highlight the land use change between different years.

2.2. SWAT Model Combined with a Separation Strategy

Soil and Water Assessment Tool (SWAT) is a watershed-scale and physically based distributed hydrological model [40,41,42] that was developed by the United States Department of Agricultural Research Service (USDA-ARS, 1994) to simulate the impact of land management practices on hydrology and water quality under complex watersheds with heterogeneous soil and land use conditions. In recent decades, it has been widely used for water cycle simulation and water resources management, especially for the analysis of streamflow variation under climate change and LUCC [43,44]. Moreover, SWAT can also be used to predict the impact of future climate on the evolution of water resources and streamflow under different preset scenarios of climate [45,46]. The future climate conditions can be obtained from the general circulation models (GCMs) developed by the Intergovernmental Panel on Climate Change (IPCC) [46,47], thus the effects of different future climate conditions can be further discussed for different drainage basins.
In the SWAT model, hydrological cycle simulation proceeds in two steps: runoff generation and its confluence in the river channels. To generate runoff, a watershed is firstly divided into several sub-basins, each of which is composed of one to several hydrological response units (HRUs) that consist of homogeneous land use, topographical, and soil characteristics. Threshold values for land use, soil types, and slope are setup to remove the insignificant land use, soil type, and slope in each sub-basin, thereby avoiding the generation of a large number of HRUs. Next, the river network connects the discharge produced in sub-basins on the basis of the water balance equation and water flows through the river channels and towards the basin outlet [40,42].
The optimum parameters of the SWAT model can be determined by sensitivity analysis, which assesses the sensitivity between a parameter and other parameters in different areas. The set of parameters can be selected with respect to their physical implications [48,49] or SWAT documentation [42]. Regional optimum results may be obtained because the same sensitivity analysis method is used for different areas [50,51]. Therefore, the parameters related to surface runoff, soil water, and groundwater are ranked according to their sensitivities to streamflow. For simplification, the uncertainty and sensitivity of the parameters can be analyzed by the SWAT Calibration and Uncertainty Procedures (SWAT-CUP) software using the Program of Parameter Solution (ParaSol) associated with a complex-shaped reorganization algorithm (i.e., SCE-UA) for global optimization of the objective function or the minimum criterion [52,53]. SWAT-CUP can be obtained from the official website of SWAT [37].
To evaluate the errors between the simulation results and measured streamflow data that may be introduced by the initial model structure and input data, the performance of the SWAT model can be evaluated based on the visual comparison and statistical criteria such as correlation coefficient (R), the Nash and Sutcliffe model efficiency coefficient [54], and root mean square error [55], and the NSE of calibration is classified according to the scheme (0.75 < NSE ≤ 1.00 very good; 0.65 < NSE < 0.75 good; 0.50 < NSE < 0.65 satisfactory; NSE ≤ 0.50 unsatisfactory) for the goodness of fit [56].
N S E = 1 i = 1 N ( Q m _ i Q s _ i ) 2 / i = 1 N ( Q m _ i Q ¯ ) 2
R M S E = 1 N i = 1 N ( Q m _ i Q s _ i ) 2
where Q m _ i and Q s _ i are the measured and simulated streamflow of the ith month in the studied period, respectively. Q ¯ is the averaged monthly streamflow obtained from Q m _ i and N is the total number of the months.
In this paper, the SWAT model is combined with a separation method which is proposed to separate the contributions of climate change and LUCC to the streamflow. Simulation results and measured data under different conditions of climate and land use can be compared using this strategy. For instance, taking two conjoint periods (defined as period I and II) and two land use conditions (defined as land use A and B) into consideration, four annual streamflow can be obtained under four conditions with different climate change and LUCC in the SWAT simulation, as following: Q 1 for period I and land use A; Q 2 for period I and land use B; Q 3 for period II and land use A; Q 4 for period II and land use B. Therefore, the difference between Q 1 and Q 2 is caused by the different conditions of land use, defined as Δ Q L , the difference between Q 1 and Q 3 is caused by the different conditions of climate, defined as Δ Q C , and Δ Q is used to evaluate the difference caused by both climate and land use change, here the difference between Q 1 and Q 4 is used, and yields:
Δ Q L = Q 2 Q 1
Δ Q C = Q 3 Q 1
Δ Q = Q 4 Q 1
Δ Q m = Q L + Q C
Theoretically, Δ Q = Δ Q m . Subsequently, the impact of climate change on streamflow η C and that of land use change η L can be separately calculated by
η C = ( Δ Q C / Δ Q m ) × 100 %
η L = ( Δ Q L / Δ Q m ) × 100 %

2.3. Simulation Procedure and Parameter Setting

Herein, the non-parametric Kendall trend test [57,58] was firstly used to detect the variation tendencies of precipitation, temperature, and streamflow in the Xiying River basin in the periods between 1955–2008 and 1990–2008. Secondly, the calibration and validation of the precipitation-streamflow process in the Xiying River basin were carried out using the SWAT model, and the effects of climate change and LUCC on streamflow were quantitatively analyzed and separated by the separation method. Next, investigations with three preset scenarios were performed, including (a) incremental climate change, (b) combined change in climate and land use, and (c) climate projections scenario A2 (medium-high emissions) and B2 (medium-low emissions) of HadCM3. Finally, the impacts of different scenarios on streamflow were obtained and further discussed.
In detail, the Xiying River basin was divided into 15 sub-basins and 301 HRUs. To define HRUs, threshold values of 5% and 10% were chosen for land use/soil type and slope, respectively. Meteorological data from the period of 1980–1989 and land use data from 1990 were used for the calibration of the SWAT model followed by the validation of the SWAT model using the meteorological data from the period of 1990–2008 and land use data from 2000. The Jiutiaoling hydrologic station was selected as the outlet of the entire basin. The surface streamflow was calculated by a modified Soil Conservation Service (SCS) curve number method [59]. The potential evapotranspiration and channel routing was estimated and simulated by the Penman-Monteith method and a variable storage method, respectively.
For the preset scenario (a), 35 intersect combinations of precipitation and temperature were assumed in the period of 2000–2008 (i.e., the incremental values of temperature −2 °C, −1 °C, 0 °C, 1 °C, and 2 °C, and precipitation −20%, −10%, −5%, 0, 5%, 10%, and 20%. For the preset scenario (b), four conditions with different climate change and LUCC were setup, including (1) meteorological data from 1990–1999 and land use data from 2000, (2) meteorological data from 1990–1999 and land use data from 2008, (3) meteorological data from 2000–2008 and land use data from 2000, (4) meteorological data from 2000–2008 and land use data at 2008. For the preset scenario (c), HadCM3 was used to provide future climate data, which was predicted in three steps as (1) establish a statistical function between the selected predictand from meteorological stations and that from the predictors by screening the 26 kinds of daily atmospheric predictor variables in the period from 1961–2000 from NCEP based on the statistical downscaling model (SDSM) which is used to obtain the daily weather series (for details, see reference [60]); (2) model calibration and statistical analyses; and (3) downscale predictand, generate the daily climate variables corresponding to scenarios from HadCM3 by its predictors based on the calibrated SDSM model [61]. A2 and B2 scenarios with HadCM3 in the period of 2010–2069 were chosen to give different climate change conditions, and SDSM was used to downscale future climate variables including precipitation, maximal and minimum temperatures, wind speed, humidity, and radiation.

3. Results and Discussion

3.1. Trends in Precipitation, Temperature, and Streamflow

The long-term precipitation, temperature, and streamflow in the periods of 1955–2008 and 1990–2008 for the Xiying River basin were analyzed using the Non-parametric Kendall trend test, which has been used in the hydro-climatic time series analysis [62]. It needs to be noted that the temperature is an arithmetic mean value of the maximum temperature and the minimum temperature in the statistical zone. Figure 3 shows the annual variability of precipitation, temperature, and streamflow, and Table 2 lists the corresponding change trends, where α is the significant level, set as 0.05, and the critical test value U α / 2 is 1.96. It is obvious that statistically insignificant downward trends can be found for both precipitation and streamflow, whereas an obvious upward trend in mean temperature can be observed in the period from 1955–2008. However, in the period from 1990–2008, all the three variables show statistically significant upward trends. Results suggest that the climate is getting warmer and slightly wetter in the Xiying River basin.

3.2. Sensitivity Analysis and Runoff Simulation

Table 3 shows the parameters obtained by sensitivity analysis. As can be seen from Table 3, the most sensitive parameters were obtained as ALPHA_BF (baseflow recession constant), GW_DELAY (delay time for aquifer recharge), GWQMN (threshold water level in shallow aquifer for base flow), CN2 (moisture condition II curve number), and CH_K2 (channel effective hydraulic conductivity). Therefore, the values of the five parameters for the calibration of the SWAT model were further determined in the value ranges.
Figure 4 shows the comparison between the measured and simulated monthly streamflow in the periods of calibration and validation. The performance of the SWAT model was evaluated by R, NSE, and RMSE for the two periods according to Eqations. (1) and (2), the values of R, NSE, and RMSE were determined as 0.90, 0.79, and 4.14 for the calibration period, and 0.89, 0.77, and 4.98 for the validation period, respectively. Therefore, a satisfactory performance was reached in the period of validation when the calibrated SWAT model was applied to predict the time-process and magnitude of streamflow in the Xiying River basin according to the NSE classified scheme, suggesting that a good agreement has been achieved between the simulation results and the measured monthly streamflow in the Xiying River basin.

3.3. Effects of Climate Change and LUCC on Streamflow

Figure 5 shows the effects of precipitation and temperature on streamflow under the preset scenario (a). As can be seen from Figure 5, streamflow decreases with increasing temperature when precipitation keeps constant, while streamflow increases as precipitation increases when temperature keeps invariant. Furthermore, streamflow increases by 40.97% when temperature decreases by 2 °C and precipitation increases by 20%, while it is reduced by 41.36% if temperature increases by 2 °C and precipitation decreases by 20%. It also can be noted that streamflow experiences larger increases with greater precipitation when temperature decreases, which can be interpreted by the fact that precipitation is the main source of the streamflow in the Xiying River basin. In addition, evapotranspiration accounts for the most part of water losses, which is related to temperature directly.
Furthermore, the effects of climate change and LUCC on streamflow were distinguished by simulations under four conditions defined by the preset scenario (b). Results are shown in Table 4. It can be easily observed from Table 4 that streamflow under condition (2) is 2.16 mm less than that under condition (1), as caused by the different land uses from 2000 and 2008. Meanwhile, streamflow under condition (3) is 79.4 mm more than that under condition (1), as caused by the different climate conditions in the periods from 1990–1999 and 2000–2008. Compared with condition (1), an increase in precipitation by a value of 93 mm and an increase in temperature by a value of 0.9 °C are obtained under condition (3), as a result, streamflow increases by 32%. The response of the streamflow to climate change is consistent with that shown in Figure 5. Additionally, streamflow under condition (4) is greater than that under condition (1) by a value of 77.24 mm, which is contributed by both climate change and LUCC, accounting for 102.8% and −2.8%, respectively. Results indicate that climate change is the major factor influencing the streamflow in the period from 1990–2008; a similar conclusion was drawn by Ma et al. [14]. It is consistent with the insignificant LUCC from 2000 and 2008 in the Xiying River basin, which can be found in Table 1.
To find out the potential influences of future climate conditions, such as temperature and precipitation, on the hydrologic characteristics in the Xiying River basin, investigations on the trends of future precipitation, temperature, and streamflow series under scenarios A2 and B2 in the periods of 2010–2039 and 2040–2069 were performed. Table 5 shows the future streamflow, precipitation, and temperature in the Xiying River basin, where it can be observed that the precipitation and the streamflow show a significant downward trend in the two periods. In addition, the minimum temperature decreases by 0.09 °C and the maximum temperature increases by 1.24 °C under scenario A2 in the period between 2010–2039, whereas both increase slightly in the period between 2040–2069. However, increases in both the maximum and minimum temperatures under scenario B2 are observed in the period between 2010–2069. A decrease in precipitation and an increase in temperature were previously observed between 1955–2008. Compared with the data in the period from 1961–1990, the mean annual streamflow decreases by 5.4% and 4.5% under scenarios A2 and B2 in the period between 2010–2039, respectively, while, the decreases are 21.2% and 16.9% in the period between 2040–2069, respectively. Moreover, the decrease of streamflow under A2 is larger than that under B2 for both two periods.

4. Conclusions

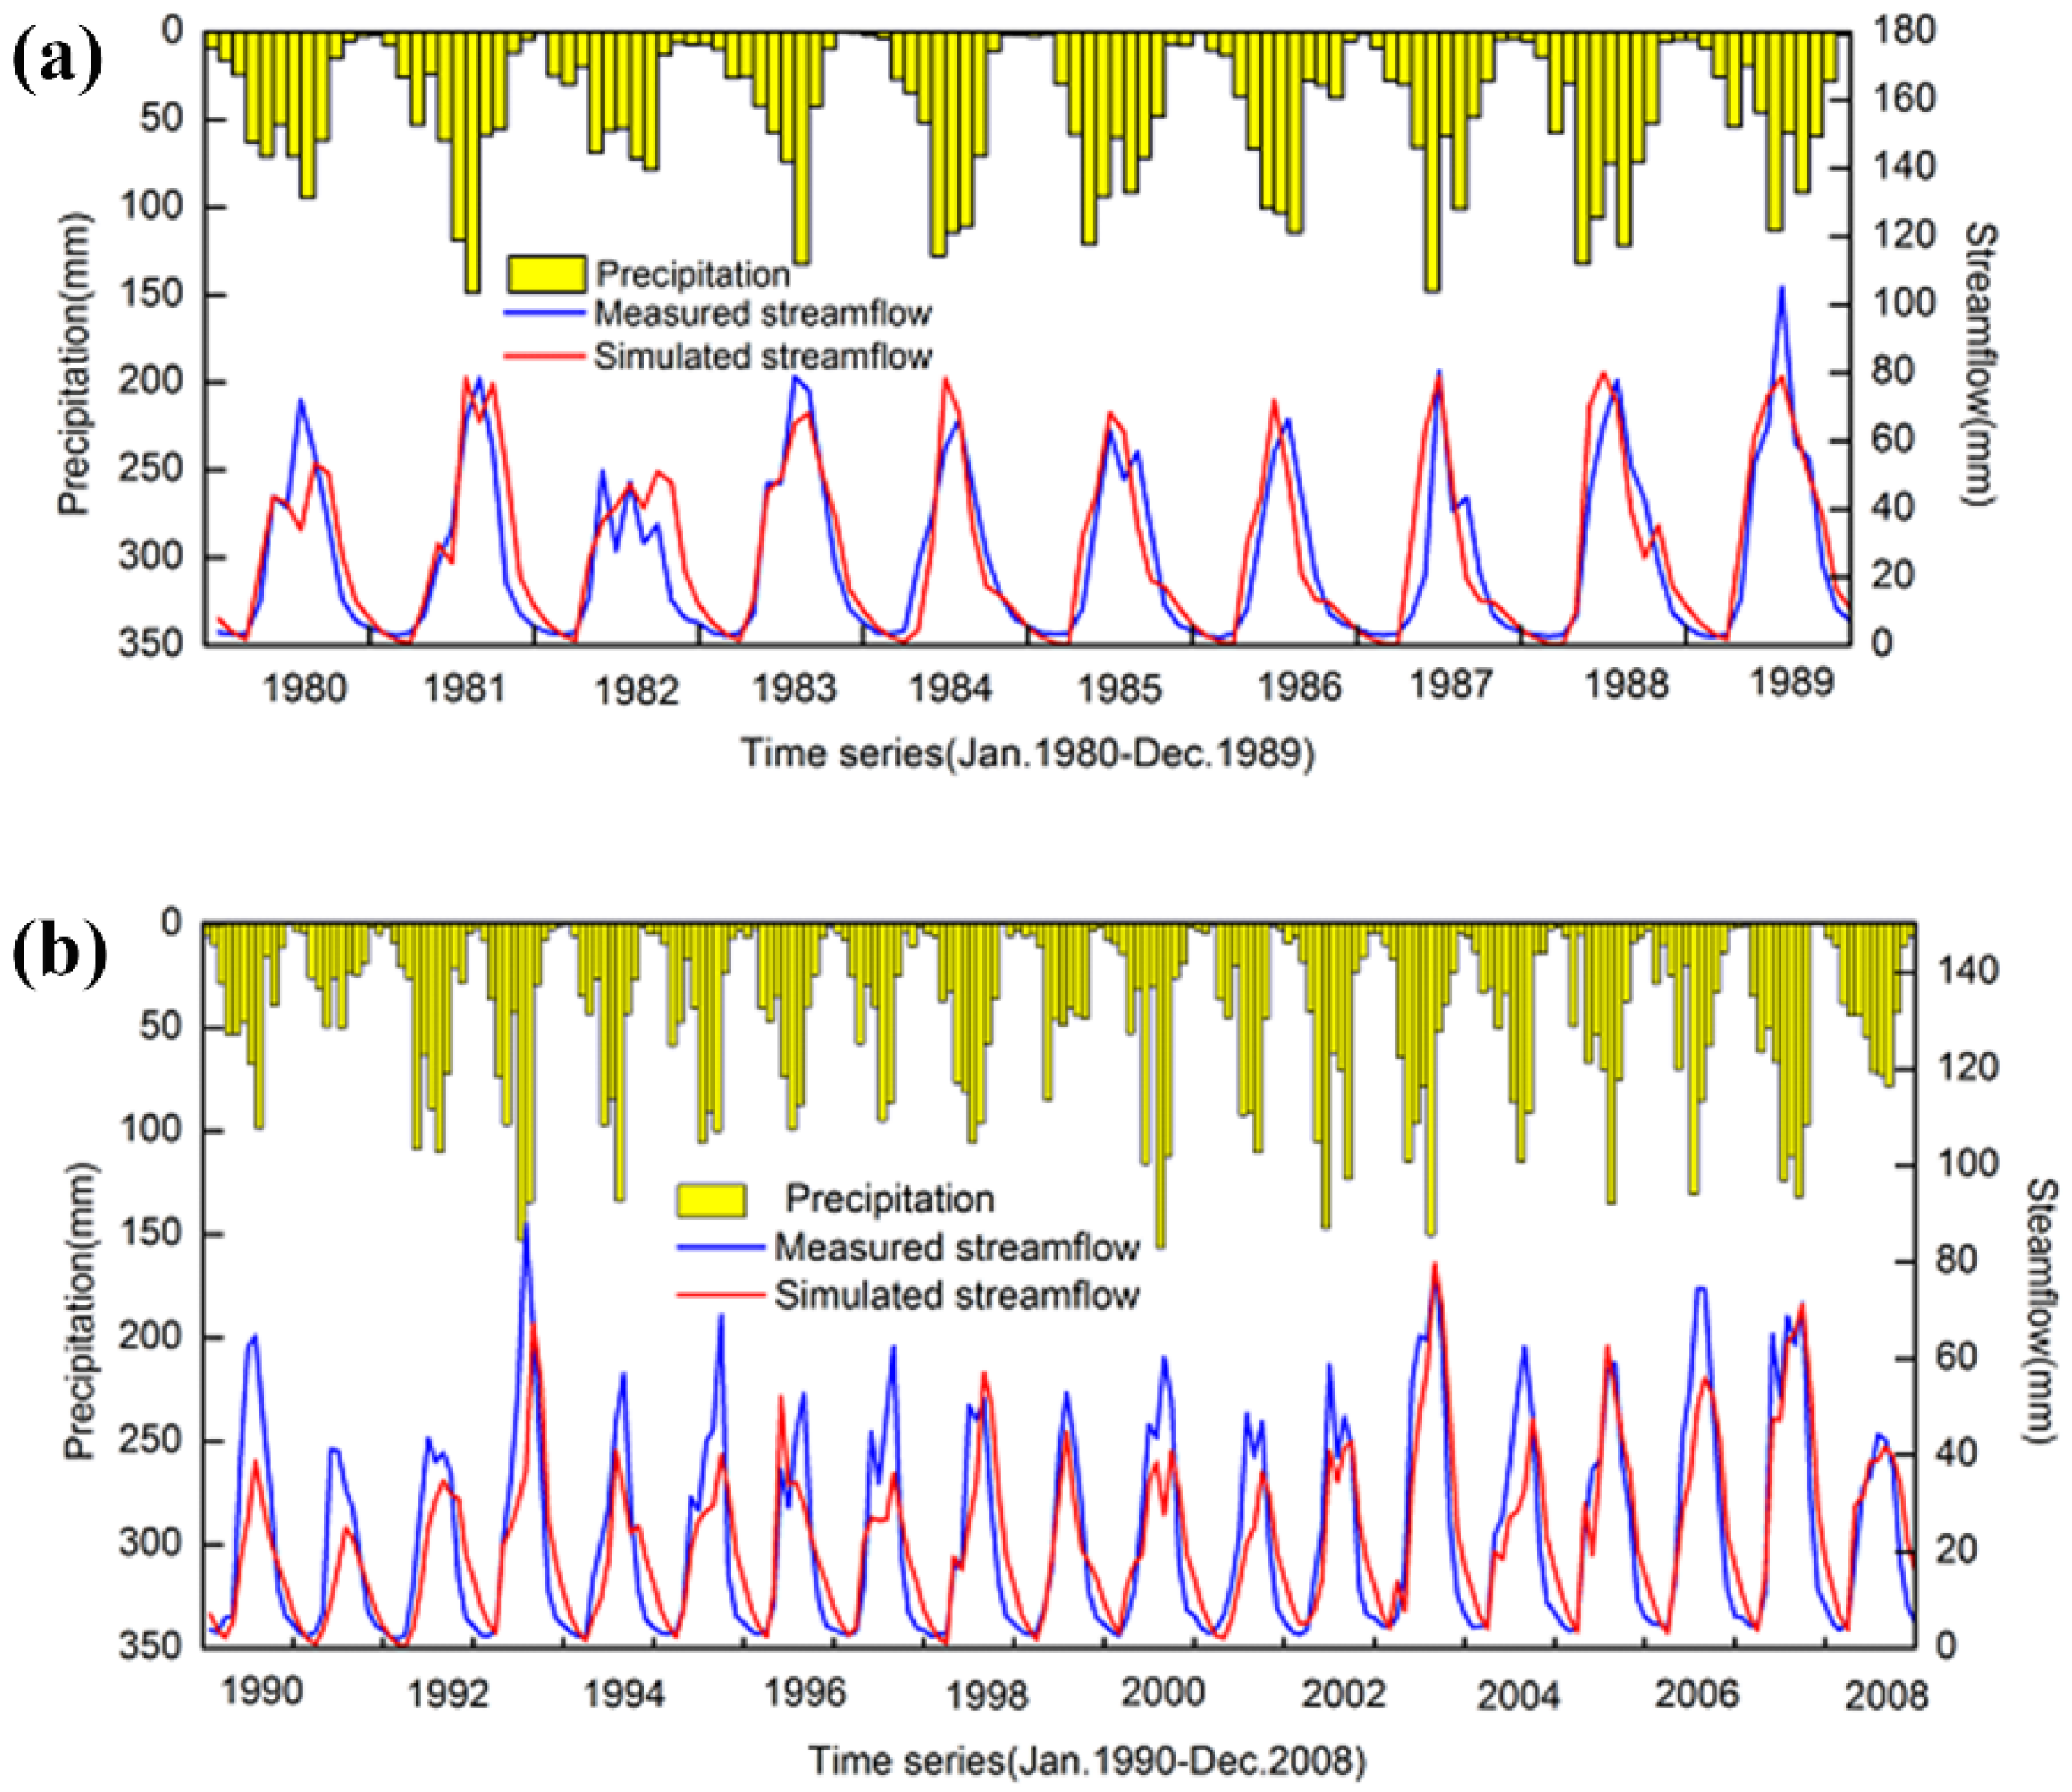
SWAT is a useful tool for evaluating the effects of climate change and land use change on the streamflow in an arid region (i.e., the Xiying River basin) when combined with a hydrological statistical method. Although land use changes in the Xiying River basin were minor during past years due to high altitudes, the effects of climate change and LUCC on streamflow are quantitatively analyzed. The findings from this work can be applied to distinguish the effects of climate change and land use change on streamflow in other high elevation mountainous areas with similar hydro-physiographic constraints, providing a feasible method for studies considering global climate change or extreme events which could happen in the future. As described in the paper, streamflow will decrease in the future because of an increase in precipitation and a decrease in temperature, but evapotranspiration is influenced not only by abiotic factors (i.e., soil and climate) but also by the water-use strategy of established vegetation under drought conditions; as a result, the decrease of streamflow in the future would be influenced by the change of evapotranspiration which is affected by plant water-use efficiencies if there is a large change of land use. Meanwhile, the spatial distribution of elements such as evapotranspiration and soil water could be analyzed when necessary. Therefore, it would be important to understand how factors in water circulation system impact an ecosystem. Nevertheless, this study is still useful as it gives an indication of streamflow sensitivity to climate changes in the Xiying River basin.
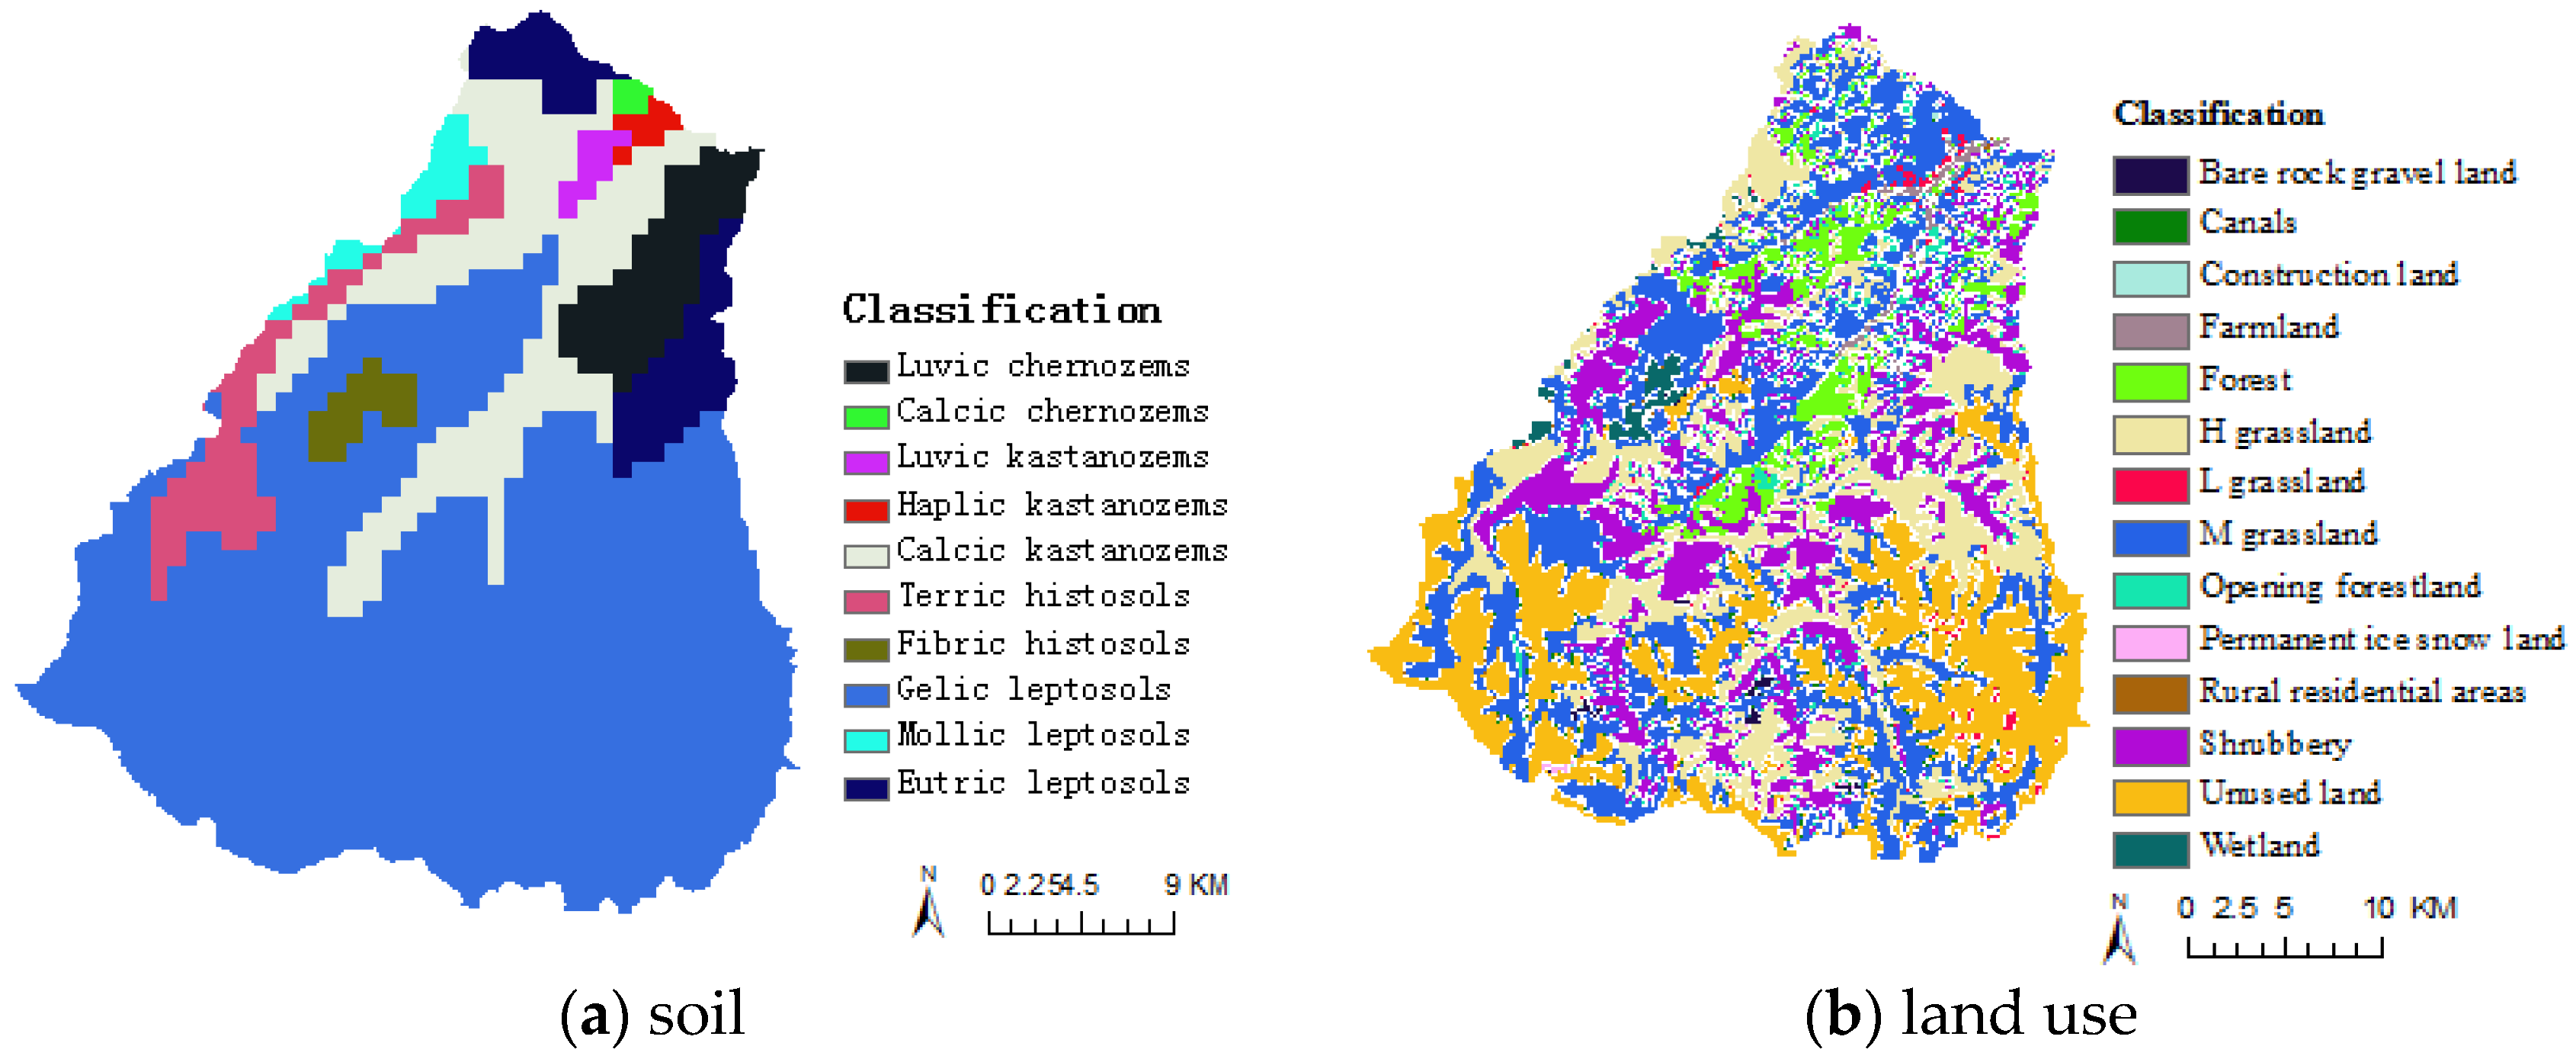
However, uncertainties still exist when just using HadCM3 to analyze the effects of climate change on streamflow. In a future study, the use of multiple climate model projections should be strengthened for uncertainty analysis. Additionally, it also needs to be noticed that input data can introduce uncertainties into SWAT simulations, especially the inadequate information of climate caused by uneven distribution of meteorological stations in the studied area which possesses a special topography. Meanwhile, there are ten layers of soil in the soil module of SWAT, which was designed for North America, but the attributes of soil data for China are not sufficiently accurate. Insufficient input data in the studied area should be further rectified. A better understanding of uncertainty analysis will be helpful for efficient use of hydrological models to thoroughly understand the problem of streamflow under climate change or other extreme events. Finally, conclusions are drawn as follows:
  • The five most sensitive parameters were obtained as ALPHA_BF, GW_DELAY, GWQMN, CN2, and CH_K2 according to the sensitivity analysis, and values of the five parameters were determined for the following SWAT simulations.
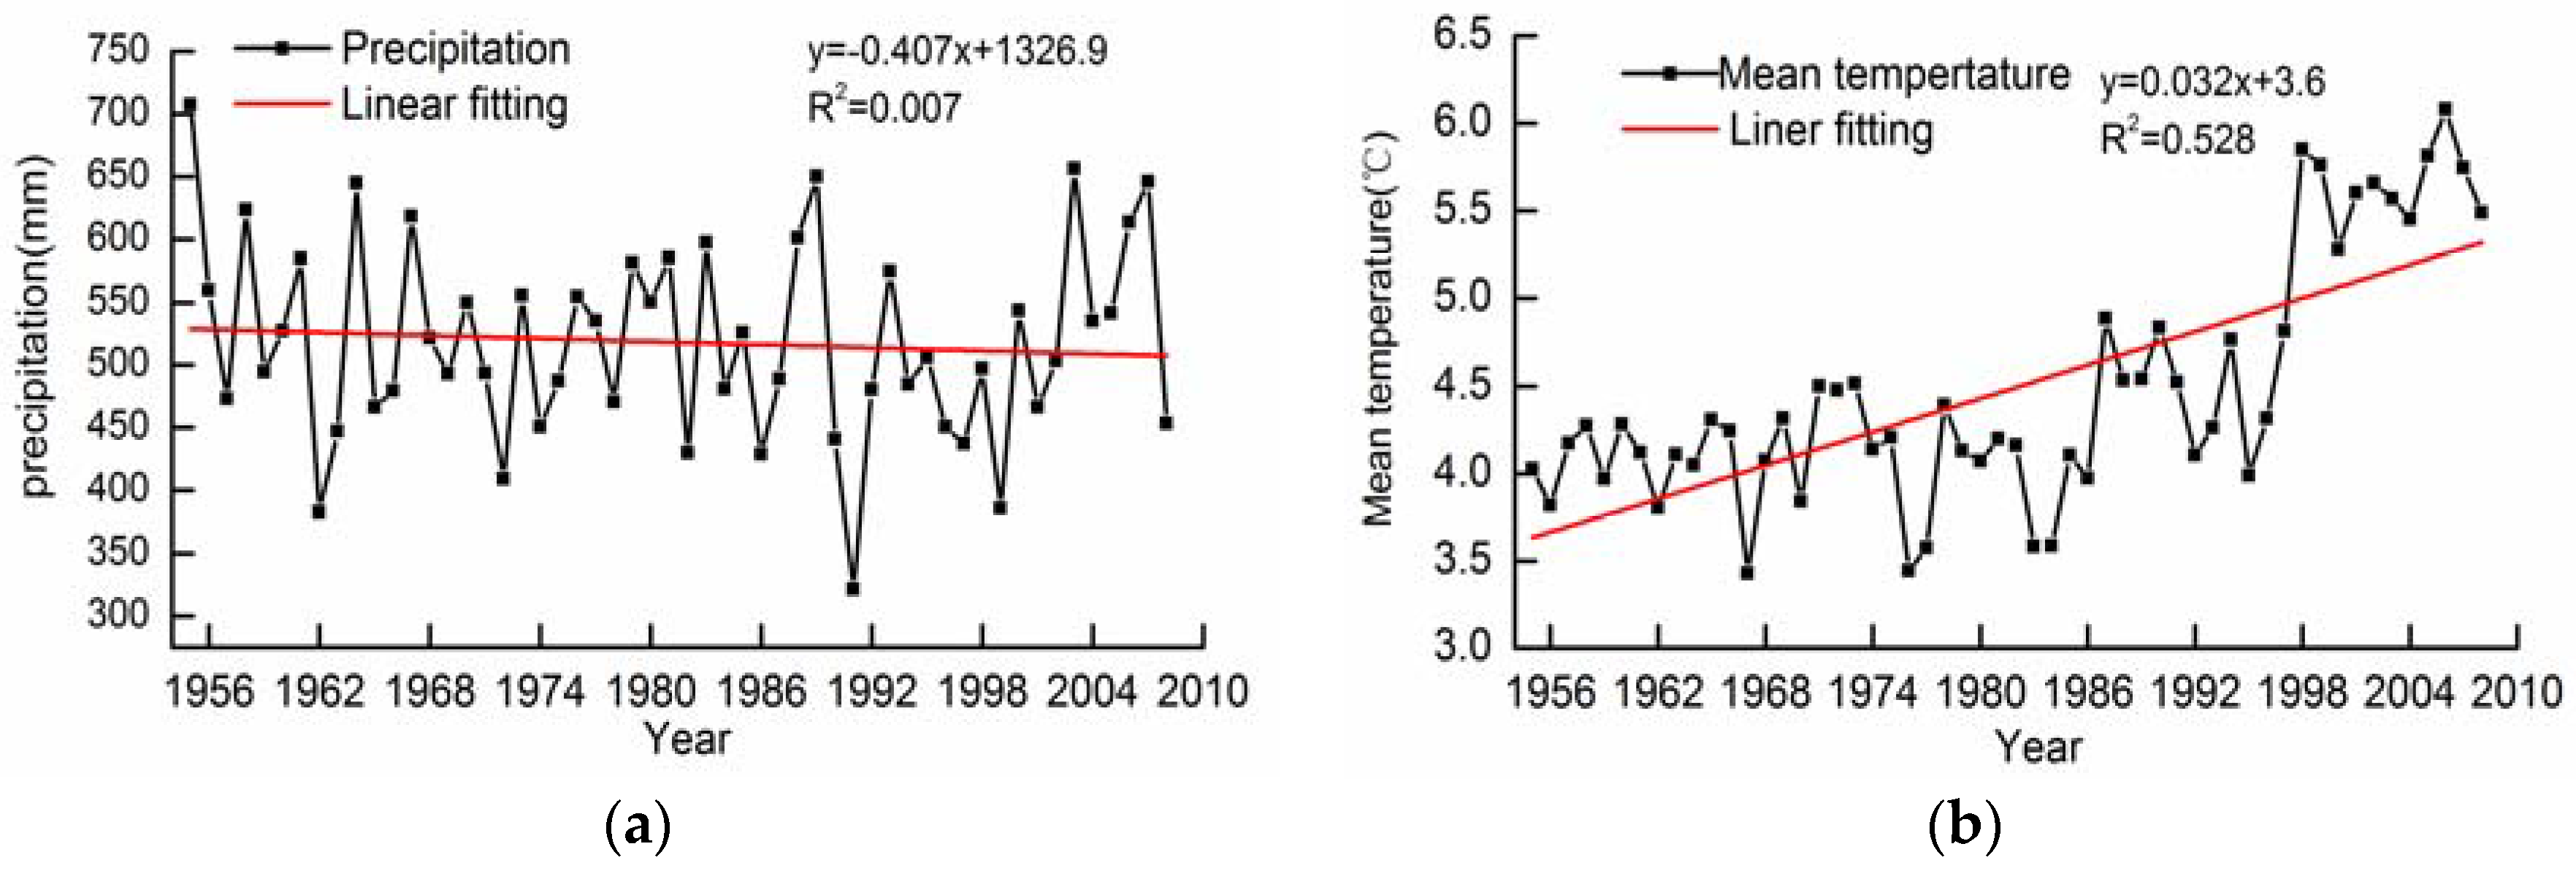
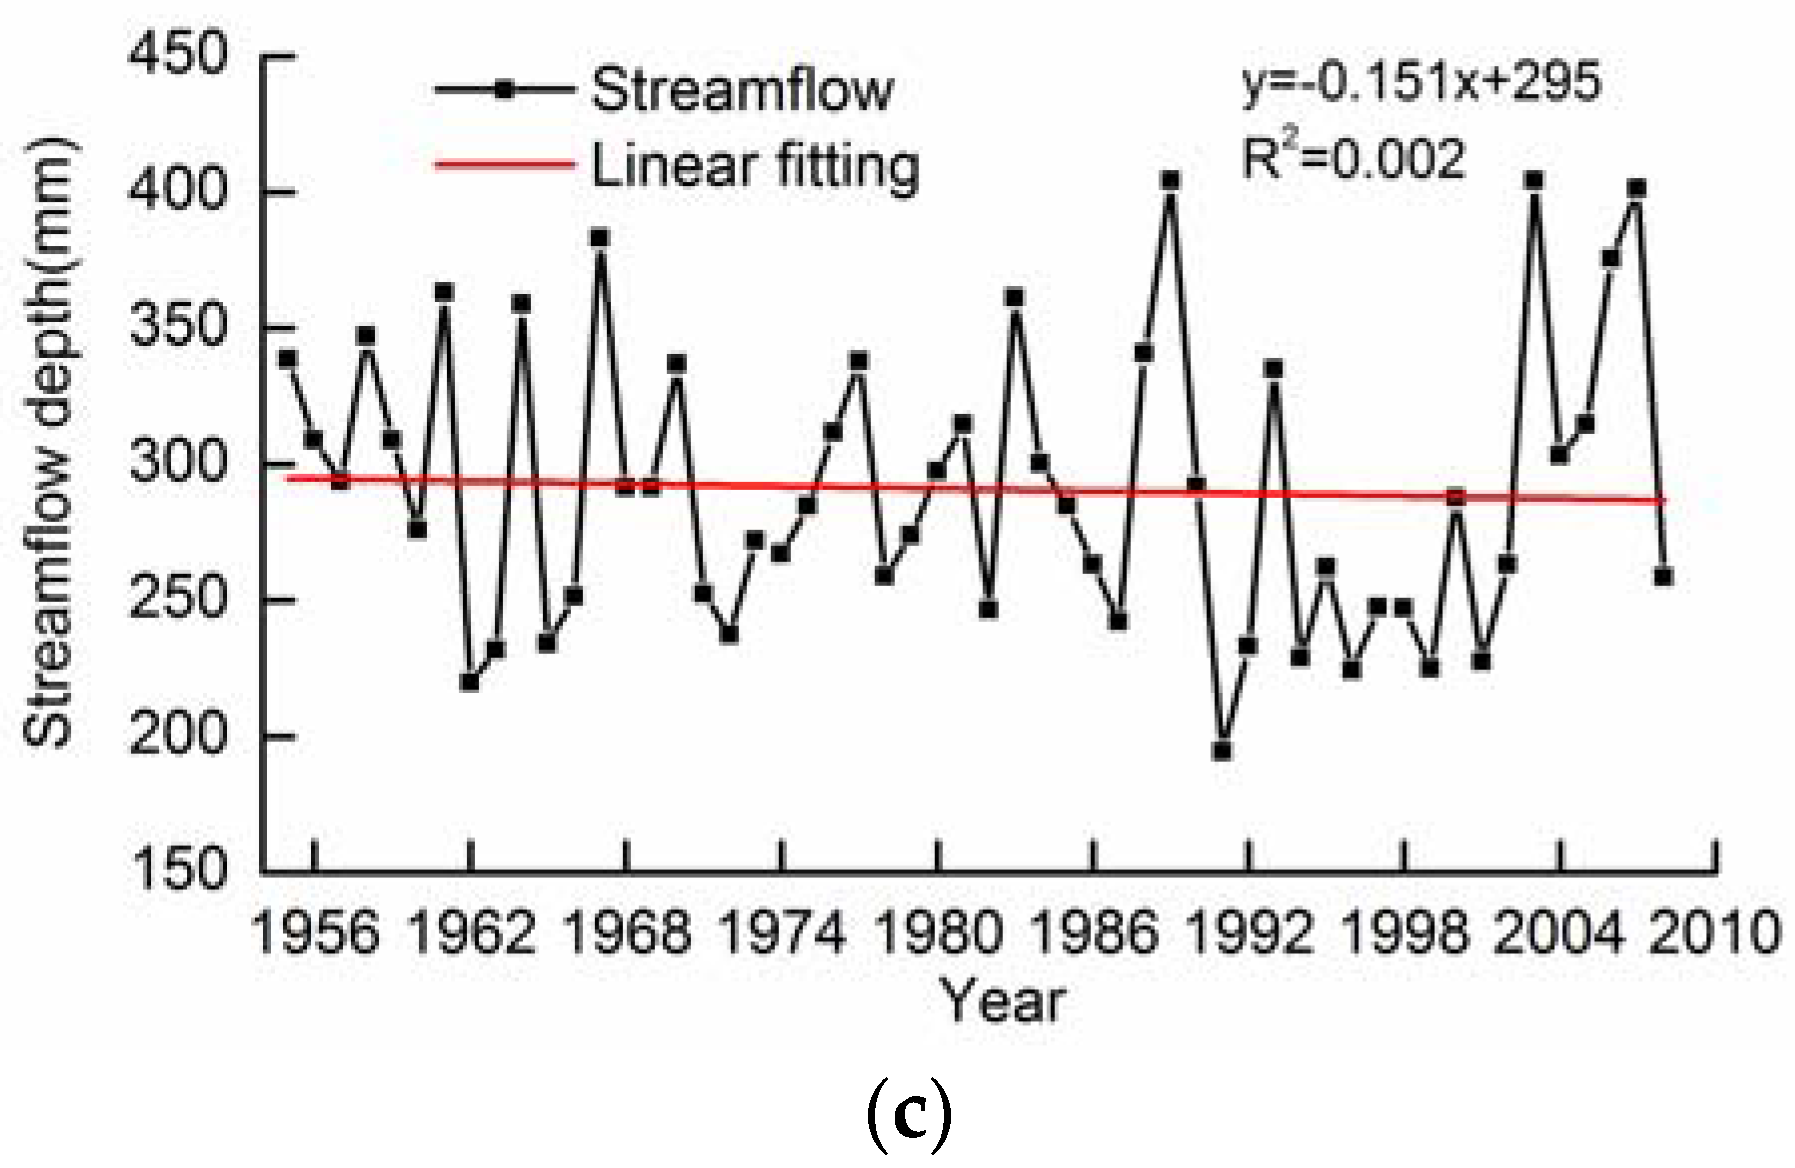
  • Changes in precipitation and temperature strongly impact the streamflow in the Xiying River basin. In the period from 1990–2008, the streamflow was dominated by climate change which led to a 102.8% increase, whereas LUCC produced a decrease of 2.8%.
  • In the future period of 2010–2039, the mean annual streamflow will decrease by 5.4% and 4.5% compared with the data from 1961–1990 under scenarios A2 and B2, respectively, whereas it will decrease by 21.2% and 16.9% in the period between 2040–2069, respectively.

Acknowledgments

We are grateful for the financial support from the National Natural Science Foundation of China (No.51279166 and No. 91425302) and Scientific Innovation Key Project of Fundamental Research Funds for the Northwest A&F University (No. QN201168).

Author Contributions

Xiaoling Su and Jing Guo conceived and designed the model and simulations; Jing Guo collected and analyzed the data; Vijay P. Singh and Jiming Jin made editing corrections and improvements to the manuscript; Jing Guo wrote the paper. All authors have read and approved the final manuscript.

Conflicts of Interest

The authors declare no conflict of interest.

Abbreviations

The following abbreviations are used in this manuscript:
AOGCMa coupled atmosphere-ocean general circulation model
DEMdigital elevation model
FAOFood and Agriculture Organization
GCMsthe general circulation models
HadCM3the Hadley Centre coupled model
HRUshydrological response units
IIASAInternational Institute for Applied Systems Analysis
IPCCthe Intergovernmental Panel on Climate Change
LSATland-surface air temperature
LUCCland use/cover change
NCEPNational Centers for Environmental Prediction
PRECISthe providing regional climates for impacts studies
SDSMstatistical downscaling model
SWATSoil and Water Assessment Tool
USDA-ARSthe United States Department of Agricultural Research Service

References

  1. Hartmann, D.L.; Tank, A.M.G.K.; Rusticucci, M.; Alexander, L.V.; Brönnimann, S.; Charabi, Y.; Dentener, F.J.; Dlugokencky, E.J.; Easterling, D.R.; Kaplan, A.; et al. Observations: Atmosphere and Surface; Cambridge Press: New York, NY, USA, 2013; pp. 159–254. [Google Scholar]
  2. Singh, V.P.; Khedun, C.P.; Mishra, A.K. Water, environment, energy, and population growth: Implications for water sustainability under climate change. J. Hydrol. Eng. 2014, 19, 557–673. [Google Scholar] [CrossRef]
  3. Zhang, N.; He, H.M.; Zhang, S.F.; Jiang, X.H.; Xia, Z.Q.; Huang, F. Influence of reservoir operation in the upper reaches of the Yangtze river (China) on the inflow and outflow regime of the TGR-based on the improved SWAT model. Water Resour. Manag. 2012, 26, 691–705. [Google Scholar] [CrossRef]
  4. Zeng, S.; Xia, J.; Du, H. Separating the effects of climate change and human activities on runoff over different time scales in the Zhang River basin. Stoch. Environ. Res. Risk Assess. 2013, 28, 401–413. [Google Scholar] [CrossRef]
  5. Gimeno, L.; Stohl, A.; Trigo, R.M.; Dominguez, F.; Yoshimura, K.; Yu, L.; Drumond, A.; Durán-Quesada, A.M.; Nieto, R. Oceanic and terrestrial sources of continental precipitation. Rev. Geophys. 2012, 50, 1–41. [Google Scholar] [CrossRef]
  6. Bronstert, A.; Niehoff, D.; Bürger, G. Effects of climate and land-use change on storm runoff generation: Present knowledge and modelling capabilities. Hydrol. Process. 2002, 16, 509–529. [Google Scholar] [CrossRef]
  7. Jha, M.; Arnold, J.G.; Gassman, P.W.; Giorgi, F.; Gu, R.R. Climate change sensitivity assessment on upper Mississippi River basin streamflows using SWAT. J. Am. Water Resour. Ass. 2007, 42, 997–1015. [Google Scholar] [CrossRef]
  8. Jones, R.N.; Chiew, F.H.S.; Boughton, W.C.; Zhang, L. Estimating the sensitivity of mean annual runoff to climate change using selected hydrological models. Adv. Water Resour. 2006, 29, 1419–1429. [Google Scholar] [CrossRef]
  9. Cao, W.; Bowden, W.B.; Davie, T.; Fenemor, A. Modelling impacts of land cover change on critical water resources in the Motueka River catchment, New Zealand. Water Resour. Manag. 2009, 23, 137–151. [Google Scholar] [CrossRef]
  10. Naef, F.; Scherrer, S.; Weiler, M. A process based assessment of the potential to reduce flood runoff by land use change. J. Hydrol. 2002, 267, 74–79. [Google Scholar] [CrossRef]
  11. Labat, D.; Goddéris, Y.; Probst, J.L.; Guyot, J.L. Evidence for global runoff increase related to climate warming. Adv. Water Resour. 2004, 27, 631–642. [Google Scholar] [CrossRef] [Green Version]
  12. Tuteja, N.K.; Vaze, J.; Teng, J.; Mutendeudzi, M. Partitioning the effects of pine plantations and climate variability on runoff from a large catchment in southeastern Australia. Water Resour. Res. 2007, 43, 199–212. [Google Scholar] [CrossRef]
  13. Zhan, C.; Niu, C.; Song, X.; Xu, C. The impacts of climate variability and human activities on streamflow in Bai River basin, northern china. Hydrol. Res. 2013, 44, 875–885. [Google Scholar] [CrossRef]
  14. Ma, Z.; Kang, S.; Zhang, L.; Tong, L.; Su, X. Analysis of impacts of climate variability and human activity on streamflow for a river basin in arid region of northwest China. J. Hydrol. 2008, 352, 239–249. [Google Scholar] [CrossRef]
  15. Zhang, A.; Zhang, C.; Fu, G.; Wang, B.; Bao, Z.; Zheng, H. Assessments of impacts of climate change and human activities on runoff with swat for the Huifa River basin, northeast China. Water Resour. Manag. 2012, 26, 2199–2217. [Google Scholar] [CrossRef]
  16. Li, Z.; Li, X.Y.; Sun, J. Impact of climate change on water resources in the shiyang river basin and the adaptive measures for energy conservation and emission reduction. Appl. Mech. Mater. 2013, 405–408, 2167–2171. [Google Scholar] [CrossRef]
  17. Wang, Z.; Ficklin, D.L.; Zhang, Y.; Zhang, M. Impact of climate change on streamflow in the arid Shiyang river basin of northwest China. Hydrol. Process. 2012, 26, 2733–2744. [Google Scholar] [CrossRef]
  18. Arora, V. The use of the aridity index to assess climate change effect on annual runoff. J. Hydrol. 2002, 265, 164–177. [Google Scholar] [CrossRef]
  19. Budyko, M.I. Evaporation under Natural Conditions; Gidrometeorizdat: Leningrad, Soviet, 1948. [Google Scholar]
  20. Budyko, M.I. Climate and Life; Academic Press: New York, NY, USA, 1974. [Google Scholar]
  21. Li, F.; Zhang, G.; Xu, Y.J. Separating the impacts of climate variation and human activities on runoff in the Songhua River basin, northeast China. Water 2014, 6, 3320–3338. [Google Scholar] [CrossRef]
  22. Liang, K.; Liu, C.; Liu, X.; Song, X. Impacts of climate variability and human activity on streamflow decrease in a sediment concentrated region in the Middle Yellow River. Stoch. Environ. Res. Risk Assess. 2013, 27, 1741–1749. [Google Scholar] [CrossRef]
  23. Li, L.; Zhang, L.; Wang, H.; Wang, J.; Yang, J.; Jiang, D.; Li, J.; Qin, D. Assessing the impact of climate variability and human activities on streamflow from the Wuding river basin in China. Hydrol. Process. 2007, 21, 3485–3491. [Google Scholar] [CrossRef]
  24. Zhan, C.S.; Jiang, S.S.; Sun, F.B.; Jia, Y.W.; Yue, W.F.; Niu, C.W. Quantitative contribution of climate change and human activities to runoff changes in the Wei River basin, China. Hydrol. Earth Syst. Sci. Discuss. 2014, 11, 2149–2175. [Google Scholar] [CrossRef]
  25. Peng, D.; Qiu, L.; Fang, J.; Zhang, Z. Quantification of climate changes and human activities that impact runoff in the Taihu Lake basin, China. Math. Probl. Eng. 2016, 2016, 2194196. [Google Scholar] [CrossRef]
  26. Xu, X.; Yang, D.; Yang, H.; Lei, H. Attribution analysis based on the budyko hypothesis for detecting the dominant cause of runoff decline in Haihe basin. J. Hydrol. 2014, 510, 530–540. [Google Scholar] [CrossRef]
  27. Yang, H.; Yang, D. Derivation of climate elasticity of runoff to assess the effects of climate change on annual runoff. Water Resour. Res. 2011, 47, 197–203. [Google Scholar] [CrossRef]
  28. Yang, H.; Yang, D.; Lei, Z.; Sun, F. New analytical derivation of the mean annual water-energy balance equation. Water Resour. Res. 2008, 44, 893–897. [Google Scholar] [CrossRef]
  29. Yang, H.; Yang, D.; Hu, Q. An error analysis of the budyko hypothesis for assessing the contribution of climate change to runoff. Water Resour. Res. 2014, 50, 9620–9629. [Google Scholar] [CrossRef]
  30. Zheng, H.; Zhang, L.; Zhu, R.; Liu, C.; Sato, Y.; Fukushima, Y. Responses of streamflow to climate and land surface change in the headwaters of the Yellow River basin. Water Resour. Res. 2009, 45, 641–648. [Google Scholar] [CrossRef]
  31. Berghuijs, W.R.; Woods, R.A.; Hrachowitz, M. A precipitation shift from snow towards rain leads to a decrease in streamflow. Nat. Clim. Chang. 2014, 4, 583–586. [Google Scholar] [CrossRef]
  32. Donohue, R.J.; Roderick, M.L.; Mcvicar, T.R. Roots, storms and soil pores: Incorporating key ecohydrological processes into budyko’s hydrological model. J. Hydrol. 2012, 436, 35–50. [Google Scholar] [CrossRef]
  33. Digital Elevation Model (DEM) Data from United States Geological Survey. Available online: http://www.usgs.gov/ (accessed on 3 May 2016).
  34. Soil Map from the Harmonized World Soil Database. Available online: http://www.fao.org/nr/land/soils/harmonized-world-soil-database/en/ (accessed on 3 May 2016).
  35. Land Use Map from Geographical Information Monitoring Cloud Platform. Available online: http://www.dsac.cn (accessed on 3 May 2016).
  36. Meteorological Data from China Meteorological Data Sharing Service System. Available online: http://www.escience.gov.cn/metdata/page/index.html (accessed on 3 May 2016).
  37. Meteorological Data from Swat Official Website. Available online: http://swat.tamu.edu/ (accessed on 3 May 2016).
  38. Noaa Earth system research laboratory. Available online: http://www.esrl.noaa.gov/psd/data/gridded/ reanalysis/ (accessed on 3 May 2016).
  39. Lucio, P.S. Assessing hadCM3 simulations from NCEP reanalyses over Europe: Diagnostics of block-seasonal extreme temperature's regimes. Glob. Planet. Chang. 2004, 44, 39–57. [Google Scholar] [CrossRef]
  40. Arnold, J.; Srinivasan, R.; Muttiah, R.; Williams, J. Large area hydrologic modeling and assessment part ii: Model development. J. Am. Water Resour. Assoc. 1998, 34, 73–89. [Google Scholar] [CrossRef]
  41. Mosbahi, M.; Benabdallah, S.; Boussema, M. Assessment of soil erosion risk using SWAT model. Arab. J. Geosci. 2013, 6, 4011–4019. [Google Scholar] [CrossRef]
  42. Neitsch, S.; Arnold, J.; Kiniry, J.; Williams, J. Soil and water assessment tool-theoretical documentation. Available online: http://swatmodel.tamu.edu/documentation (accessed on 3 May 2016).
  43. Chanasyk, D.; Mapfumo, E.; Willms, W. Quantification and simulation of surface runoff from fescue grassland watersheds. Agric. Water Manag. 2003, 59, 137–153. [Google Scholar] [CrossRef]
  44. Jayakrishnan, R.; Srinivasan, R.; Santhi, C.; Arnold, J. Advances in the application of the SWAT model for water resources management. Hydrol. Process. 2005, 19, 749–762. [Google Scholar] [CrossRef]
  45. Narsimlu, B.; Gosain, A.; Chahar, B. Assessment of future climate change impacts on water resources of upper Sind River basin, India using SWAT model. Water Resour. Manag. 2013, 27, 3647–3662. [Google Scholar] [CrossRef]
  46. Perazzoli, M.; Pinheiro, A.; Kaufmann, V. Assessing the impact of climate change scenarios on water resources in southern Brazil. Hydrol. Sci. J. 2013, 58, 77–87. [Google Scholar] [CrossRef]
  47. Lin, Y.; Grimm, N. Modelling potential impacts of climate change on water and nitrate export from a mid-sized, semiarid watershed in the US southwest. Clim. Chang. 2013, 120, 419–431. [Google Scholar]
  48. Sellami, H.; Jeunesse, I.; Vanclooster, S. Parameter and rating curve uncertainty propagation analysis of the swat model for two small mediterranean catchments. Hydrol. Sci. J. 2013, 58, 1635–1657. [Google Scholar] [CrossRef]
  49. Wang, S.; Kang, S.; Zhang, L.; Li, F. Modelling hydrological response to different land-use and climate change scenarios in the Zamu River basin of northwest China. Hydrol. Process. 2008, 22, 2502–2510. [Google Scholar] [CrossRef]
  50. Abbaspour, K.; Johnson, C.; Genuchten, M. Estimating uncertain flow and transport parameters using a sequential uncertainty fitting procedure. Vadose Zone J. 2004, 3, 1340–1352. [Google Scholar] [CrossRef]
  51. Fitzhugh, T.; Mackay, D. Impacts of input parameter spatial aggregation on an agricultural nonpoint source pollution model. J. Hydrol. 2001, 236, 35–53. [Google Scholar] [CrossRef]
  52. Abbaspour, K. SWAT-cup 4: SWAT calibration and uncertainty programs-a user manual. Swiss Fed. Inst. Aquat. Sci. Technol. Eawag 2011, 1, 1–103. [Google Scholar]
  53. Zhang, X.; Srinivasan, R.; Bosch, D. Calibration and uncertainty analysis of the SWAT model using genetic algorithms and bayesian model averaging. J. Hydrol. 2009, 374, 307–317. [Google Scholar] [CrossRef]
  54. Nash, J.; Sutcliffe, J. River flow forecasting through conceptual models part I: A discussion of principles. J. Hydrol. 1970, 10, 282–290. [Google Scholar] [CrossRef]
  55. Kushwaha, A.; Jain, M. Hydrological simulation in a forest dominated watershed in himalayan region using SWAT model. Water Resour. Manag. 2013, 27, 3005–3023. [Google Scholar] [CrossRef]
  56. Leitinger, G.; Ruggenthaler, R.; Hammerle, A.; Lavorel, S.; Schirpke, U.; Clement, J.-C.; Lamarque, P.; Obojes, N.; Tappeine, U. Impact of droughts on water provision in managed alpine grasslands in two climatically different regions of the Alps. Ecohydrology 2015, 8, 1600–1613. [Google Scholar] [CrossRef] [PubMed]
  57. Kendall, M.; Stuart, A. The Advanced Theory of Statistics; Charles Griffin: London, UK, 1964. [Google Scholar]
  58. Belle, G.; Hughes, J. Nonparametric tests for trend in water quality. Water Resour. Res. 1984, 20, 127–136. [Google Scholar] [CrossRef]
  59. U.S. Department of Agriculture. Soil Conservation Service. Hydrology section 4. In National Engineering Handbook; Water Resources Publications: Washington, DC, USA, 1972. [Google Scholar]
  60. SDSM: Statistical downscaling model. Available online: http://co-public.lboro.ac.uk/cocwd/SDSM/ (accessed on 5 August 2015).
  61. Mahmood, R.; Babel, M.S. Evaluation of sdsm developed by annual and monthly sub-models for downscaling temperature and precipitation in the Jhelum basin, Pakistan and India. Theor. Appl. Clim. 2013, 113, 27–44. [Google Scholar] [CrossRef]
  62. Thomas, T.; Jaiswal, R.; Galkate, R.; Singh, S. Development of a rainfall-recharge relationship for a fractured basaltic aquifer in central India. Water Resour. Manag. 2009, 23, 3101–3119. [Google Scholar] [CrossRef]
Figure 1. Basic information of the Xiying River basin. (a) Geographic location of Xiying River in northwestern China; (b) Meteorological and hydrological conditions in the Xiying River basin.
Water 08 00192 g001
Figure 2. Distributions of soil and land use in the Xiying River basin. (a) soil distribution; (b) land use distribution from 1990.
Water 08 00192 g002
Figure 3. Annual variabilities of precipitation, temperature, and streamflow. (a) Precipitation; (b) Temperature; (c) Streamflow.
Water 08 00192 g003aWater 08 00192 g003b
Figure 4. Comparison between the measured and simulated streamflow in different periods. (a) 1980–1989; (b) 1990–2008.
Water 08 00192 g004
Figure 5. Streamflow under incremental changes of precipitation and temperature.
Water 08 00192 g005
Table 1. Land use classification (%) of the Xiying River basin in 1990, 2000, and 2008.
YearFarmlandForestShrubberyOpening ForestlandHigh Covered GrasslandMiddle Covered GrasslandLow Covered Grassland
19900.996.5818.991.0318.7131.080.65
20000.996.5818.991.0318.7131.080.65
20080.996.5718.961.0318.6931.100.67
YearCanalsPermanent ice Snow LandRural Residential AreasConstruction LandWetlandBare Rock Gravel LandUnused Land
19900.110.060.040.051.030.3120.35
20000.110.060.040.051.030.3120.35
20080.110.070.040.051.030.3220.38
Table 2. Changing trends of precipitation, temperature, and streamflow.
PeriodVariable U α / 2 SignificanceTrend
1955–2008Precipitation−0.52Non-significantDecreased
Temperature5.10SignificantIncreased
Streamflow−0.77Non-significantDecreased
1990–2008Precipitation2.20SignificantIncreased
Temperature5.98SignificantIncreased
Streamflow2.13SignificantIncreased
Table 3. Sensitivity analysis of the parameters and values selected for calibration.
RankParametersUnitsRangeSelected Value
1ALPHA_BF.gw0–10.084
2GW_DELAY.gwdays0–50020
3GWQMN.gwmm0–5000114
4CN2.mgt−25%–25%−20%
5CH_K2.rtemm/day0–15065
Table 4. Streamflow under different conditions of climate and land use defined by the preset scenario (b).
ConditionLand Use StatusPrecipitation/mmTemperature/°CStream Flow/mmVariation/mmVariation Ratio/%
120004584.7247.2300
220084584.7245.08−2.16−2.8
320005515.6326.6379.40102.8
420085515.6324.4777.24100.0
Table 5. Variations of averaged streamflow, precipitation, and temperature (ΔT) under scenarios A2 and B2 from 2010 to 2069.
ScenarioPeriodStreamflow/%Precipitation/%Max ΔT/°CMin ΔT/°C
A22010–2039−5.4−14.3+1.24−0.09
2040–2069−21.2−22.9+3.03+1.12
B22010–2039−4.5−16.4+1.05+0.11
2040–2069−16.9−21.4+2.74+0.84

