1. Introduction
Aridity and climate change are the major challenges faced by farmers who rely on rainfed farming [
1]. Especially in arid regions, farmers are faced with low average annual rainfall and variability in temporal and spatial distribution. In order to increase the availability of water for crop production and cattle grazing, inhabitants of dry areas have constructed and developed several types of Rain Water Harvesting techniques (RWH). RWH is a method for inducing, collecting, storing and conserving local surface runoff for agriculture in arid and semi-arid regions [
2]. RWH is a likely viable option to increase water productivity at the production system level [
3]. RWH and management techniques have a significant potential for improving and sustaining the rainfed agriculture in the region [
4]. In fact, a wide variety of micro-catchment, macro-catchment and
in situ RWH techniques are available in arid and semi-arid regions. The indigenous techniques, or those modified by the indigenous RWH practices, are more common and widely accepted by smallholder farmers than the others [
5]. Throughout history, archaeological evidence has revealed RWH sites that were implemented in Jordan, the Al-Negev desert, Syria, Tunisia and Iraq. The earliest signs of RWH are believed to have been constructed over 9000 years ago in the Edom Mountains in southern Jordan [
6,
7]. The most common RWH techniques in arid and semi-arid regions are dams, terracing, ponds and pans, percolation tanks and Nala bunds. Tunisia is an example of the Mediterranean countries that are facing scarcity of water which will be worsened due to climate change, growing demand for water in agricultural and urban development and an expanding tourism industry [
8]. To adapt to this development, Tunisians have developed and implemented several types of water harvesting techniques of which the most common are jessour, tabias, terraces, cisterns, recharge wells, gabion check dams and mescats [
9,
10].
The success of RWH systems depends mainly on identification of suitable sites and technologies for the particular area. Soil Conservation Service (SCS) with Curve Number (CN), Geographic Information System (GIS) and Remote Sensing (RS) and integrated GIS, RS with Multi-Criteria Analysis (MCA), have all been applied with different biophysical and socio-economics criteria to identify suitable locations for RWH. Several researchers have presented and applied the SCS with the CN method to assess how much runoff can be generated from a runoff area like in South Africa [
11], and India [
12,
13].
Nowadays, the Geographic Information System and Remote Sensing are used to represent the biophysical environment and applied to identify suitable sites for RWH [
1,
10,
14]. Other researchers have integrated GIS, RS and Multi-Criteria Analysis to assess the suitability of sites for RWH [
15,
16].
Ouessar
et al. [
17] developed and applied a simple tool to evaluate the structural stability of 12 sites (four jessour, four tabias and four gabion check dams) in southern Tunisia. Through physical inspection, the characteristics of the structures were rated and an overall score was given. The characteristics rated include a cross-section for the water and sediment components of the structure, infiltration potential, vegetation quantity, dyke material and dyke erosion. This study also assessed the hydrological impact of the water harvesting systems by adaptation and evaluation of the soil and water assessment model (SWAT).
Jothiprakash and Mandar [
18] applied the Analytical Hierarchy Process to evaluate various RWH techniques (aquifer recharge, surface storage structures and concrete storage structures) in order to identify the most appropriate technique and the required number of structures to meet the daily water demand of a large-scale industrial area.
So far, most attention has been given to the selection of suitable sites and techniques for RWH [
19] but little attention has been given to the evaluation of the RWH structure after implementation.
To understand the performance of RWH and to ensure successful implementation of new RWH, engineering (technical), biophysical and socio-economic criteria need to be integrated into the evaluation tools [
20,
21]. In addition, the relation and importance of the various criteria also needs to be taken into consideration.
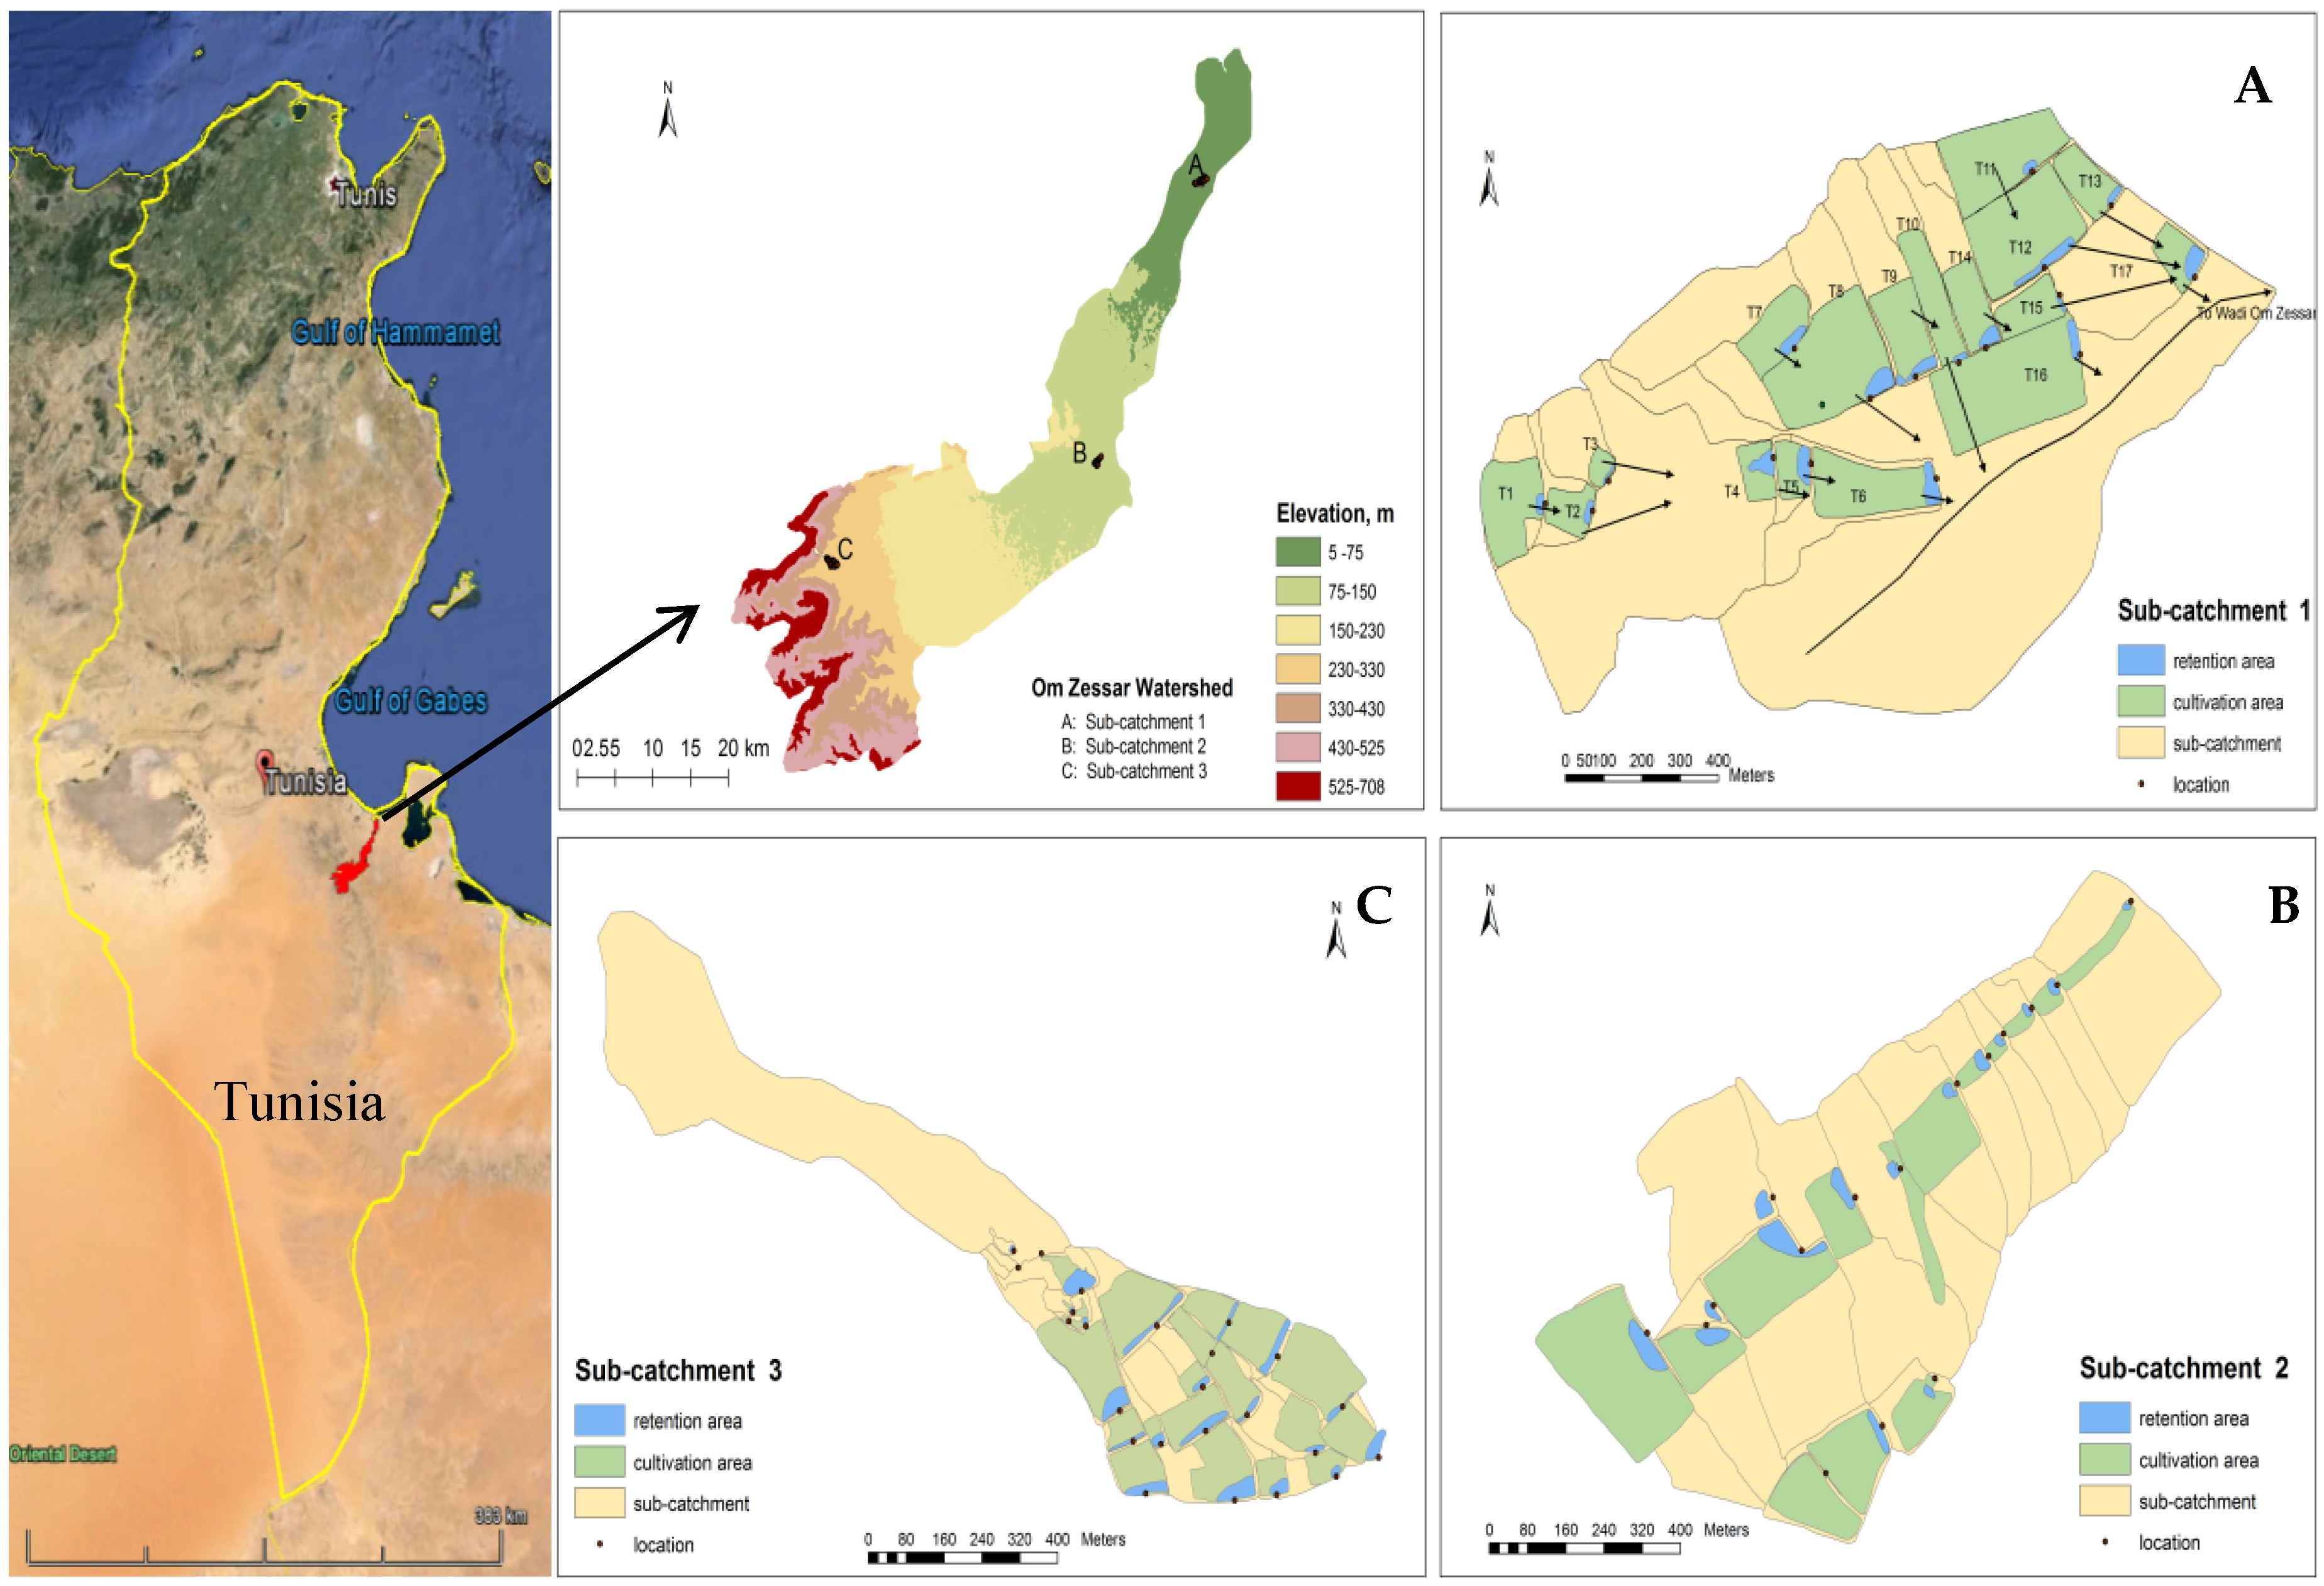
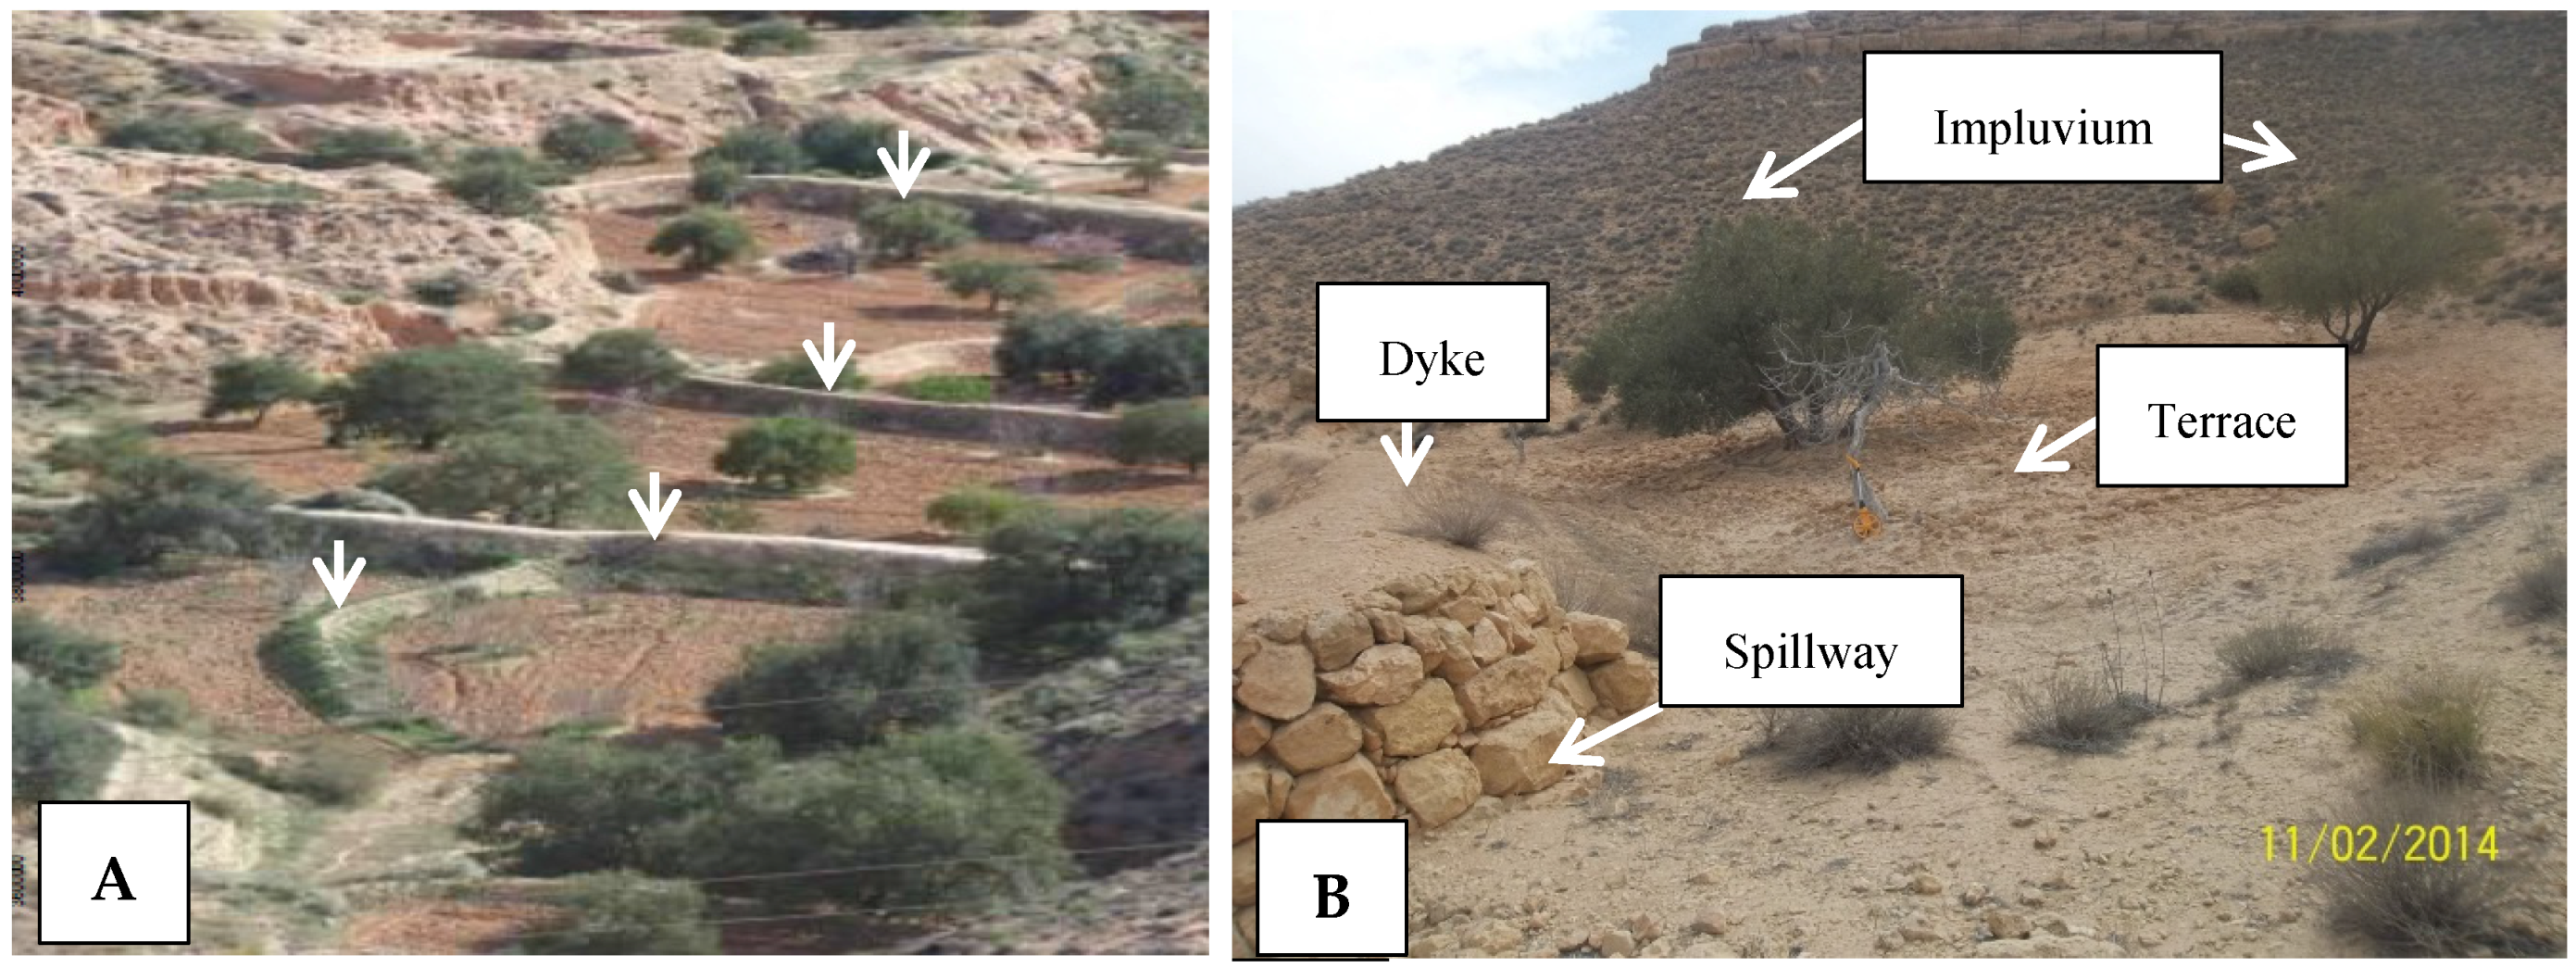
The overall objective of the study, therefore, was to develop and test a comprehensive methodology to assess and evaluate the performance of existing RWH in arid and semi-arid regions. To achieve this goal, we developed a new RWH evaluation and decision support tool. In this tool, engineering, biophysical and socio-economic criteria were taken into account to assess the performance of existing RWH, using the Analytical Hierarchy Process supported by GIS. To develop and test this assessment tool, the Oum Zessar watershed in south-eastern Tunisia was selected as a case study. Jessour and Tabias are the most common RWH techniques in the Oum Zessar watershed and they are used in our methodology.
3. Results
All the collected data for each site were stored and analyzed in Excel. The results for each criterion were then classified according to the five classes as defined in
Table 1.
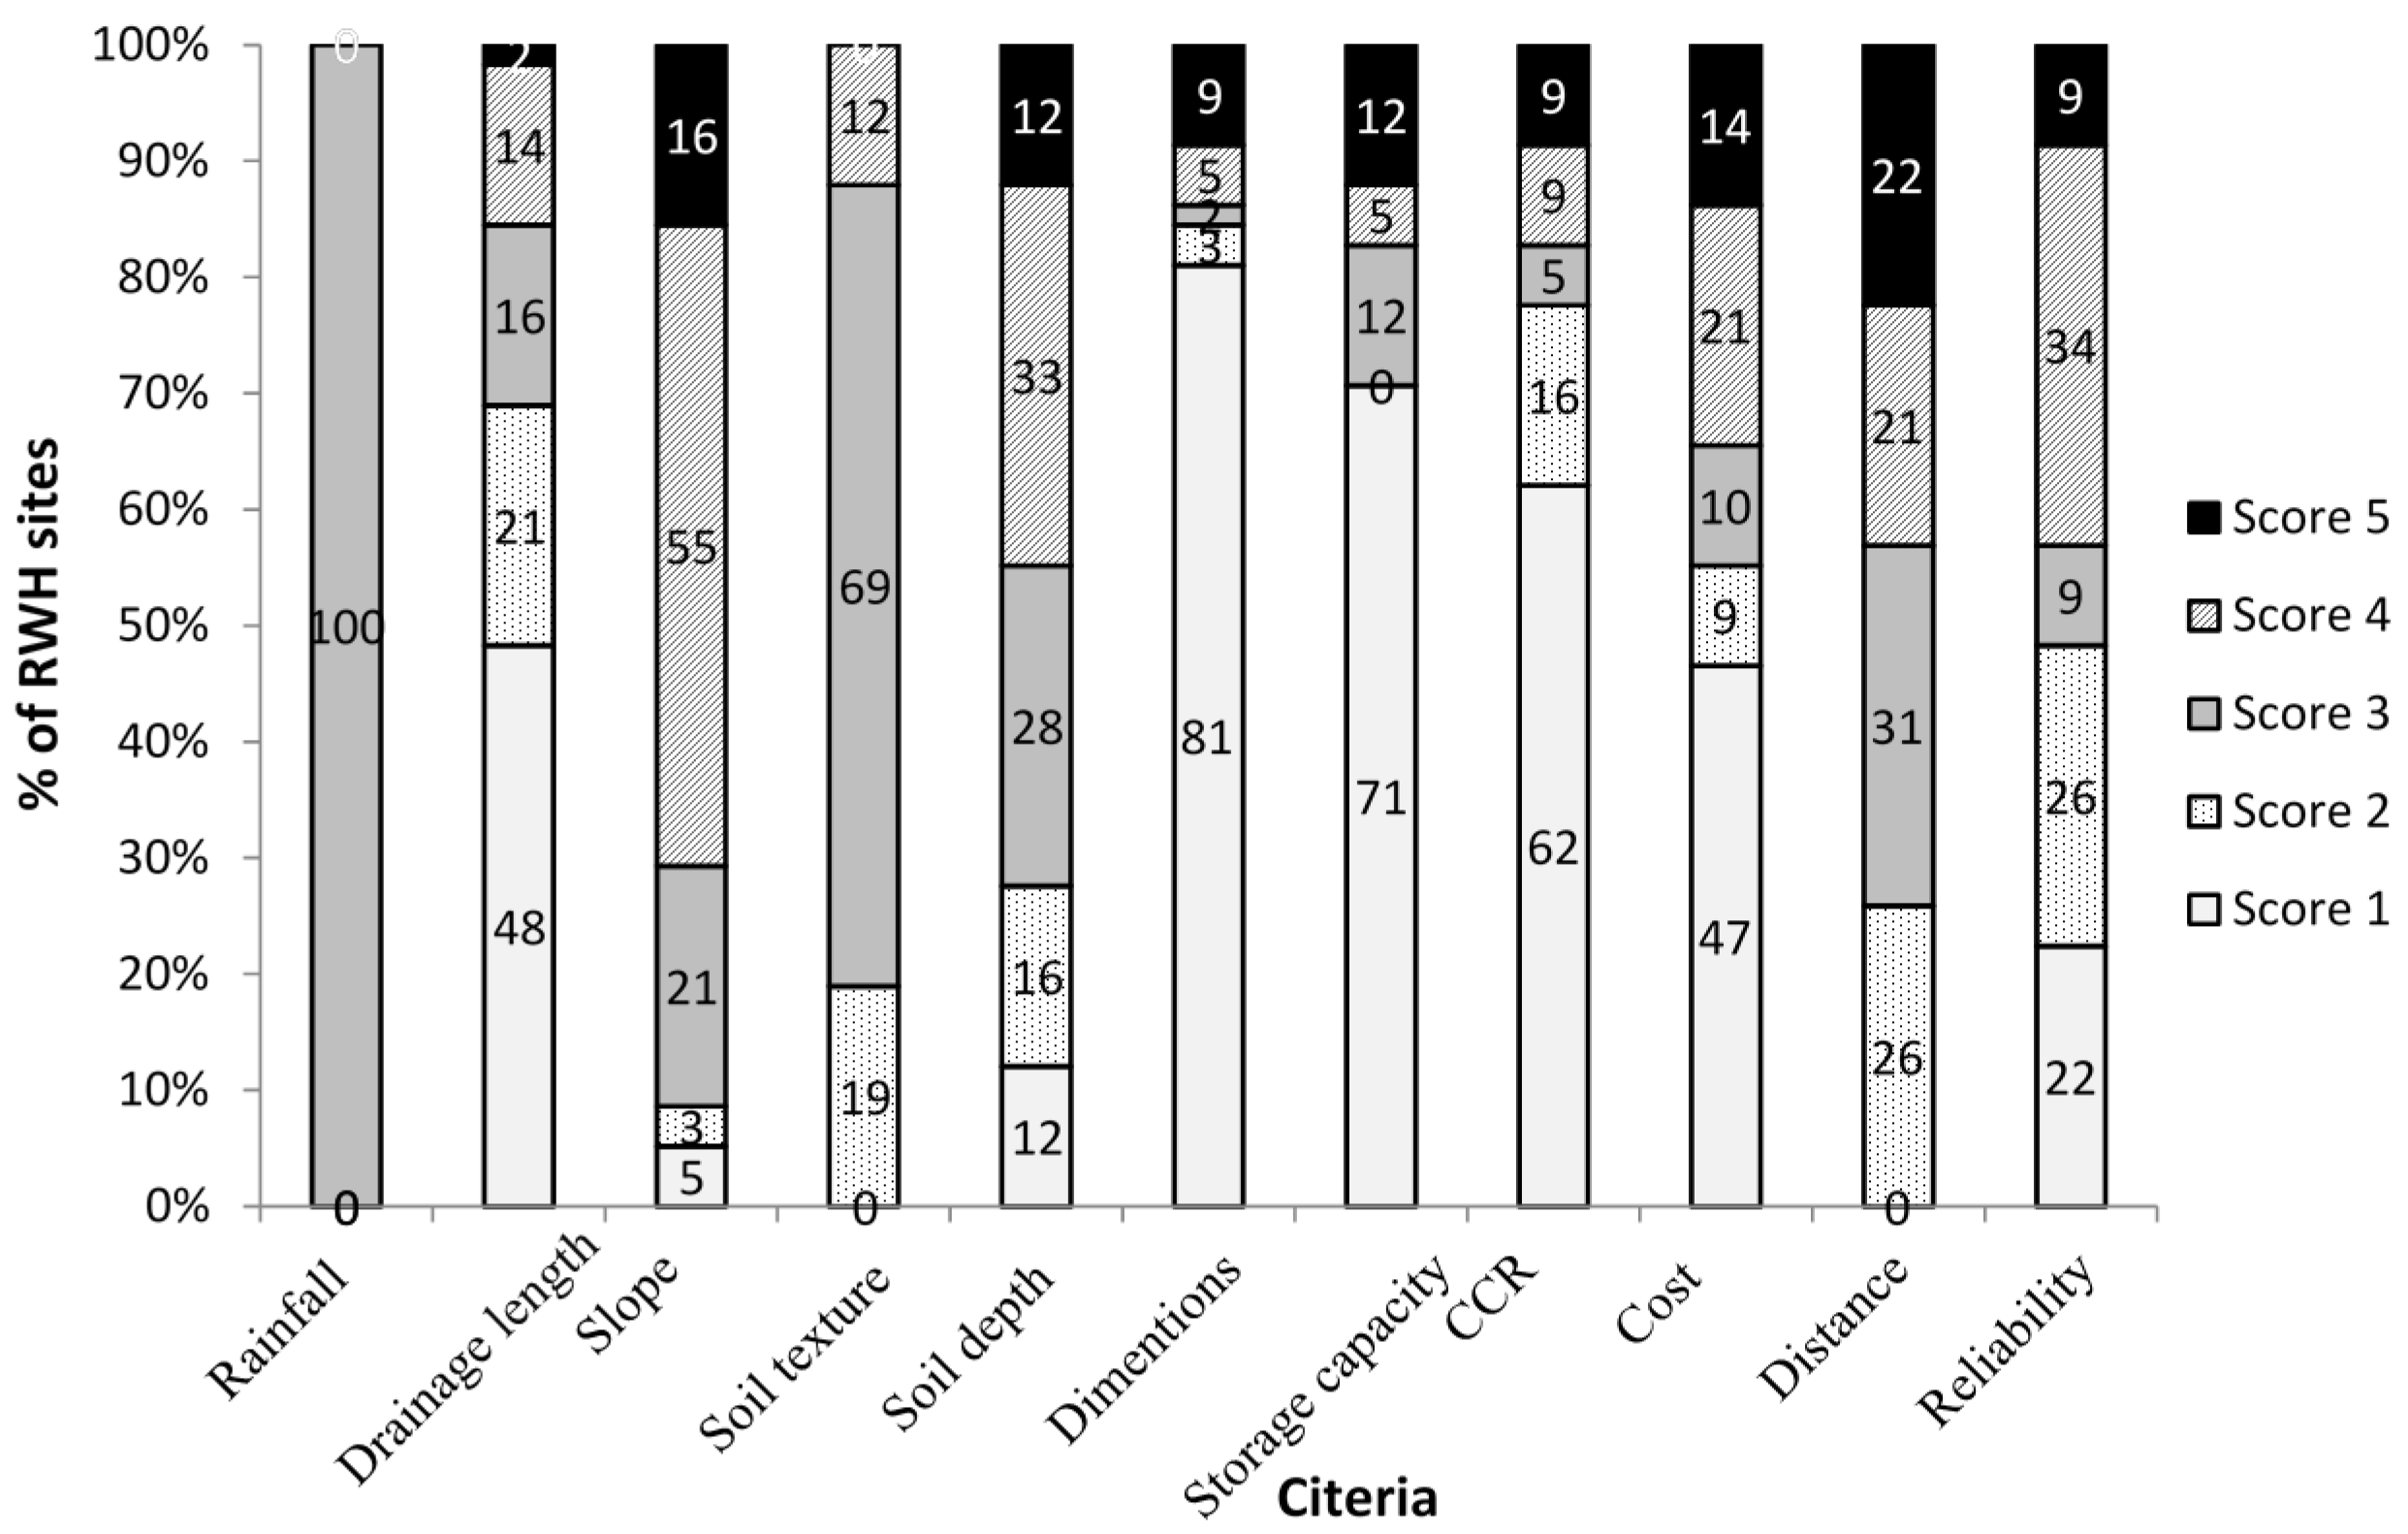
Figure 4 shows the scores percentages (5 scores) of each sub-criteria (11 criteria) for all 58 sites. The rainfall criterion got a score 3 in all sites since there was no big difference in rainfall pattern nor amount (175–185 mm·y
−1) in the three sub-catchments due to the relatively small area. The criteria related to the design structure, like dimensions, storage capacity, CCR, drainage flow and costs got a high percentage of scores of 1 in many sites. More details about suitability and scores for the three sub-catchments are explained in the following sections.
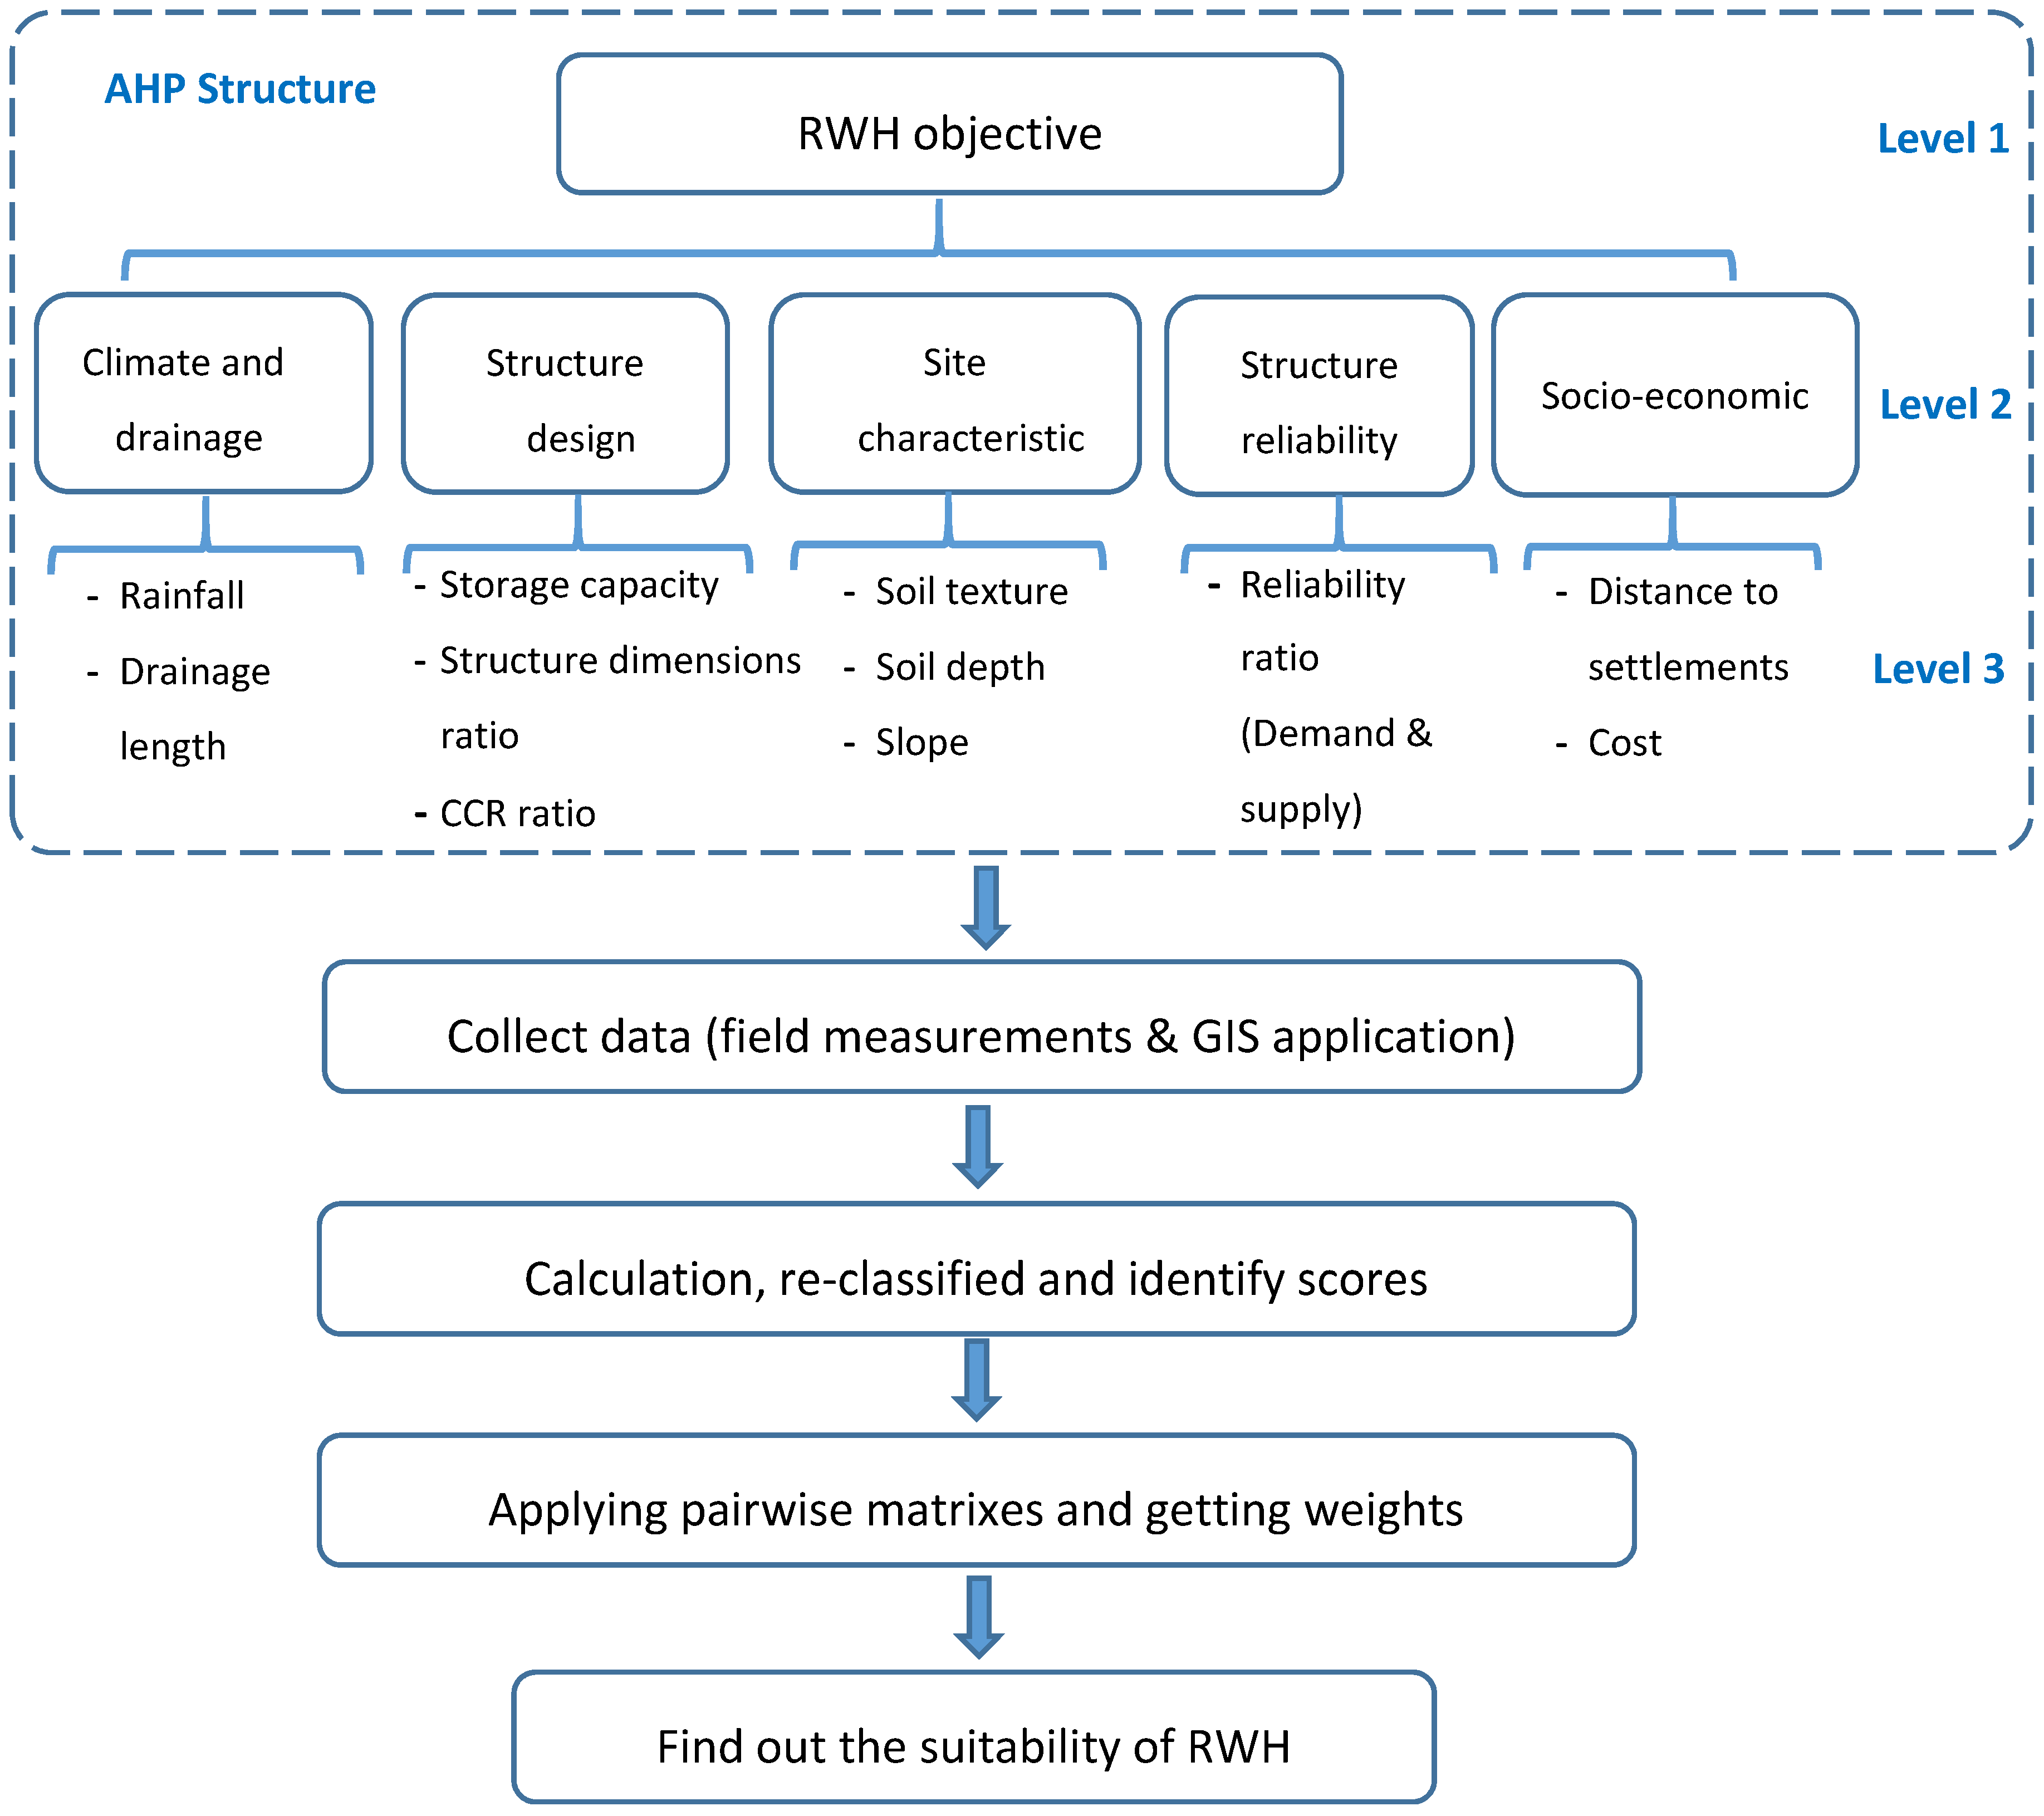
3.1. AHP & Suitability
During pairwise comparison, criteria were rated based on the literature review, interviews with key stakeholders, field survey information and discussions with people working and having experience with RWH, as shown in
Table 4. For instance, the reliability and socio-economic criteria have similar relative importance to the main objective of the RWH system, as shown in this Table, and each of them has 1 as a relative importance rate.
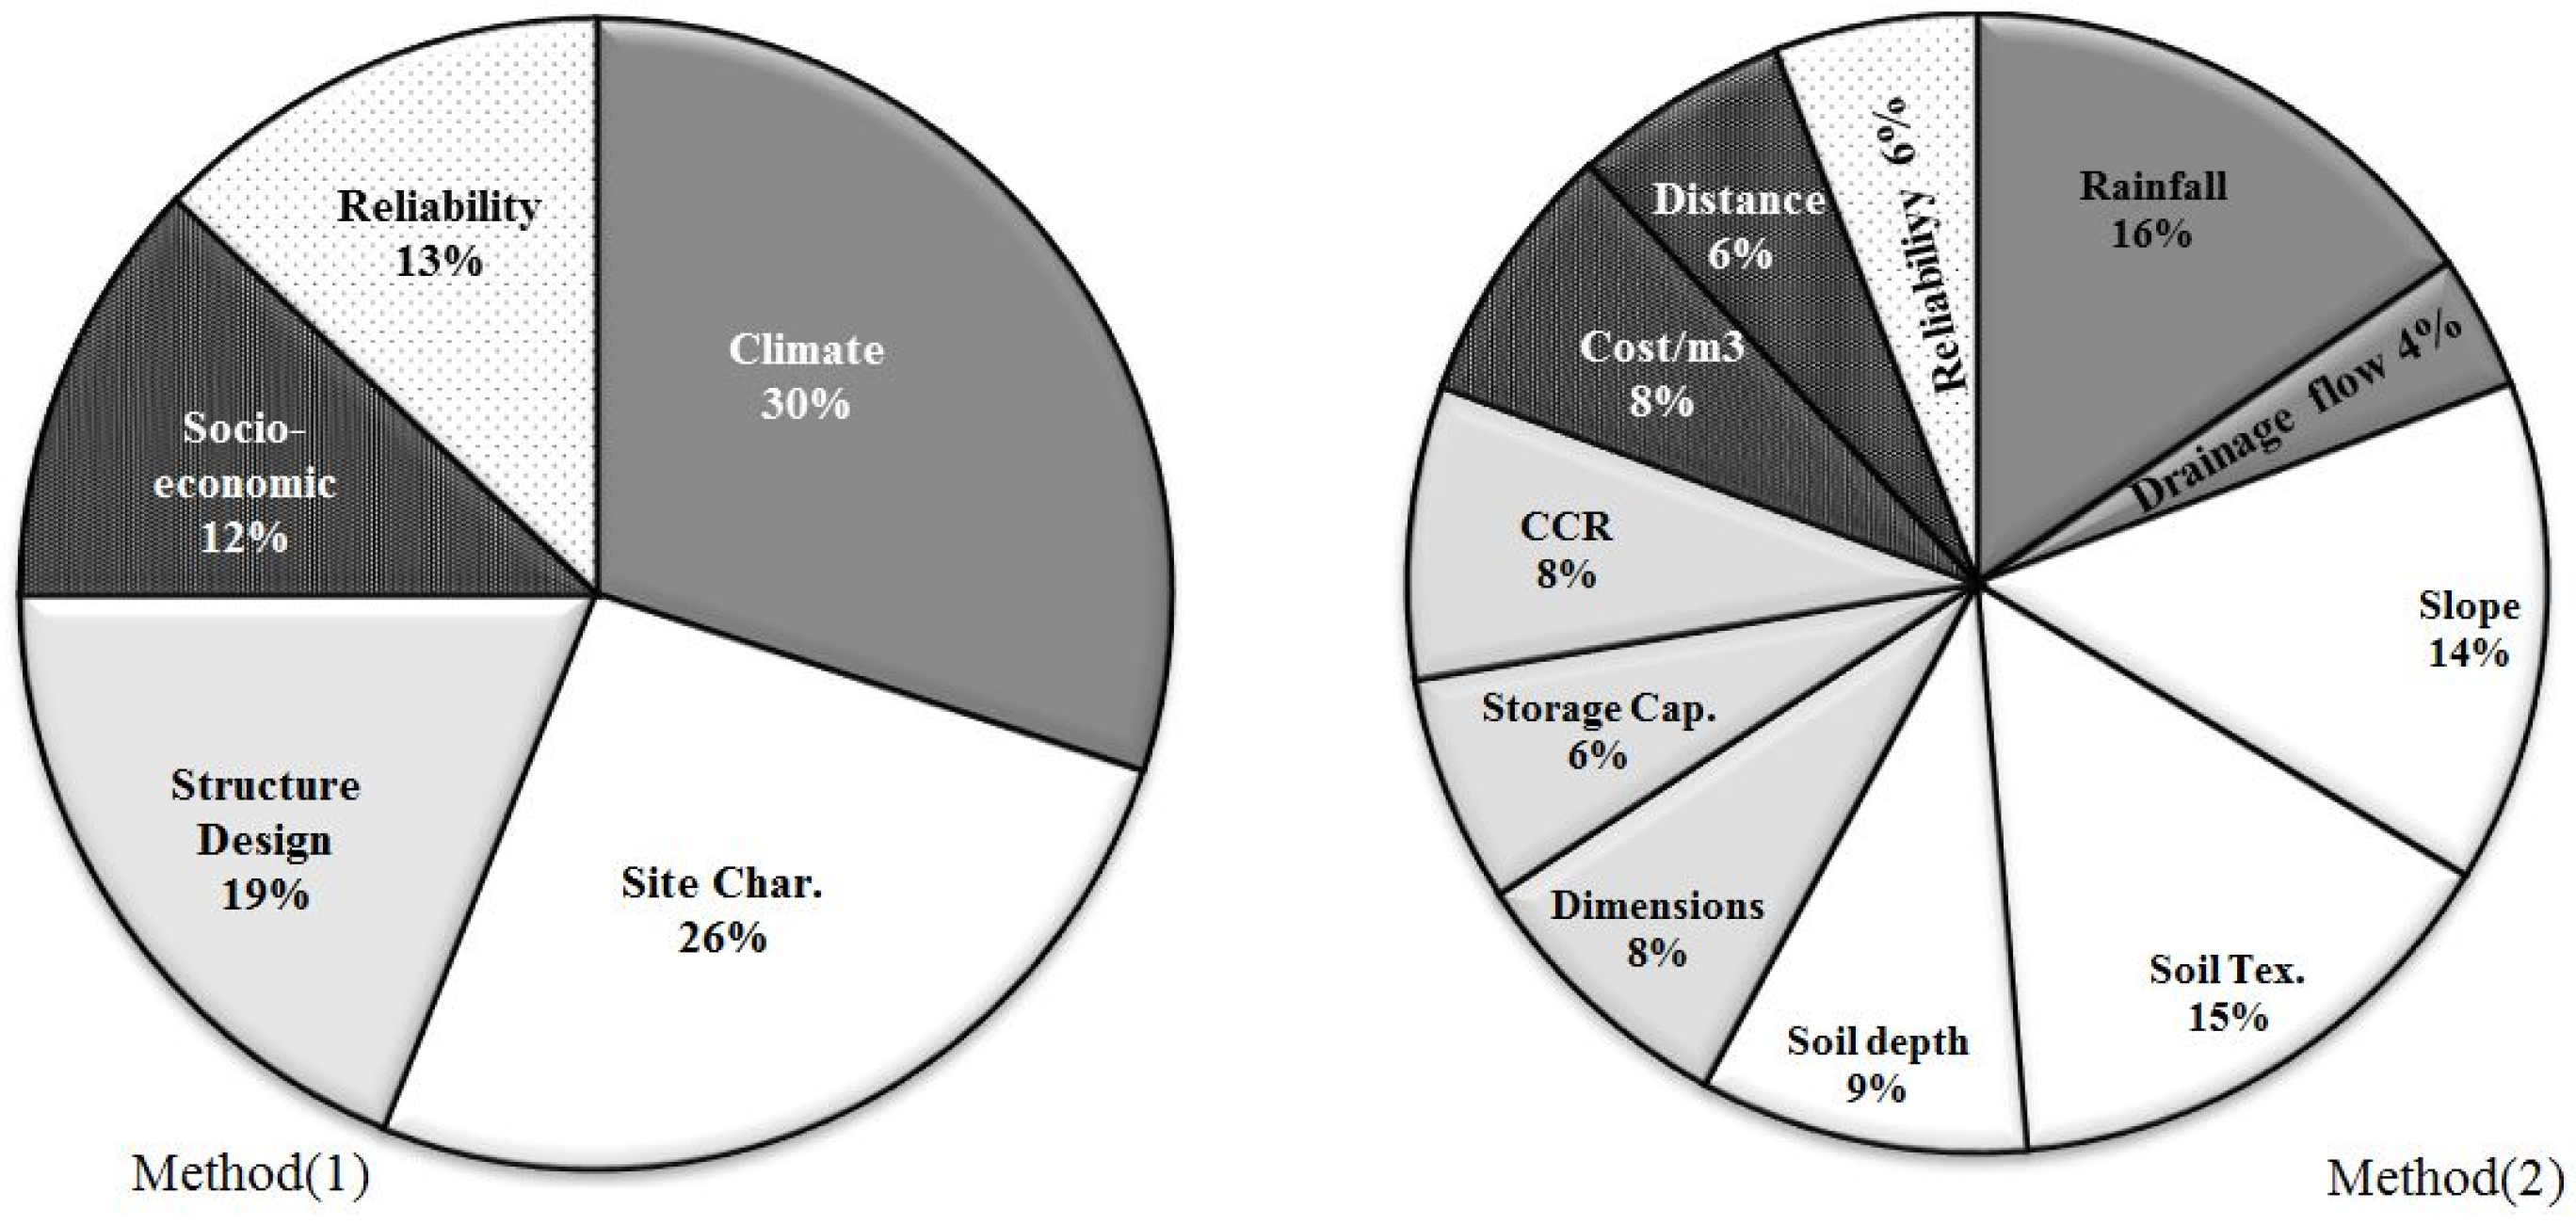
A pairwise matrix was established and the relative weights for each criterion and suitability rank for classes are assigned as shown in
Figure 5 and
Table 1. The climate and rainfall criteria received the highest weights in both methods (three levels and two levels AHP). The values for each criterion were calculated and reclassified based on the 5 suitability classes and Equation (1) was applied to get the final suitability score for each site.
3.2. Test Results Sub-Catchment 1
Table 5 shows measurements and scores for each criterion for the tabias receiving the highest (9 and 14) and lowest (10 and 15) suitability scores when AHP Method 1 was applied (before applying Equation (1)).
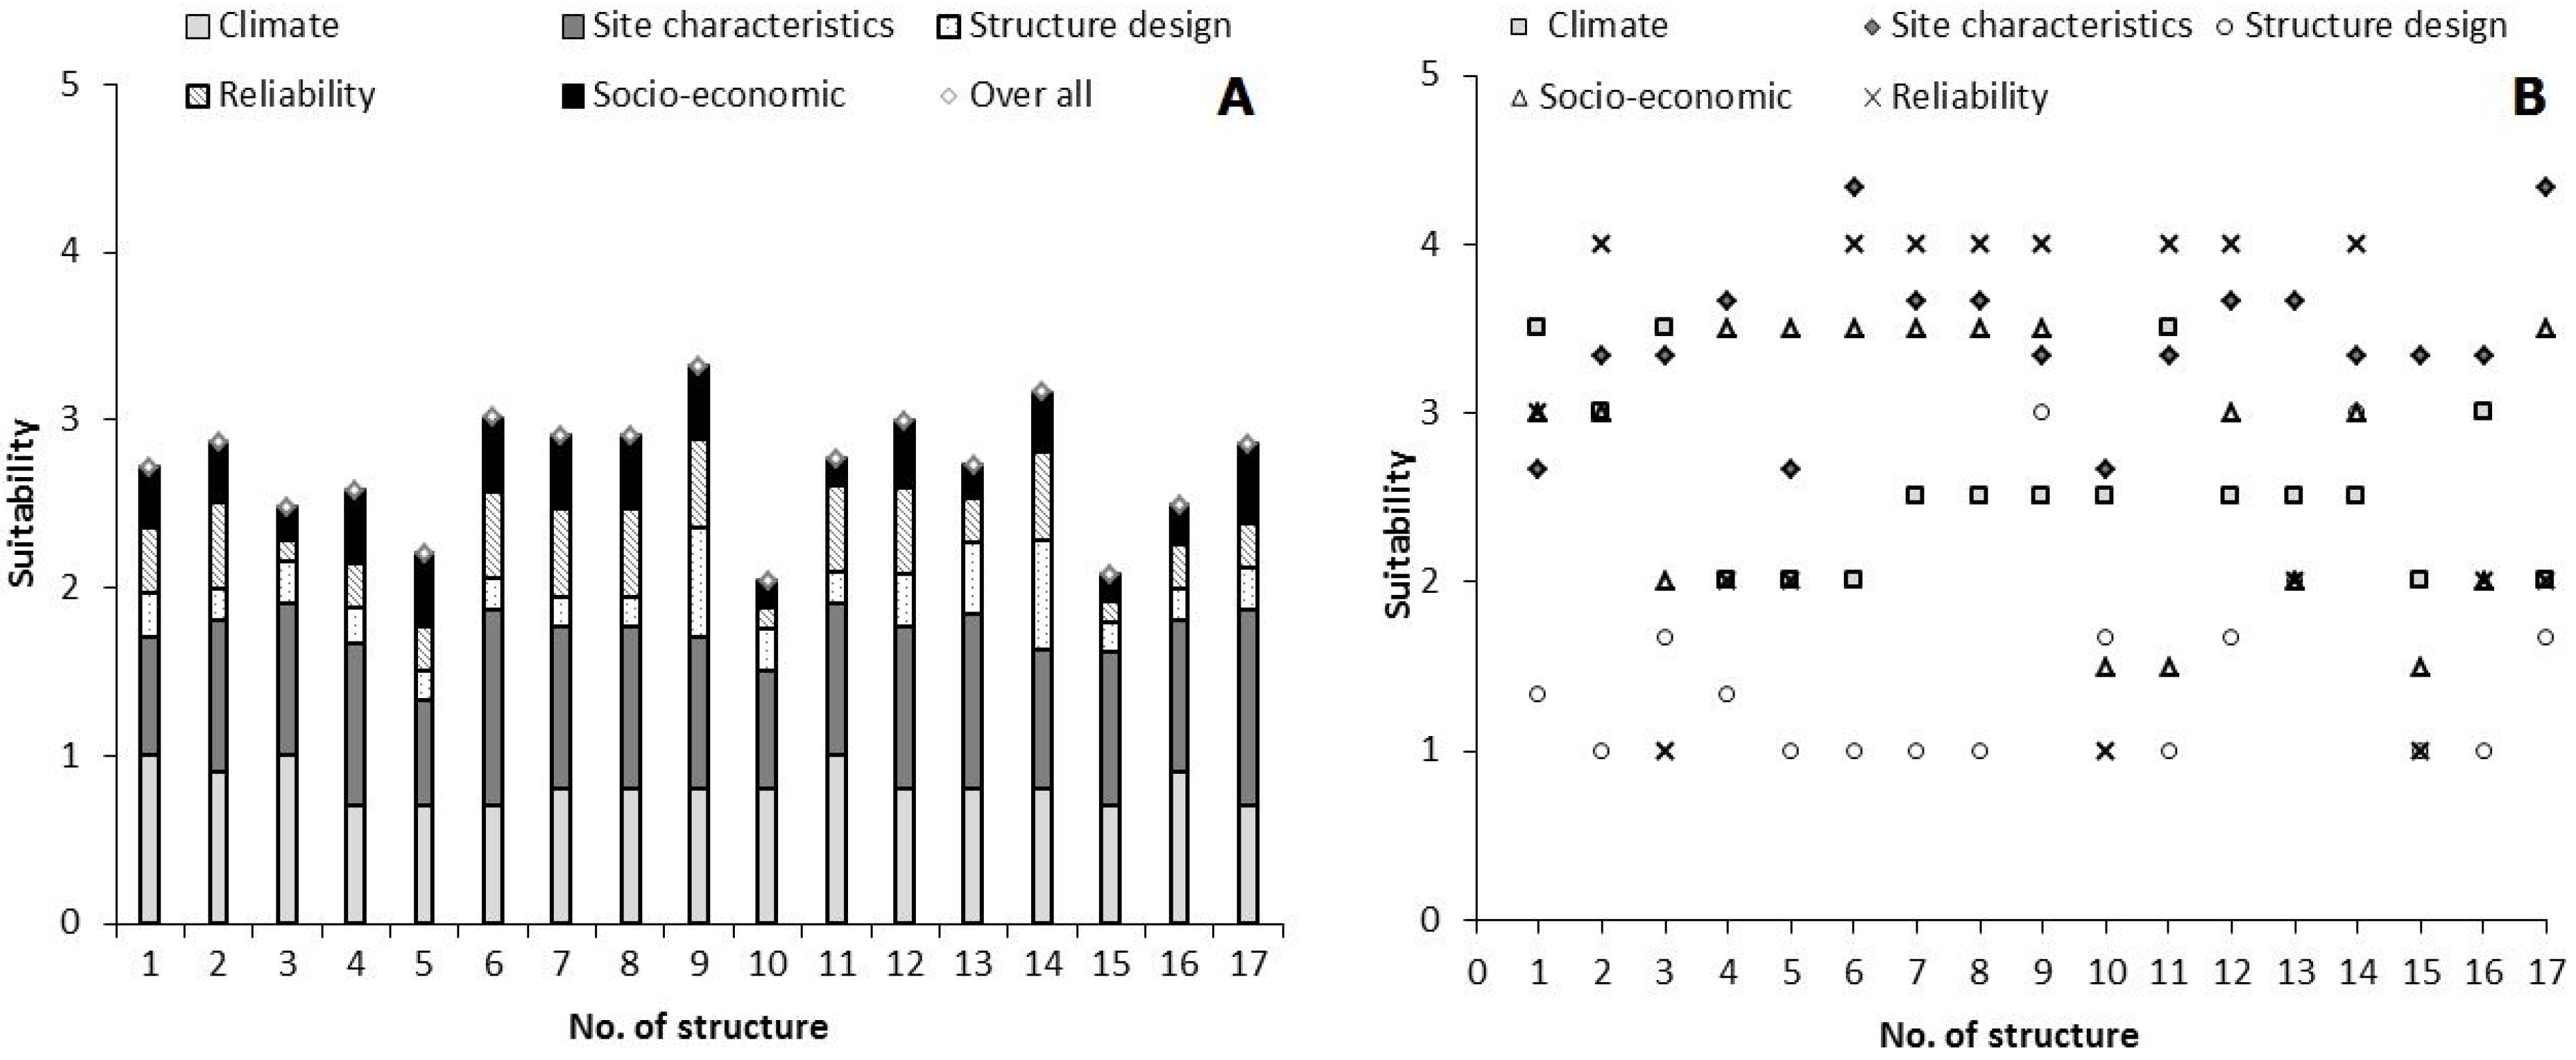
Figure 6A shows the overall suitability scores and the suitability score for each criterion based on Method 1 (three levels) after applying Equation (1). The highest overall score was 3.32 (medium suitability) for tabia 9, whereas the lowest score was 2.04 (low suitability) in tabia 10.
Design criteria (structure dimensions, storage capacity and catchment area to cropping area) are playing a significant (negative) role in the overall RWH suitability for most of the tabias in Sub-catchment 1. These sites scored the lowest on design criteria, resulting in the low overall performance of these RWH sites. This result confirmed the observations of performance in the field.
A possible reason for the poor design is a lack of selection procedure for suitable RWH sites in combination, in this case, with structures built without a proper engineering design.
Figure 6B shows the suitability scores for each criterion without multiplying by the weights.
In Method two (two levels), the pairwise matrix was applied directly on the sub-criteria.
Table 6 shows the overall suitability and the suitability for each criterion for the highest (9 and 14) and lowest (10 and 15) scoring tabias using this method. Once again, the design criteria of dimension and storage capacity had a significant negative impact on the difference between the high-scoring and low-scoring tabias. However with Method 2, CCR did not stand out as a differentiating factor, but reliability and cost did.
3.3. Test Results Sub-Catchments 2 and 3
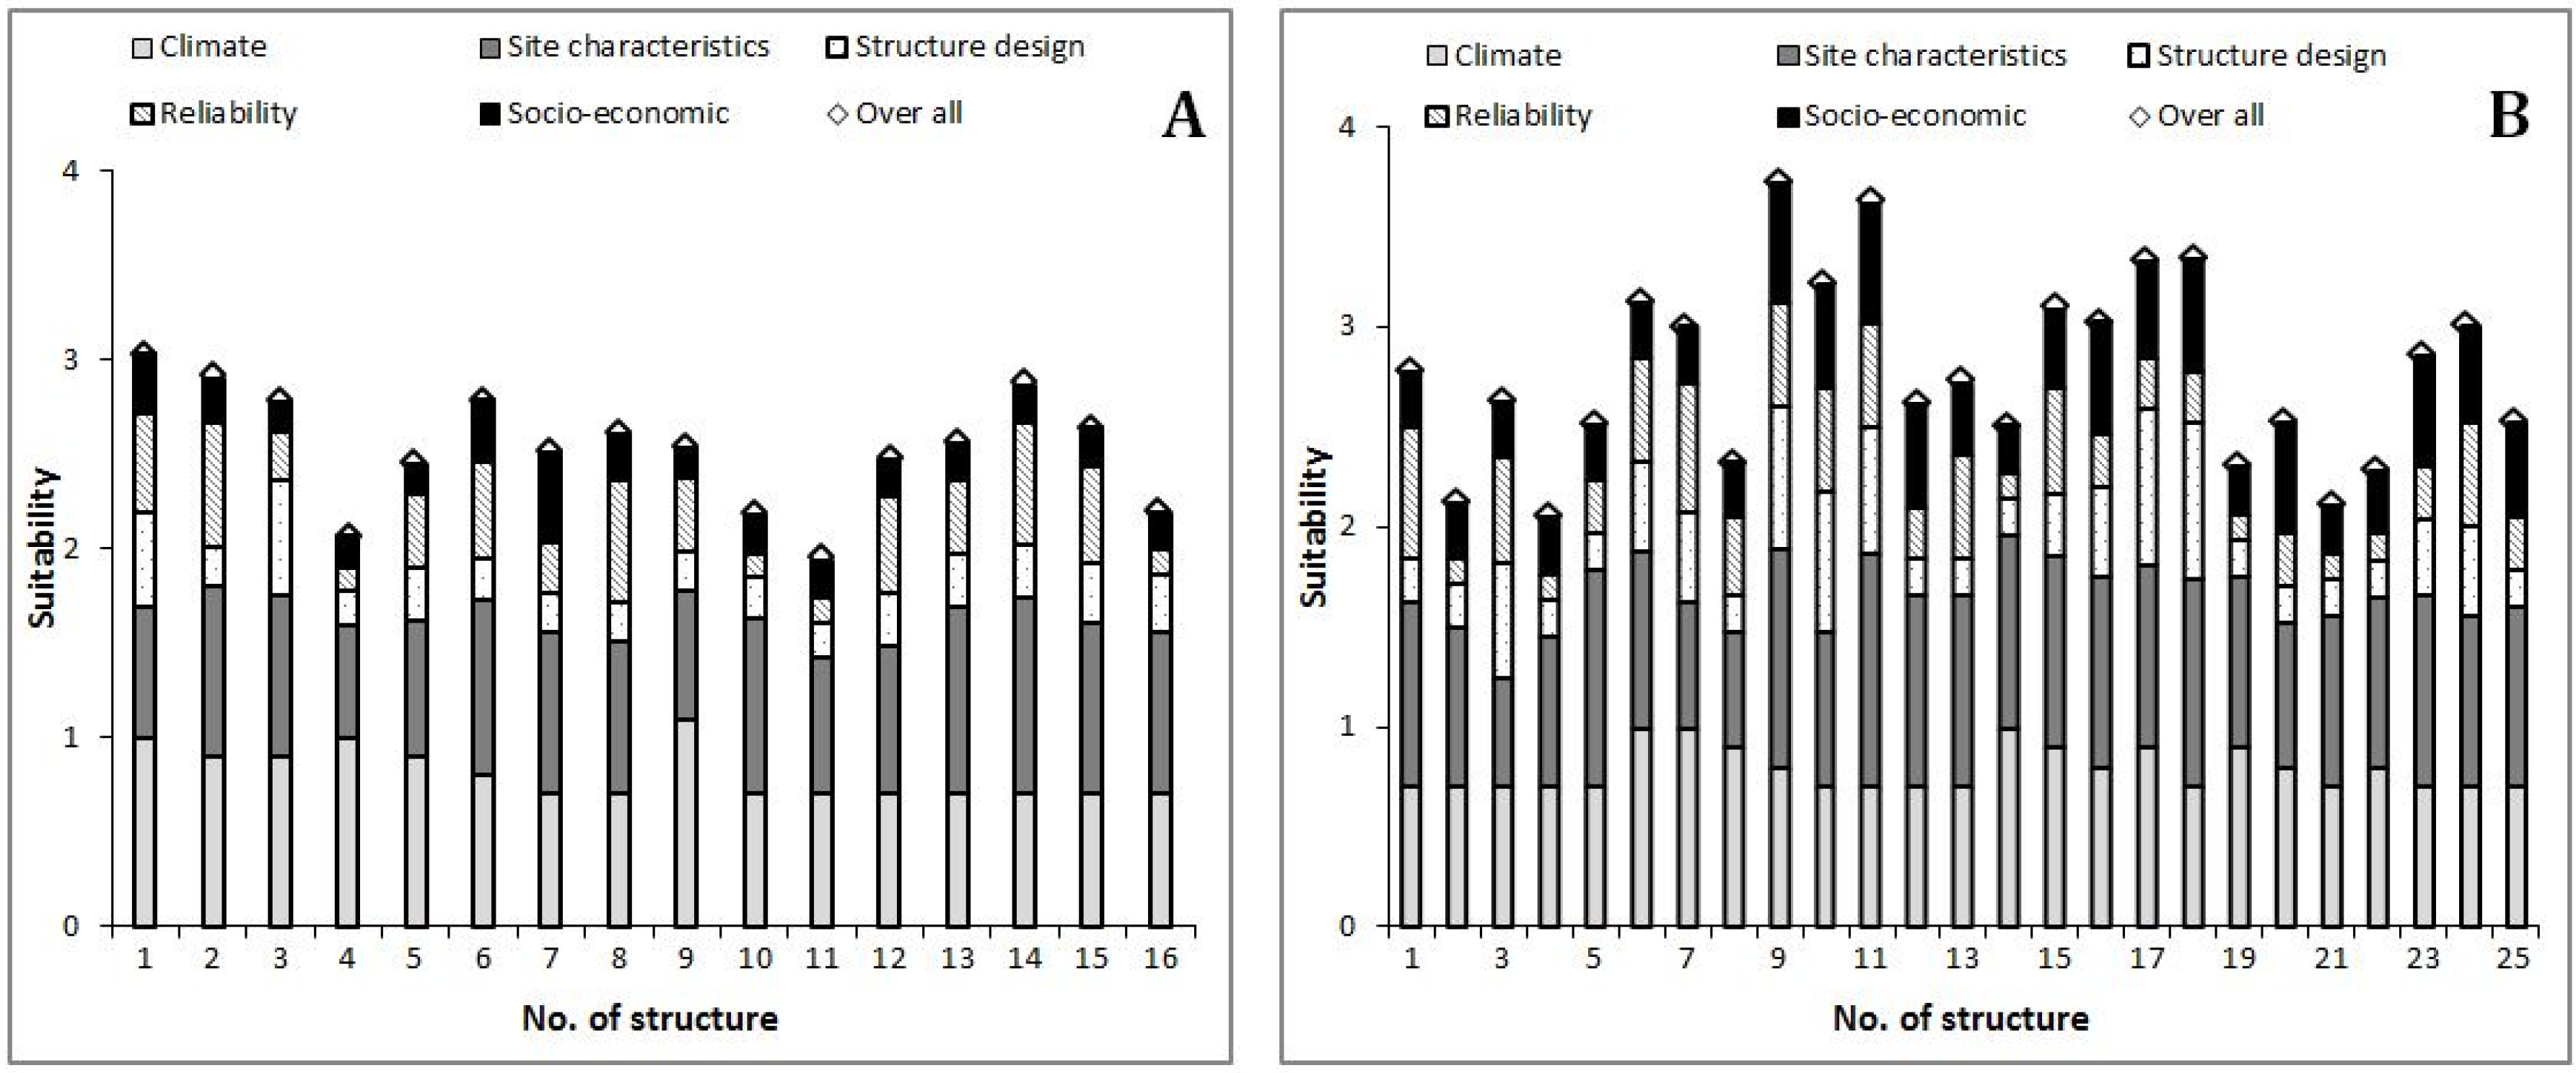
The suitability scores for each criterion and overall from applying Method 1 (three levels) in Sub-catchments 2 and 3 are shown in
Figure 7. The socio-economic criteria played a significant role in the assessment methodology here, especially for jessour in these sub-catchments (8–16 in Sub-catchment 2 and 1–8 in Sub-catchment 3) because of the high cost of implementing and maintaining the RWH compared with the relatively small area and low quantity of water retained behind the dykes. Moreover, these techniques are most common in this region especially in the mountain areas. They seem to be the most suitable techniques to mitigate flood hazard, additionally, the stakeholders consider them to be part of their heritage.
Table 7 shows the individual criteria and overall suitability scores for the highest and lowest scoring sites in Sub-catchments 2 and 3 after applying method 2.
Catchment to cropping areas ratio (CCR) has a significant effect on overall suitability scores in Sub-catchment 2, whereas in Sub-catchment 3 there was not a difference in CCR between the high and low scoring structures. Moreover, slope played an important role in the overall scores in Sub-catchment 3 but not in Sub-catchment 2 (
Table 7).
3.4. Comparison of Methods 1 and 2
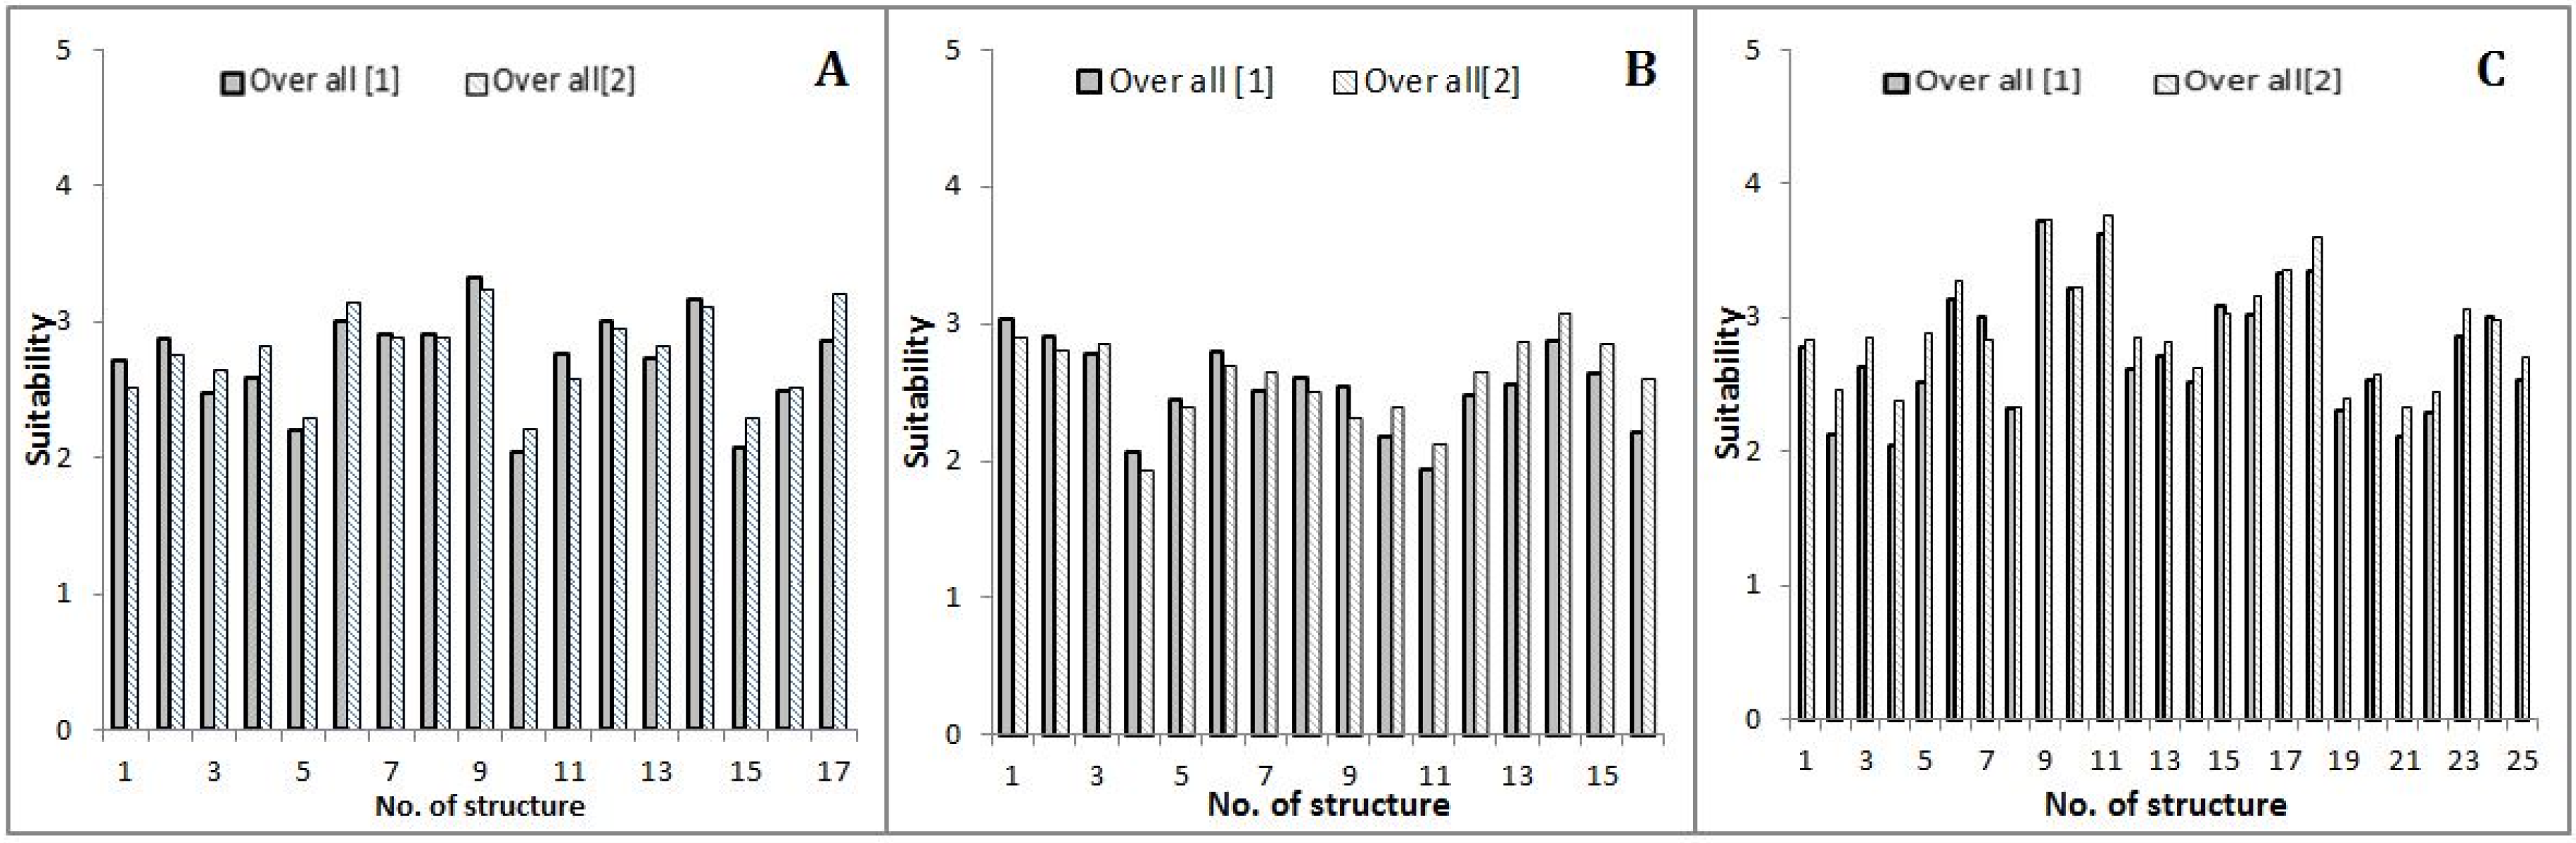
A comparison between the two methods of applying AHP (three and two levels structure) in our methodology is shown in
Figure 8. Although the results are very similar, Method 2 gives a slightly higher score for the jessour in Sub-catchment 2 (jessour 10–16) and Sub-catchment 3 (jessour 1–8).
The consistency of each matrix was calculated using the consistency ratio (cr). For the main criteria matrix in Method 1 cr was 2.9% and for the second method cr was 2.4%.
The principles of AHP call for the cr to be smaller or equal to 10%, therefore the cr values were acceptable.
These results suggest that both methods are good and easy to adapt to different criteria, thus researchers can apply either of the two methods.
3.5. Results Validation with the Stakeholders
Based on our discussions with farmers and data collection from literature, we assessed the performance of existing RWH with the evaluation tool. Then, the preliminary results were checked with our field observations and discussed with local farmers and experts. For instance, the RWH sites which scored 2 or lower (low suitability) had been abandoned and or most of their trees were dead. Whereas the sites that scored around 3 (medium suitability) showed well-maintained structures with healthy trees.
4. Discussion
Fifty-eight RWH sites (44 tabias and 14 jessr) in three sub-catchments were assessed and evaluated on their technical and economic performance as well on social aspects. Using our methodology, 65% of the assessed sites scored around 3 (medium suitability), 31% of the RWH sites got scores of about 2 (low suitability), and only 4%, two sites, scored 4 (high suitability). These results very accurately represent the real performance of each site—both overall and at individual criteria level based on the comparison of our observations and discussion with local farmers and experts. This suggests that the methodology developed is a valid way to assess the performance of RWH structures.
The percentage of each score for each criterion in all sites was shown in (
Figure 4). Rainfall had the same score (Score 3) in all sites because of there was no big difference in rainfall pattern nor amount in three sub-catchments. This means the rainfall indicator has no significant impact on overall suitability between sites in our case study, but it can be very important in the comparison between sites in the larger areas [
21] with a significant difference in rainfall. Moreover, significantly low score percentages were obtained by the design criteria, drainage length and cost, which was Score 1. For example, drainage length scored 1 for 48% of all sites. That means the distance between watercourses and RWH structures is big and the score would have been higher if these structures were built closer to the watercourse. If the RWH structures were located much closer to the watercourses, the contribution of drainage length to the overall RWH suitability would have been higher for our case study. Therefore, drainage flow has a significant impact on the performance of the RWH, which is not always the case for other types of RWH such as ponds, terraces,
etc.It is interesting to note that although the weight for climate criteria was higher than that for site characteristics criteria, 30% and 26% respectively (
Figure 5),the latter received the highest scores in most of the sites in all three sub-catchments (
Figure 6 and
Figure 7). This indicates that the sites are generally well selected for their purpose, and the site characteristics criteria had more impacts on the performance of RWH than other criteria such as climate, drainage and structure design. These results are similar to other studies, such as Al-Adamat [
6] and Mbilinyi [
16], who concluded that site characteristics are the most important criteria to be considered for design and implementation of RWH techniques.
Where RWH performance (suitability) was low, it was in most cases related to a shortcoming in the engineering design, lack of proper maintenance and the high cost of the water storage. The low performance of these RWH sites was confirmed by getting low scores of these criteria, as shown in
Figure 4. The evaluation using our methodology clearly shows which criteria should be addressed to improve the performance of, for example, RWH structure design and storage capacity criteria. Due to the small storage area relative to the dyke size, the cost per cubic meter of water, especially in the jessour, was very expensive—such as jessour 10 and 15 in Sub-catchment 1. These results confirm that water harvesting structures with small storage capacity can ultimately be more expensive than large structures, as shown by Lasage, R., & Verburg, P.H. [
4]. Therefore, if farmers can improve the dyke design and storage capacity area by following some basic engineering principles such as increasing storage area, constructing a regular spillway and providing periodic maintenance, they will be able to collect more water with less cost and keep the structure working for a longer period of time. Another example is the ratio between catchment size and cultivated area. Where this is not suitable, such as structures 11 and 21 in Sub-catchments 2 and 3, respectively, RWH structure performance can be improved by adapting the cultivated area to the effective area where the water is stored and adapting the crop type or cropping density (which determines the water requirement) to the amount of water stored.
In our methodology, two methods were applied (three levels and two levels of AHP hierarchy structure), and the results for both approaches were very similar. The consistency ratio for both methods was also similar and strong. Therefore, both methods are valid and provide reliable results. Both methods are simple to apply and easy to adapt the criteria in case of different RWH techniques and/or regions in order to cater to stakeholders’ objectives. While either method can be used, it is recommended to apply Method 1 (three levels). In Method 1, the impact of any errors in scores (from expert opinion or calculations) will be reduced through the two-step calculation.
In most previous studies, the number of criteria are limited and are aimed primarily at the selection of suitable locations for RWH [
1,
14] and do not consider other factors or performance over time. In addition, many of those studies were mainly desktop studies using GIS and RS, without including stakeholders’ objectives and constrains. Our study showed that socio-economic aspects play an important role in RWH suitability and performance. Thus, the inclusion of such criteria as occurs in our methodology is very important to the goal of meaningful information for improving current RWH effectiveness as well as planning for future structures.
A key precondition for the methodology was that it can be widely applied for different RWH techniques in different regions. In this regard, the structure of the methodology allows it to be easily adapted and applied to different RWH techniques and social-economic settings by simply changing the criteria selected. In addition, the case study showed that it is very possible to select criteria that are easy to assess and still provide accurate results without the need for complex analysis. This keeps the time investment and costs required within reasonable limits.
While Al-Adamat 2008 [
6], Jabr 2005 [
37] and Mbilinyi 2005 [
33] showed that MCA provides a rational, objective and non-biased method for identifying suitable RWH sites, our study demonstrates that combining MCA and expert opinion in a consistent way allows assessment and evaluation of RWH techniques beyond simply site selection. Site conditions and RWH structure performance are likely to change over time, especially in light of predicted climate change. Therefore, a methodology such as ours, which allows evaluation of the performance of current and potential RWH projects, and identification of necessary improvements, is of great value.
An important consideration in the application of our methodology that warrants mention is the establishment of the scores/weighting for each criterion. As this depends on expert opinion [
24,
27], it is essential to use several experts and take into consideration their area of specialty when analyzing and using their inputs.
5. Conclusions
An evaluation and decision support methodology/tool was developed and tested for assessment of the overall performance of existing RWH and criteria affecting that performance. A single-objective AHP supported by GIS was put to the test in the Oum Zessar watershed of south-eastern Tunisia to assess the performance of 58 RWH structures (jessour/tabias) in three main sub-catchments. Engineering (Technical), biophysical and socio-economic criteria were determined, weighted and assessed in this study with input from experts and stakeholders. The main conclusions are:
- (a)
The methodology provides an accurate evaluation of RWH performance when compared with the field investigations;
- (b)
The methodology provides a good insight into where in the system improvements are needed for a better performance;
- (c)
In the case study, most sites showed low suitability scores for the criteria structure design, drainage flow and cost, which resulted in a low score on the overall performance of RWH;
- (d)
Site characteristics criteria (both overall and individual criterion) play a more important role in the overall suitability than other criteria;
In addition, the methodology can be used to pre-evaluate potential new RWH projects, increasing the chances for good long-term performance. This case study application of our methodology confirmed that it is a highly flexible and applicable tool for the evaluation and improvement of RWH structures, and can employ many different, important and easy to access criteria and indicators in the assessment of different RWH techniques. The time and cost required in using this methodology are also low, making it accessible to the local RWH managers/communities.
To further validate the applicability of the methodology, it needs to be tested in different regions and with different RWH techniques. Moreover, the criteria related to socio-economic suitability/performance (i.e., ownership, family size, etc.) deserve further investigation. These suggestions will increase the reliability and applicability of our methodology so that it can be used for assessing the performance of existing and new planned RWH structures in any region. This new, scientifically-based evaluation and decision support tool provides a basis on which designers and decision makers can build efficient RWH systems to meet the objectives and needs of the communities in water-scarce regions.


