Article

Impacts of Floods on Organic Carbon Concentrations in Alluvial Soils along Hydrological Gradients Using a Digital Elevation Model (DEM)

by
Diane Saint-Laurent
1,2,*,
Roxane Paradis
1,
Ariane Drouin
3 and
Vernhar Gervais-Beaulac
1
1
Département des sciences de l’environnement, Université du Québec à Trois-Rivières, C.P. 500, Trois-Rivières, QC G9A 5H7, Canada
2
Géographie et Laboratoire de Recherche en Géomorphologie Fluviale et sols, Université du Québec à Trois-Rivières, C.P. 500, Trois-Rivières, QC G9A 5H7, Canada
3
Société Hydro-Québec, 75, boul. René-Lévesque Ouest, Montréal, QC H2Z 1A4, Canada
*
Author to whom correspondence should be addressed.
Water 2016, 8(5), 208; https://doi.org/10.3390/w8050208
Submission received: 8 February 2016 / Revised: 6 May 2016 / Accepted: 10 May 2016 / Published: 18 May 2016

Abstract

:
This study examines the spatial distribution of the organic carbon found in alluvial soils affected by successive floods. In flood zones, very little is known of the processes associated with the development of soils subjected to frequent flooding, in particular with respect to the accumulation of litter and organic carbon concentrations. The aim of this study is to better understand the distribution of organic carbon based on various hydrological gradients associated with flood recurrence. A digital elevation model was developed from LIDAR data to assess the microtopography of the site, and further delineate floodplains and no-flood zones. Various soil properties were considered in addition to organic carbon, such as pH, soil bulk density, litter, drainage, and topographic levels (elevation). The results show that the soils in the frequent-flood zones (FFz, recurrence of 0–20 years) have significantly less total organic carbon than the soils in the no-flood zones (NFz) and the moderate flood zones (MFz, 20–100 years). Average values obtained for the surface horizons (0–20 cm) vary by 1.74% ± 0.85% (FFz), 3.34% ± 1.09% (MFz) and 3.54% ± 1.77% (NFz), respectively. The absence of ground litter in the frequent flood zones helps decrease the input of organic matter in the surface horizons and progressively results in soil depletion.

1. Introduction

Organic carbon and the other nutrients found in soil play a key role in soil-forming processes, in addition to contributing to soil fertility and quality [1,2,3,4,5]. In fact, organic matter in these various forms (e.g., labile fractions, humus) plays a role in several biogeochemical processes with a direct impact on plant–soil interactions [6,7,8,9]. Furthermore, organic compounds found in soil allow relatively stable reservoirs to be formed that limit CO2 losses to the atmosphere [10,11]. Soil organic carbon content can vary based on edaphic and morphosedimentological conditions, in particular in riverbanks with different hydrological, sedimentological and topographical conditions [12,13,14,15]. Sediment transported by currents during freshets, for instance, can modify soil carbon content and result in soil depletion or enrichment [16,17]. In addition, the remobilization of sediment transported downstream can also alter the carbon flow in riparian soils in the catchment [17]. It is therefore important to determine spatial variability of the organic content on a micro scale, especially in active zones subject to a multitude of hydrological variations and periodic flooding. In frequent flood zones, little is known about the variability of organic carbon content in alluvial soils, in particular in relation to the accumulation or loss of litter, the retention potential of organic carbon in the profile and other properties of the soil subject to frequent floods [18,19]. Furthermore, there are relatively few studies on the soil-forming processes in floodplains subject to periodic flooding [20,21]. The characterization of alluvial soils, the edaphic and microtopographic conditions, along with flood episodes are key elements for analyzing the spatial variability of the soil organic carbon content [21,22], in addition to understanding the dynamics of and changes in the river system [23,24,25].
In zones subject to frequent flooding (e.g., every two to three years), the litter that accrues on the surface of the soil during the growing season may be stripped and carried off by the current during the spring and fall freshets. This loss of litter significantly reduces the contribution of organic carbon and over time causes soil depletion [26,27,28]. This can hinder the main soil-forming processes and biogeochemical cycles, in addition to having an impact on plant–soil interactions and riverside ecosystems [29,30].
The main purpose of this study is to analyze the spatial variability of the total organic carbon content in alluvial soils affected by floods using a hydrological gradient that crosses through two distinctive flood recurrence zones (intervals of 0–20 years and 20–100 years), as well as a no-flood zone. A digital elevation model (DEM) was developed to determine the organic carbon content based on the topographic levels in the frequent-flood zones. The DEM was developed based by surveying several geodesic points (200 points) in the field using a differential GPS and a total station in the frequent-flood zone (interval of 0–20 years). Detailed mapping based on LIDAR images was also done to obtain the microtopography for the entire site for the purpose of assessing as precisely as possible the spatial variability of organic carbon for both alluvial and non-alluvial soils. Besides organic carbon, different soil properties were included in the data analysis such as acidity (pH), textural classes, soil bulk density and soil litter, as well as drainage, groundwater and plant cover measurements. The study area covers the Richmond region (southern Québec), which is characterized by a vast floodplain under a forest cover that is subject to frequent flooding.

2. Materials and Methods

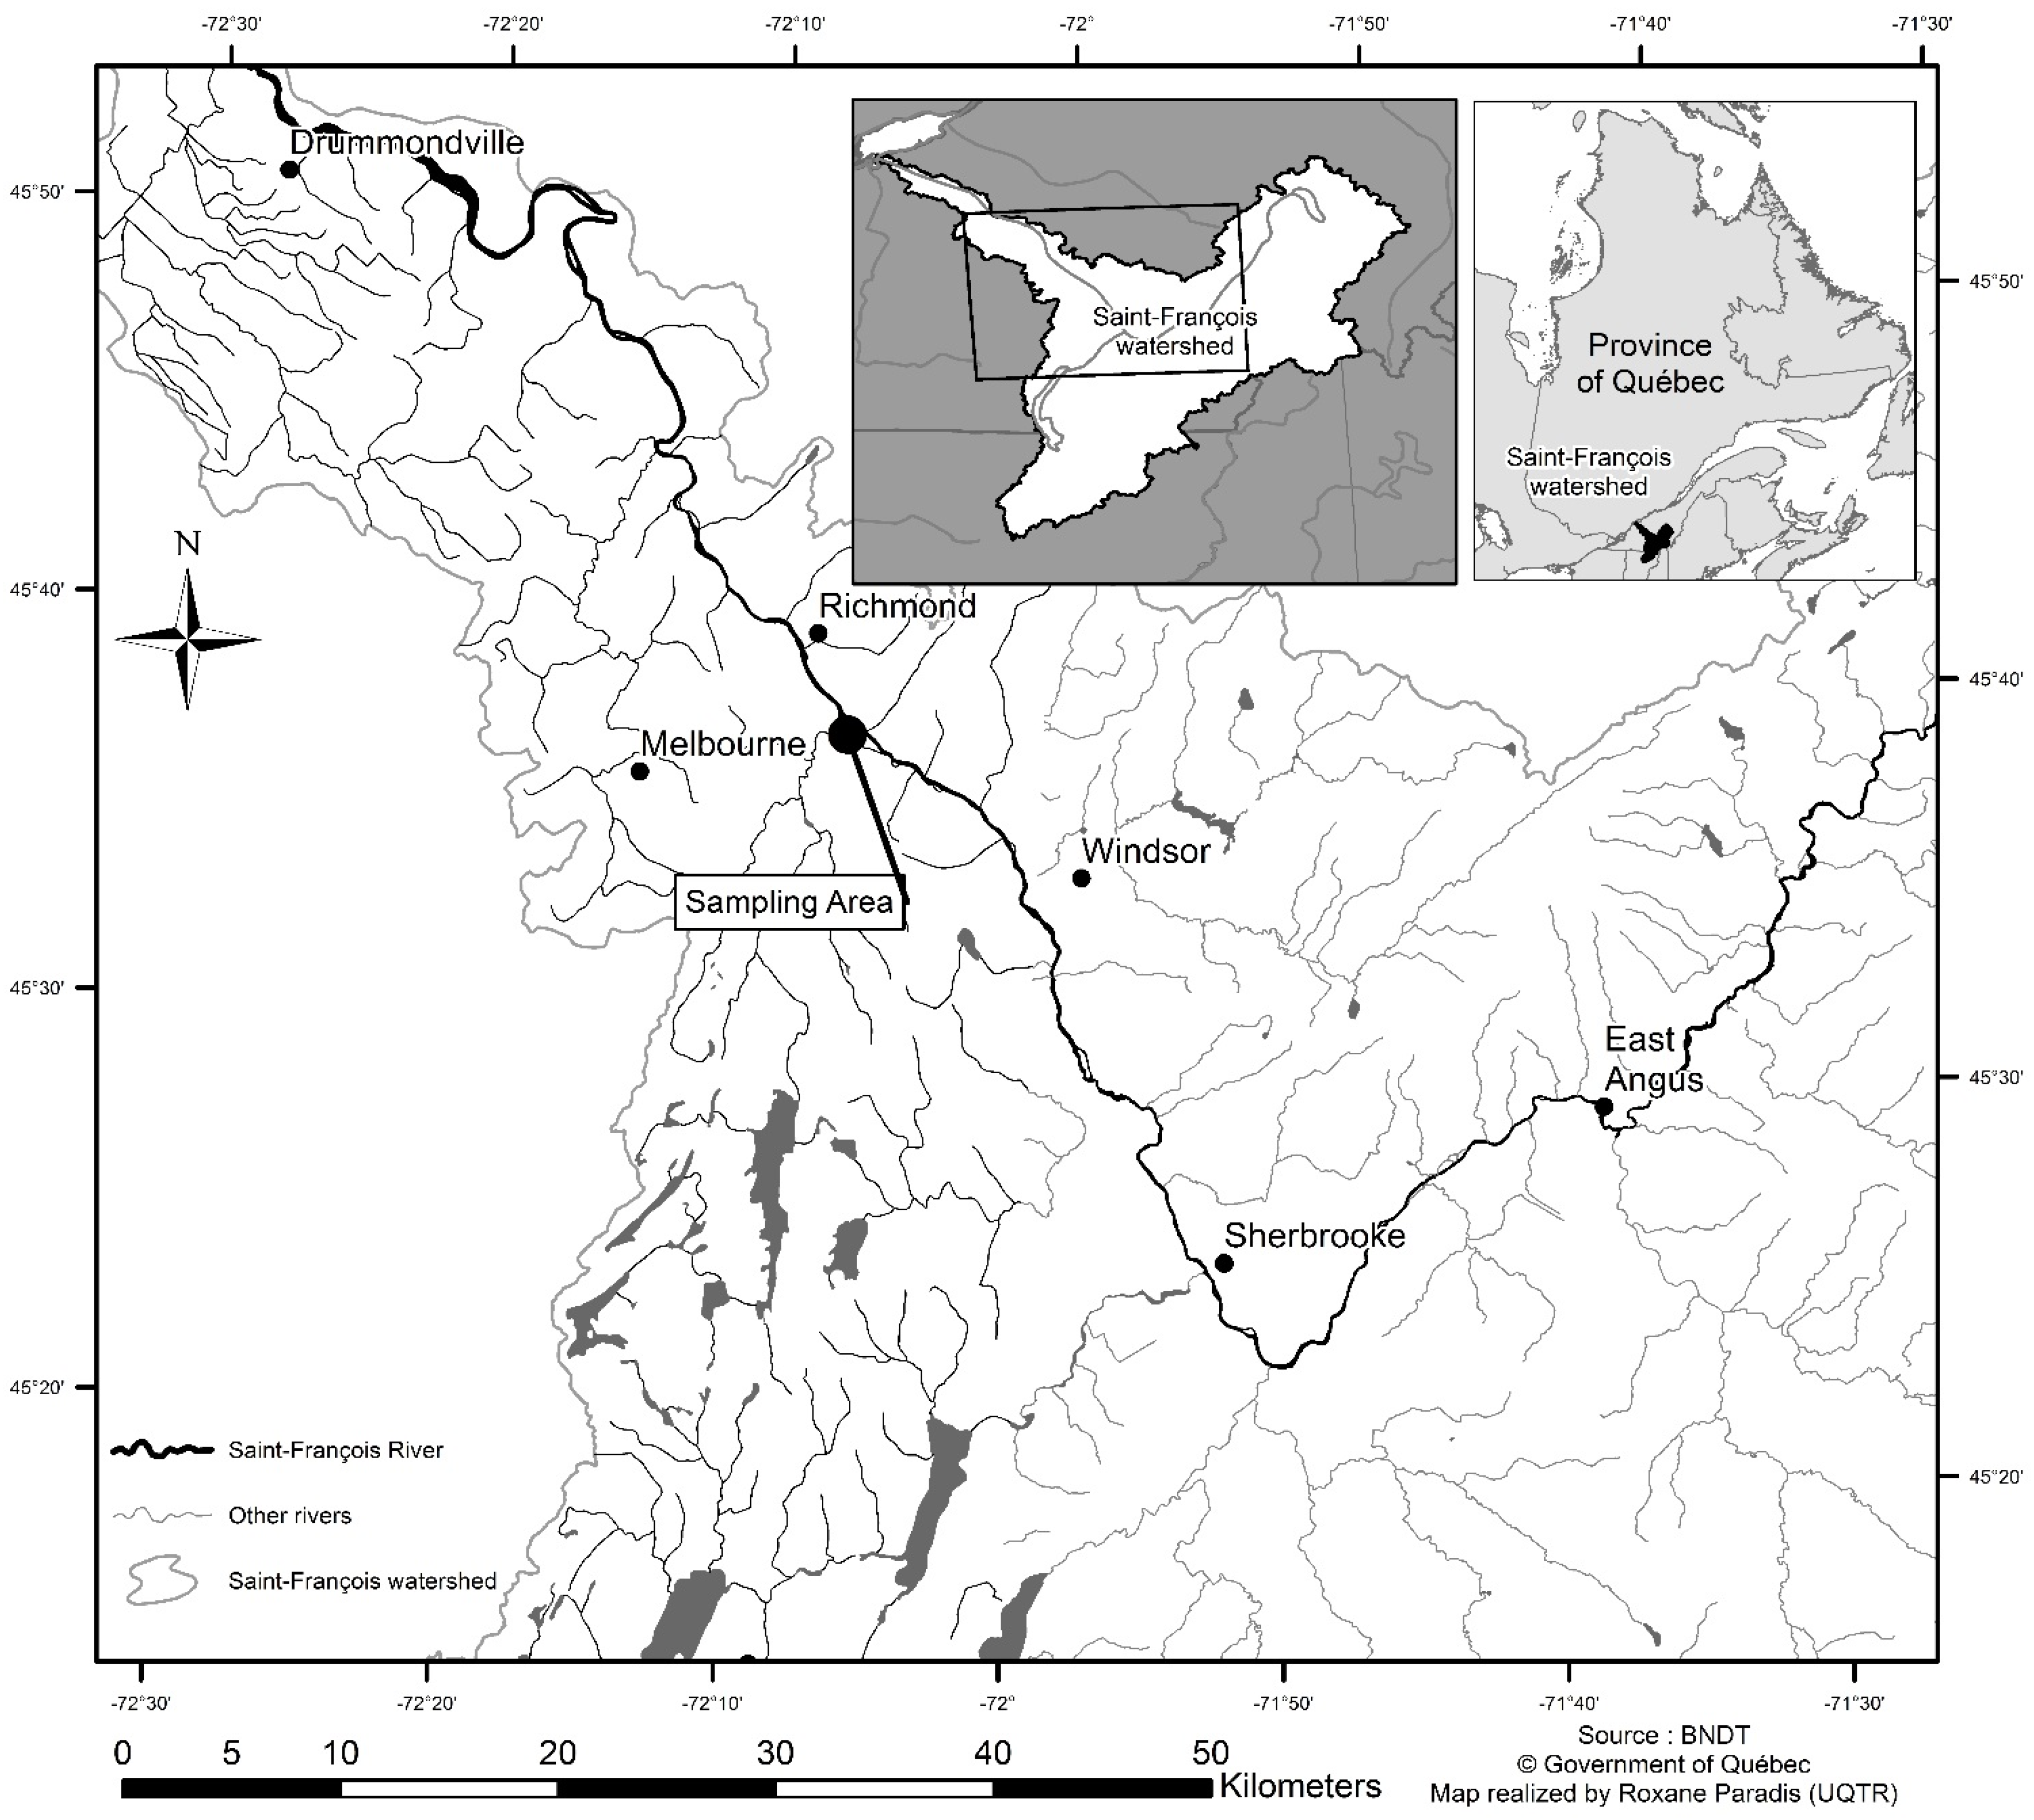
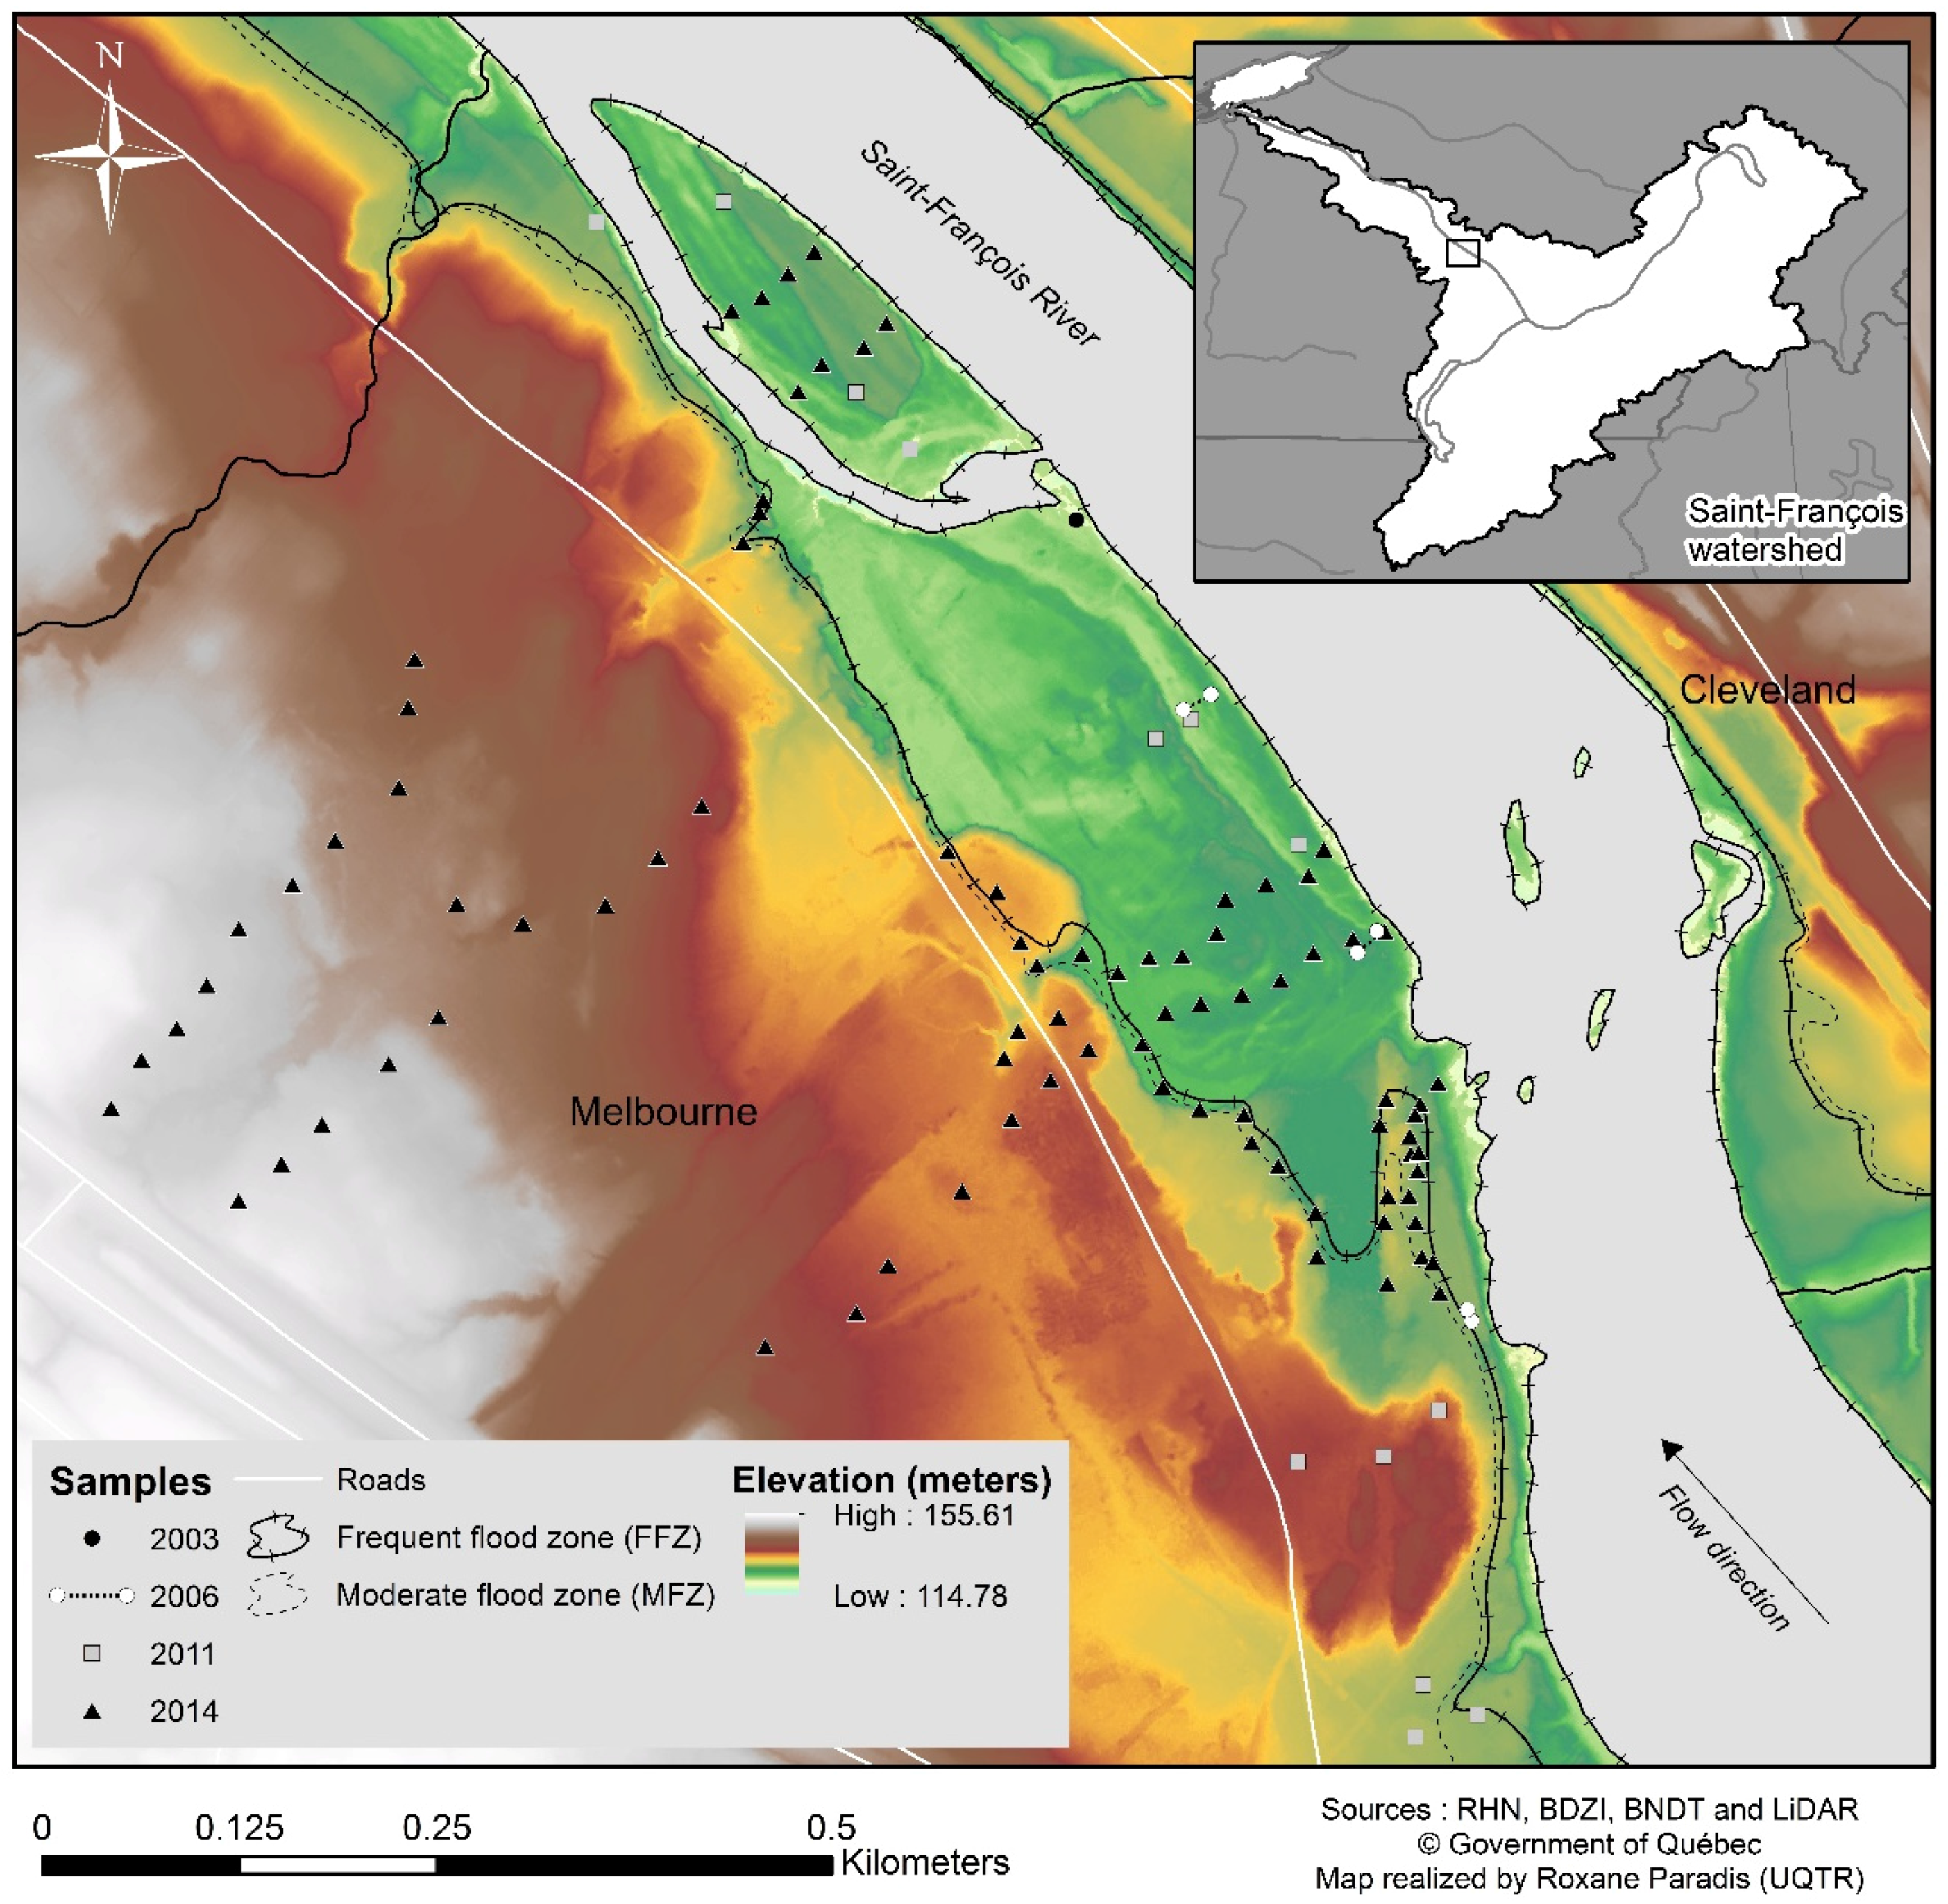
2.1. Selection of Sites and Collection of Soil Samples

The study area is located in a vast floodplain on the left bank of the Saint-François River, which is part of a major water system in southern Québec (Figure 1). In the study area, located between Windsor and Richmond, the Saint-François River crosses through wooded areas, uncultivated and cultivated farmland, interspersed with inhabited areas. The forests and uncultivated farmland are most often found on the low terraces (1–2 m in height) of the river which are covered with fine river deposits, while higher terrain is mainly characterized by reworked till or glacial deposits, glaciolacustrine sediment and rocky outcrops [31], most often under a forest cover. Floodplain riparian stands are mainly characterized by red ash (Fraxinus pennsylvanica Marsh.), silver maple (Acer saccharinum L.), sugar maple (Acer saccharum L.) and balsam fir (Abies balsamea L.), while slopping terrain is characterized by hemlock (Tsuga canadensis L.), white pine (Pinus strobus L.), fir (Abies balsamea L.) and yellow birch (Betula alleghaniensis Britton) [32]. The floodplain soils are part of the Cumulic Regosol (CU.R) and Gleyed Cumulic Regosol (GLCU.R) subgroups in the Canadian System of Soil Classification, whereas the no-flood zones are mainly characterized by brunisolic and podzolic soils [31]. Lastly, this region is known for its cool, damp climate, with annual average temperatures of 4.11 °C and average annual precipitation of 1107 mm (1981–2010) [33] (Station no. 7028124). Table 1 shows the hydrological data of the Saint-François River (middle section) and the study area located between Windsor and Richmond, as well as flood-recurrence data recorded for this study area (1900–2015).
The sampling period was held from August to November 2014. The soil sampling sites were located along transects perpendicular to the riverbank within the floodplain that cuts across wooded areas and uncultivated farmland (Figure 2). The layout of transects inside the site took into account the site topography and the cartographic boundaries of the different flood recurrence zones determined with official flood risk maps (scale of 1:10,000) produced by Environment Canada and the Ministère de l’Environnement du Québec [34]. The method used to map flood risk zones is based on the level-discharge relationship using theoretical methods of estimation and mathematical formulas. Flood level data collected in the field can also be used for the mathematical models. These boundaries consists of two flood-risk zones, including the zone with a flood recurrence period of 0–20 years (frequent flood zone (FFz)) and the zone with a flood recurrence period of 20–100 years (moderate flood zone (MFz)). The transects also extend beyond the flood zone boundaries, thus cutting across an area outside the floodplains (no-flood zone (NFz)). Soil samples were collected along the transects from the riverbank to past the floodplain’s outer boundaries (over 700 m in distance).
The samples were collected every 50 m using an Eijkelkamp hand auger at predetermined depths (0–20, 20–40, 40–60, 60–80 and 80–100 cm). Additional samples were taken on the soil surface (0–20 cm) every 25 m along the transects, for a total of 155 soil samples. A characterization of the soil litter along with a description of the dominant plant species were noted at each sampling station, as well as measurements of the bulk density of the soil surface horizons (0–20 cm), the microtopography, the presence/absence of groundwater, and the surface drainage based on the criteria outlined in the Canadian System of Soil Classification [35] and the Manual on Soil Sampling and Methods of Analysis [36]. Lastly, other soil data (n = 45) from recent studies (2003 and 2006) on the same Richmond site were incorporated into the database in order to compare all the results [27,37,38]. The position of the sampling points along the transects was determined using a GPS (Garmin 60CSx, Kansas, MI, USA), after which the data were exported into mapping software (ArcGIS® 10.2, ESRI, Redlands, CA, USA).
A digital elevation model (DEM) was developed using LIDAR images in order to view the various topographic levels of the site with all sampling points. The LIDAR images come from the Ministère de l’Énergie et des Ressources naturelles [39], databases dated May 2013 (sheet CM54-Lidar-hyd/13). These data are used to view the main topographic variations of the terrain through the processing of images captured by high-resolution laser (altimetric precision of 15 cm). Part of the floodplain found in the 0–20-year flood recurrence zone was also mapped and a 3D digital terrain model (DTM) was developed to view the microtopographic variations of the site associated with the effect of successive flooding [28]. In the latter case, GPS surveying was done along several transects perpendicular to the shoreline at 10-meter intervals, and additional readings were also made at each break in slope so as to represent the site microtopography as precisely as possible. Slightly more than 200 points were taken for the digital terrain model (DTM) of part of the floodplain (40 m × 130 m) included in the 0–20-year flood recurrence zone. Topographic data acquisition was done in the field using a differential GPS (Trimble 5700/5800, Model RTK, Trimble Navigation Limited, Dayton, Ohio, USA) and a total station (Leica TCR705, Leica Geosystems AG, Heerbrug, Switzerland). The 3D visual representation of the site microtopography is shown in Figure 3.

2.2. Soil Analysis Methods

Soil samples were analyzed to characterize their main physical and chemical properties, mainly consisting of total organic carbon content (TOC), acidity (pH), soil bulk density, litter, soil layer colors (Munsell color system), and texture based on the particle-size classes in the Canadian System of Soil Classification [35]. The samples were dried in the laboratory and then sieved through a wire sieve (<2 mm). To determine the proportion of the various particle sizes (sand, silt and clay), the samples were analyzed using a laser particle sizer (Fritsch “Analysette 22” MicroTec Plus, Fritcsh GmBh, Idar-Oberstein, Germany). Other soil samples collected between 2003 and 2006 were analyzed using the Bouyoucos method (densimetry measurement). This last method is as accurate as the laser method but requires more time and laboratory handling. Results of soil particle size analyzes were converted to percent. The method used to measure the pH was taken from Soil Sampling and Methods of Analysis [36], which uses a CaCl2 solution (0.01 M) at a ratio of 1:2. Soil acidity was measured using an electronic pH meter equipped with a glass electrode.
Total organic carbon content (TOC) was determined using the method developed by Yeomans and Bremner [41], the main steps of which are as follows: (1) the samples are placed in a digestion tube to which 5 mL of potassium dichromate (K2Cr2O7-H2SO4) is added for 30 min. The digestion tube is then heated at 170 °C for 30 min; (2) the sample is cooled and solutions of anthranilic acid (0.3 mL) and sodium carbonate are added; and (3) this is followed by titration with a solution of ammonium ferrous sulfate (0.05 mol L−1). Soil bulk density was measured in the field using the metal cylinder method at depths of 0–20 cm, and the composition and thickness of ground litter were measured in centimeters in each site. The measurements were taken of the surface of the litter layer to the mineral surface (0 cm) with the metallic rule (centimeter units). Soil sample pretreatment and grain size analysis were performed in our laboratories (UQTR) and the chemical analyses were done in the soil laboratory of the Université Laval (Forestry, Geography and Geomatics Department, Québec, Canada).

2.3. Statistical Analyses

Soil properties (pH, total organic carbon content, textural classes (sand, silt and clay), soil bulk density, and soil litter measurements were compiled and analyzed using standard statistical processing. First, data distribution and normality were checked using the Shapiro–Wilk test for variables with a greater disparity (TOC and pH). Next, an analysis of variance (ANOVA) and the Tukey’s test were used to check the values of the resulting averages and the statistically significant thresholds (p-value) compared to different variables and groups that were analyzed based on the different flood recurrence zones (FFz and MFz) and no-flood zone (NFz). All statistical processing was done with a confidence interval of 95% (p = 0.05) using R statistical software (version 3.1.2, DataNet Quality Systems, Southfield, MI, USA).

3. Results

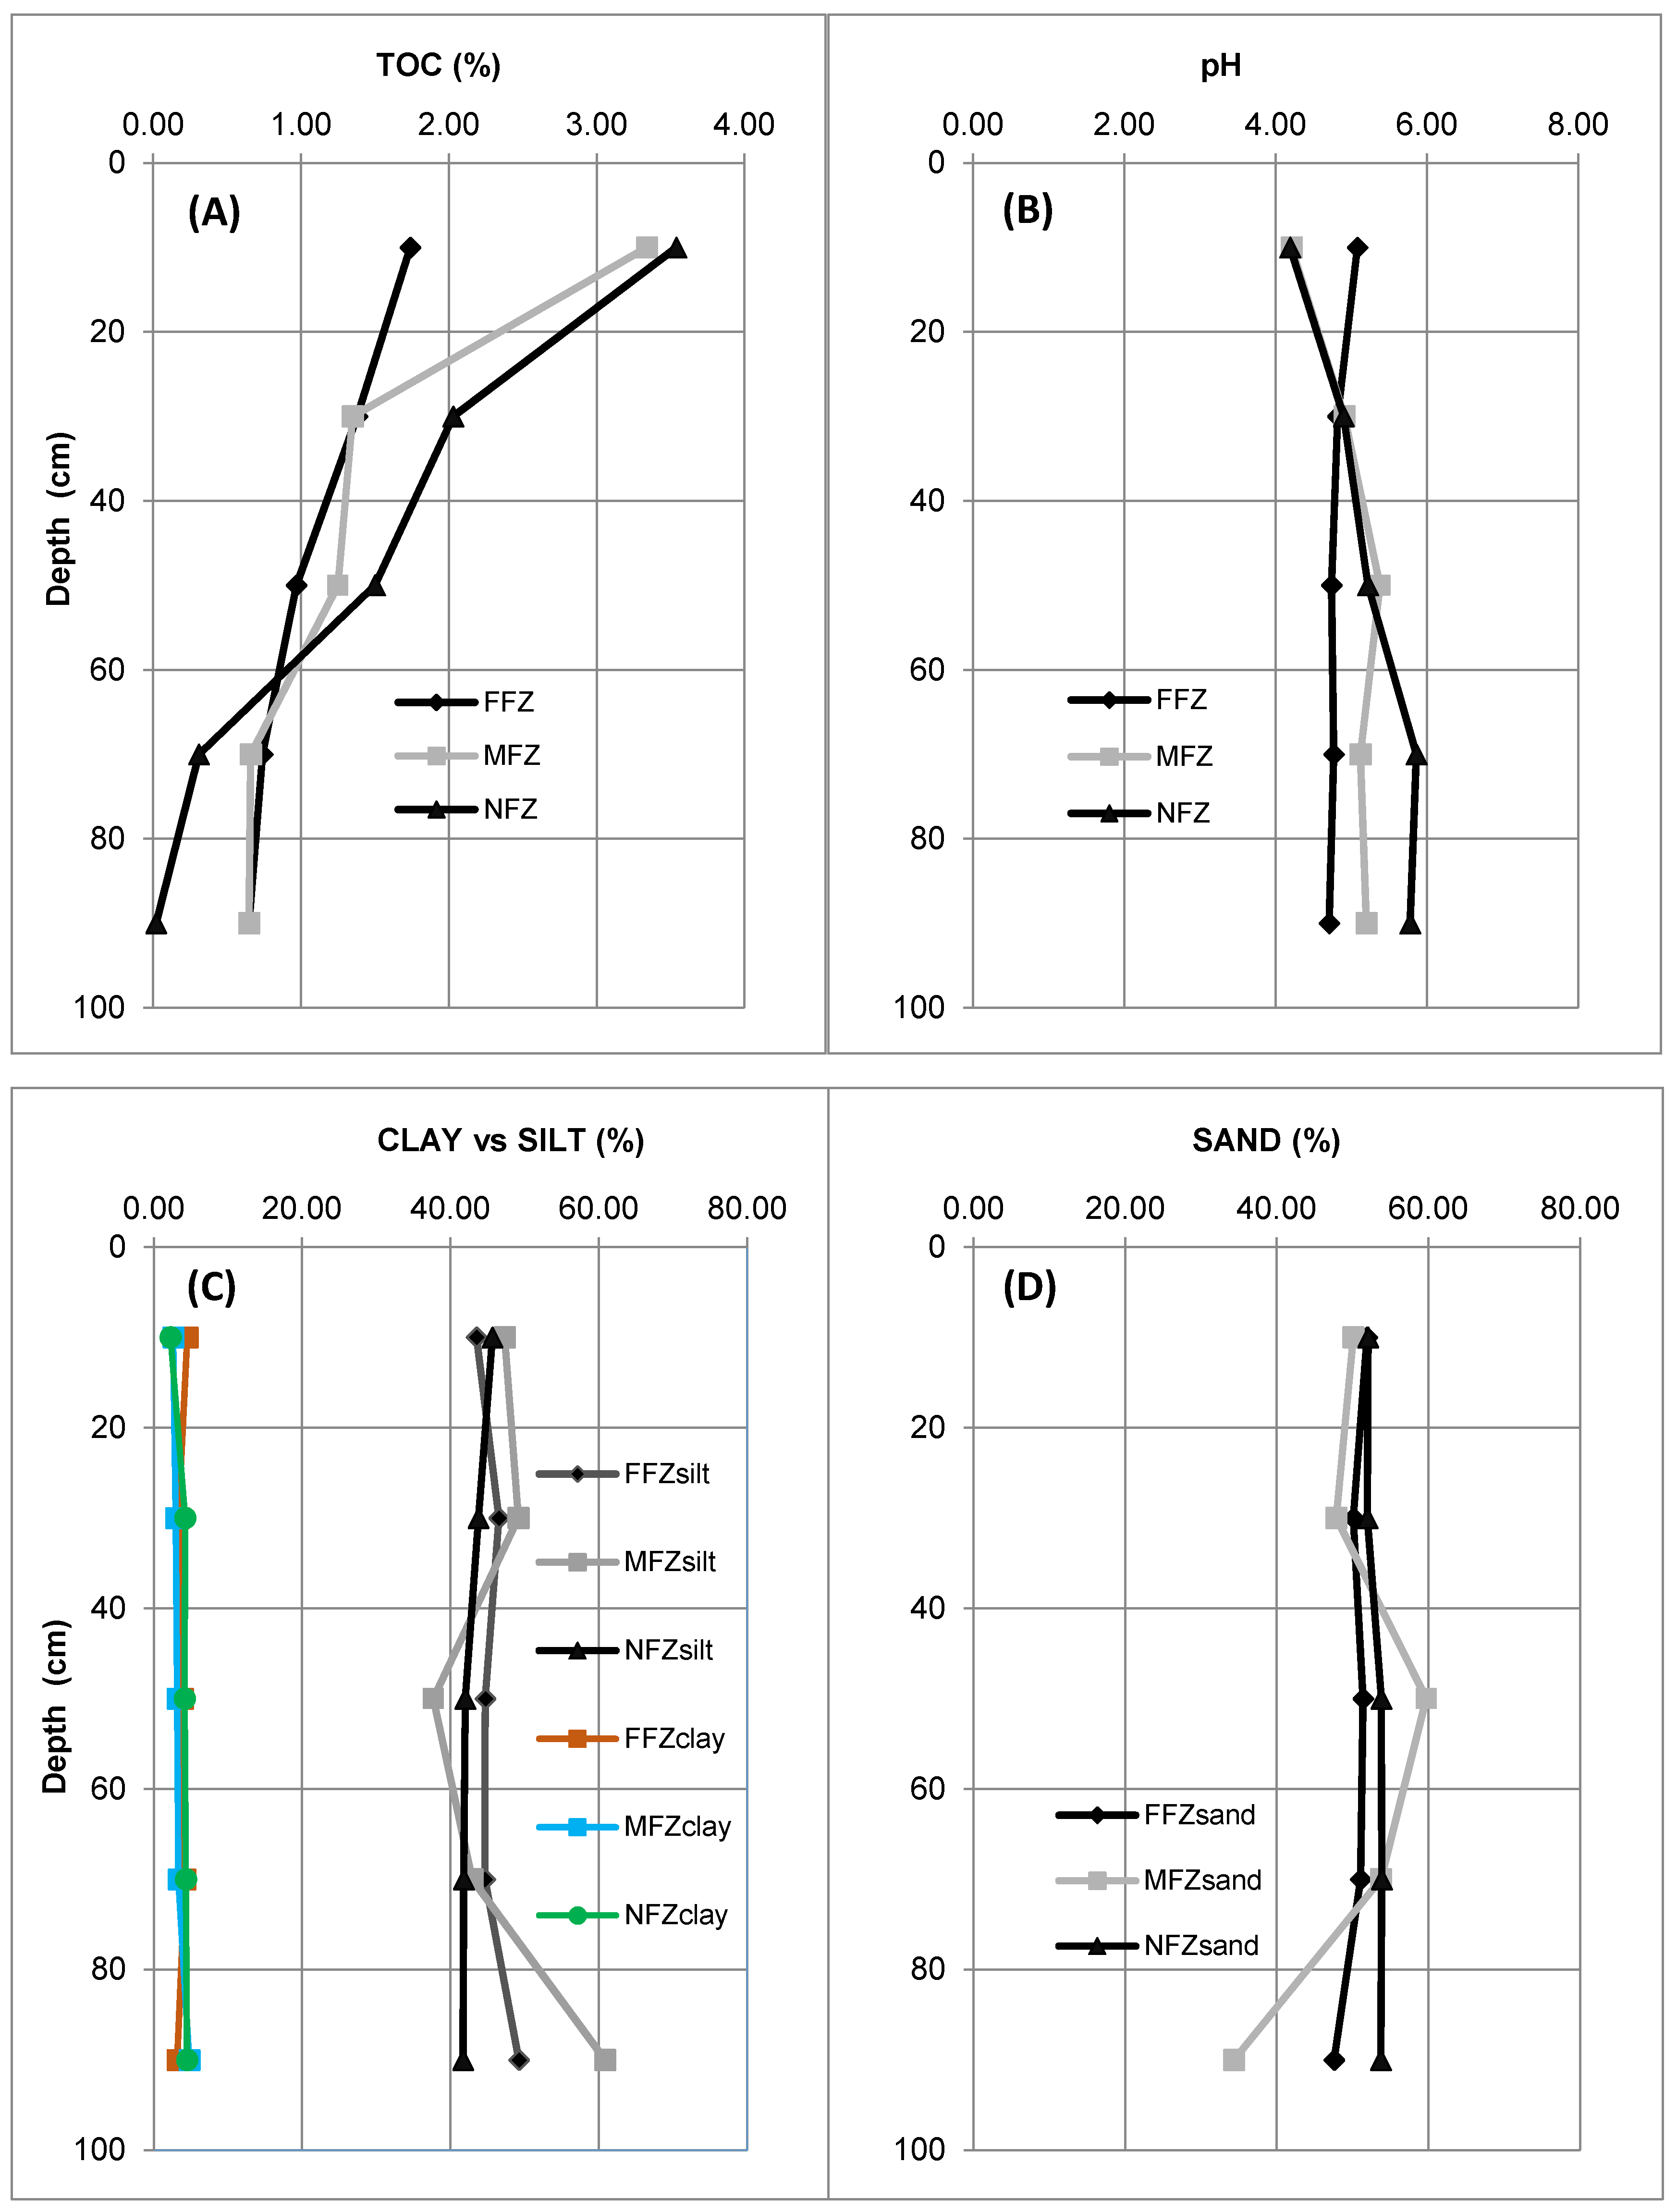
3.1. Textural Variability and Soil Acidity

Soil samples collected in the alluvial zone are made up of fine material, mainly loamy sand and silt loam (Table 2). Little variability was noted in the textural classes between the soil in the flood zones (FFz and MFz) and the soil outside the floodplains (NFz), although the clay content is sometimes greater in the frequent flood zones. Mean values and standard deviations obtained for the clay and silt fractions of the soil in the frequent flood zones (FFz) are roughly 4.6% ± 4.0% and 43.5% ± 17.7% (FFz), respectively. For the moderate flood zones (MFz), the values are 1.9 ± 0.8% for the clay fraction and 47.3% ± 9.7% for the silt fraction. For soils in the no-flood zones (NFz), the resulting values are 2.3% ± 2.1% and 45.6% ± 11.6%, respectively, which are proportions that are comparable to those in the moderate flood zones, although coarser matrices containing gravel and pebbles in the soil profile are often found.
With respect to soil bulk density, no notable differences were found among the resulting values for the three zones (Table 2). The average density for each zone is 1.00 g/cm3 (FFz), 0.99 g/cm3 (MFz) and 1.08 g/cm3 (NFz), respectively. This is due in part to the low textural variability of the surface soil (0–20 cm), which presents comparable proportions among the different zones. The lowest density (0.39 g/cm3) comes from the no-flood zone (NFz), while the highest value (1.58 g/cm3) was measured in the moderate flood zone. The density of the mineral matrices is often influenced by the high levels of micro or macroaggregates. Lower values can therefore be expected in the NFZ soils, which contain more organic matter and more highly-developed structure.
Lastly, with respect to soil acidity, the pH levels are slightly higher in the FFz floodplains than in the other two zones (MFz and NFz). For these zones, the average resulting values are 4.21 ± 0.80 and 4.19 ± 0.85, respectively (Table 2), compared to 5.08 ± 0.65 for the FFz. The statistical tests that were performed (ANOVA) on the pH levels of the different zones that were studied reveal no significant difference among the three zones, although the resulting value for the surface horizons is close to the statistically significant threshold of 0.05 (p = 0.0657). The coefficients of variation are also provided in Table 2. The highest variations calculated between each zone concern the clay content.

3.2. Surface Soil Litter

With respect to the different flood zones and the zones outside the floodplains, major differences can be noted regarding the accumulation and composition of the soil litter. The zones outside the floodplains (NFz) have significantly thicker litter than the frequent flood zones (FFz), which have often been stripped of it. In calculating the frequency associated with the presence of soil litter for the different zones, a value of 24% is obtained for the frequent-flood zones, while for the two other zones (MFz and NFz), litter is found in 99% of cases (Table 3). For the FFz, the soil litter is virtually absent, for a null median value (0 cm), while for the other zones, the median thickness values are about 1.0 and 2.2 cm. The minimum and maximum thickness values obtained for each zone (FFz, MFz and NFz) are about 0–5.5 cm, 0–11 cm and 0–13 cm, respectively. The no-flood zones are characterized by thicker litter made up of organic debris that is often more diversified and degraded (presence of thin humic layers on the surface).

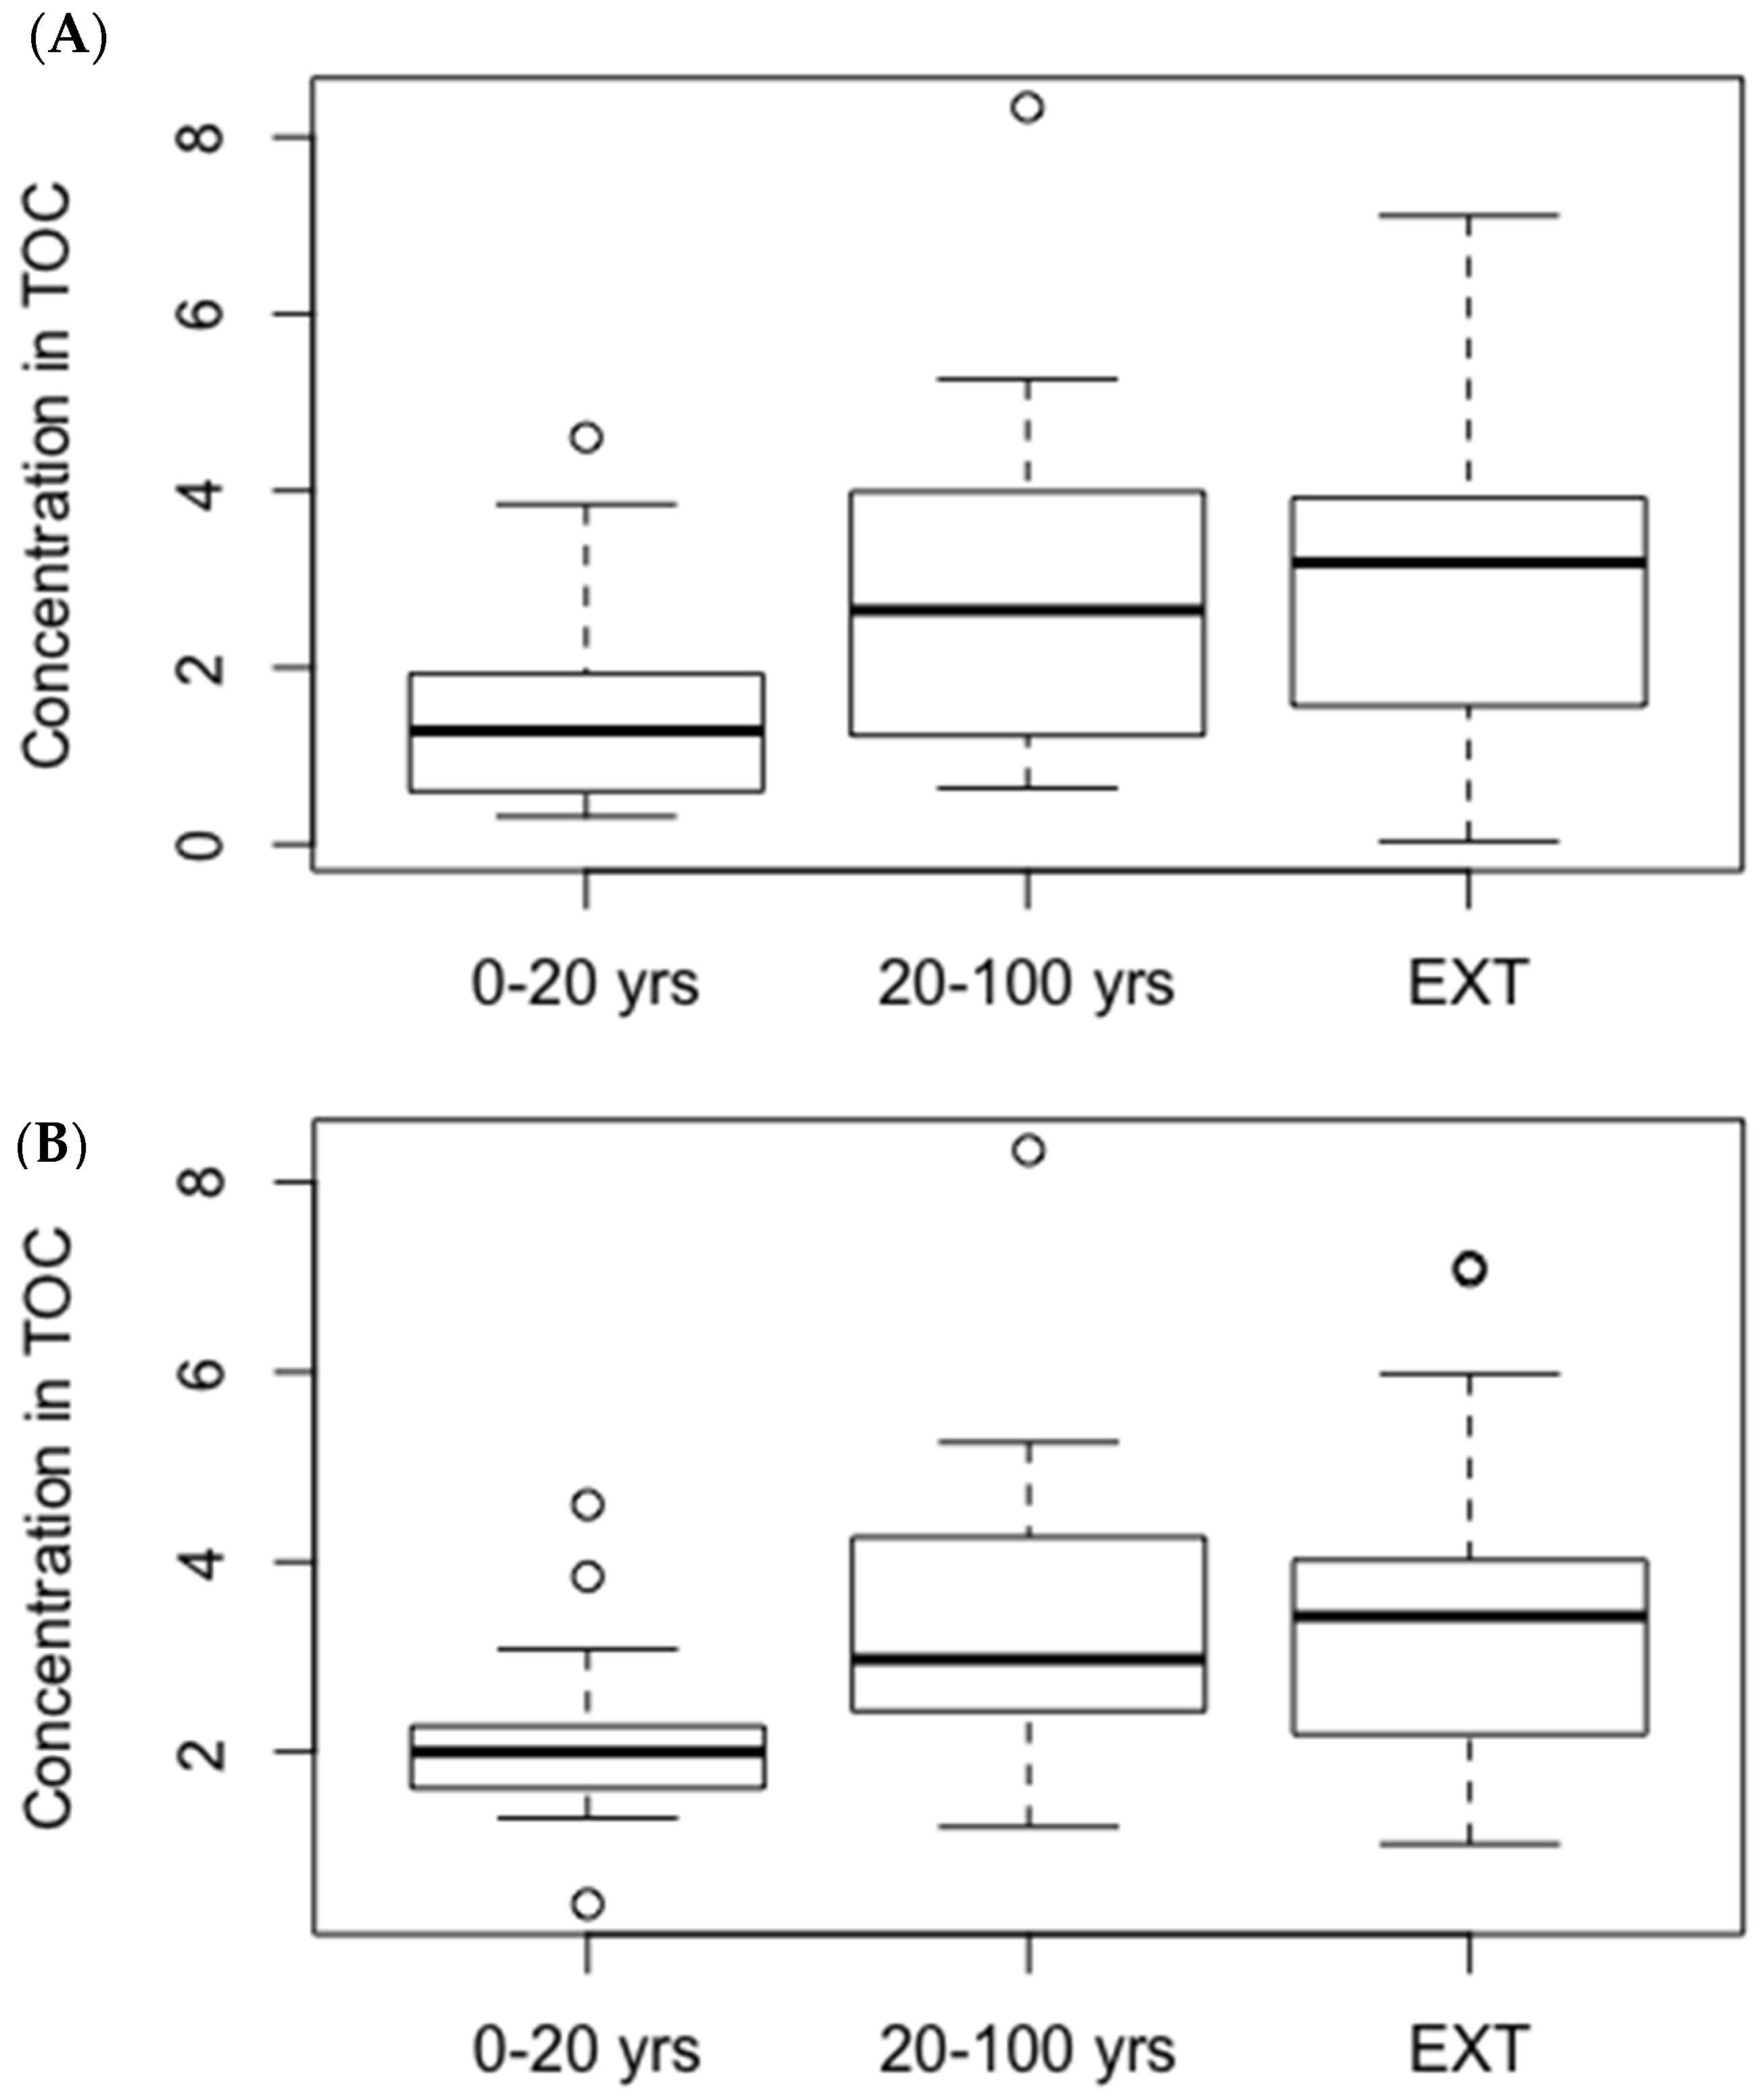
3.3. Total Organic Carbon Content

The total organic carbon content (TOC) differs significantly based on the different zones analyzed. The average TOC for the surface soil (0–20 cm in depth) in the flood zones is between 1.74% ± 0.85% (FFz) and 3.34% ± 1.09% (MFz), whereas the mean value for the no-flood zones (NFz) is 3.54% ± 1.77%, with minimum and maximum values between 8.75% and 0.85% (Table 2). The analysis of variance (ANOVA) and the Tukey’s test that were conducted on the soil organic carbon content in the different zones that were analyzed show significant differences among zones (Figure 4a,b). The values obtained for the surface horizons (0–20 cm) based on the zones being analyzed are, respectively, p = 0.0008 (FFz and MFz), p = 0.0002 (FFz and NFz), and p = 0.9849 (MFz and NFz) (Figure 4a), while for the statistical values for the entire profile (0–100 cm) are p < 0.001 (FFz and MFz), p < 0.001 (FFz and NFz) and p = 0.99817 (MFz and NFz) (Figure 4b). Comparable values were obtained for the surface horizons covering the soil data from 2003 to 2014 (p < 0.001) [31,37,38]. The TOC for the soils that were analyzed are therefore comparable between the MFz and NFz areas, whereas the soils in the frequent-flood zones stand out through their lower organic carbon content.

3.4. TOC and Other Properties in the Soil Profiles

There are notable differences in the vertical distribution of the organic carbon in the soil profiles among the zones under study (Figure 5). The soils subject to frequent flooding (FFz) show a more linear organic carbon pattern inside the profile than for the soils in the other two zones (MFz and NFz). For the latter cases, the distribution pattern is relatively comparable, with higher levels on the surface and lower levels at the bottom of the profile (Figure 5a). However, the TOC values are higher for the soils in the no-flood zones than in the frequent-flood zones, with respective mean values of 3.54% ± 1.77% (NFz) and 1.96% ± 0.85% (FFz) for the surface horizons (0–20 cm). These differences appear quite normal because the organic matter inputs to these soils in surface layer are greater than for alluvial soils, especially those FFz.
With respect to the acidity of the soils inside the profile, notable differences are also found between the FFz soils and soils in the two other zones. The pH values for the NFz soils are generally higher (5.0 on average) than for the MFz and NFz soils (Figure 5b), especially for the surface horizons. The average values obtained on the surface (0–20 cm) are 5.08 ± 0.65 (FFz), 4.21 ± 0.80 (MFz) and 4.19 ± 0.85 (NFz), and the values at the bottom of the profile are 4.71 ± 0.64 (FFz), 5.20 ± 1.49 (MFz) and 5.78 ± 1.96 (NFz), respectively.
Very little difference is found in terms of particle size in the soils in the different zones, although the MFz soils show slightly more variability (Figure 5c,d). Lastly, the proportions of silt and sand are relatively comparable between the soils in the different zones, with respective median values of 47.7% (FFz), 45.4% (MFz) and 43.3% (NFz). However, greater variations in silt and sand content can be found in the lower layers of the profile (40–60 cm) for MFz, which may be associated with the change in current velocity during flood sediment deposition. Lastly, the clay content is very low for all the profiles that were analyzed.

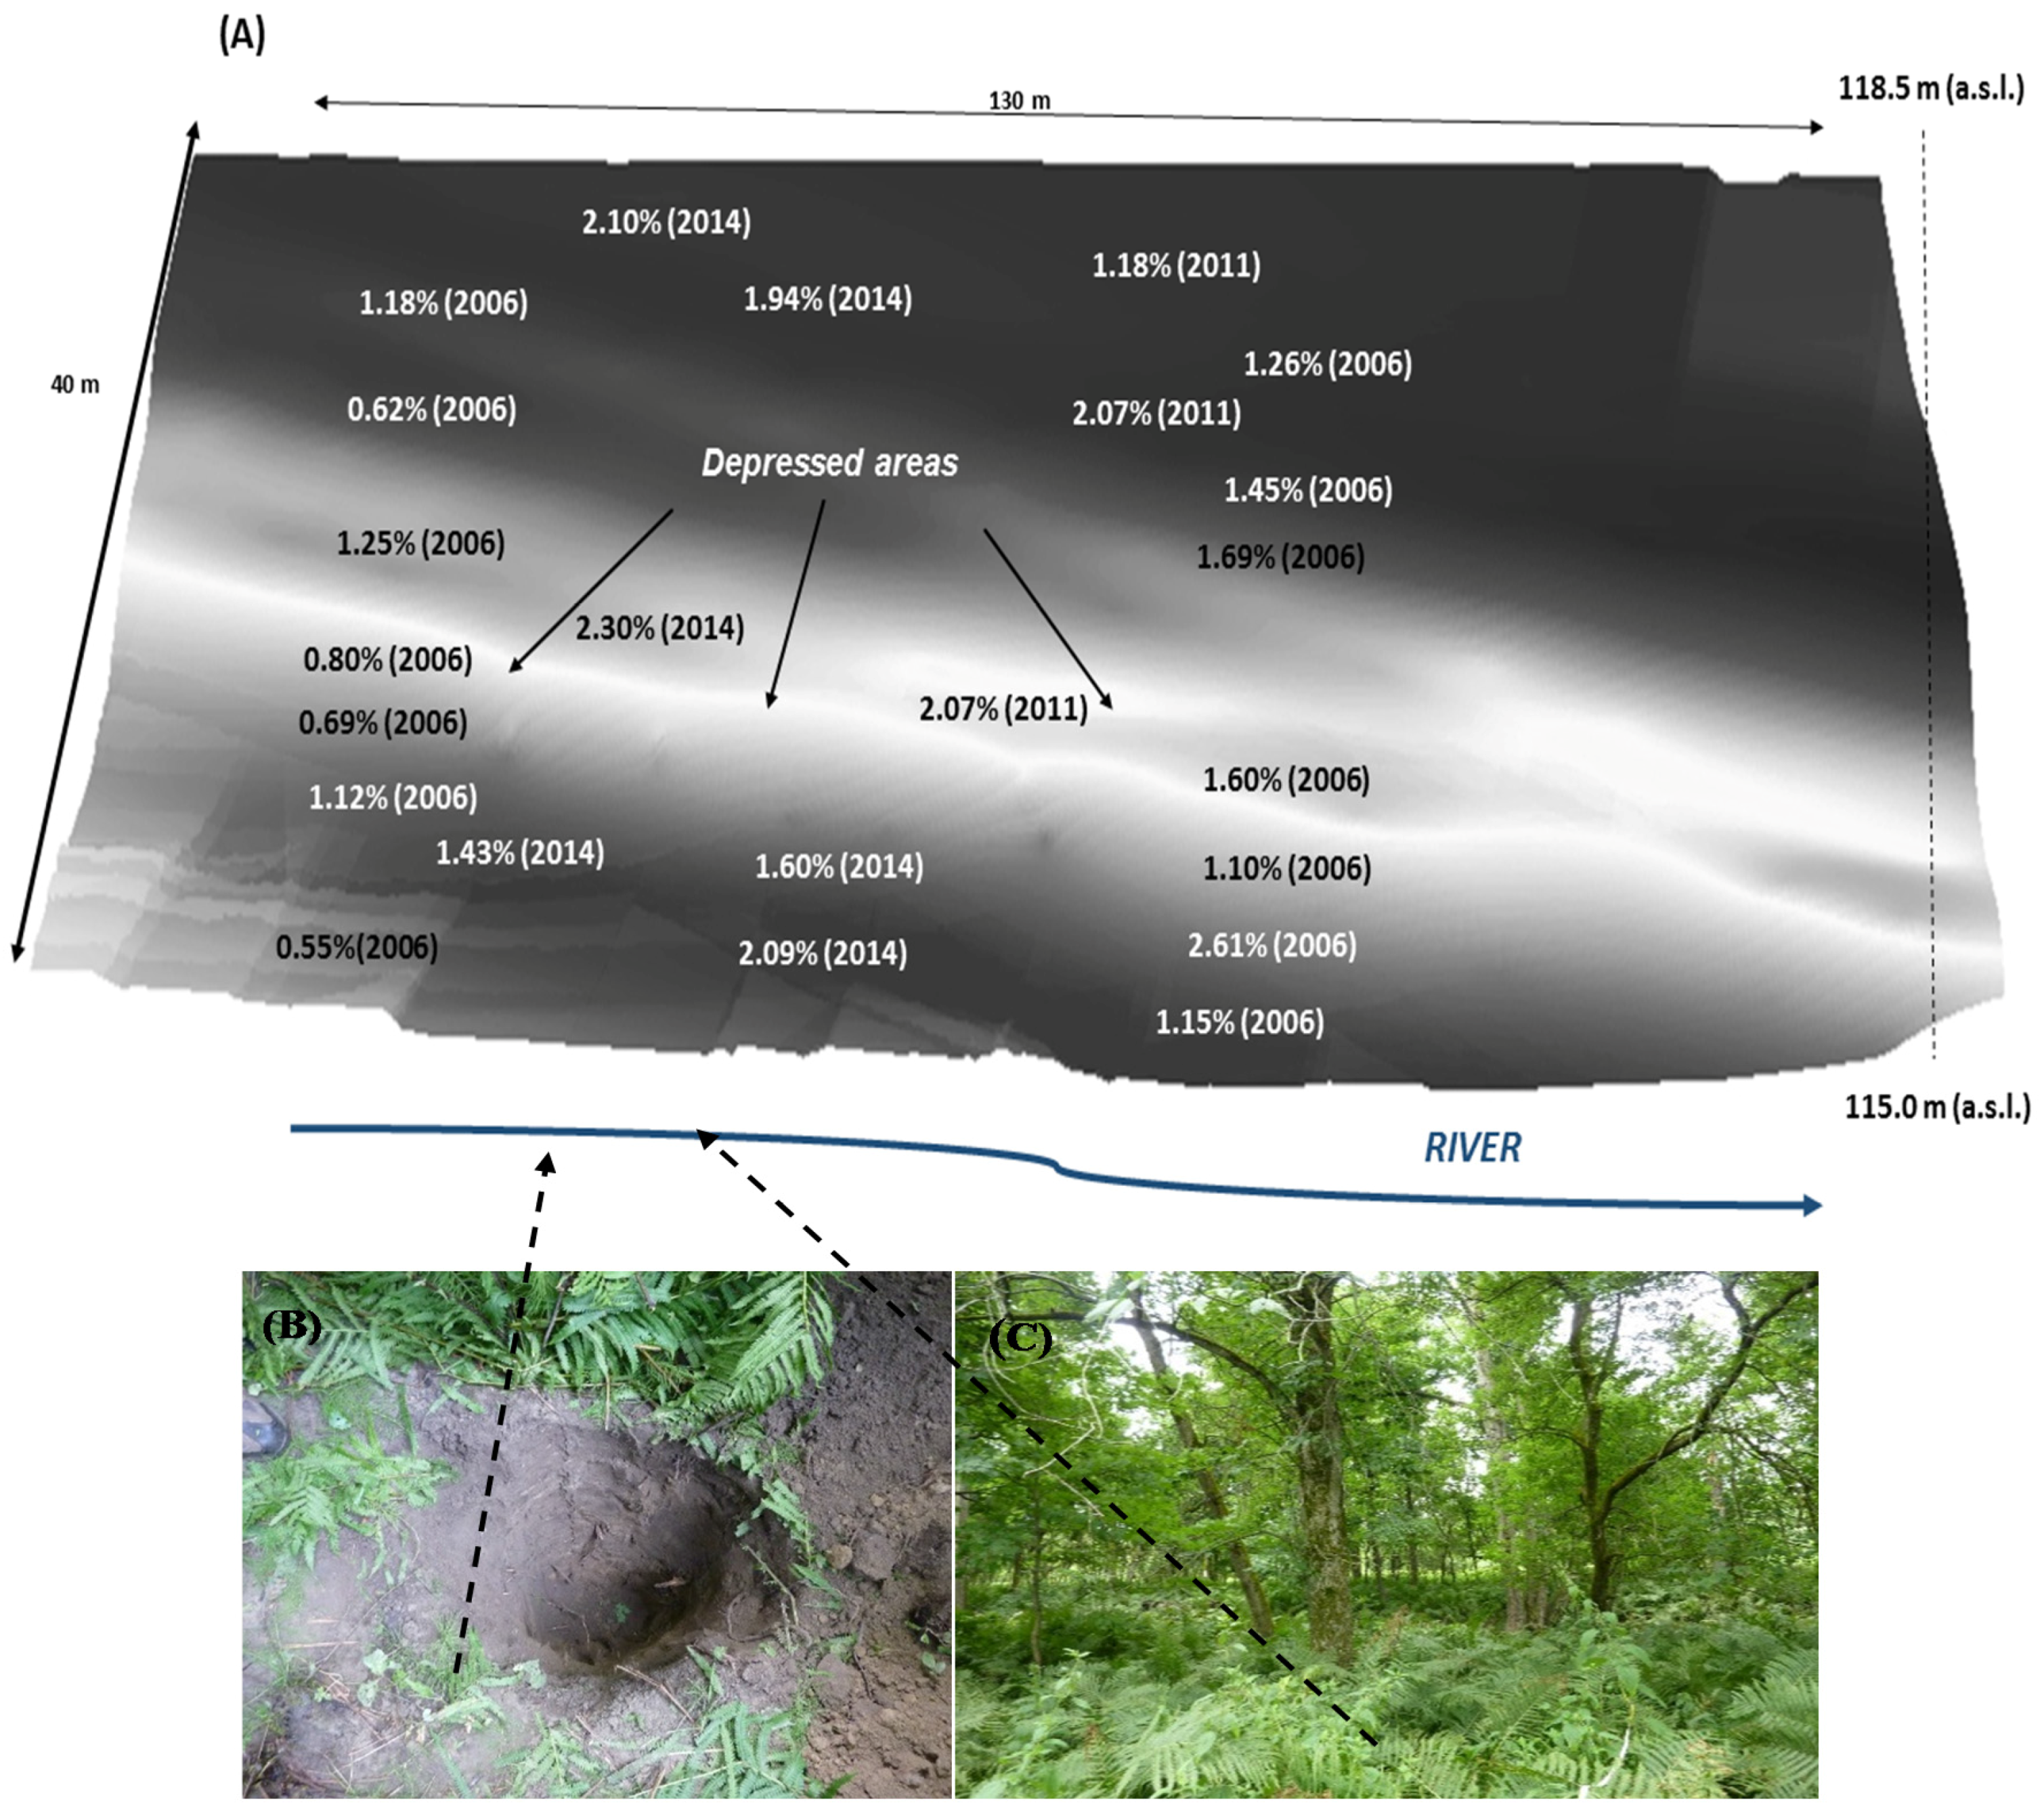
3.5. Spatial Distribution of Organic Carbon with a DEM

The digital elevation model (DEM) developed using LIDAR images allows the topography of the site to be viewed and, as a result, the spatial distribution of the soil organic carbon content to be determined along the transects. The DEM provides minimum and maximum elevations between 114.7 and 155.8 m (a.s.l.). The FFz has a generally flat topography, whereas the NFz follows a gently sloping topography with a few mounds from the MFz to the outer boundary. The MFz separates the other two zones and is characterized by a moderately to steeply sloping topography (Figure 2).
Figure 3 shows a portion of the site located in the 0–20-year flood recurrence zone and allows the spatial distribution of the organic carbon content to be more precisely viewed based on the microtopography. A fairly significant variability is noted in the organic carbon content in this part of the site. The greatest differences are found along the riverbank, with values ranging from 0.55% to 2.61%, and a slight increase in organic carbon content is noted as one moves away from the riverbank, although the variations remain minimal. For this part of the floodplain (FFz), the TOC generally remains fairly low, especially when compared with the values obtained for the other two bordering zones (MFz and NFz), which show differences ranging from 1.09% to 5.98% and 0.85% to 8.75%, respectively (Table 2).

4. Discussions

4.1. Alluvial Soil Properties

The development of the soils that were analyzed is fairly different based on the flood recurrence zones and the no-flood zone. The alluvial soils, in particular in the frequent flood zones (FFz), generally have lower TOC values, both on the surface (0–20 cm) and in the deeper layers (>60 cm). Conversely, a higher organic carbon content is found in the no-flood zones (NFz), in particular in the surface horizons. The resulting TOC values can be compared to the MFz soils in the transition zone characterized by less flooding, but with less marked soil development [37,38].
Conversely, soils outside the floodplains are more developed with the presence of easily visible organo-mineral layers (Ah), with darker coloring and granular or subangular structures (macroaggregates). They are most often found on higher ground or on sloped terrain, which is generally better drained. In fact, these soils can be compared to forest soils [26,42], which are characterized by a higher organic carbon content and more marked soil development. These soils usually contain a higher organic carbon content, especially in the surface layers [4,26].
The TOC measured in the frequent-flood zones (FFz) shows values comparable to those obtained for the alluvial soils from adjacent sites originating from other studies [27,31,38]. For instance, mean and median values of 1.01% ± 0.49% and 1.03% are obtained, with minimum and maximum variations of 0.07 to 2.61% in the frequent flood zone [27], while for the soils not affected by flooding, significantly higher organic carbon contents are obtained with mean and median values of 3.18% ± 1.09% and 3.98% [38].
Lastly, these differences indicate fairly significant spatial variability of organic carbon based on the different flood and no-flood zones, and are an indication of soil depletion in organic carbon in the zones subject to successive floods (Figure 4). With respect to soil acidity, the resulting values are comparable among the MFz and NFz soils (averages of 4.21 ± 0.80 and 4.19 ± 0.85), and slightly higher for the soils in the frequent-flood zones (5.08 ± 0.65). Recall that the soils outside the floodplains contain more litter, which not only provides raw organic matter to the soil, but can contribute to acidifying the soil through the release of organic compounds. During the organic matter breakdown and humidification phases, the acidifying products that are released, such as fulvic or humid acids, may in fact increase soil acidity, in particular in the surface layers [43,44]. The microbial activity that has an effect on the breakdown of organic matter can also play a role in soil acidification through the release of certain enzymes and nitrification [2,45,46].
With respect to soil particle size, the textures are relatively similar between the soils in the floodplains and those outside the floodplains, although the alluvial soils in the frequent-flood zones can have slightly higher clay and silt contents. However, the silt content is greater than the proportion of clay. In fact, a certain consistency can be seen throughout the profile regarding the clay content. The finer matrices (silt and clay) are often typical of floodplain soils, and the silt portion is often the dominant fraction [20,47]. During the recession phase, the fine particles can form sedimentary covers a few centimeters thick (4–5 cm), as observed in some sites of the Saint-François River [28,37]. Lastly, the soils outside the floodplains are sometimes characterized by coarser textures due to the origin of the materials (e.g., reworked till or glacial deposits). The mineral matrices can contain medium to coarse sand with gravel and cobble inside the profile (0–100 cm).

4.2. Surface Litter and Organic Carbon

The type and thickness of the organic debris on the soil surface are highly variable based on the different zones. In the frequent-flood zones, the surface soil is often stripped and the accumulation of litter is infrequent, even under forest cover. Recall that the growing period is at its maximum from June to August and that the maximum accumulation of organic debris occurs from late September to October. For the frequent flood zones, the organic debris and leaves that fall to the ground in the fall rarely accumulate year to year due to successive floods. With the strength of the current, the organic debris on the ground is dislodged and transported further downstream, and only a few branches or dead tree trunks remain, with very little contribution to soil enrichment over the short term . Current velocity during maximum floods can easily attain 2060 to 2080 m3/s, which can cause severe erosion in the surface soils near the riverbank, in addition to dislodging new seedlings and ground litter. Conversely, when the freshet recedes, current velocities decrease considerably (e.g., 140–160 m3/s), allowing the deposition of fine sediment (silt or fine sand) that may reach 4–5 cm in surface thickness [27]. However, the new sediment may hinder the growth of the new seedlings buried beneath it.
Lastly, the soils in the frequent-flood zones show a marked deficiency with respect to the organic carbon content when compared with the no-flood zones. This lower content of organic carbon in alluvial soil to some extent shows a lesser contribution of these major components in the soil [48,49], and therefore alters the soil-forming processes. The absence or virtual absence of litter cannot provide enough soil organic matter and over time creates conditions of organic carbon depletion and affects soil quality. Flood frequency appears to be a factor that limits soil development. Some studies have shown that the soils affected by successive floods result in soil depletion of OC over time [28,50,51]. The reduced contribution of organic matter limits potential sources of organic carbon within the solum and, as a result, affects soil development [24,52]. For instance, the organic carbon values obtained in the studies by Daniels [50], in the Republican River area (NE, USA), range from 0.20% to 1.40%, and comparable values were also obtained in the Ogeechee River area (GA, USA) by Wainright et al. [53], which are close to the values of 0.1%–0.8% for the soils affected by frequent flooding. The input of sediment from floods that is deposited on the soil surface is not necessarily rich in organic matter and may have trouble contributing to soil enrichment. In fact, recent work shows that in catchments dominated by farmland, transported sediment is generally less rich in organic carbon than wooded areas, for instance [17] (p. 181). Authors in fact note that “soil erosion on annual ecosystem carbon C fluxes was highest for agricultural soils due to lower C input and soil C stocks”. For instance, the C stock in the soil surface of agricultural areas is 1214 ± 20 vs. 3646 ± 22 g/m2 for forest areas (period under study: 28 years) [17]. The frequency of successive floods is a key factor to take into account in the determination of the organic carbon content of alluvial soils, although without ignoring other equally important factors such as the proximity of the riverbank, the width of the floodplain, the composition of the vegetation cover, the ground litter, and land uses in a river environment.

4.3. TOC Variation and Modeling of Elevation Levels

Digital elevation models (DEM) and digital terrain models (DTM) show a detailed view of the topography of the entire site affected by flooding (Figure 2 and Figure 3). The site is characterized by relatively flat terrain that progressively rises by a few meters from the riverbank to the end of the terraces, at an altitude of 114.7 to 155.8 m over a distance of 700 m. These floodplains are relatively large in size (±300 m), and the sediment input that affects them originates from the river during flood events. In this area, riverside woodlands are surrounded by farmland, which is still a potential source of sediment (silt and mainly fine sand) that can provide nutrients to the surface soil [17,22]. The digital terrain model shows that the microtopography of the site is characterized by gentle slopes with a succession of ridges and troughs including a large depression that parallel to the riverbank. This model in ridges and troughs is in fact typical of floodplains subject to periodic flooding [19,24]. By examining the spatial distribution of the organic carbon content, fairly significant variability can be noted in the contents. The greatest differences can be seen along the riverbank with values ranging from 0.55% to 2.61%. A certain increase in TOC is noted as one moves away from the riverbank, although the variations are minimal. There is also no significant variability in TOC content near troughs that could affect current velocity during flood events and alter their sediment input, including the contribution in organic matter. These troughs can easily reach 1–1.50 m in depth in this floodplain.
For this portion of the floodplain (FFz), the TOC is generally fairly low, especially when compared to the values obtained for the other two adjacent zones (MFz and NFz) that show differences ranging from 1.08% to 5.98% and 0.85% to 8.75%, respectively. There are also no notable differences in TOC among the ridge and trough areas, nor in the large depression that runs parallel to the riverbank. Lastly, the TOC among the soils collected in 2006 and in 2014 have values that are comparable with the respective maximum contents of 2.61% and 2.30%. The microtopography seems to have fairly little effect on the spatial distribution of the organic carbon, at least in this section of the floodplain. However, the site microtopography (succession of troughs and ridges) shows the site dynamics (erosion and deposition processes) that come into play during floods and flood recessions. In such a case, erosion may be present at the bottom or on the flat part of the riverbank during strong currents, and when the flood recedes, the current is less strong and allows sediment to be deposited. This sediment input has little organic or particulate matter since the TOC content measured in the frequent flood zones is somewhat low (average value of 1.74%). If we examine the data measured upstream and downstream of the sites analyzed by other recent work [27,28,38], it can be noted that the surface soil (0–20 cm) and the deeper layers of soil (20–100 cm) also have little TOC content in the floodplains (i.e., average value of 2.83% compared to 3.18% in the no-flood zones) [38].

5. Conclusions

This study reveals marked differences in the total organic carbon content (TOC) based on the different zones that were studied, in particular for the surface soil (0–20 cm). It was noted that the TOC values are significantly lower in soil subjected to frequent flooding (FFz). The TOC is comparable for soils found in the zones less subject to flooding (MFz) and soils outside the floodplains (NFz). The low TOC values measured in the soils in the frequent-flood zones are largely due to the absence or virtual absence of litter that prevents a constant inflow of organic carbon. This results over time in the depletion of organic carbon in the soil along with reduced soil fertility. Regarding the pH values, it can be noted that the MFz soils and especially the NFz soils are generally more acidic than the FFz soils. This is due to the presence of thicker litter, which contributes to acidifying the surface horizons (0–20 cm). It is known that the degradation and humification of organic matter produces acidifying substances, which in turn causes soil acidification, in particular in the upper horizons. Lastly, regarding the soil texture and soil bulk density, no major difference was noted between the different zones that were studied.

Acknowledgments

The authors thank the Natural Sciences and Engineering Research Council of Canada (NSERC) for financial support of this research. The authors wish to thank the students who contributed in the field work, including Jean-Sébastien Berthelot, Dominic Savoie, Claudine Ouellet, Marlies Hähni and Ilias Bazier. We thank the anonymous reviewers who helped improve the manuscript with their constructive comments.

Author Contributions

The field work was conducted by Diane Saint-Laurent, Roxane Paradis, Ariane Drouin and Vernhar Gervais-Beaulac; the paper was written by Diane Saint-Laurent and Roxane Paradis; and data compilation and statistical analyzes were completed by all authors.

Conflicts of Interest

The authors declare no conflict of interest.

References

  1. Krull, E.S.; Baldock, J.A.; Skjemstad, J.O. Importance of mechanisms and processes of the stabilization of soil organic matter for modelling carbon turnover. Funct. Plant Biol. 2003, 30, 207–222. [Google Scholar] [CrossRef]
  2. Cookson, W.R.; Abaye, D.A.; Marschner, P.; Murphy, D.V.; Scotkdale, E.A.; Goulding, K.W.T. The contribution of soil organic matter fractions to carbon and nitrogen mineralization and microbial community size and structure. Soil Biol. Biochem. 2005, 37, 1726–1737. [Google Scholar] [CrossRef]
  3. Cabezas, A.; Comín, F.A. Carbon and nitrogen accretion in the topsoil of the Middle Ebro River Floodplains (NE Spain): Implications for their ecological restoration. Ecol. Eng. 2010, 36, 640–652. [Google Scholar] [CrossRef]
  4. Batlle-Aguilar, J.; Brovelli, A.; Luster, J.; Shrestha, J.; Niklaus, P.A.; Barry, D.A. Analysis of carbon and nitrogen dynamics in riparian soils: Model validation and sensitivity to environmental controls. Sci. Total Environ. 2012, 429, 246–256. [Google Scholar] [CrossRef] [PubMed]
  5. Ruiz-Sinoga, J.D.; Pariente, S.; Diaz, A.R.; Martinez Murillo, J.F. Variability of relationships between soil organic carbon and some soil properties in Mediterranean rangelands under different climatic conditions (South of Spain). Catena 2012, 94, 17–25. [Google Scholar] [CrossRef]
  6. Groenendijk, F.M.; Condron, L.M.; Rijske, W.C. Effects of afforestation on organic carbon, nitrogen and sulfur concentrations in New Zealand hill country soils. Geoderma 2002, 108, 91–100. [Google Scholar] [CrossRef]
  7. Fu, X.; Shao, M.; Wei, X.; Horton, R. Soil organic carbon and total nitrogen as affected by vegetation types in Northern Loess Plateau of China. Geoderma 2010, 155, 31–35. [Google Scholar] [CrossRef]
  8. Tian, H.; Chen, G.; Zhang, C.; Melillo, J.M.; Hall, C.A.S. Pattern and variation of C:N:P ratios in China’s soils: A synthesis of observational data. Biogeochemistry 2010, 98, 139–151. [Google Scholar] [CrossRef]
  9. Brovelli, A.; Batlle-Aguilar, J.; Barry, D.A. Analysis of carbon and nitrogen dynamics in riparian soils: Model development. Sci. Total Environ. 2012, 429, 231–245. [Google Scholar] [CrossRef] [PubMed]
  10. Singh, S.K.; Pandey, C.B.; Sidhu, G.S.; Sarkar, D.; Sagar, R. Concentration and stock of carbon in the soils affected by land uses and climates in the western Himalaya, India. Catena 2011, 87, 78–89. [Google Scholar] [CrossRef]
  11. Fang, X.; Xue, Z.; Li, B.; An, S. Soil organic carbon distribution in relation to land use and its storage in a small watershed of the Loess Plateau, China. Catena 2012, 88, 6–13. [Google Scholar] [CrossRef]
  12. Kothyari, U.C.; Jain, M.K.; Ranga, K.G. Estimation of temporal variation of sediment yield using GIS/Estimation de la variation temporelle de l'exportation sédimentaire grâce à un SIG. Hydrol. Sci. J. 2002, 47, 693–706. (In French) [Google Scholar] [CrossRef]
  13. Bernal, B.; Mitsch, W.J. A comparison of soil carbon pools and profiles in wetlands in Costa Rica and Ohio. Ecol. Eng. 2008, 34, 311–323. [Google Scholar] [CrossRef]
  14. Blazejewski, G.A.; Stolt, M.H.; Gold, A.J.; Gurwick, N.; Groffman, P.M. Spatial distribution of carbon in the subsurface of riparian zones. Soil Sci. Soc. Amer. J. 2009, 73, 1733–1740. [Google Scholar] [CrossRef]
  15. Dai, F.; Su, Z.; Liu, S.; Liu, G. Temporal variation of soil organic matter content and potential determinants in Tibet, China. Catena 2011, 85, 288–294. [Google Scholar] [CrossRef]
  16. Doetter, S.; Berthe, A.A.; Nadeu, E.; Wang, Z.; Sommer, M.; Fiener, P. Erosion, deposition and soil carbon: A review of process-level controls, experimental tools and models to address C cycling in dynamic landscapes. Earth-Sci. Rev. 2016, 154, 202–212. [Google Scholar]
  17. Nadeu, E.; Van Oostb, K.; Boix-Fayosa, C.; Joris de Venteaa, J. Importance of land use patterns for erosion-induced carbon fluxes in a Mediterranean catchment. Agric. Ecos. Environ. 2014, 189, 181–189. [Google Scholar] [CrossRef]
  18. Schilling, K.E.; Palmer, J.A.; Bettis, E.A., III; Jacobson, P.; Schultz, R.C.; Isenhart, T.M. Vertical distribution of total carbon, nitrogen and phosphorus in riparian soils of Walnut Creek, southern Iowa. Catena 2009, 77, 266–273. [Google Scholar] [CrossRef]
  19. Clilverd, H.M.; Thompson, J.R.; Heppell, C.M.; Sayer, C.D.; Axmacher, J.C. River–floodplain hydrology of an embanked lowland Chalk river and initial response to embankment removal. Hydrol. Sci. J. 2013, 58, 627–650. [Google Scholar] [CrossRef]
  20. Benedetti, M.M. Controls on overbank deposition in the Upper Mississippi River. Geomorphology 2003, 56, 271–290. [Google Scholar] [CrossRef]
  21. Obermann, M.; Froebrich, J.; Perrin, J.L.; Tournoud, M.G. Impact of significant floods on the annual load in an agricultural catchement in the Mediterranean. J. Hydrol. 2007, 334, 99–108. [Google Scholar] [CrossRef]
  22. Berhongaray, G.; Alvarez, R.; De Paepe, J.; Caride, C.; Cantet, R. Land use effects on soil carbon in the Argentine Pampas. Geoderma 2013, 192, 97–110. [Google Scholar] [CrossRef]
  23. Birkel, C.; Soulsby, C.; Tetzlaff, D. Modelling the impacts of land-cover change on streamflow dynamics of a tropical rainforest headwater catchment. Hydrol. Sci. J. 2015, 57, 1543–1561. [Google Scholar] [CrossRef]
  24. Chaplot, V.; Poesen, J. Sediment, soil organic carbon and runoff delivery at various spatial scales. Catena 2012, 88, 46–56. [Google Scholar] [CrossRef]
  25. Wang, S.; Yan, Y.; Li, Y. Spatial and temporal variations of suspended sediment deposition in the alluvial reach of the upper Yellow River from 1952 to 2007. Catena 2012, 92, 30–37. [Google Scholar] [CrossRef]
  26. Bayley, S.E.; Guimond, J.K. Aboveground biomass and nutrient limitation in relation to river connectivity in Montane Floodplain Marshes. Wetlands 2009, 29, 1243–1254. [Google Scholar] [CrossRef]
  27. Saint-Laurent, D.; St-Laurent, J.; Lavoie, L.; Drouin, A.; Ghaleb, B. Floodplain sedimentation rates, soil properties and recent flood history in Southern Québec. Global Planet. Change 2010, 70, 76–91. [Google Scholar] [CrossRef]
  28. Drouin, A.; Saint-Laurent, D.; Lavoie, L.; Ouellet, C. High-Precision Digital Elevation Model to evaluate the spatial distribution of soil organic carbon in active floodplains. Wetlands 2011, 31, 1151–1164. [Google Scholar] [CrossRef]
  29. Franklin, S.B.; Kupfer, J.A.; Pezeshki, S.R.; Gentry, R.; Smith, D. Complex effects of channelization and levee construction on Western Tennessee floodplain forest function. Wetlands 2009, 29, 451–464. [Google Scholar] [CrossRef]
  30. Hamdan, M.A.; Assada, T.; Hassan, F.M.; Warner, B.G.; Douabul, A.; Al-Hilli, M.R.A.; Alwan, A.A. Vegetation response to Re-flooding in the Mesopotamian Wetlands, South Irak. Wetlands 2010, 30, 177–188. [Google Scholar] [CrossRef]
  31. Lavoie, L.; Saint-Laurent, D.; St-Laurent, J. Pedological and sedimentological analyses of alluvial soils and paleosols on floodplain terraces. Can. J. Soil Sci. 2006, 86, 813–826. [Google Scholar] [CrossRef]
  32. Berthelot, J.-S.; Saint-Laurent, D.; Gervais-Beaulac, V.; Présent, A. A comparison of the composition and diversity of tree populations along a hydrological gradient in floodplains (Southern Québec, Canada). Forests 2015, 6, 929–956. [Google Scholar] [CrossRef]
  33. MDDEP (Ministère du Développement durable, de l’Environnement et des Parcs). Normales climatiques du Québec, 1981–2010. Gouvernement du Québec, Québec, Canada, 2014. Available online: http://www.mddep.gouv.qc.ca/climat/normales/index.asp (accessed on 12 April 2015).
  34. Environnement Canada & Ministère de l’Environnement du Québec. Carte des Zones Inondables en eau Libre, Bassin de la Rivière Saint-François; Échelle 1:10 000, carte: 31H09-100-5229 (réf.: ES-82-06); Gouvernement du Québec: Québec, Canada, 1982. [Google Scholar]
  35. CSCW (Canadian Soil Classification Working Group). The Canadian System of Soil Classification, 3rd ed.; Agriculture and Agri-Food Canada: Ottawa, ON, Canada, 1646; p. 187. [Google Scholar]
  36. McKeague, J.A. Manual on Soil Sampling and Methods of Analysis, 2nd ed.; Canada Soil Survey, Subcommittee on Methods of Analysis: Ottawa, ON, Canada, 1998; p. 212. [Google Scholar]
  37. Saint-Laurent, D.; St-Laurent, J.; Lavoie, L.; Ghaleb, B. Use geopedological methods for the evaluation of sedimentation rates on river floodplains. Catena 2008, 73, 321–337. [Google Scholar] [CrossRef]
  38. Gervais-Beaulac, V.; Saint-Laurent, D.; Berthelot, J.-S. Organic carbon distribution in alluvial soils according to different flood risk zones. J. Soil Sc. Env. Manag. 2013, 4, 169–177. [Google Scholar] [CrossRef]
  39. MEMR (Ministère de l’énergie, des mines et des ressources). Carte de Dépôts de Surface, Feuillet 31H9, Richmond, 1:50,000; 6ième édition; Centre canadien de cartographie: Ottawa, ON, Canada, 1989. (In French) [Google Scholar]
  40. Centre d’expertise hydrique du Québec (CEHQ). Données historiques des débits et niveau d’eau. Gouvernement du Québec. 2015. Available online: http://www.cehq.gouv.qc.ca/ (accessed on 22 May 2015). [Google Scholar]
  41. Yeomans, J.C.; Bremner, J.M. A rapid and precise method for routine determination of organic carbon in soil. Comm. Soil Sci. Plant Anal. 1988, 19, 1467–1476. [Google Scholar] [CrossRef]
  42. Bechtold, J.S.; Naiman, R.J. A quantitative model of soil organic matter accumulation during floodplain primary succession. Ecosystems 2009, 12, 1352–1368. [Google Scholar] [CrossRef]
  43. Duchaufour, P. Introduction à la Science du sol–Sol, Végétation, Environnement, 6th ed.; Dunod: Paris, France, 2004. [Google Scholar]
  44. Brady, N.C.; Weil, R.R. The Nature and Properties of Soils, 14th ed.; Pearson ed.: Columbus, OH, USA, 2008. [Google Scholar]
  45. Van Miegroet, H.; Cole, D.W. The impact of nitrification on soil acidification and cation leaching in a red alder ecosystem. J. Environ. Qual. 1984, 13, 586–590. [Google Scholar] [CrossRef]
  46. Böhme, L.; Langer, U.; Böhme, F. Microbial biomass, enzyme activities and microbial community structure in two European long-term field experiments. Agric. Ecosyst. Environ. 2005, 109, 141–152. [Google Scholar] [CrossRef]
  47. Diodato, N.; Gericke, A.; Bellocchi, G. Modelling the inter-annual variability of sediment yields: A case study for the upper Lech River. Catena 2012, 97, 12–19. [Google Scholar] [CrossRef]
  48. Rasmussen, C.; Southard, R.J.; Horwath, W.R. Litter type and soil minerals control temperate forest soil carbon response to climate change. Glob. Change Biol. 2008, 14, 2064–2080. [Google Scholar] [CrossRef]
  49. Jindaluang, W.; Kheoruenromne, I.; Suddhiprakarn, A.; Bhupinder, P.S.; Balwant, S. Influence of soil texture and mineralogy on organic matter content and composition in physically separated fractions soils of Thailand. Geoderma 2013, 195/196, 207–219. [Google Scholar] [CrossRef]
  50. Daniels, J.M. Floodplain aggradation and pedogenesis in a semiarid environment. Geomorphology 2003, 56, 225–242. [Google Scholar] [CrossRef]
  51. Kayranli, B.; Scholz, M.; Mustafa, A.; Hedmark, A. Carbon storage and fluxes within freshwater wetlands: A critical review. Wetlands 2010, 30, 111–124. [Google Scholar] [CrossRef]
  52. Chacón, N.; Dezzeo, N.; Muñoz, B.; Rodríguez, J.M. Implications of soil organic carbon and the biogeochemistry of iron and aluminum on soil phosphorus distribution in flooded forests of the lower Orinoco River, Venezuela. Biogeochemistry 2005, 73, 555–566. [Google Scholar] [CrossRef]
  53. Wainright, S.C.; Couch, C.A.; Meyer, J.L. Fluxes of bacteria and organic matter into a blackwater river from river sediments and floodplain soils. Freshwater Biol. 1992, 28, 37–48. [Google Scholar] [CrossRef]
Figure 1. Location of the Richmond site study area in the Saint-François River catchment (southern Québec, Canada).
Water 08 00208 g001
Figure 2. Transects and soil sampling stations showing the boundaries of the Richmond site flood recurrence zones and the topography of the site using a digital elevation model (MNE) based on LIDAR images.
Water 08 00208 g002
Figure 3. (A) 3D digital terrain model (DTM) created on a portion of the floodplain (40 m × 130 m) in the 0–20-year flood recurrence zone (FFz). The microtopography shows the zones with troughs (light color) and ridges (dark color), which are parallel to the shore. The organic carbon contents are represented as a percentage and the sampling years are in parentheses; (B) Profile with weak differentiation of soil horizons; (C) Typical forest stand in the floodplain is represented (Richmond, left bank, 8 August 2011).
Water 08 00208 g003
Figure 4. Diagrams showing the disparities in the total organic carbon content (%) in the surface horizons (A) (0–20 cm) and all horizons (B) (0–100 cm) among the three zones studied (FFz, MFz, and NFz), with the use of the Tukey’s statistical test.
Water 08 00208 g004
Figure 5. Total organic carbon content (TOC%) and other soil properties (pH, clay%, silt% and sand%) in the soil profiles based on the zones being studied (FFz, MFz and NFz). (A) Percentage of TOC in soil profile (0-100 cm); (B) Soil acidity (pH); (C) Percentage of clay and silt; (D) Percentage of sand.
Water 08 00208 g005
Table 1. Hydrological data and flood recurrences in the Saint-François River, southern Québec, Canada.
Sector/Saint-François RiverLocationStationPeriodMean Annual Discharge (m3/s) aMaximum Discharge (m3/s)Minimum Discharge (m3/s)Number of Recorded Floods (1900–2015) bReturn Period c
Drummondville45°51′42″ N0302031925–1994205.6242028.9--
72°27′11″ W
Sherbrooke45°24′22″ N0302081919–2015156.1163312.2631.82
72°53′20″ W
Weedon45°93′31″ N0302781977–2015 38.7 361 0.6--
71°28′07″ W
Windsor/Melbourne45°33′50″ N0302041935–1973165.2208018.9392.94
72°00′21″ W
Richmond
(Water level)
45°39′32″ N0302051915–1974 21.9  2819.6452.55
72°08′35″ W(Wl)(Wl)(Wl) 
Notes: a Sources: CEHQ/HYDAT [40]; b CIEQ-UQTR-U. Laval database and compilation by the authors (see also [27,37]); c The return period was calculated according to the number of recorded floods and the number of years of the period analyzed (1900–2015).
Table 2. Total organic carbon content (TOC) and other properties of surface soil (0–20 cm) at the Richmond site based on the zones analyzed (FFZ, MFZ and NFZ).
ZonepH CaCl2TOC (%)Bulk Density (g/cm3) aClay (%)Silt (%)Sand (%)Texture bMain Color (Munsell) c
Frequent Flood zone (FFz) (n = 65 sites)
Mean Standard deviation5.08 ± 0.651.74 ± 0.851.00 ± 0.174.6 ± 4.043.5 ± 17.751.9 ± 15.9Sandy loam, silt loam10YR 3/2
10YR 4/2
10YR 5/2
2.5Y 4/3
Variation coefficient12.848.817.086.940.731.2
Moderate Flood zone (MFz) (n = 33 sites)
Mean Standard deviation4.21 ± 0.803.34 ± 1.090.99 ± 0.251.9 ± 0.847.3 ± 9.750.8 ± 10.2Sandy loam, loamy sand, silt loam10YR 3/2
10YR 4/1
10YR 4/2
2.5Y 5/3
Variation coefficient 19.032.625.240.220.520.1
No-Flood zone (NFz) (n = 39 sites)
Mean Standard deviation4.19 ± 0.853.54 ± 1.771.08 ± 0.242.3 ± 2.145.6 ± 11.652.1 ± 13.3Sandy loam, loamy sand10YR 3/1.5
10YR 3/2
10YR 4/2
10YR 5/3
Variation coefficient20.250.022.291.325.425.5
Notes: a Number of soil samples (n = 86); b Textural classes are based on the Canadian System of Soil Classification [35]; c Soil color (dry samples).
Table 3. Ground litter based on the two flood zones (intervals of 0–20 years and 20–100 years) and outside the floodplains.
Soil Biomass (Litter)Thickness (cm)Description
Frequent Flood zone (FFz) (n = 65)
Frequency (%)24Vegetation cover dominated by hardwoods and by herbs (especially ferns: Matteuccia spp.). Litter rarely present (frequency 24%); litter composition: twigs and grass stems. Absence of Ah horizon and low differentiation of soil layers.
Max–Min5.5–0
Moderate Flood zone (MFz) (n = 39)
Frequency (%)99Vegetation cover dominated by hardwoods and shrubs.
Litter present (frequency 99%); litter composition: moss, twigs and leaves.
Presence of Ah horizon (often thin); litter on the ground; root density low to medium.
Max–Min11–0
No-Flood zone (NFz) (n = 45)
Frequency (%)99Vegetation cover dominated by hardwoods and some conifers.
Litter present (frequency 99%); litter composition: needles, dead leaves, twigs, moss and herbs, thin humified layers. Presence of Ah horizon (thick or thin); litter on the ground; root density moderate to strong.
Max–Min13–0

