
Optimal Allocation of Water Resources Based on Water Supply Security

 , , ,
, , ,
Abstract
:1. Introduction
2. Study Area and Data
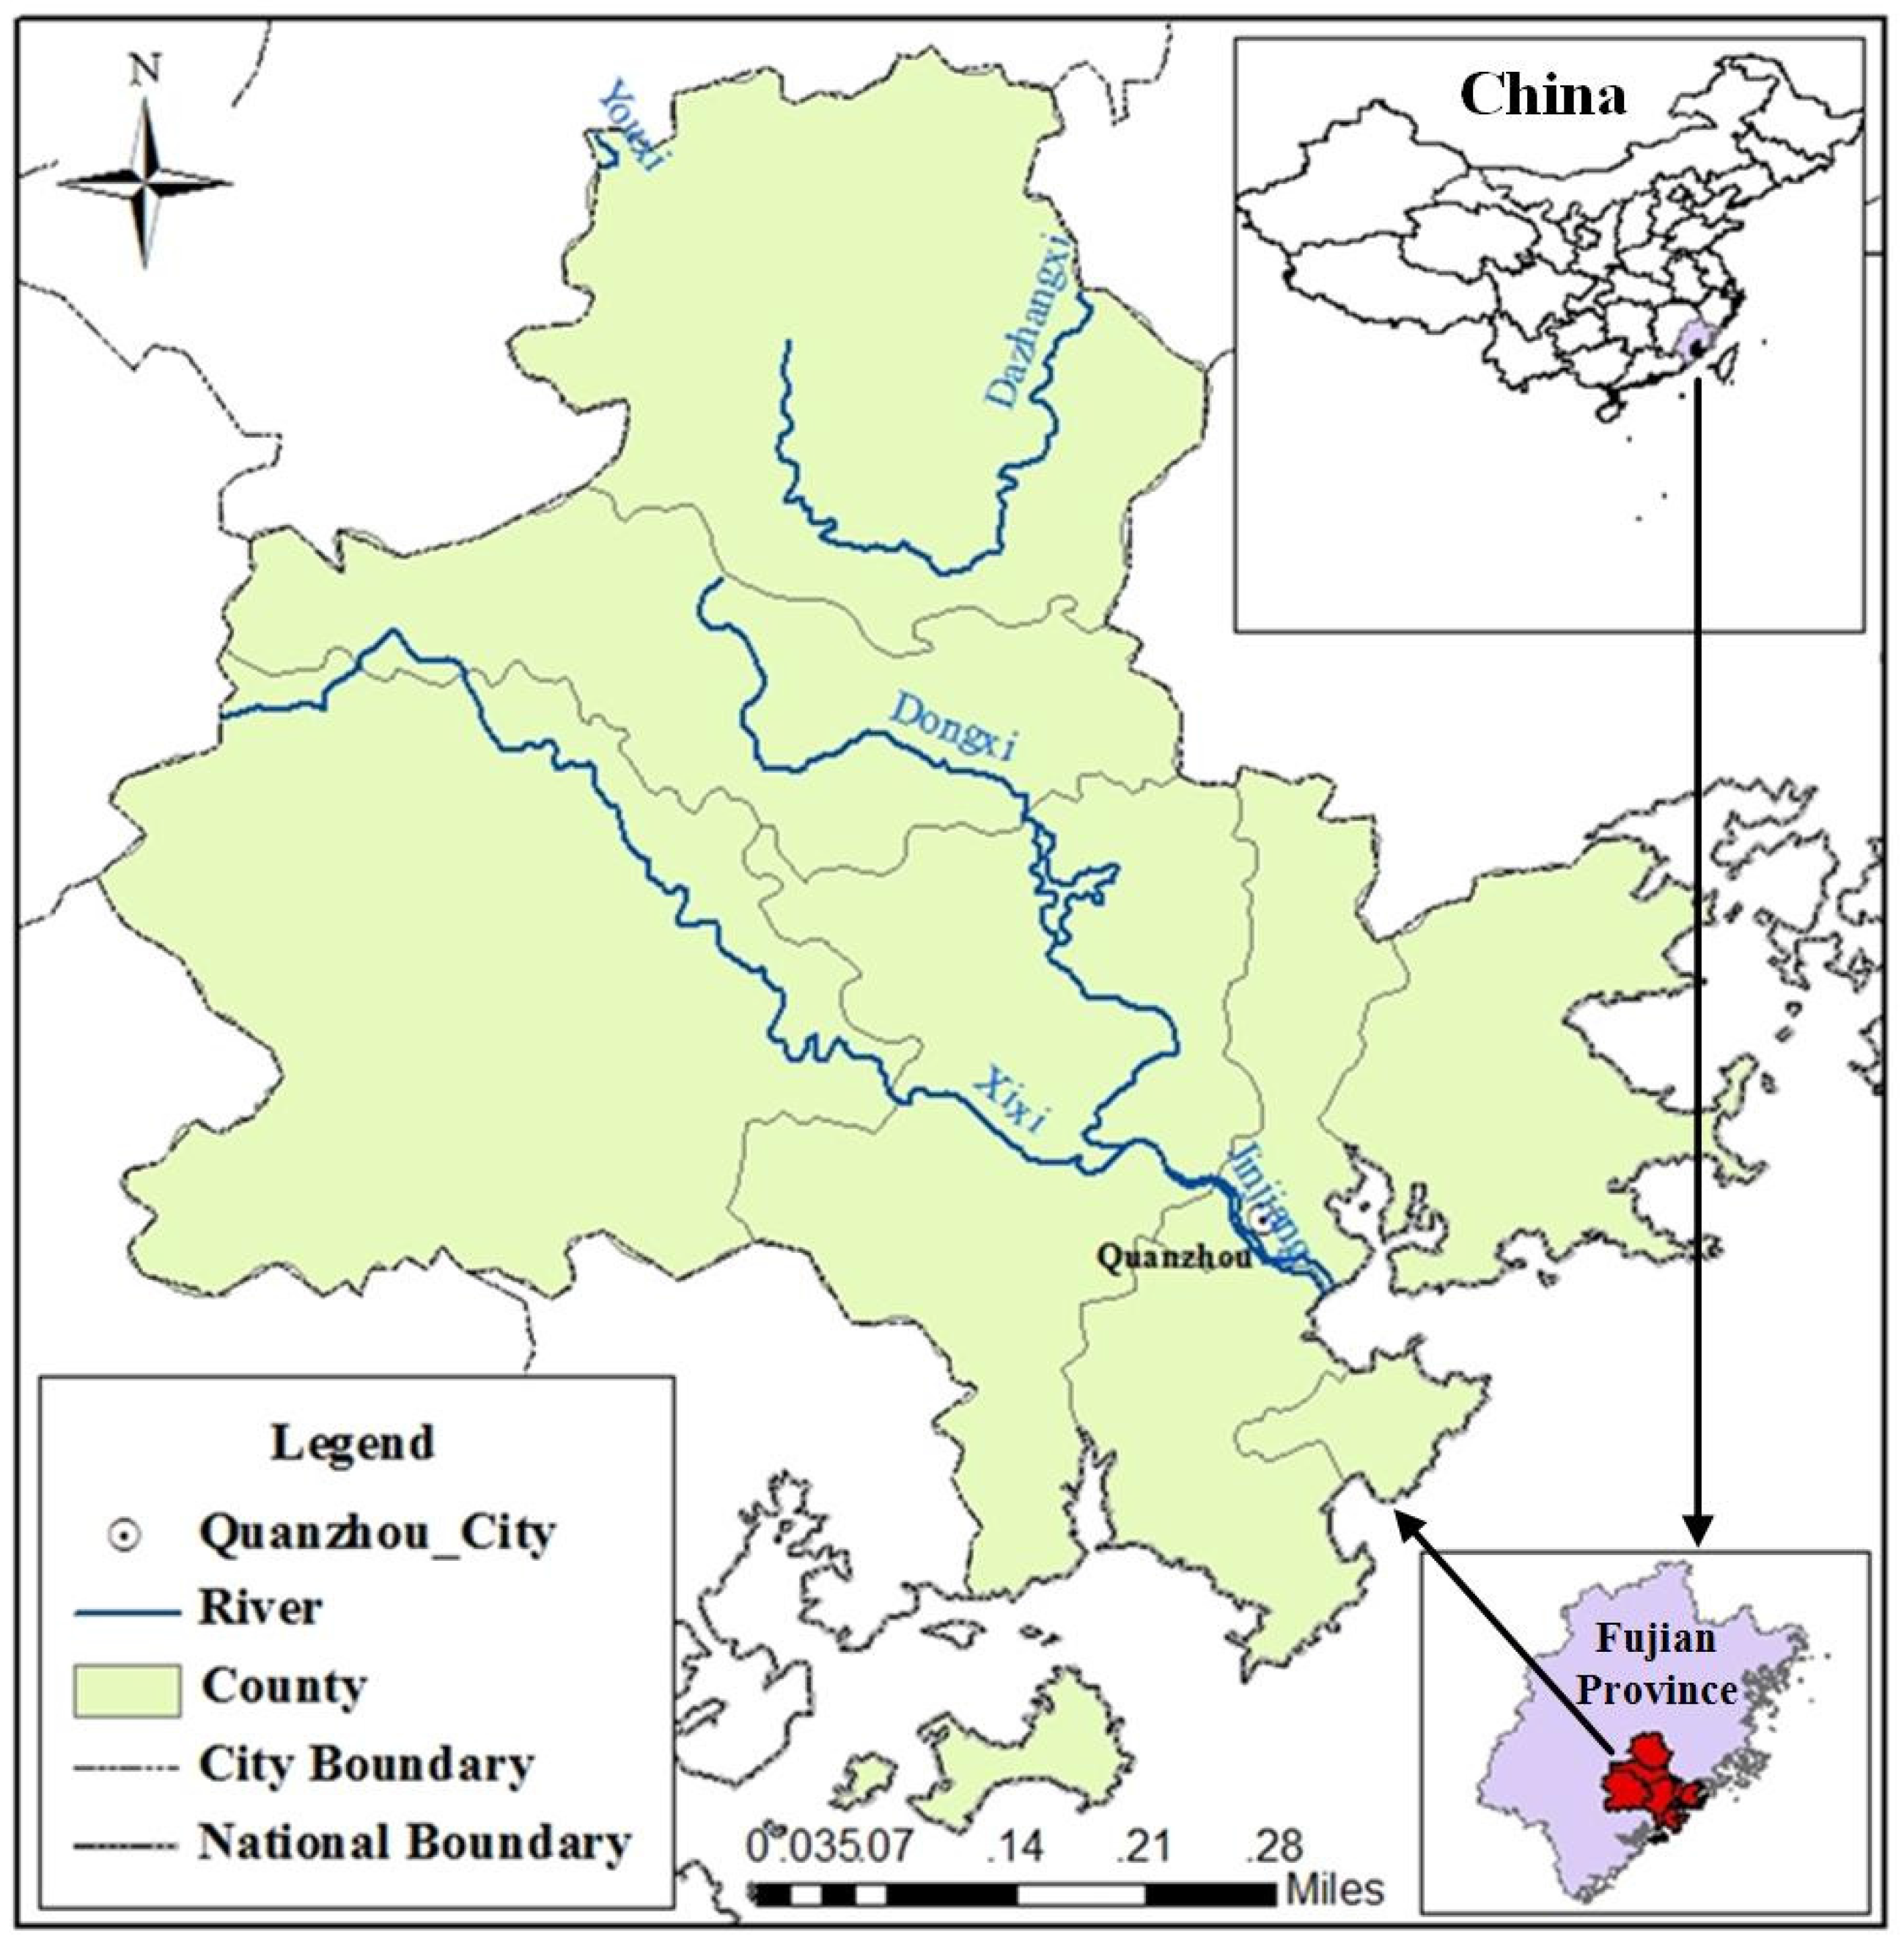
2.1. Study Area
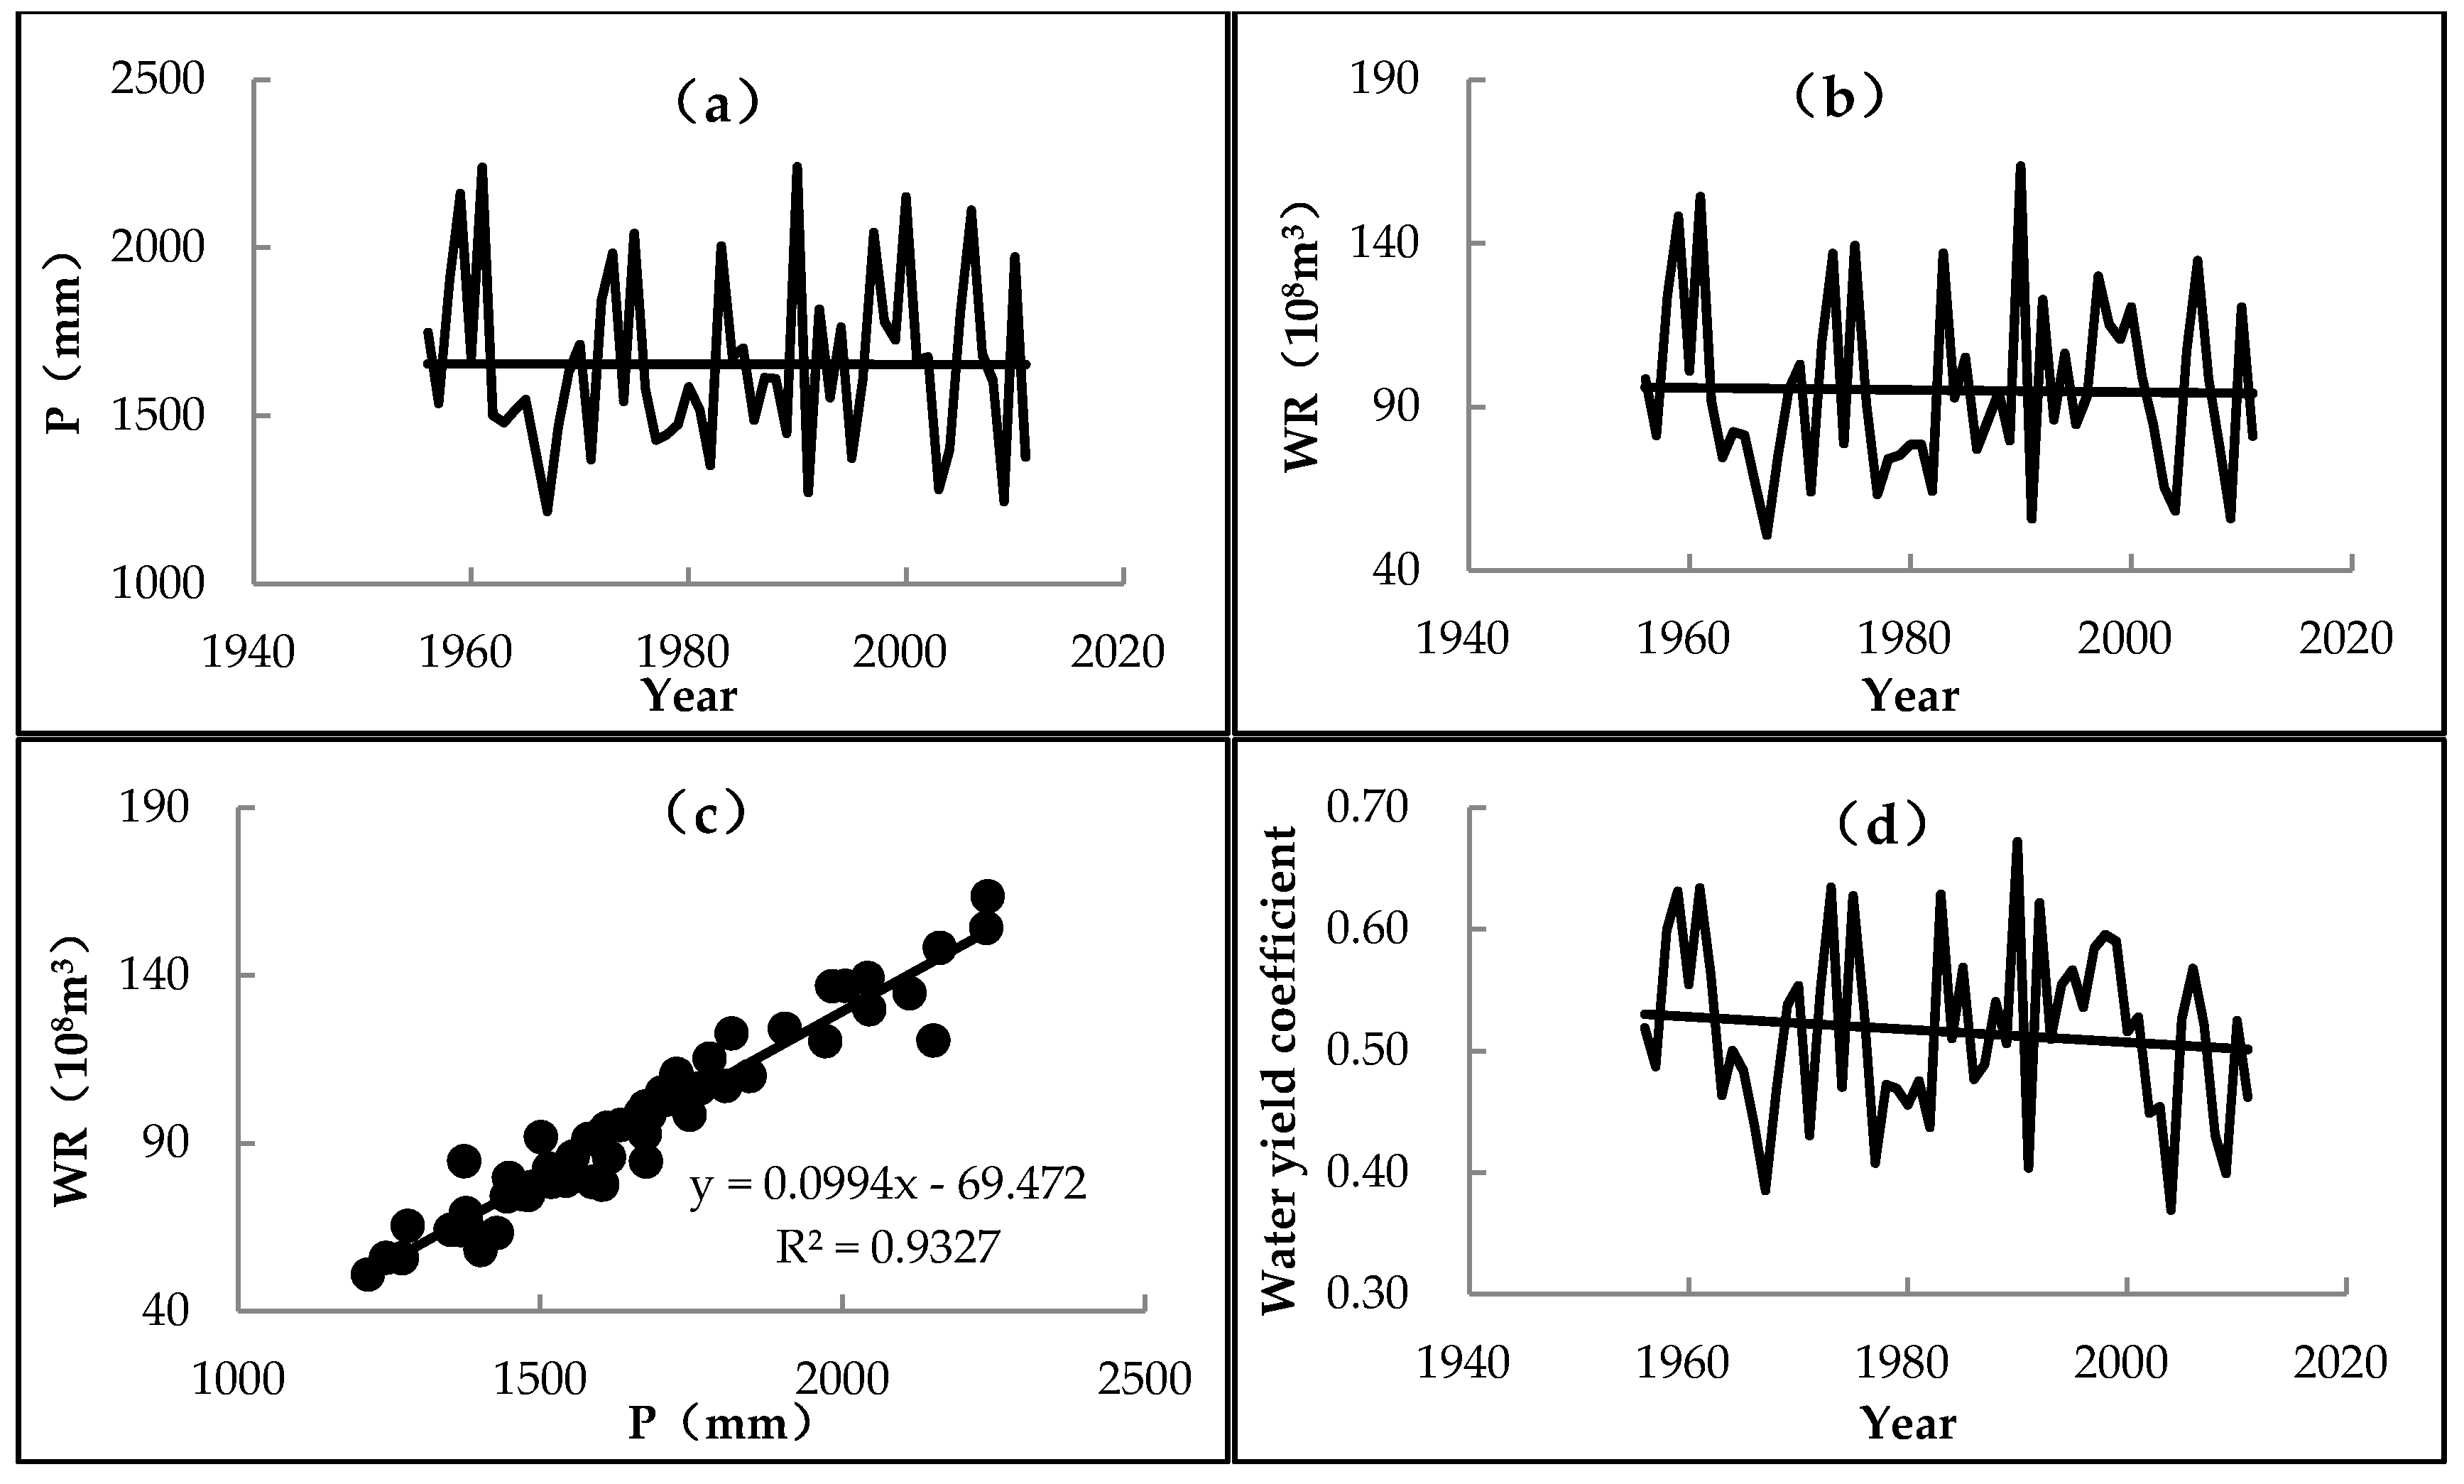
2.2. Data
3. Methods and Model
3.1. Concept and Computation of WSS
3.1.1. Connotation Analysis and Definition
3.1.2. Basic Properties of the WSS
- Relativity. The WSS represents the balance between supply and demand and is thus a relative concept. The WSS depends on not only the supply capacity but also the size of the users’ demand. As a result, the WSS must regulate both the supply and demand sides.
- Systematism. The water supply system has three subsections: the water source, water supply project and water user. The WSS is the cooperative security of the three subsystems. A high overall WSS can only be achieved when the three subsystems are secured individually and collaboratively. Therefore, improving the WSS of a water supply system involves performing a system analysis and addressing the weaknesses of the system.
- Limitedness. The WSS has a limited security, and the performance is limited by two aspects. (a) Under the general status, the WSS is based on the specific scope of planning, the corresponding water supply guarantee rate of each user and certain water use standards; (b) Under the emergency status, the WSS is the special security based on specific objectives, specific standards such as the occurrence of severe drought, and unmet agricultural irrigation demand. The industrial and domestic water use standards may also be reduced.
- Dynamism. Under the influence of environmental changes, economic development and social progress, both the water supply and demand are dynamic. The WSS presents clear dynamic characteristics, such as for rural drinking-water security issues in China, with the cyclic operation of supply projects and improvements in water use standards.
- Economy. With the development of engineering technologies, there is an increasing number of methods for ensuring WSS. However, WSS is closely related to the economic characteristics of the supply route selection. Utilization of seawater resources to resolve the water shortage problem in China is one possible supply route. Although seawater is abundant and the technology is mature, under the restriction of economic costs and benefits, new concepts, such as the East-to-West Seawater Transfer and Leading Bo Seawater to Xinjiang Province in China, do not currently offer maneuverability.
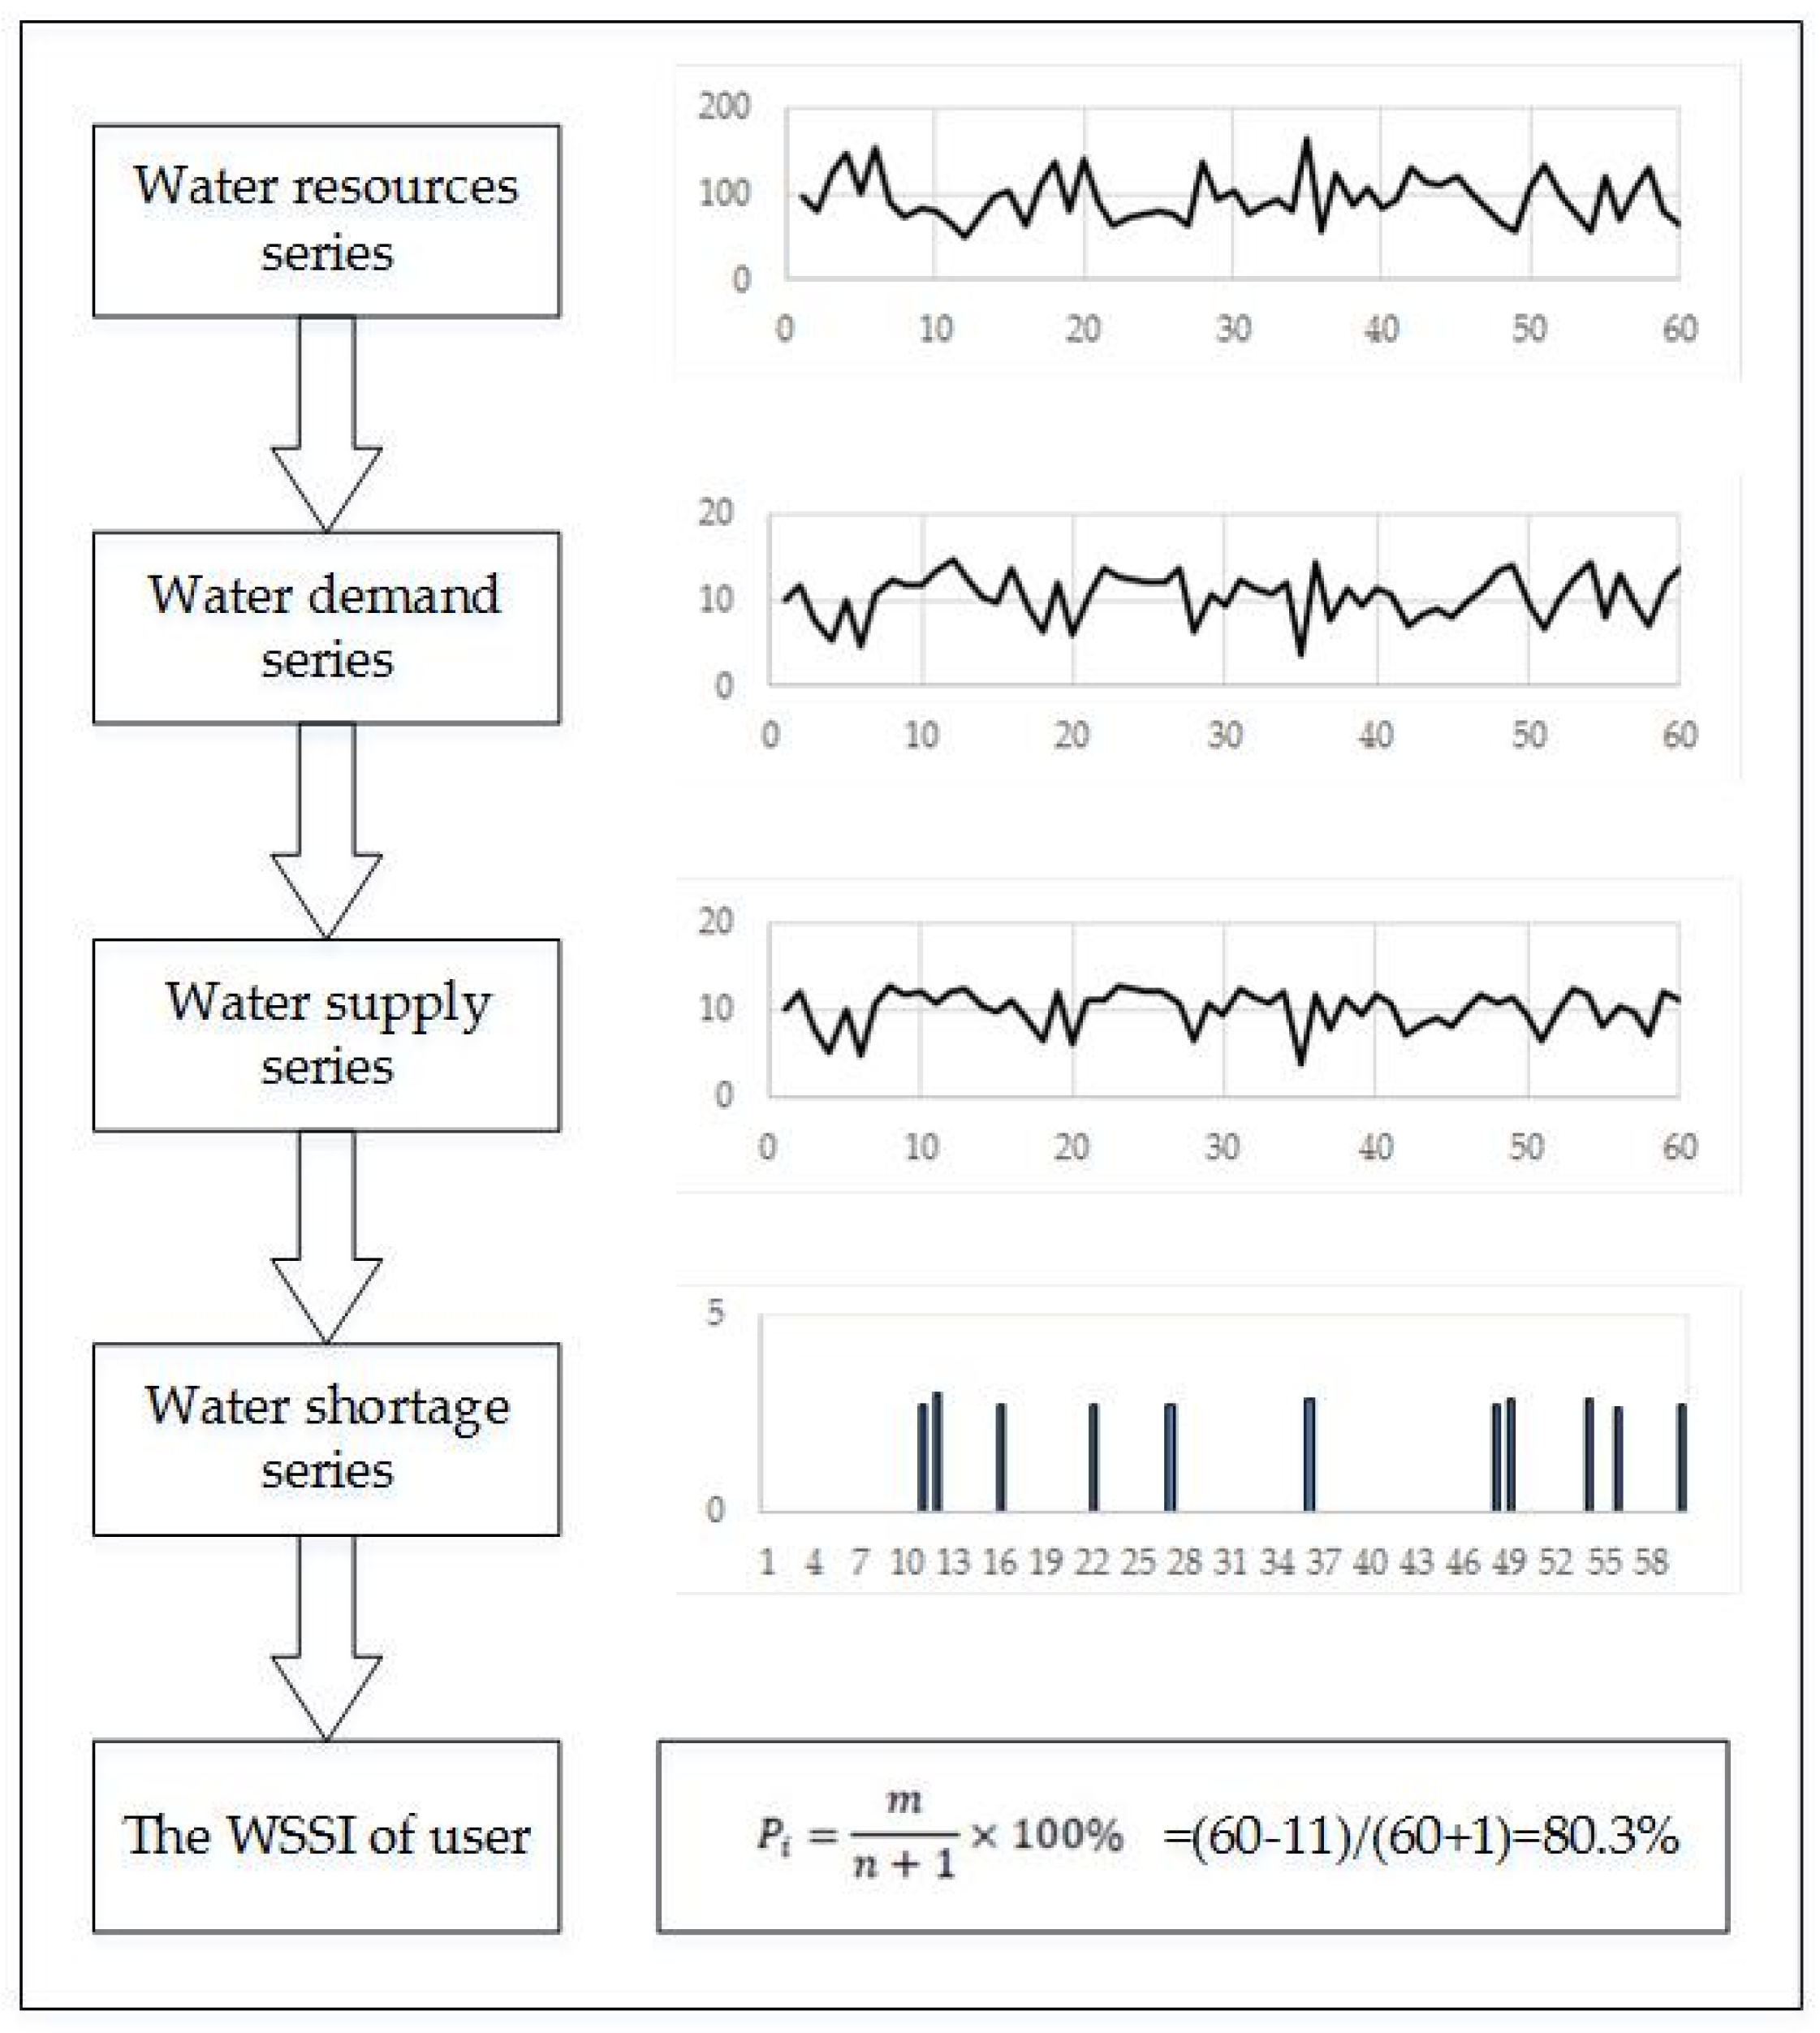
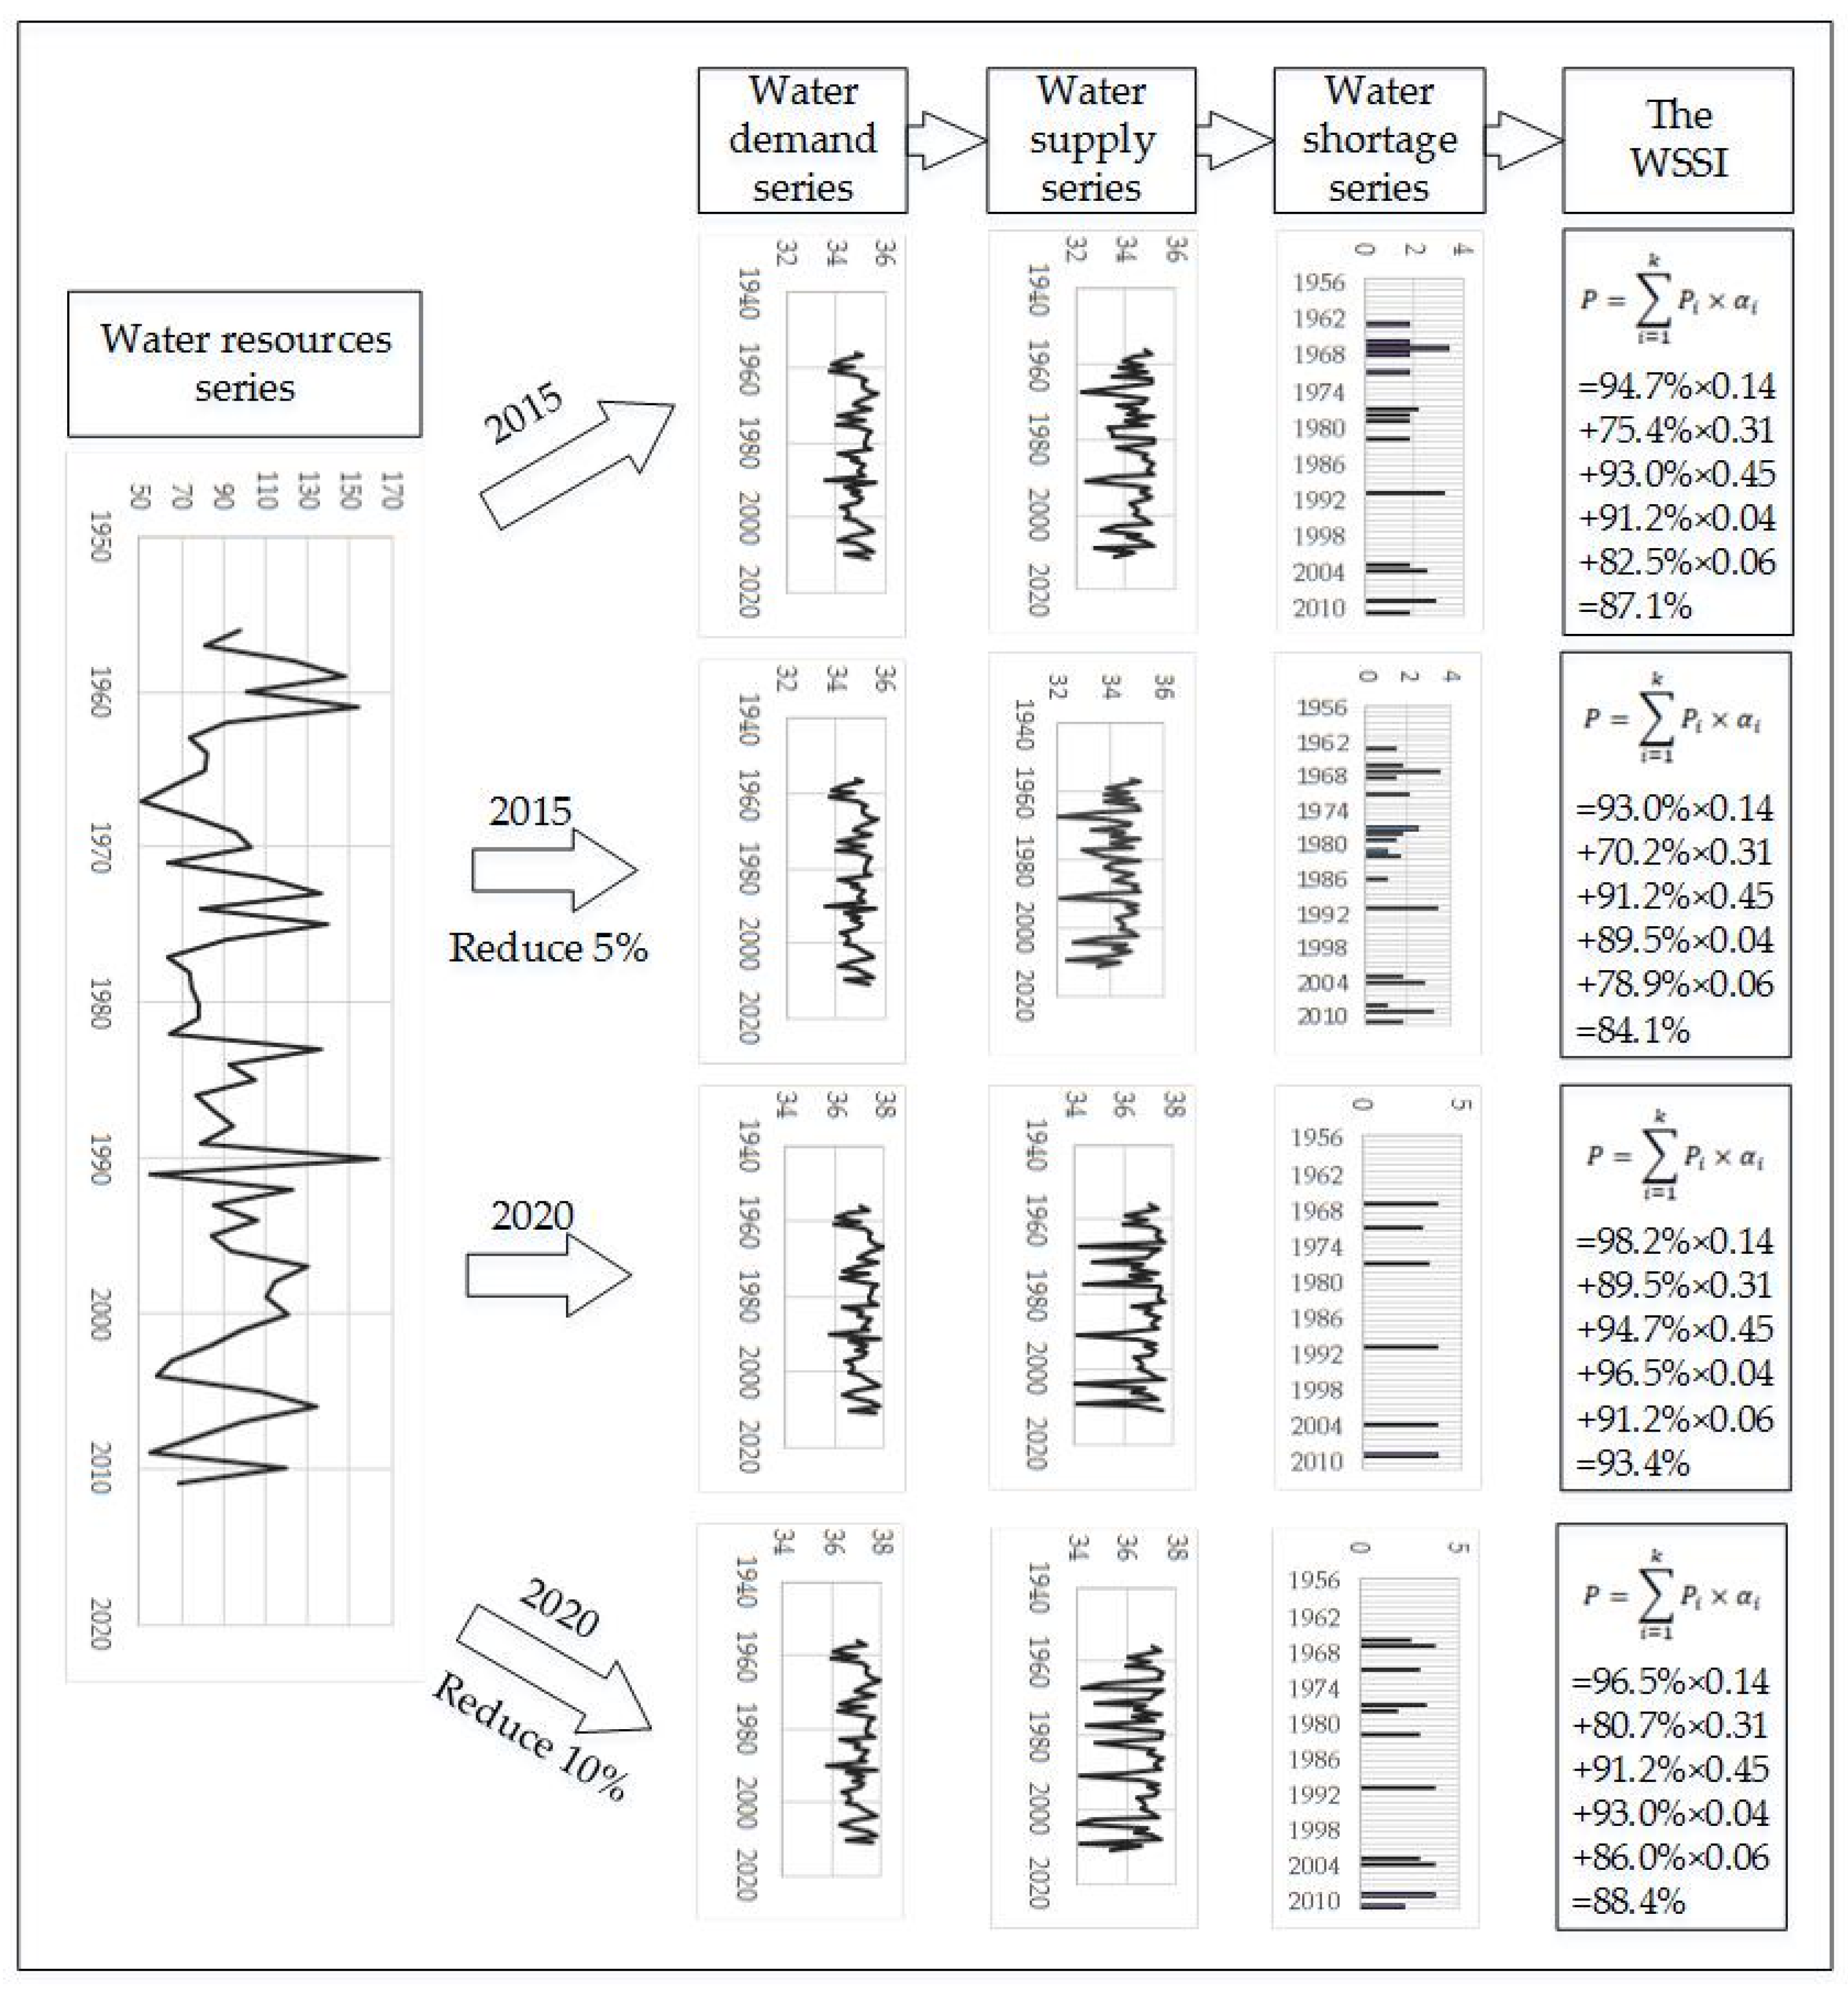
3.1.3. Computation of the WSS
3.2. Establishment of the Optimal Allocation Model for Water Resources Based on WRMASSM
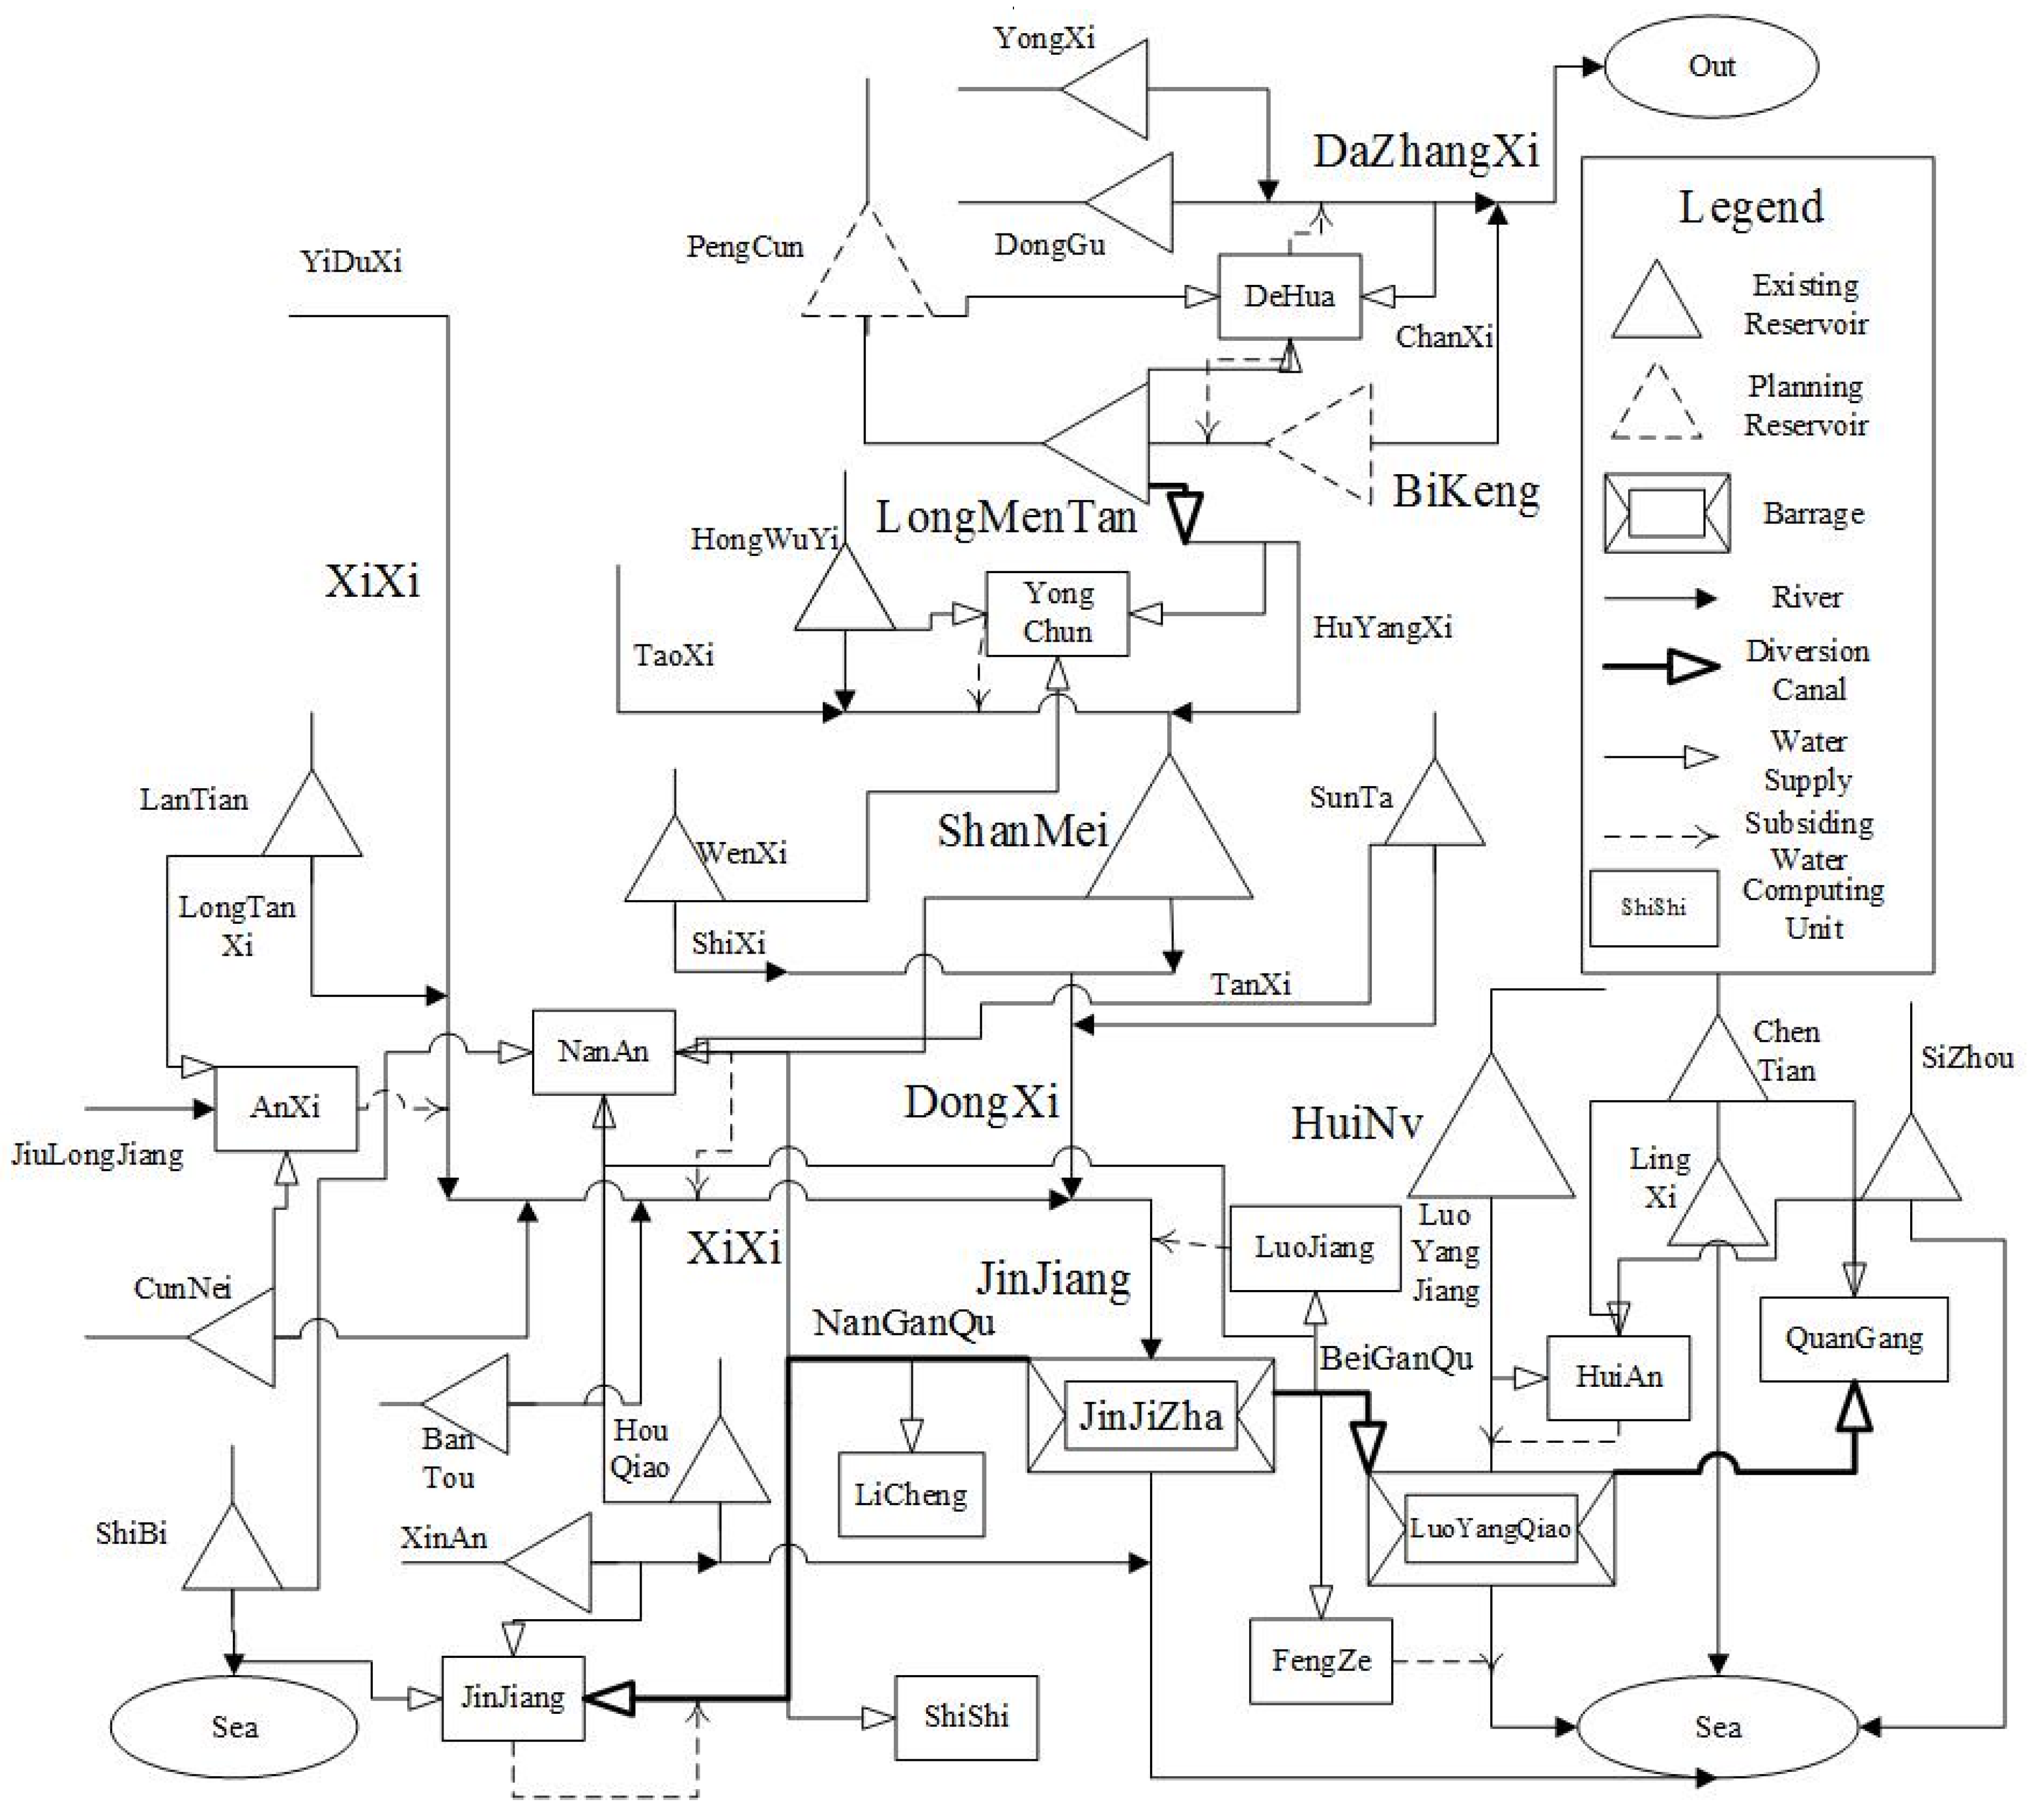
- Analysis of the water resources systems. The theory and methods of the system engineering were adopted according to the characteristics of the water resources system. Based on the conceptualization of the water resources system, focus should be placed on studying the organization of the water resources system, the system environment, and the inputs and outputs of the system.
- Determination of the optimal simulation target. The major target was set as the maximum regional comprehensive WSS using Equations (2) and (3). The WSS can also determine several sub-targets according to needs.
- The construction of the water resources system is divided and the organization structure is determined according to the elements of the water resources system and the function of each element.
- Based on the determined organization structure, the agent is further divided and the conceptual model for each of the agents is obtained. The construction of the agent model mainly includes studying the behavior mode of each agent in the water resources multi-agent system and the interactive model for each agent and the surrounding environment. On this basis, the water resources demand of each agent can be analyzed under different development requirements.
- Determination of the requirements and constraints of the water resources allocation. Under the region or basin water resources management system, some requirements and constraints in the water resources allocation should be determined in advance.
- Design of the model program and operation until the requirements are met. The model results are then rationally analyzed.
3.3. Model Construction for Quanzhou
- Control of the total water consumption. The average value of the water supply under the long-series hydrological condition should not exceed the amount determined by the superior government.where is the average value of water supply in the allocation and is the maximum total water consumption determined by Fujian Province, which was 3.433 billion m3 for 2015 and 3.637 billion m3 for 2020.
- The water quality standard. Different users have different standards of water quality in China. The water supply should meet the lowest standards of water quality.where is the rank of the water supply quality in the allocation and is the rank of the water quality in the national standard of China. There are five ranks (I-V) for . The national standard for both surface water and groundwater is organized such that a higher rank indicates poorer water quality. The rank of the domestic water supply quality should be smaller than III.
4. Results
4.1. Allocation Results for Quanzhou
4.2. Allocation Results for the Counties
4.3. Allocation Results of the Users
5. Discussion
5.1. Allocation of Water Resources with the Long Series Can Enable a Comprehensive Evaluation of WSS
5.2. Changes in the Environment Can Affect the Allocation Results and WSS
5.3. Applicability of This Model
6. Conclusions
- WSS means that under current economic and technical conditions, considering the actual water demand, the regional water supply system should achieve the acquired satisfactory level in terms of water quantity, quality, continuity and economic efficiency, and possess the ability to respond to risks and impacts of special circumstances within an acceptable range. There are five basic properties of WSS: relativity, systematism, limitedness, dynamism and economy. The WSSI can be used to measure the degree of WSS and can be computed by adopting the empirical frequency formula.
- The WRMASSM based on the CAS can be used to allocate water resources. With the target of maximizing the comprehensive WSSI in Quanzhou, the model has achieved the optimal allocation of regional water resources and ensured the security of the regional water supply.
- The allocation results of Quanzhou indicated that the level of regional comprehensive WSS was significantly influenced by the capacity of water supply projects and the conditions of natural water resources. The allocation results and the WSSI were significantly affected by reductions in precipitation, decreases in the water yield coefficient, and changes in the underlying surface.
Acknowledgments
Author Contributions
Conflicts of Interest
References
- Tang, D. Optimal allocation of water resources in large river basins: I. Theory. Water Resour. Manag. 1995, 9, 39–51. [Google Scholar] [CrossRef]
- Jia, Y.; Wang, H.; Zhou, Z.; Qiu, Y.; Luo, X.; Wang, J.; Yan, D.; Qin, D. Development of the WEP-L distributed hydrological model and dynamic assessment of water resources in the Yellow River basin. J. Hydrol. 2006, 331, 606–629. [Google Scholar] [CrossRef]
- Chu, J.; Wang, J.; Wang, C. A structure–efficiency based performance evaluation of the urban water cycle in northern China and its policy implications. Resour. Conserv. Recycl. 2015, 104, 1–11. [Google Scholar] [CrossRef]
- Pei, Y.; Zhao, Y.; Zhang, J. Study on rational deployment of generalized water resources Ι. Theory. J. Hydraul. Eng. 2007, 38, 1–7. [Google Scholar]
- Fawen, L.; Jiao, N.; Hang, Z. Research on the influence of rainstorm duration distribution to the Multi-water resources allocation of Artificial Lake. Energy Procedia A 2012, 16, 397–402. [Google Scholar] [CrossRef]
- Bredehoeft, J.D.; Young, R.A. The temporal allocation of ground water-A simulation approach. Water Resour. Res. 1970, 6, 3–21. [Google Scholar] [CrossRef]
- Flinn, J.C.; Guise, J.W.B. An application of spatial equilibrium analysis to water resource allocation. Water Resour. Res. 1970, 6, 398–409. [Google Scholar] [CrossRef]
- Kerachian, R.; Karamouz, M. A stochastic conflict resolution model for water quality management in reservoir–river systems. Adv. Water Resour. 2007, 30, 866–882. [Google Scholar] [CrossRef]
- Zhang, W.; Wang, Y.; Peng, H.; Li, Y.; Tang, J.; Wu, K.B. A coupled water quantity–quality model for water allocation analysis. Water Resour. Manag. 2010, 24, 485–511. [Google Scholar] [CrossRef]
- Sadati, S.; Speelman, S.; Sabouhi, M.; Gitizadeh, M.; Ghahraman, B. Optimal irrigation water allocation using a genetic algorithm under various weather conditions. Water 2014, 6, 3068–3084. [Google Scholar] [CrossRef] [Green Version]
- Kanta, L.; Zechman, E. Complex adaptive systems framework to assess supply-side and demand-side management for urban water resources. J. Water Resour. Plan. Manag. 2014, 140, 75–85. [Google Scholar] [CrossRef]
- Bekri, E.; Disse, M.; Yannopoulos, P. Optimizing water allocation under uncertain system conditions for water and agriculture future scenarios in Alfeios River Basin (Greece)—Part B: Fuzzy-boundary intervals combined with multi-stage stochastic programming model. Water 2015, 7, 6427–6466. [Google Scholar] [CrossRef]
- Nguyen, D.C.H.; Maier, H.R.; Dandy, G.C.; Ascough, J.C. Framework for computationally efficient optimal crop and water allocation using ant colony optimization. Environ. Model. Softw. 2016, 76, 37–53. [Google Scholar] [CrossRef]
- Liu, D.; Chen, X.; Lou, Z. A model for the optimal allocation of water resources in a saltwater intrusion area: A case study in Pearl River Delta in China. Water Resour. Manag. 2010, 24, 63–81. [Google Scholar] [CrossRef]
- Parsinejad, M.; Yazdi, A.B.; Araghinejad, S.; Nejadhashemi, A.P.; Tabrizi, M.S. Optimal water allocation in irrigation networks based on real time climatic data. Agric. Water Manag. 2013, 117, 1–8. [Google Scholar] [CrossRef]
- Rehana, S.; Mujumdar, P.P. An imprecise fuzzy risk approach for water quality management of a river system. J. Environ. Manag. 2009, 90, 3653–3664. [Google Scholar] [CrossRef] [PubMed]
- Habibi Davijani, M.; Banihabib, M.E.; Nadjafzadeh Anvar, A.; Hashemi, S.R. Optimization model for the allocation of water resources based on the maximization of employment in the agriculture and industry sectors. J. Hydrol. 2016, 533, 430–438. [Google Scholar] [CrossRef]
- Bekri, E.; Disse, M.; Yannopoulos, P. Optimizing water allocation under uncertain system conditions in Alfeios River Basin (Greece), part A: Two-stage stochastic programming model with deterministic boundary intervals. Water 2015, 7, 5305–5344. [Google Scholar] [CrossRef]
- Niu, G.; Li, Y.P.; Huang, G.H.; Liu, J.; Fan, Y.R. Crop planning and water resource allocation for sustainable development of an irrigation region in China under multiple uncertainties. Agric. Water Manag. 2016, 166, 53–69. [Google Scholar] [CrossRef]
- Liu, S.; Yan, D.; Wang, J.; Weng, B.; Wang, G.; Yang, M. Drought mitigation ability index and application based on balance between water supply and demand. Water 2015, 7, 1792–1807. [Google Scholar] [CrossRef]
- Yan, D.; Qin, T.; Xiao, W.; Li, D. Study on the model of water resources rational deployment for the low-carbon development mode. J. Hydraul. Eng. 2012, 43, 586–593. [Google Scholar]
- Kanakoudis, V.; Tsitsifli, S.; Papadopoulou, A. Integrating the carbon and water footprints’ costs in the water framework directive 2000/60/EC Full water cost recovery concept: Basic principles towards their reliable calculation and socially just allocation. Water 2012, 4, 45–62. [Google Scholar] [CrossRef]
- Kanakoudis, V.; Papadopoulou, A. Allocating the cost of the carbon footprint produced along a supply chain, among the stakeholders involved. J. Water Clim. Chang. 2014, 5, 556–568. [Google Scholar] [CrossRef]
- Kanakoudis, V. Three alternative ways to allocate the cost of the CF produced in a water supply and distribution system. Desalin. Water Treat. 2015, 54, 2212–2222. [Google Scholar] [CrossRef]
- Adams, W. Green development theory. In Power of Development; Crush, J.S., Ed.; Routledge: London, UK, 1995; pp. 87–99. [Google Scholar]
- Kucukmehmetoglu, M. An integrative case study approach between game theory and Pareto frontier concepts for the transboundary water resources allocations. J. Hydrol. 2012, 450, 308–319. [Google Scholar] [CrossRef]
- Graveline, N. Economic calibrated models for water allocation in agricultural production: A review. Environ. Model. Softw. 2016, 81, 12–25. [Google Scholar] [CrossRef]
- Liu, Y.; Lv, X.; Qin, X.; Guo, H.; Yu, Y.; Wang, J.; Mao, G. An integrated GIS-based analysis system for land-use management of lake areas in urban fringe. Landsc. Urban Plan. 2007, 82, 233–246. [Google Scholar] [CrossRef]
- Wang, X.; Zhang, J.; Liu, J.; Wang, G.; He, R.; Elmahdi, A.; Elsawah, S. Water resources planning and management based on system dynamics: A case study of Yulin city. Environ. Dev. Sustain. 2011, 13, 331–351. [Google Scholar] [CrossRef]
- Siska, E.M.; Takara, K. Achieving water Security in global change: Dealing with associated risk in water investment. Procedia Environ. Sci. 2015, 28, 743–749. [Google Scholar] [CrossRef]
- Vörösmarty, C.J.; McIntyre, P.B.; Gessner, M.O.; Dudgeon, D.; Prusevich, A.; Green, P.; Glidden, S.; Bunn, S.E.; Sullivan, C.A.; Liermann, C.R.; et al. Global threats to human water security and river biodiversity. Nature 2010, 467, 555–561. [Google Scholar] [CrossRef] [PubMed]
- Hanjra, M.A.; Qureshi, M.E. Global water crisis and future food security in an era of climate change. Food Policy 2010, 35, 365–377. [Google Scholar] [CrossRef]
- Dabelko, D.; Aaron, T. Water, conflict, and cooperation. Environ. Chang. Secur. Proj. Rep. 2004, 10, 60–66. [Google Scholar]
- Grey, D.; Sadoff, C.W. Sink or swim? Water security for growth and development. Water Policy 2007, 9, 545–571. [Google Scholar] [CrossRef]
- Claudia, P.; Joyeeta, G.; Anik, B. Handbook on Water Security; Edward Elgar Publishing: Cheltenham, UK, 2016. [Google Scholar]
- Bakker, K. Water security: Research challenges and opportunities. Science 2012, 337, 914–915. [Google Scholar] [CrossRef] [PubMed]
- Gleick, P.H. Water and conflict: Fresh water resources and international security. Int. Secur. 1993, 18, 79–112. [Google Scholar] [CrossRef]
- Jiang, Y. China’s water security: Current status, emerging challenges and future prospects. Environ. Sci. Policy 2015, 54, 106–125. [Google Scholar] [CrossRef]
- Grouillet, B.; Fabre, J.; Ruelland, D.; Dezetter, A. Historical reconstruction and 2050 projections of water demand under anthropogenic and climate changes in two contrasted Mediterranean catchments. J. Hydrol. 2015, 522, 684–696. [Google Scholar] [CrossRef]
- Van Oel, P.R.; Krol, M.S.; Hoekstra, A.Y.; Taddei, R.R. Feedback mechanisms between water availability and water use in a semi-arid river basin: A spatially explicit multi-agent simulation approach. Environ. Model. Softw. 2010, 25, 433–443. [Google Scholar] [CrossRef]
- Olmstead, S.M. Climate change adaptation and water resource management: A review of the literature. Energy Econ. 2014, 46, 500–509. [Google Scholar] [CrossRef]
- Kanakoudis, V. Vulnerability based management of water resources systems. J. Hydroinform. 2004, 6, 133–156. [Google Scholar]
- Kim, J.; Kim, J.; Kim, Y.K. Korean public’s preference for supply security of oil and gas and the impact of protest bidders. Energy Policy 2016, 89, 202–213. [Google Scholar] [CrossRef]
- Gyamfi, S.; Modjinou, M.; Djordjevic, S. Improving electricity supply security in Ghana—The potential of renewable energy. Renew. Sustain. Energy Rev. 2015, 43, 1035–1045. [Google Scholar] [CrossRef]
- Reichl, J.; Schmidthaler, M.; Schneider, F. The value of supply security: The costs of power outages to Austrian households, firms and the public sector. Energy Econ. 2013, 36, 256–261. [Google Scholar] [CrossRef]
- Paton, F.L.; Dandy, G.C.; Maier, H.R. Integrated framework for assessing urban water supply security of systems with non-traditional sources under climate change. Environ. Model. Softw. 2014, 60, 302–319. [Google Scholar] [CrossRef]
- Liu, B.; Mei, X.; Li, Y.; Yang, Y. The connotation and extension of agricultural water resources security. Agric. Sci. China 2007, 6, 11–16. [Google Scholar] [CrossRef]
- Cook, C.; Bakker, K. Water security: Debating an emerging paradigm. Glob. Environ. Chang. 2012, 22, 94–102. [Google Scholar] [CrossRef]
- Kangning, C.; Jianhua, W.; Haihong, L.; Yong, Z.; Hongjing, Y.; Qingfu, X.; Fan, H.; Zhengli, Z.; Jiaqi, Z. Theoretical concept of water supply safety. China Water Resour. 2012, 23, 40–44. [Google Scholar]
- Weibull, W. A Statistical Theory of the Strength of Materials; Generalstabens Litografiska Anstalts Förlag: Stockholm, Sweden, 1939. [Google Scholar]
- Zhao, J.; Wang, Z.; Weng, W. Theory and model of water resources complex adaptive allocation system. Acta Geogr. Sin. 2003, 57, 639–647. [Google Scholar] [CrossRef]
- Ding, N.; Erfani, R.; Mokhtar, H.; Erfani, T. Agent based modelling for water resource allocation in the transboundary Nile River. Water 2016, 8, 139. [Google Scholar] [CrossRef]
- Hou, B.; Gao, E.; Wu, Y.; Zhan, X.; Wang, G.; Wu, K. Water resources demand hierarchy theory and preliminary practice. Adv. Water Sci. 2014, 25, 897–906. [Google Scholar]
- Beck, L.; Bernauer, T. How will combined changes in water demand and climate affect water availability in the Zambezi River basin? Glob. Environ. Chang. 2011, 21, 1061–1072. [Google Scholar] [CrossRef]
- Ansink, E.; Ruijs, A. Climate change and the stability of water allocation agreements. Environ. Res. Econ. 2008, 41, 249–266. [Google Scholar] [CrossRef]
- Dinar, S.; Katz, D.; De Stefano, L.; Blankespoor, B. Climate change, conflict, and cooperation: Global analysis of the effectiveness of international river treaties in addressing water variability. Political Geogr. 2015, 45, 55–66. [Google Scholar] [CrossRef]


| NO. | Category | Indexes | 2015 | 2020 |
|---|---|---|---|---|
| 1 | Comprehensive | Water consumption per 10,000 GDP (m3/10,000 yuan) | 52 | 33 |
| 2 | Comprehensive water consumption per capita (m3/per capita) | 400 | 415 | |
| 3 | Agricultural Water Conservation | Area ratio of water-saving irrigation projects (%) | 67 | 70 |
| 4 | Effective coefficient of irrigative water utilization | 0.55 | 0.60 | |
| 5 | Industry Water Conservation | Water consumption per 10,000 yuan of value-added by industry (m3/10,000 yuan) | 48 | 35 |
| 6 | Repetitive water use rate of industry (%) | 85 | 88 | |
| 7 | Domestic Water Conservation | Penetration rate of urban water-saving appliances (%) | 92 | 95 |
| 8 | Leakage rate of the urban water supply pipe network (%) | 9 | 8 | |
| 9 | Construction Industry and Tertiary Industry Water Conservation | Water consumption per unit of building area (m3/m2) | 0.7 | 0.5 |
| 10 | Water consumption per 10,000 yuan of value-added by tertiary industry (m3/10,000 yuan) | 7 | 5 |
| User Agents | 2015 | 2015 (5% Reduction) | 2020 | 2020 (10% Reduction) | ||||
|---|---|---|---|---|---|---|---|---|
| Supply | WSSI | Supply | WSSI | Supply | WSSI | Supply | WSSI | |
| Domestic | 4.80 | 94.7% | 4.79 | 93.0% | 5.14 | 98.2% | 5.10 | 96.5% |
| Primary Industry | 10.72 | 75.4% | 10.67 | 70.2% | 11.50 | 89.5% | 11.50 | 80.7% |
| Secondary Industry | 15.40 | 93.0% | 15.39 | 91.2% | 16.44 | 94.7% | 16.28 | 91.2% |
| Tertiary Industry | 1.37 | 91.2% | 1.37 | 89.5% | 1.47 | 96.5% | 1.45 | 93.0% |
| Ecotope | 2.04 | 82.5% | 2.04 | 78.9% | 2.18 | 91.2% | 2.16 | 86.0% |
| Quanzhou | 34.33 | 87.1% | 34.26 | 84.1% | 36.73 | 93.4% | 36.50 | 88.4% |
| County | 2015 | 2015 (5% Reduction) | 2020 | 2020 (10% Reduction) | ||||
|---|---|---|---|---|---|---|---|---|
| Supply | WSSI | Supply | WSSI | Supply | WSSI | Supply | WSSI | |
| Lichen | 1.62 | 90.2% | 1.60 | 82.8% | 1.97 | 92.2% | 1.95 | 90.5% |
| Fengze | 2.32 | 89.5% | 2.30 | 82.5% | 2.71 | 91.5% | 2.71 | 90.7% |
| Luojiang | 0.70 | 88.4% | 0.70 | 88.4% | 0.74 | 92.4% | 0.73 | 91.1% |
| Quangang | 2.51 | 90.3% | 2.50 | 81.2% | 3.02 | 91.3% | 3.02 | 91.3% |
| Jinjiang | 2.23 | 96.2% | 2.23 | 96.2% | 2.44 | 97.8% | 2.44 | 97.8% |
| Shishi | 6.41 | 86.6% | 6.41 | 86.6% | 6.55 | 93.4% | 6.55 | 93.4% |
| Nan’an | 5.56 | 85.8% | 5.56 | 85.8% | 5.69 | 89.5% | 5.60 | 88.2% |
| Hui’an | 3.61 | 84.2% | 3.60 | 81.3% | 3.78 | 79.5% | 3.66 | 74.2% |
| Anxi | 4.07 | 96.5% | 4.07 | 96.5% | 4.13 | 98.2% | 4.13 | 98.2% |
| Yongchun | 2.81 | 96.2% | 2.81 | 96.2% | 3.08 | 98.1% | 3.08 | 98.1% |
| Dehua | 2.47 | 96.6% | 2.47 | 96.6% | 2.63 | 98.3% | 2.63 | 98.3% |
© 2016 by the authors; licensee MDPI, Basel, Switzerland. This article is an open access article distributed under the terms and conditions of the Creative Commons Attribution (CC-BY) license (http://creativecommons.org/licenses/by/4.0/).
Share and Cite
Wang, J.; Hou, B.; Jiang, D.; Xiao, W.; Wu, Y.; Zhao, Y.; Zhou, Y.; Guo, C.; Wang, G. Optimal Allocation of Water Resources Based on Water Supply Security. Water 2016, 8, 237. https://doi.org/10.3390/w8060237
Wang J, Hou B, Jiang D, Xiao W, Wu Y, Zhao Y, Zhou Y, Guo C, Wang G. Optimal Allocation of Water Resources Based on Water Supply Security. Water. 2016; 8(6):237. https://doi.org/10.3390/w8060237
Chicago/Turabian StyleWang, Jianhua, Baodeng Hou, Dachuan Jiang, Weihua Xiao, Yongxiang Wu, Yong Zhao, Yuyan Zhou, Chongshan Guo, and Gaoxu Wang. 2016. "Optimal Allocation of Water Resources Based on Water Supply Security" Water 8, no. 6: 237. https://doi.org/10.3390/w8060237