1. Introduction
Contaminated drinking water causes a large part of the diarrheal diseases worldwide [
1,
2]. Inhabitants of rural communities in low-income countries are at a high risk of contracting water-borne diseases, repeatedly, due to lack of microbially safe water supplies. In India alone, water, hygiene, and sanitation problems are causing 7.5% of the total deaths, and 37.7 million cases of waterborne diseases annually [
3,
4].
Lack of clean water, however, is not a problem limited to India [
5], but is a global issue, and the enormous challenge of providing clean drinking water grows as populations increase. This is particularly a challenge in rural areas where options are limited by high cost and weather dependence, and where treatment solutions available in high-income countries and urban areas of developing countries are often too complex to be implemented.
In some rural areas, particularly where groundwater is difficult to access, water relatively free of microbial contamination is obtained from rooftop rainwater harvesting as seen in some poor areas of Bangladesh [
5], but, in practice, this solution is limited to the rainy season. Solar inactivation is a different method that kills viruses, bacteria, and protozoa through exposure to UV-A rays [
6]. It is a cheap and effective method, implemented through the simple use of plastic water bottles [
7,
8] (e.g., as seen in the Solar water Disinfection (SODIS) design [
9]) but requires tedious daily management and may not be effective when it is cloudy, rendering them a far from perfect solution in low-income areas. The use of chlorine in various forms is also effective but requires close management and monitoring [
10]. In the last few years, various methods based on membrane filters have been developed, but they are still relatively expensive, require maintenance and are therefore not suitable for developing countries [
10].
When implementing water treatment technologies in developing countries, long-term sustainability should be in focus. The World Health Organization (WHO) recommends slow sand filtration as a cheap and effective treatment method in rural areas [
8]. The concept relies on partly mechanical, partly biological treatment of water through a layer of sand. The treatment effectiveness varies with several factors such as sand grain size, flow rate, and the depth of the sand bed. Slow sand filters (SSF) are especially suitable in developing communities where money is scarce, as they are efficient and constructed of low-cost materials that can be obtained locally [
11]. Community SSFs, which provide clean water for whole communities, are seen in rural areas all over the world [
12,
13,
14]. These filters usually consist of a large sand-filled box of at least 1 m depth, and usually have removal efficiencies of 95%–100% faecal coliform (FC) bacteria [
15]. Other sand filters are constructed for household use such as the so-called biosand filters which are known for their simplicity and ability to remove contaminants like
E. coli with 98% efficiency [
16].
All SSFs require regular operation and maintenance [
15] including the most important actions of cleaning of the filter, by scraping off the top 2 cm of sand every 1–6 months [
17], changing the sand every few years and controlling the water flow [
15]. Unfortunately, many rural water supply programs are known to perform poorly [
18] and several SSF-installations fall into disuse due to lack of maintenance. Yamamura
et al. [
19] describe how increasing problems with large SSFs in Japan are related to maintenance costs, and Ngai
et al. [
20] state, in a review of biosand filters, that only 41% of the users knew how to clean the filter, causing maintenance problems. Thus, a filter with limited need for maintenance would be a good alternative to the traditional SSF.
This study assesses the design, implementation, and function of a modified version of a traditional SSF, a Submerged Pond Sand Filter which has the sand compartment of the filter submerged within a freshwater pond. It was built in a rural village on an island with severe groundwater depletion in the state of West Bengal, India, where it was implemented as part of a water and sanitation project, by Non-Governmental Organizations (NGOs) from Denmark and India (Danish Association for Sustainable Development (UBU) and Joygopalpur Gram Vikash Kendra (JGVK)) with the support of students from the Technical University of Denmark. The filter has been functioning since 2009.
The functioning of a Submerged Pond Sand Filter, during five years of
in situ use, is assessed in this paper with specific focus on:
Assessment of the design, setup, and implementation of a novel sand filter submerged into a pond;
Assessment of filter function since implementation in terms of microbial removal efficiency;
Evaluation of filter sustainability in terms of maintenance, as a water treatment solution in rural areas.
The filter was implemented in a pond on Gosaba Island by the use of a local workforce and has been in use by local villagers for five years. Results revealed that the filter removes 97% of FCs, a Log10 reduction of 1.5, corresponding to 2 ± 2 colony forming units (CFU) per 100 mL in the filtered water. The filter requires minimal maintenance and has not received any cleaning, in the form of scraping off or change of sand. The modified construction and its submersion into the pond left it unclogged throughout its five years of functioning, and this leaves it an interesting alternative to existing methods of water treatment in rural communities.
2. Materials and Methods
2.1. Study Site
The Submerged Pond Sand Filter was implemented in a pond in Gosaba village located next to Gosaba Hospital, in the South-24-Parganas district of West Bengal, India, 22.17332 North, 88.80459 East. The island of Gosaba was selected as a pilot site by NGOs JGVK and UBU because it suffers from severe water depletion. The island has a population of 222,764 people, mostly poor villagers. With a literacy level of 78% [
21] and no industry in the district, a large portion of the island population lives on primitive cultivation of land, in clay or wooden houses, and keeps animals in the household. Reoccurring natural disasters, such as the cyclone Aila in 2009 [
22], and occasional flooding by saltwater makes the ground water in this area, located on the south-eastern coast of India, saline and unsuitable for drinking. Furthermore, lack of proper personal hygiene is a large issue in the area.
Very little potable water is accessible in this part of the island, causing the area to be highly dependent on monsoon showers, which provide the only source of rain to the area. These occur during the short period June–September and fill up the many fresh-water ponds and water the crops. A major issue is depletion of ground water, which has been the main source of drinking water for decades, and therefore other sources such as surface water are needed. As governmental initiatives in the district are very limited, the implementations of treatment solutions, which require maintenance, often fail. This was previously seen on the island, where a government-installed horizontal roughing and slow sand filter was installed in 2008, but never set to function.
2.2. Overview of Study
Construction and Implementation
The filter was implemented in an emptied pond by a local workforce. The microbial quality of the treated water was thereafter measured every month during the first two years. Water quality and treatment efficiency were measured using faecal coliforms as indicator organisms since their presence in water indicates contamination by human or animal feces and subsequent pathogens [
23]. Analyses were conducted by membrane filtration, with a water field testing kit and subsequent incubation.
2.3. Experimental Design
Three studies were designed to investigate the bacterial removal efficiency of the SSF, and to evaluate the use of the filter: investigation of raw water quality, bacterial removal efficiency of the filter during normal use (5 min at 23 L/min), and bacterial removal efficiency during intensive use (1 h at 23 L/min). The flow rate was kept constant by keeping a typical and constant number of strokes per minute and resulted in all situations in a measured average flow of 23 L/min. Faecal coliform bacteria were quantified as an indicator of water contamination and filter efficiency.
Two different types of samples, namely raw water and treated water samples, were taken on the study site. This included raw water collected in the pond at 0.1, 1 and 2 m (level of filter inlet) depth, as well as treated water sampled at a flow rate of 23 L/min. Furthermore, a long-term pumping sample of treated water was taken after 1 h of pumping (~1400 L). All samples were analyzed—some subsamples in duplicates, and a few subsamples triplicates depending on the amount of space in the incubator.
2.4. Sample Collection
All investigations of the submerged filter were carried out as field studies. Samples were collected between 11 a.m. and 2 p.m., except the last sample, which was collected at 7:30 a.m. Samples were transported by boat and motorcycle from the sample site on the island to the provisional laboratory at JGVK on Basanti Island. The traveling time was a maximum of three hours, and though efforts were made to keep the samples cold, their temperature may have risen to as much as 30 °C on some days before analysis.
Raw pond water: 500 mL autoclaved Duran® (Main, Germany) laboratory bottles with tightly fitting autoclaved polypropylene screw caps were used to collect raw water samples at following depths: 2 m depth (in front of the filter opening), at approximately 1 m depth, and at surface level (0.1 m). The water was sampled by opening and closing the sample bottle only at the wanted water depth. The depth of the water was estimated using the knowledge of the filter dimensions in relation to the location of the pipe, which was visible above the water.
Treated water (from pump): 500 mL autoclaved Duran® laboratory bottles with polypropylene screw caps were filled with treated water, which was collected from the old hand pump connected to the filter, at the pumping site next to the pond. Prior to sampling, approximately 23 L were pumped through the pipe, corresponding to the approximate volume of the pipe, in order to sample water from the filter, and to avoid sampling water stored in the pipeline.
2.5. Analyses
Water samples were analyzed in a provisional laboratory, established in a cleaned bathroom at the local NGO JGVK located in Joygopalpur, Basanti Block, 24-South Parganas, West Bengal. The experimental setup was carried out making use of local facilities and a few imported items. These were far from optimal conditions, but they were the circumstances that applied when experimenting in a low technological setup which located hundreds of kilometers from the nearest scientific facility.
Faecal coliform bacteria were quantified using OXFAM DELAGUA Potable Water Testing Kit (single incubator model, 2009) (Marlborough, Wiltshire, UK)including the following materials: reusable aluminum Petri dishes (16/kit), filtration apparatus, metal tweezers, lighter, 100 mL plastic medium bottles. Incubator temperature: 44 °C, test capacity 16 plates [
24].
The laboratory procedure was: upon return to the laboratory, the filtration apparatus from the water testing kit was sterilized in boiling water for 15 min. Sterile Petri dishes were prepared with one absorbent paper pad, (Millipore 11282 47 mm, Delagua, Billerica, MA, USA) in each dish with 2.5 mL MLS-broth medium. Medium consisted of M-Lauryl sulfate broth, Sigma-Aldrich, product nr. (07348 Sigma-Aldrich, St. Louis, MO, USA), (76.2 g/L distilled water) and was prepared by heating medium powder until it dissolved and then autoclaving it at 15 lb pressure, equivalent to 121 °C, for 15 min. The medium was stored below 8 °C. A sterile filter (Sartorius Cellulose Nitrate Membrane Filter, 47 mm, 0.45 μm pore size, (Goettingen, Germany) was placed on the filtration apparatus using sterilized tweezers, and the filter funnel was placed on top, and a sample of 10, 30 or 100 mL water was sucked through the filter by a vacuum created by a manual vacuum pump. With tweezers, the filter was placed on top of the pad and incubated in a DelAgua field incubator (Marlborough, Wiltshire, UK) for 18 h at 43 ± 1 °C and 35 ± 2 °C. All samples were at room temperature (approximately 30 °C) at the initiation of incubation. The filter was sterilized after each sample, and all samples were kept <5 °C after the transport until the analysis. The autoclave was a Ft. Goley autoclave (Haryana, India), 12″ × 12″, non-electrical, a product of an ISO 9001:2000 certified CO. It looked old, and the isolating rubber-ring was disintegrating, causing steam to escape. Pressure rose to 15 Bar in 30 min.
Turbidity measurements: Raw water turbidity was measured with an OXFAM DelAgua turbidity tube (5–1000 NTU (Nephelometric Turbidity Units)) (Marlborough, Wiltshire, UK) [
24]. The water sample was poured into the tube until a black circle in the bottom could not be seen. The resulting height of the water column, measured in NTU), was read from the logarithmic scale on the side (5–1000 NTU). Water cleaner than 5 NTU cannot be estimated and precision at higher levels varies with 100 NTU.
2.6. Data Analyses
Standard deviation was calculated and two-sided, unpaired t-tests were employed to evaluate the 0-hypotheis (Microsoft Office Excel, 2007 (Redmond, Washington, DC, USA)
3. Results and Discussion
3.1. Design, Setup, and Implementation of a Submerged Pond Sand Filter
The novel design of the Submerged Pond Sand Filter (
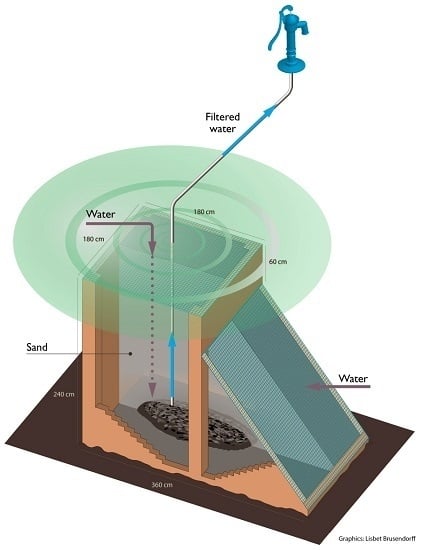
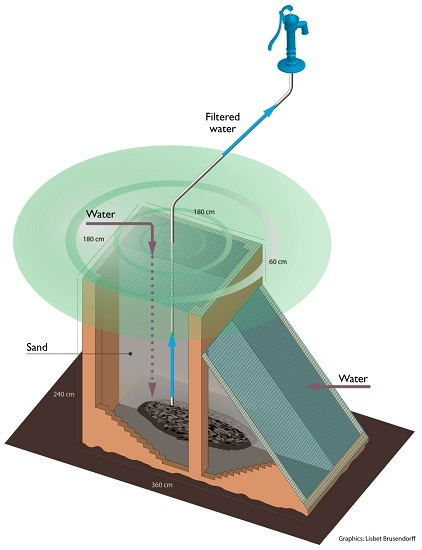
Figure 1) was developed from the concept of slow sand filtration in collaboration between Henrik Bregnhøj, Danish students from The Technical University of Denmark (DTU) and JGVK. The submerged filter was constructed and installed in 2009 to create a long-term, effective water treatment system in a drinking water depleted area, where fresh water ponds are abundant.
The filter is constructed inside a pond and entirely submerged with a sloping surface on the side of the filter and a horizontal surface from the top. The water sieves through the sand and into a pipe in the bottom of the filter, driven by suction from a hand pump on the bank of the pond.
The construction benefits the schmutzdecke, a mass of living biological matter forming a gelatinous layer on the sand surface. This layer is not at risk of drying out during use because the filter is submerged down to 3 m depth.
The robust filter wall construction is made of mortar and bricks and was built in the emptied pond. The filter construction consists of a square structure with an inflow of water from two sides, both vertically from the top, and horizontally through a triangular construction connected to the square (
Table 1). The sand for the filter was sieved locally to a size of 2–3 mm, and 1200 L of small stones and gravel layers were installed at the bottom of the filter to cover the water pipe intake. The sand layer is 0.8 m thick at the shallowest point, and 3 m at the deepest. A 3 m long pipe collects treated water from the bottom of the filter and transports it vertically to the pond surface and continues 8 m horizontally to the manual hand pump on the pond bank, from which the water is pumped out on a concrete platform. A nylon net covers both filter surfaces of the sand bed.
The Submerged Pond Sand Filter was constructed in a fresh-water pond on Gosaba Island (
Figure 2). The pond is protected by a small wooden fence on three sides and a concrete wall on one side, to avoid contamination by common use; however, goats and humans were occasionally observed on the pond site. The concrete wall has cracks running along the foundation, which may allow rainwater from the road to drain from this side of the wall into the pond. Small amounts of trash and a few bottles were found in the pond. There is no drain, and excess water from the pump sieves into the bank of the pond. Pond site is maintained by the local organization Anyesha for Science, who maintains the fence surrounding the pond and removes trash.
Rainwater is the only source of water to the pond and enters as run-off from the surrounding area and to some degree from the quite clayish soil. During 3–4 months of the monsoon season, rain falls in large quantities with a yearly average between 1227 mm and 1625 mm [
21,
25] in the district 24-south Parganas, where the filter is located. Thus, with a surface area of approximately 900 m
2, the pond would collect 1100–1450 m
3 fresh water/year from direct rainfall, but it fills up, so the rest comes from run-off and influx. Based on usage and rainfall, a full pond would just be able to provide water for the 250 users with 20 L per day for a year. However, the water balance is not straightforward; on one hand, the impression of the number of active users was that they were less than 250 upon inspection in 2014. On the other hand, according to local villagers, the pond water is usually used up during dry season and has been supplemented with water from a neighboring large pond for some years.
3.2. Raw Water Quality
The appearance of the raw pond water was uninviting, and when standing knee-deep in the pond, feet were not visible. An assessment of turbidity in 2014 showed raw water levels of 10 NTU, which is in accordance with the recommended standard for raw water sources set by the WHO, and lies at <20 NTU [
11]. As high turbidity levels generally lead to shorter filter runs due to clogging, and a low level of turbidity is advantageous
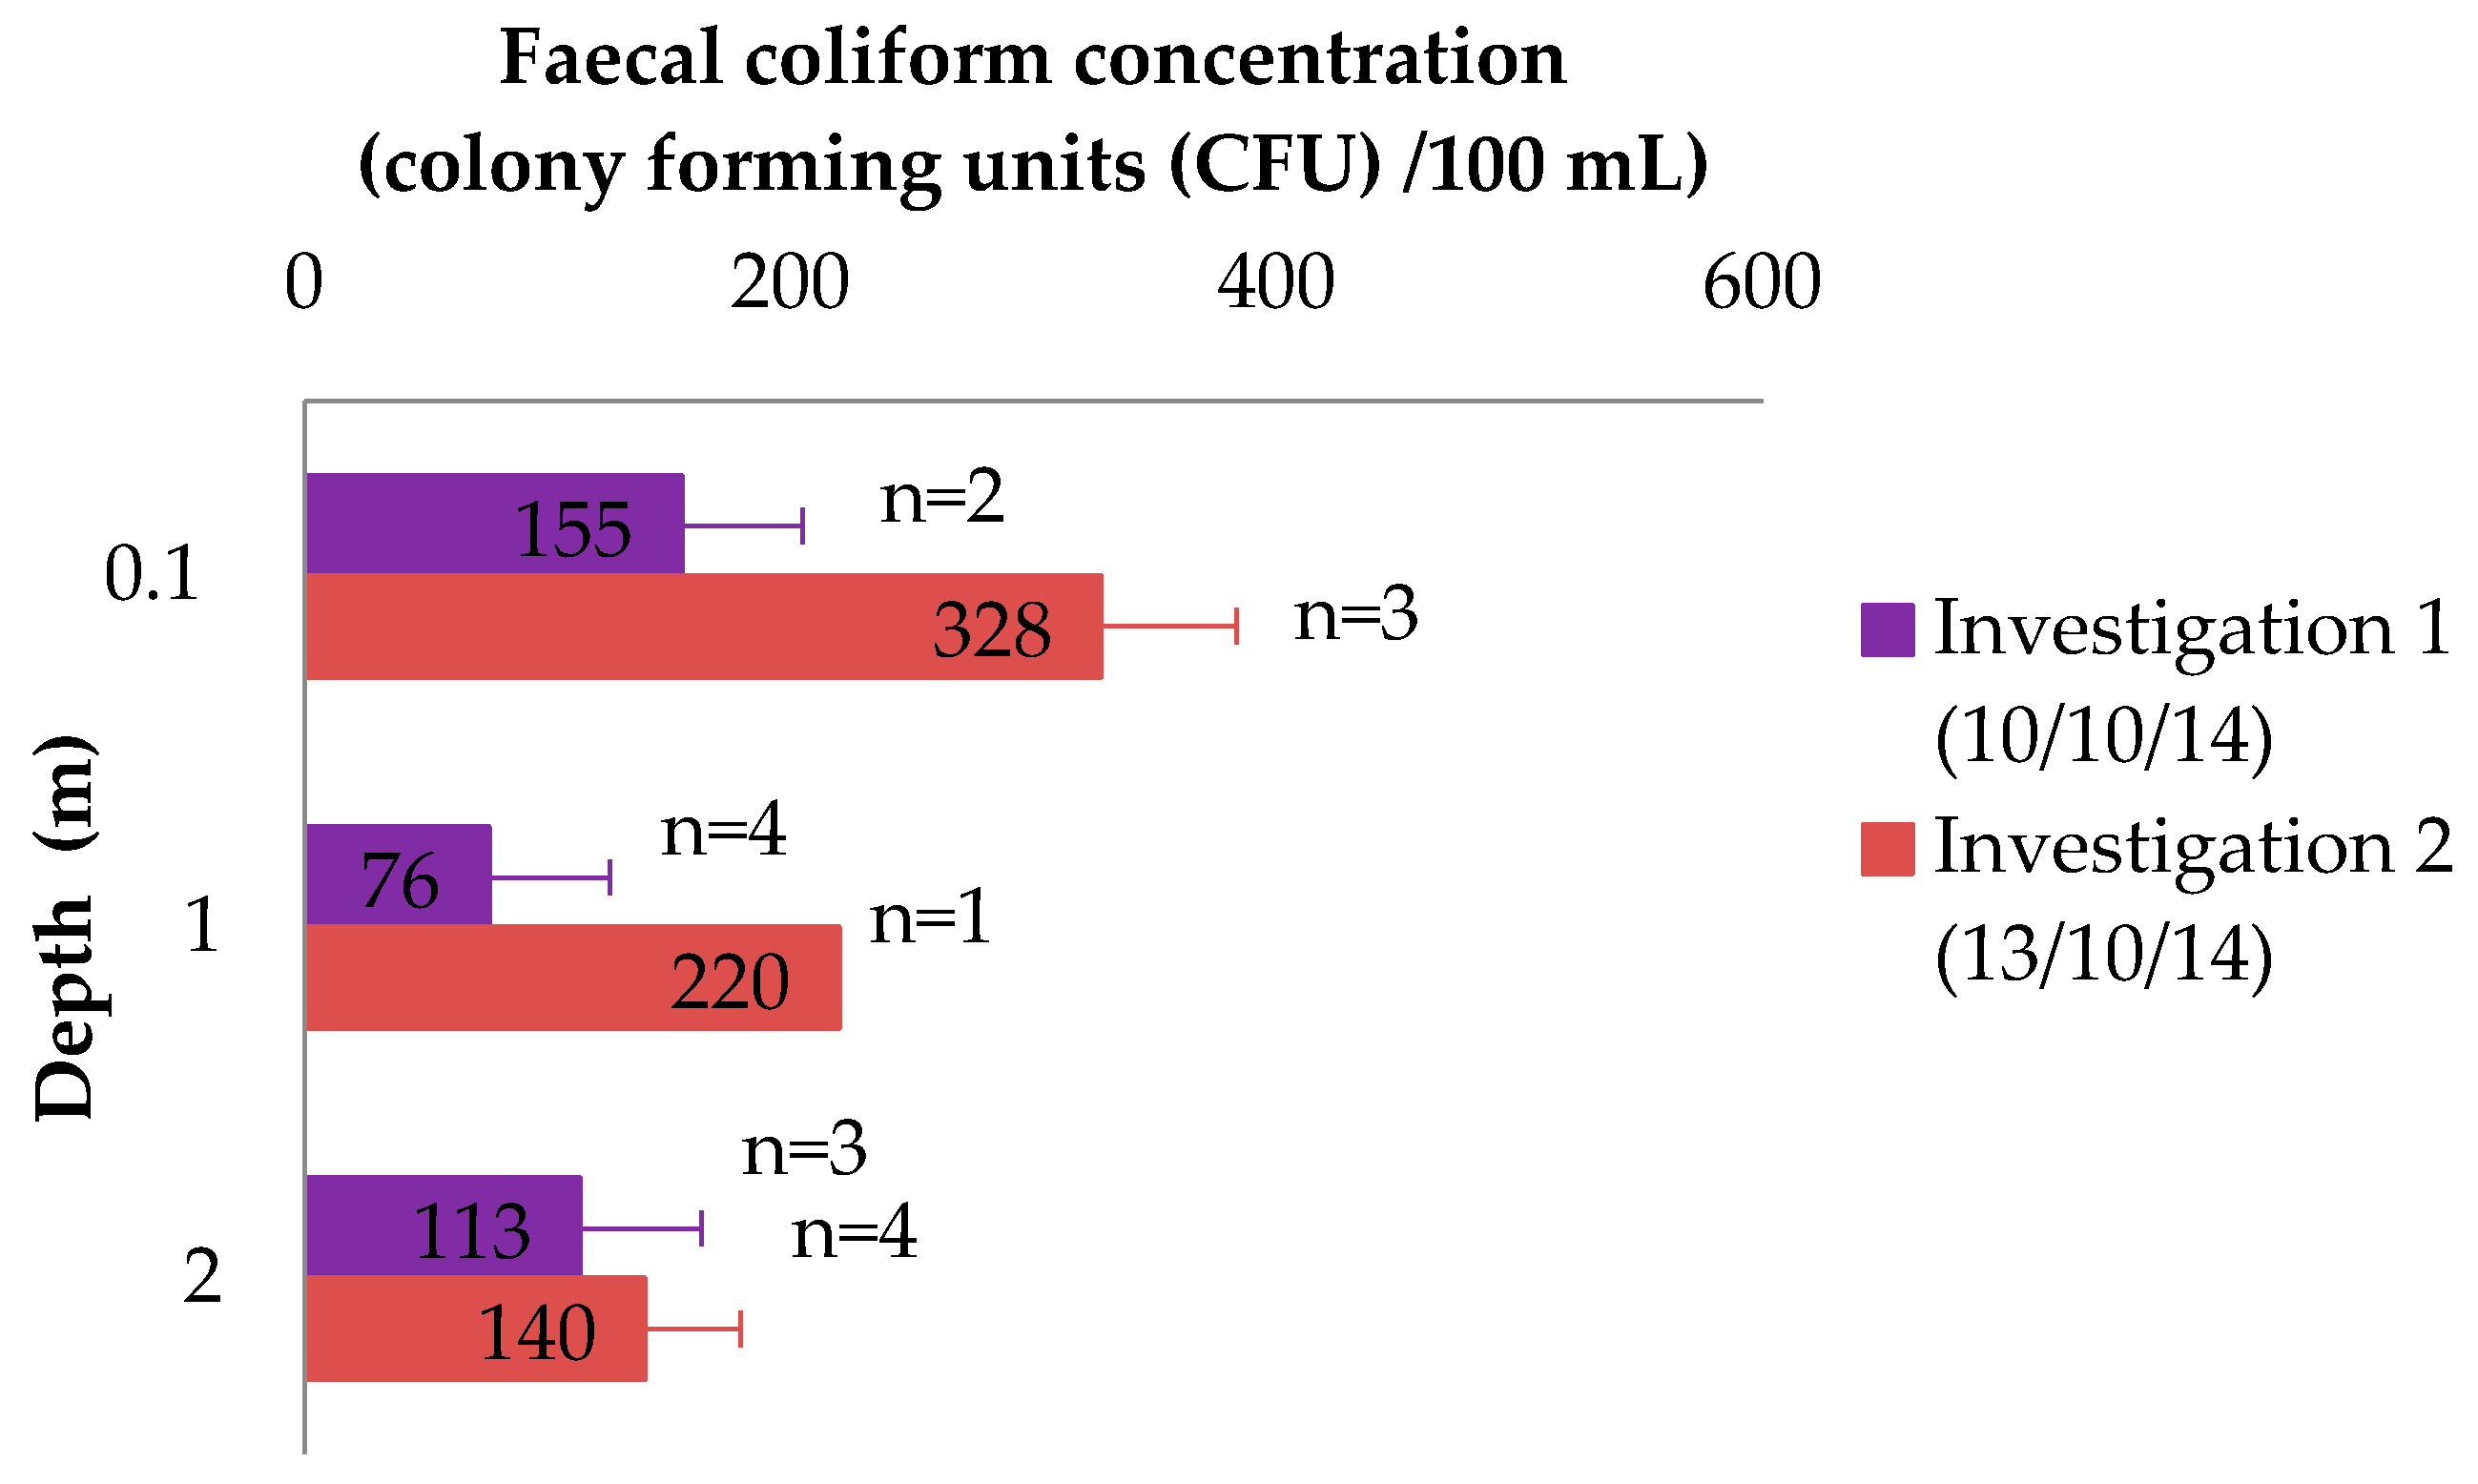
The content of FC bacteria was measured at three different depths in 2014: at water surface (0.1 m), at 1 m depth, and at 2 m depth (
Figure 3). The first sample showed mean values of 155 ± 21 CFU/100 mL for surface, 76 ± 18 CFU/100 mL for 1 m depth, and 113 ± 21 CFU/100 mL for 2 m depth (
Figure 3). The second investigation revealed visibly higher counts, 328 ± 56 CFU/100 mL for surface, 228 CFU/100 mL for 1 m depth, and 140 ± 40 CFU/100 mL for 2 m depth samples. One-sided, paired
t-tests confirmed that surface water was significantly more contaminated than water at 2 m depth (
p < 0.05). The level of FC bacteria in surface waters in West Bengal previously reported was 500 to several thousand per 100 mL [
26], whereas the level in the surface water of this study was 259 ±103 CFU/100 mL on average and cleaner in comparison. This lower load of FC may be a result of a fence that was implemented with the filter, limiting entry of people and animals in the water. The water quality was lower at the surface than at the bottom level, which could indicate that contamination enters the pond from the surface e.g., as road runoff (samples were taken during rainy season), or that mucilage of cyanobacteria in the surface water act as habitat for bacteria [
27]. It could be expected that the surface water would be less contaminated due to bacterial inactivation by sun-exposure, as sunlight has been shown to increase decay rates of faecal coliforms in water treatment ponds [
28], but this was not the case.
It is a general perception that the raw water source used for filtration should be as uncontaminated as possible to ensure the highest water quality [
26]. The filter on Gosaba Island was built on the bottom of the pond and thereby has an intake of water which is less contaminated by FC bacteria than filters with water intake at the surface. The result of this study indicates that the optimal placement of a submerged sand filter is at 2 m depth or deeper.
3.3. Treatment Efficiency of Filter
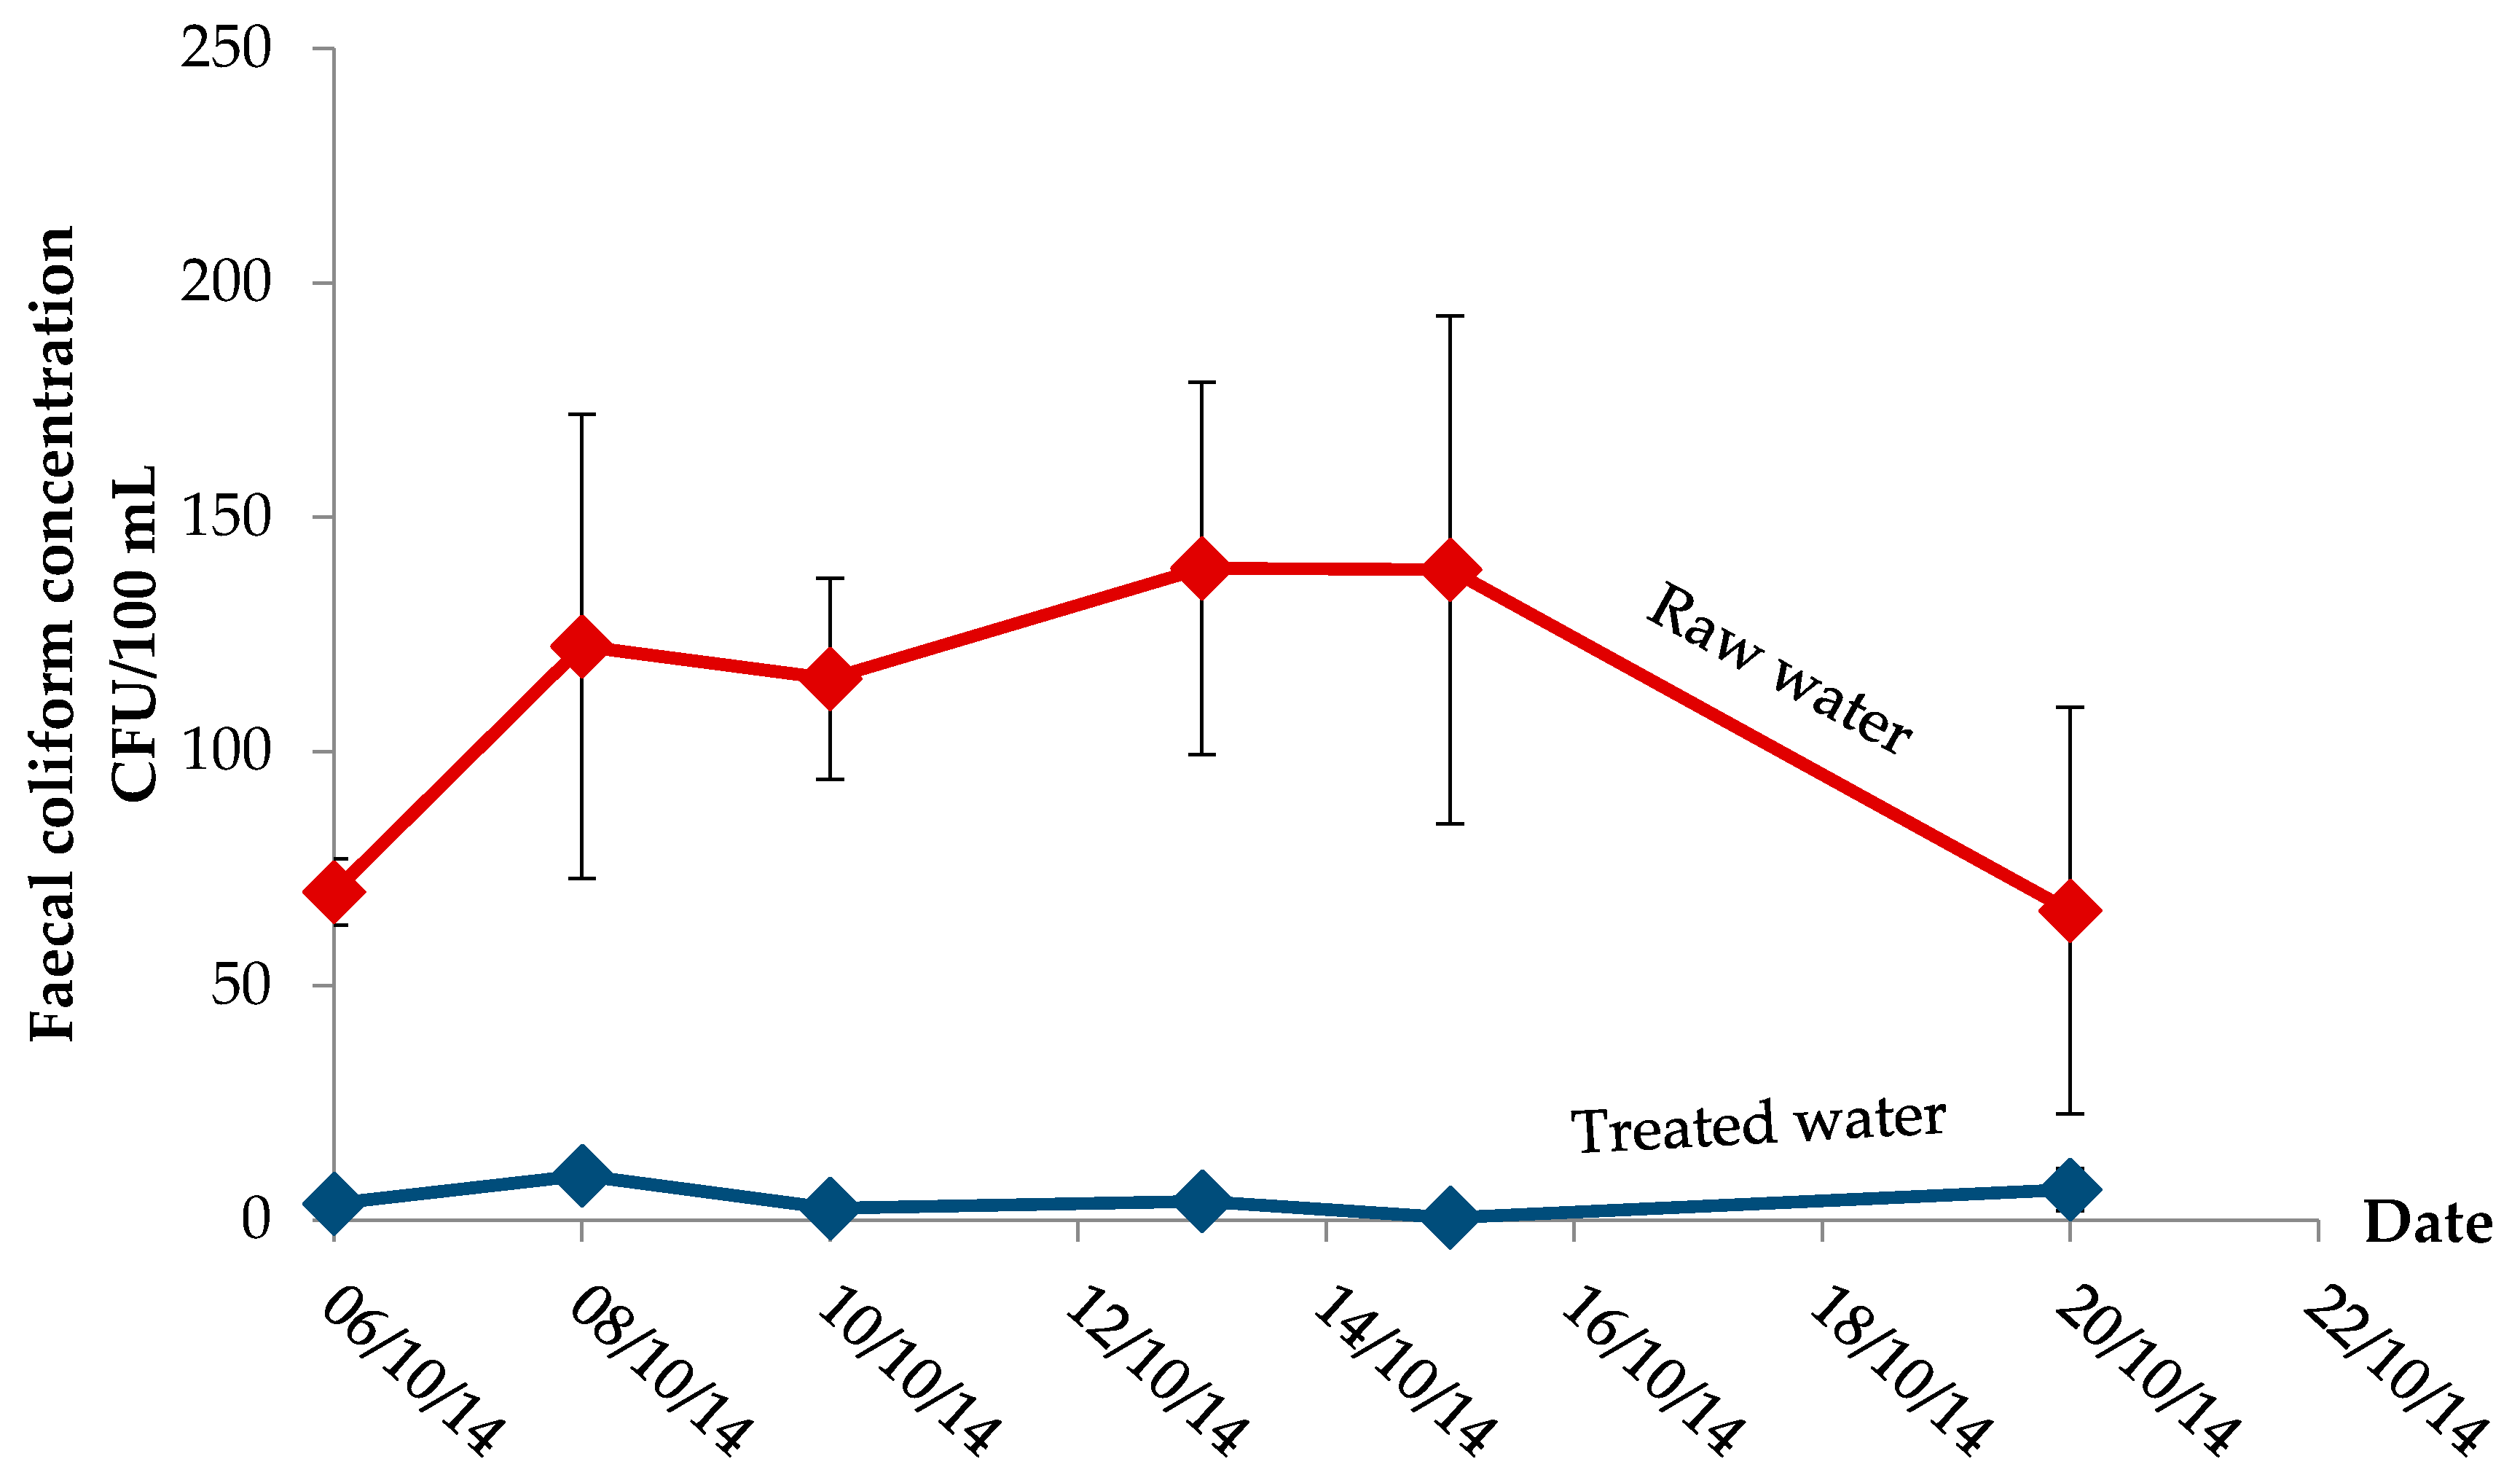
The effectiveness of the submerged filter in terms of bacterial removal was investigated in two separate periods during the span of five years. Treated water was considerably cleaner in appearance compared to raw water during both testing periods, with a minor earthy smell and turbidity of <5 NTU that complies with WHO guidelines of max 5 NTU [
29]. From implementation in August 2009 to December 2011 and in October 2014 (
Figure 4), the concentration of FC bacteria was significantly lower in treated water compared to raw water. The effectiveness of the filter was reasonably stable, with a removal efficiency of 95%–100% in 30 out of 36 samples and never exceeding 10 CFU/100 mL in the effluent.
Following ripening of the filter in August 2009, the first two years of operation showed an average of 1 ± 2 CFU/100 mL of FC for treated water, with the FC-level never exceeding 3 CFU/100 mL. Both raw and treated water quality improved considerably within the first month. Contamination of the pond was reduced as a result of shielding, and the treated water quality increased during ripening as the schmutzdecke was established in the filter.
FC concentrations in treated water increased slightly towards the last months of 2011, which indicates a decline in filter quality. This decline was confirmed in measurements of six samples from 2014 (
Figure 5), where average FC concentration of treated water increased to 4 ± 3 CFU/100 mL. Additionally, raw water contamination increased from an average of 38 CFU/100 mL in 2009–2011 (after two month of ripening) to 109 CFU/100 mL in 2014, indicating a correlation between raw water quality and filter treatment efficiency.
The quality of treated, as well as raw water, decreased slightly during five years of filter operation. Treated water quality declined from an average of 2 CFU/100 mL in 2009–2011 to 4 CFU/100 mL in 2014. Though results span over a five-year period, they are fairly stable and give evidence to a relative robustness and consistency of the filter.
With an average of 2 CFU/100 mL during five years of operation, this Submerged Pond Sand Filter, unfortunately, does not comply with WHO’s internationally recommended standards of 0 CFU/100 mL [
29], and, since faecal coliforms indicate the presence of faeces and subsequently several pathogenic species, their presence in the treated water signify a certain health risk associated with consumption. However, the standards met in developed countries can rarely be reached in rural areas. Lack of natural water resources, funding and knowledge leave these areas with few alternatives for water supply. In rural areas of neighboring Bangladesh, the guideline for maximum content of faecal coliforms in drinking water in rural areas is 10 CFU/100 mL, according to the international water organization, WaterAid [
30]. This filter provides a treatment method which is not 100% effective, but may improve water quality in developing communities where rough guidelines can be accepted until conditions have improved and the WHO guidelines are realizable.
Removal of higher organisms has not been investigated in this study, but several studies have proven partly or complete removal of organic matter and organisms in slow sand filters, such as dissolved organic matter (46%–75% removal) [
31], helminths (100% removal) [
32], protozoa (>99.9% removal) [
33] and oocysts (99%–99.9% removal) [
34]. Though this study has only measured indicator organisms, the above studies give reasonable cause to assume a high degree of removal of other potential pathogens in the Submerged Pond Sand Filter.
3.4. Treatment Efficiency during Intensive Use
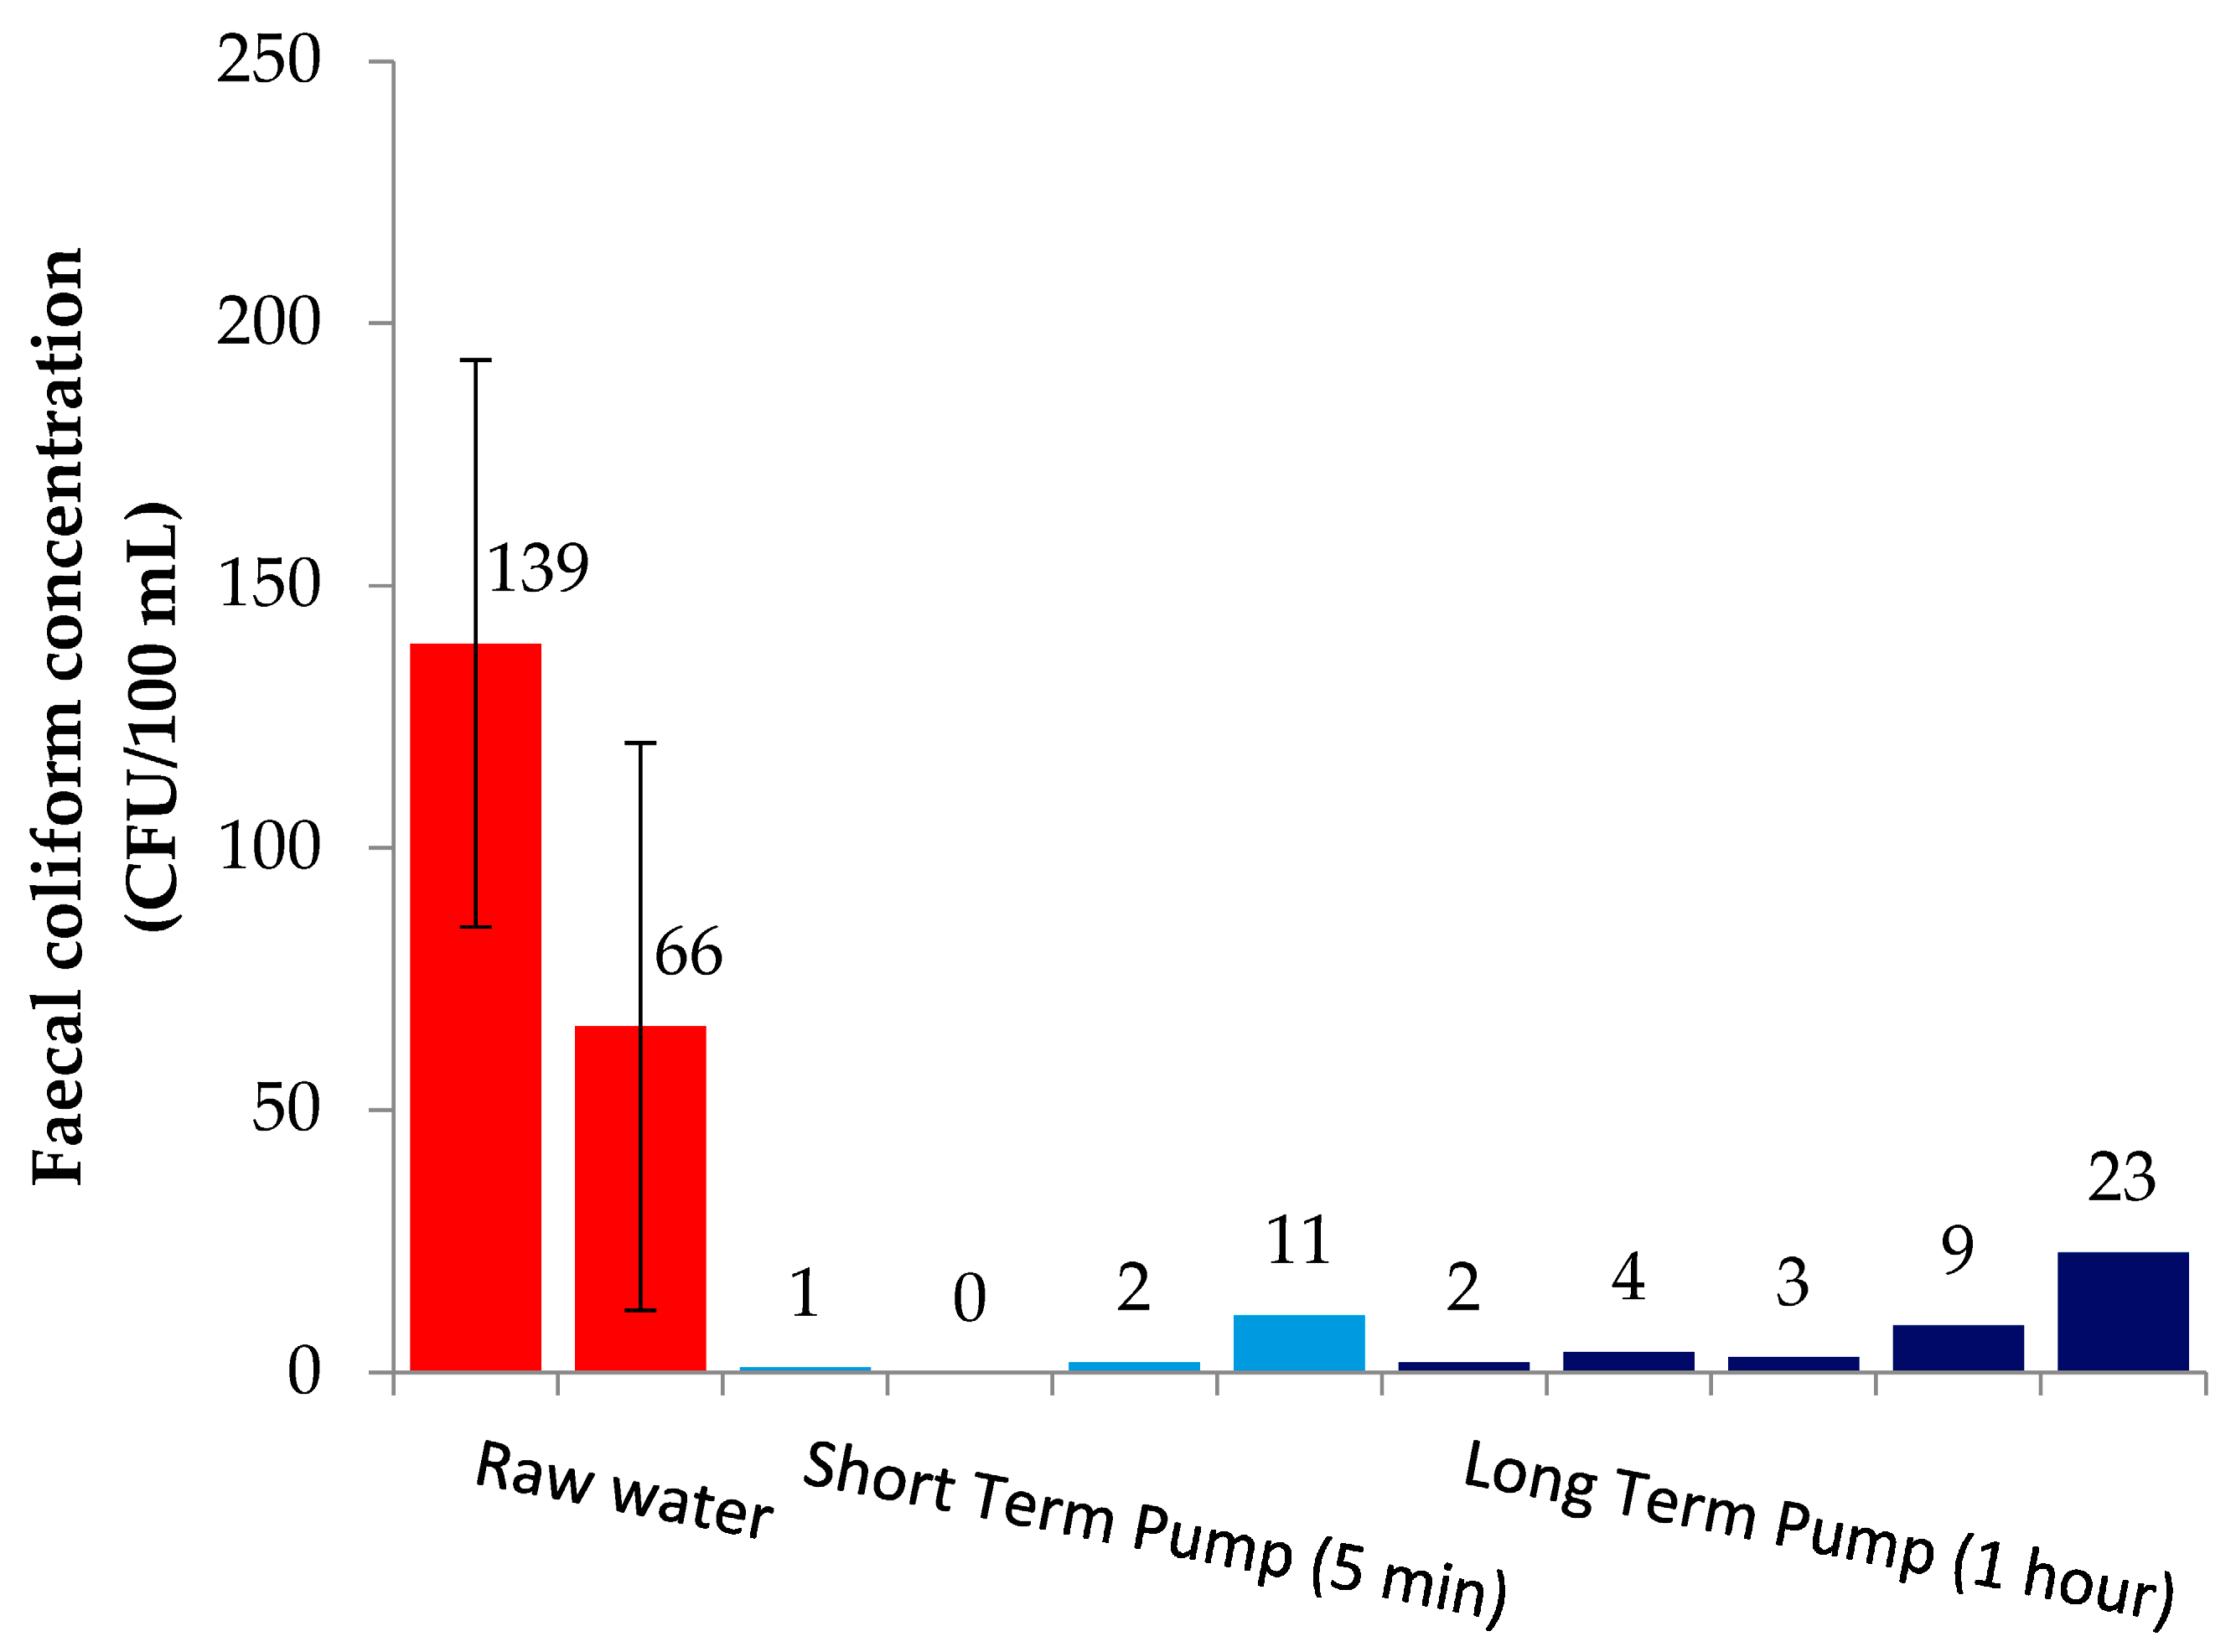
The microbial filtering efficiency of the Submerged Pond Sand Filter was examined during short pumping intervals and after long and persistent pumping, to mimic the intensive use of the filter, which sometimes occurs during normal use (
Figure 6). The short term sample was collected first, and five minutes later, the long-term pumping was initiated. All samples were collected on the same day, and the experiment was repeated after five days. Two days of raw water quality measurements including the standard deviation are also depicted for comparison. They were measured on the same days as the treated water samples. Most women on Gosaba Island collect water in the morning around 7:30 a.m., resulting in a more intensive and long-term use of the filter at this time of day, and long inactive periods without pumping in the afternoon. In this investigation, approximately 1400 L of water were pumped through the filter during one hour at normal flow rate, which is close to the estimated volume of water in the filter (1500 L).
Although the contamination with faecal coliform bacteria in the short-term pumping samples was lower in most samples, the difference was not significant (p = 0.35). This indicates that the contact time within the filter does not have a noteworthy influence on the contamination level and that continuous use is possible without causing a significant decrease in quality. The results indicate a robustness of the filter, in terms of delivering water of equal quality, and also during a high strain on the filter.
4. Sustainability of a Submerged Pond Sand Filter
Slow sand filtration is a low-cost, low-maintenance treatment method, but some level of maintenance is necessary to keep filters running and up to standard [
15].
According to a local NGO on Gosaba Island, regular maintenance has been performed on the submerged pond filter on Gosaba Island during the five years the filter has been in operation. The NGO has kept the surrounding area free from trash, cleaned the pond and pump area, maintained the fence around the pond and checked pump operation. However, after five years of operation, the level of maintenance was diminished, and animals and bottles occasionally found their way to the pond site. Furthermore, the drain for excess water on the pumping platform was not removing water effectively from the pond, and, since the filter was used for bathing by patients from the local hospital, water draining back into the pond might pose a health threat to the surrounding villagers. An improvement would be to lead the drainage water to a separate small pit located a few meters away from the pond. In spite of these issues, the high usage, at different pumping rates during a five-year period bears witness to the robustness of the filter, which makes it suitable for a rural village.
Cleaning of the sand bed by scraping off the upper few cm of the sand (the schmutzdecke) is standard maintenance for conventional slow sand filters. The sand inside the Submerged Pond Sand Filter has not been scraped nor cleaned because the filter has not clogged during five years of operation. This is highly unusual for sand filters, which have a tendency to clog when not cleaned, depending on the quality of supplied water and grain size of the sand [
15]. However, as the filter still has a high throughput of water, and shows no signs of clogging, the schmutzdecke does not seem to need scraping off.
The lack of clogging is an interesting feature of this filter, and it might be explained by the modified construction of the sand filter, where the underwater submersion might be reasons for the apparent self-cleaning. The inclined construction where water enters the filter from the side may cause the particles to “slide down” the sloped sand bed. The raw water quality was better, containing less faecal coliforms than usual surface water in West Bengal [
26], and it is, therefore, reasonable to suggest that this also has an influence on slower clogging of the filter. Finally, the sand grain size may also be a contributing factor. According to original records, the sand is 2–3 mm, making the grains larger and less homogeneous than in usual SSFs, where the grain size is about 10 times smaller [
29]. Finer sand with a smaller pore size makes straining far more effective and optimizes sedimentation and adsorption. However, while bacterial removal efficiency might be optimized by a smaller grain size, it also leads to faster clogging of the filter and thus increased maintenance [
11]. It can, therefore, be suggested, that the relatively large sand grain sizes contributed to the long filter run of the submerged filter.
The continuing functionality without cleaning also leads to suspicion of channeling in the sand bed. It is known that incorrect sizing of sand can cause channeling [
35], leading to lowered quality of the treated water. This could be a possible reason for the decline in quality throughout the five years of function. Furthermore, a slight smell of the filtered water has developed in the last year, and changing or cleaning the sand in the sand bed might decrease this smell, as well as eliminate existing channels.
Though a slight decrease in water quality followed after two years of operation (
Figure 4), the filter still provides highly improved treated water after five years of operation without cleaning. The filter still does not meet the standards of “safe” drinking water set by WHO, but since maintenance of even basic tasks seems to be lacking in the area, this persistent functionality of the submerged filter is a valuable advantage in rural communities.
5. Conclusions
Bacterial removal in a Submerged Pond Sand Filter is an efficient method to improve water quality in low-income, groundwater depleted, rural areas. The investigated Submerged Pond Sand Filter provided 97% removal efficiency of faecal coliform bacteria, as a low-cost and low-maintenance solution, built environmentally friendly on site, with local materials, in an area where alternatives are very limited. Furthermore, the production rate (23 L/min) is high, compared to alternative sources such as small household filters or the current slow-running and limited groundwater source. The filter has been in operation for five consecutive years, with limited maintenance by the responsible NGO, which is unusual for sand filters, but a valuable factor. Overall, the filter composes a promising and effective method for drinking water treatment in rural areas. In potential follow-up improvements, it would be relevant to investigate the impact of smaller grain size, to further optimize the balance between removal efficiency and low maintenance requirements.
On the basis of the investigation, we recommend that (1) the sand is cleaned or exchanged with new sand after a maximum five years of operation (and possibly every 2–3 years) or additional sand is added; (2) that the pumping platform is only used for collecting water, not washing with soap; and (3) maintenance of the fence and surroundings is done properly.


