1. Introduction
In the context of urbanization and climate change, flooding has received much attention in sustainable development activities. Because of an increase in impervious areas, such as rooftops, squares and roads, surface runoff flow in urban watersheds is higher than in natural watersheds. During the rainy season, when surface runoff in sewer systems exceeds the designed capacity, storm water overflows onto the land surface through manholes or pumping reservoirs and flooding occurs [
1]. To address these storm water floods, the traditional and continuing solution has been to improve the capacity of conduits, pumping facilities or outlet structures to accommodate the higher drainage flow [
2]. The construction and maintenance costs required for these system modifications are extremely high, especially for metropolitan cities. In such a situation, detention storage is considered as an effective means for flood peak reduction in order to minimize flood damage [
3].
Generally, detention reservoirs can be constructed by damming a channel or by excavating into the existing ground to temporarily capture storm water for slow release through controlled outlets. The detention basins can be engineered tanks and natural ponds located at the downstream outlet of drainage systems, but can also be on-site or off-site locations in upstream sub-catchments on both local and regional scales [
4]. In an urban area, detention storage is mostly dry and will be temporarily filled during severe rainfall events lasting several hours. However, the delayed drainage in order to mitigate peak flow and flood volume downstream may coincide with storm water from upstream, aggravating potential flooding situations. Since the storage in detention basins is designed according to critical frequencies, their capacities may be exceeded in severe flood events. In this case, inundation occurs in the detention storage areas. Therefore, effective operation of these detention reservoirs is imperative.
The optimization of the efficiency of detention basins has been discussed for several decades. In most literature, the size and location of detention basins have been determined to minimize flood damage using different algorithms, such as nonlinear programming [
5], dynamic programing [
6,
7,
8,
9], and meta-heuristics algorithms such as the genetic algorithm [
10], simulated annealing [
11], the nondominated sorting genetic algorithm [
12], and tabu search [
13]. More recently, the optimal operation of urban detention basins has received much attention. These studies optimized the flood reduction effect of urban detention storage by finding suitable designs for outlet structures consisting of orifices and/or weir combinations [
10,
11], optimal pumping schedules [
14,
15,
16,
17], or optimal gate operation [
18]. However, the majority of these studies have evaluated downstream detention ponds located at the outlet of the drainage system and have applied reservoir routing to simulate flow through the detention ponds.
The present study proposes the optimal detention facilities of an upstream pond in drainage networks to minimize flood damage in downstream areas by coupling optimization techniques with a flood routing model. Because land for detention basins might otherwise be used for more economical purposes and construction costs are expensive, the size of the detention storage is set as the same as the existing area. The factors considered in this study are, therefore, the inlet and outlet structures.
2. Methodology
A detention reservoir is a flow retardation structure in an urban drainage system. It provides space to temporarily store incoming flow to reduce peak flows downstream. The flood flow impounded in a detention reservoir is then released back to the sewer system by various types of outlets, such as weirs or orifices, or by pumping [
19]. In general, the detention reservoir facilities are designed to store and release flood water according to a certain frequency. Despite reducing the flood damage downstream by releasing flood water slowly, flooding risk may occur at the area of the detention basin because of flood events that exceed the basin design’s capacity. When severe flooding occurs, the detention reservoir and its facilities cannot convey flood water, and local flooding may happen. Furthermore, insufficient draining to the main conduit system may coincide with the peak flow downstream. For these scenarios, instead of flood reduction, the detention reservoir could aggravate potential flooding. The traditional solutions for the aforementioned problems are enlarging the sizes of the storage units and outlet structures, which requires monetary investment and labor. In this study, the existing storage units and outlets are considered to determine the optimal conditions for the inlet and outlet facilities.
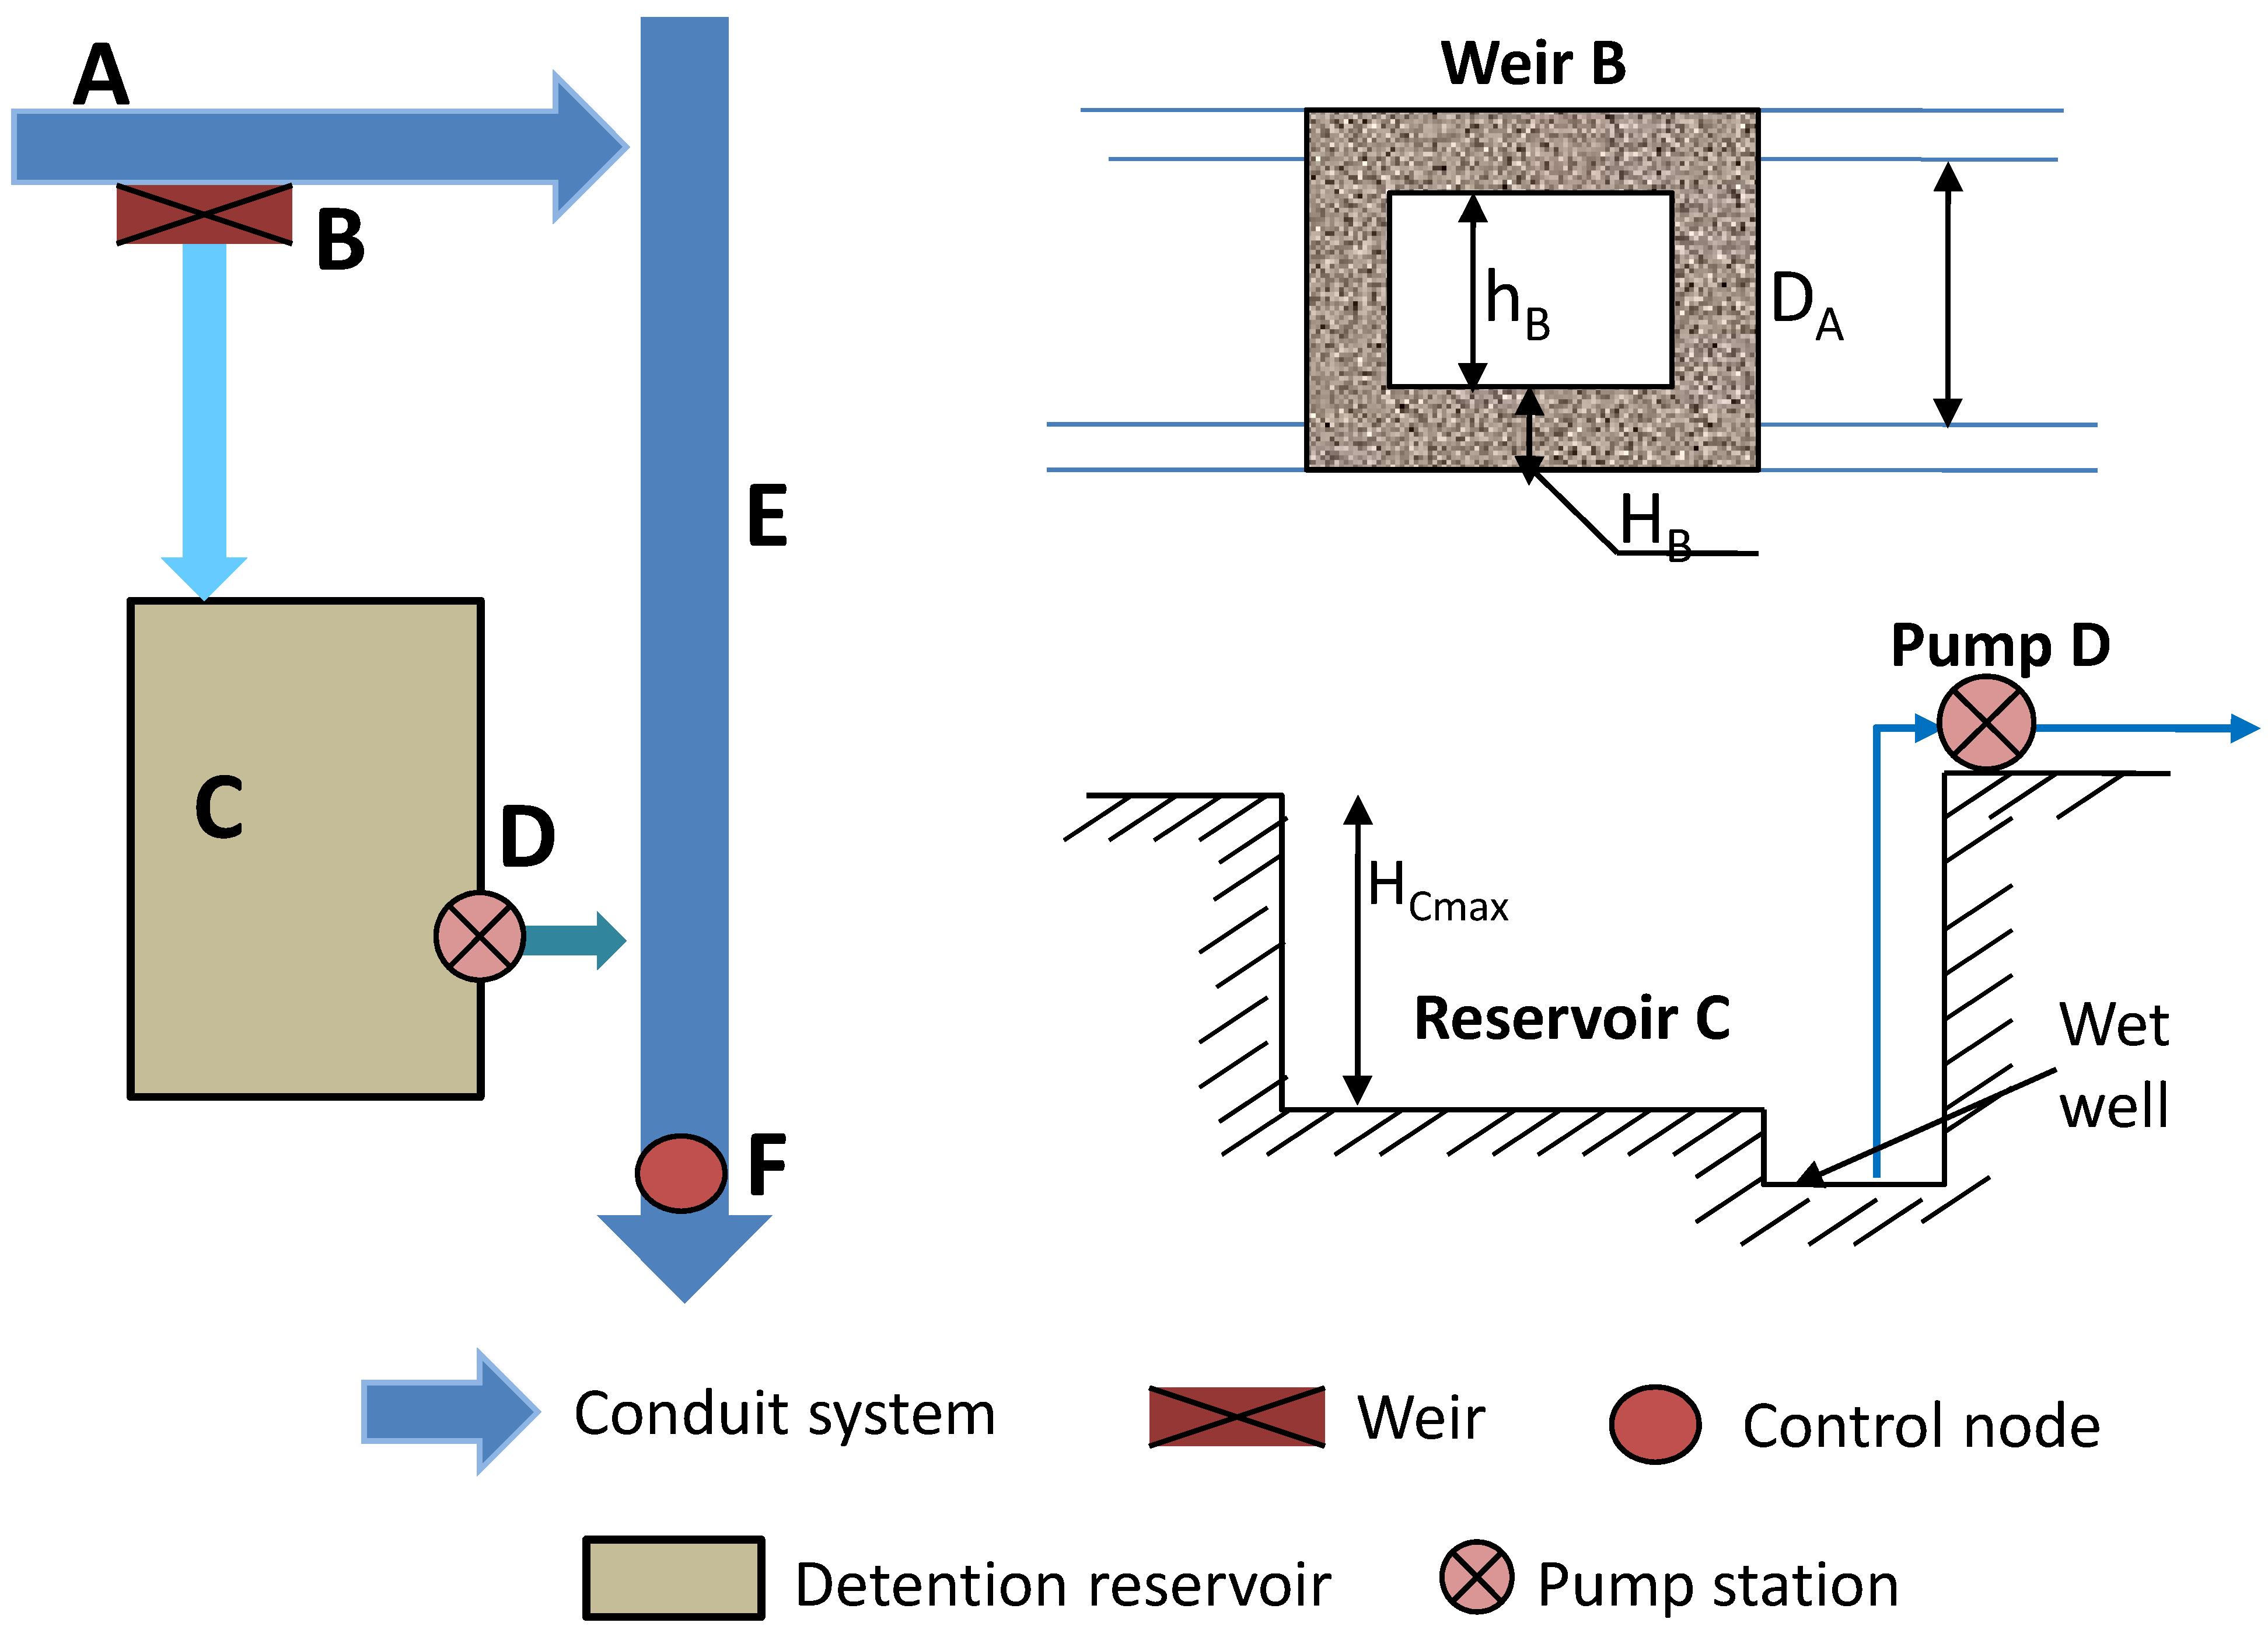
In this study, a side-weir inlet and a pump station outlet of the detention reservoir are considered (
Figure 1). These detention facilities aim to capture flood water from the main conduits and then drain it back when the peak flood period has passed to reduce the water level at control node F. When the water depth in conduit A is higher than the critical level, the flood water will flow over weir B to storage unit C and is temporarily impounded there until it is drained to the main conduit E by pumping station D.
The pumps in the detention reservoir work until the storage unit is empty and without switches, which is related to the maintenance cost [
20]. Since detention reservoirs are normally dry and only used in flooding situations, the pump stations in urban drainage systems often work only a few hours during storm events [
14]. Therefore, the energy cost is negligible compared to damages from inundation. Considering the flooding risk in the detention area, the aim of the pump station in this case is to minimize flood damage downstream while avoiding flooding at the detention area.
In the pump station, there are several pump units and each of them has its own working level. The operation of a pump station is a combination of pump units in the ON/OFF status at set water levels [
16]. For side-weir detention basins, the design parameters include crest height, weir length, and opening height and are determined based on a defined frequency. In fact, similar to storage units, the existing weirs may not satisfy emergency flood scenarios and may cause flooding in the main conduits while the detention storage is not filled. This study, therefore, not only proposes an optimal pumping operation but also determines the optimal side-weir parameters to minimize flood damage in sewer systems and the detention area without changing the size of the storage unit.
We suppose that the pump station D includes
n pump units and each of them works at a certain water level associated with possible ranges of the front-pool depth of the detention reservoir. The depth of the detention reservoir C is discretized into
m increments ranging from zero to a maximum allowable depth (
HCmax). The search space for pumping includes
mn combinations. For a weir facility, we assume that the weir B exists with a defined length and height. To improve the draining ability of the weir, the optimal crest elevation
HB needs to be obtained. The possible height
HB ranges in
k discrete increments from zero to
, in which
DA is the diameter of conduit A, and
hB is the weir height (
Figure 1). The decision variables in this study are the depths at which the pump units turn on and the crest depth of the side-weir with the total size of the search space equaling
k × mn.
2.1. Problem Development
As discussed above, the purpose of the proposed optimization model is to search for the optimal pumping schedule and weir crest height to minimize flood damage downstream considering inundation risk in the detention area. In this case, the terminology “flood damage” can be represented by “maximum water depth” at downstream control node F on the main conduit E, at which deviation impacts of the pumping are negligible. The “inundation risk in detention” can be considered as the total flooded volume in this detention area. The objective function can be expressed as follows:
This is subject to:
where
H(t) is the water level at the downstream control point at time instant
t;
p is the penalty coefficient;
HCflood(t) is the flooding depth at storage unit C at time t;
VCflood(t) is the flooded volume at the storage node at time
t;
AreaC is the surface area of the storage unit C;
HCmax is the maximum allowable water level of the storage unit C;
Hp,i is the water depth at which pump unit
ith operates;
HB is the crest height of the weir B;
DA is the diameter of the conduit A upstream of the detention reservoir; and
hB is the height of the weir in the previous design. The parameters
H(t) and
VCflood(t) are calculated using the flood routing software EPA-SWMM 5.1 [
21].
The total inundated volume at the detention basin is represented by the second term in Equation (1), which is the total flooding depth at the detention reservoir during the flooding event. This term is calculated by Equation (2) and equals zero in the case of no flooding in the detention area. The operating depths of the pump units
Hp,i can be taken as discrete values between zero and the maximum depth in the detention storage area. The range of crest height
HB is bounded by the size of upstream conduit
DA and the opening height of the weir
hB as represented in
Figure 1.
2.2. Optimization Technique
The optimization problem is solved by an improved version of the particle swarm optimization algorithm (PSO) called the extraordinary particle swarm optimization algorithm (EPSO). PSO is a well-known population-based meta-heuristic algorithm that is widely applied in different engineering fields. The algorithm mimics the behavior of animal flocking, such as with fish or birds [
22]. The individuals in the PSO are particles that fly through the search space following the current best individuals. The EPSO is a newly improved version of PSO that shows promise for engineering optimization problems [
23]. The particles in the EPSO algorithm move toward their determined targets instead following the best particles, i.e., global best and personal best. The targets can be a personal best, a global best, or even the worst. The location of particles is updated by using two user-defined parameters, including a combined coefficient
C0 and a target potential range coefficient α. The upper bound of the target range,
Tup = round (α
× Npop), is introduced to control the range of the target solution. If the target of particle
ith belongs to the target range, the particle will be guided to its corresponding target; otherwise, a random search method is applied. The main steps of the EPSO are as follows:
Step 1: Setting initial parameters. In the EPSO, there are two user-defined parameters: the combined coefficient C0 ranging from zero to two, and α, a value indicating the upper bound of a potential target in an entire population, ranging from zero to one.
Step 2: Initializing the swarm population. Particles are randomly generated between the lower and upper bounds of a given problem. The particle jth at iteration t is represented by position , where N is the dimension of the search space.
Step 3: Sorting particles based on their cost/fitness.
Step 4: Selecting the target. A target is selected for each particle at each iteration among all particles using the determined index (
T) of particles.
where
Npop is the population size and rand is the uniform distributed random number [0,1]. The index of target (
T) ranges from zero to
Npop.
Step 5: Updating particles to their new locations using the following equation:
where
LB and
UB are the lower and upper bounds of the search space, respectively.
Step 6: Checking the stopping criterion. If the stopping condition is met, stop. Otherwise, return to Step 3.
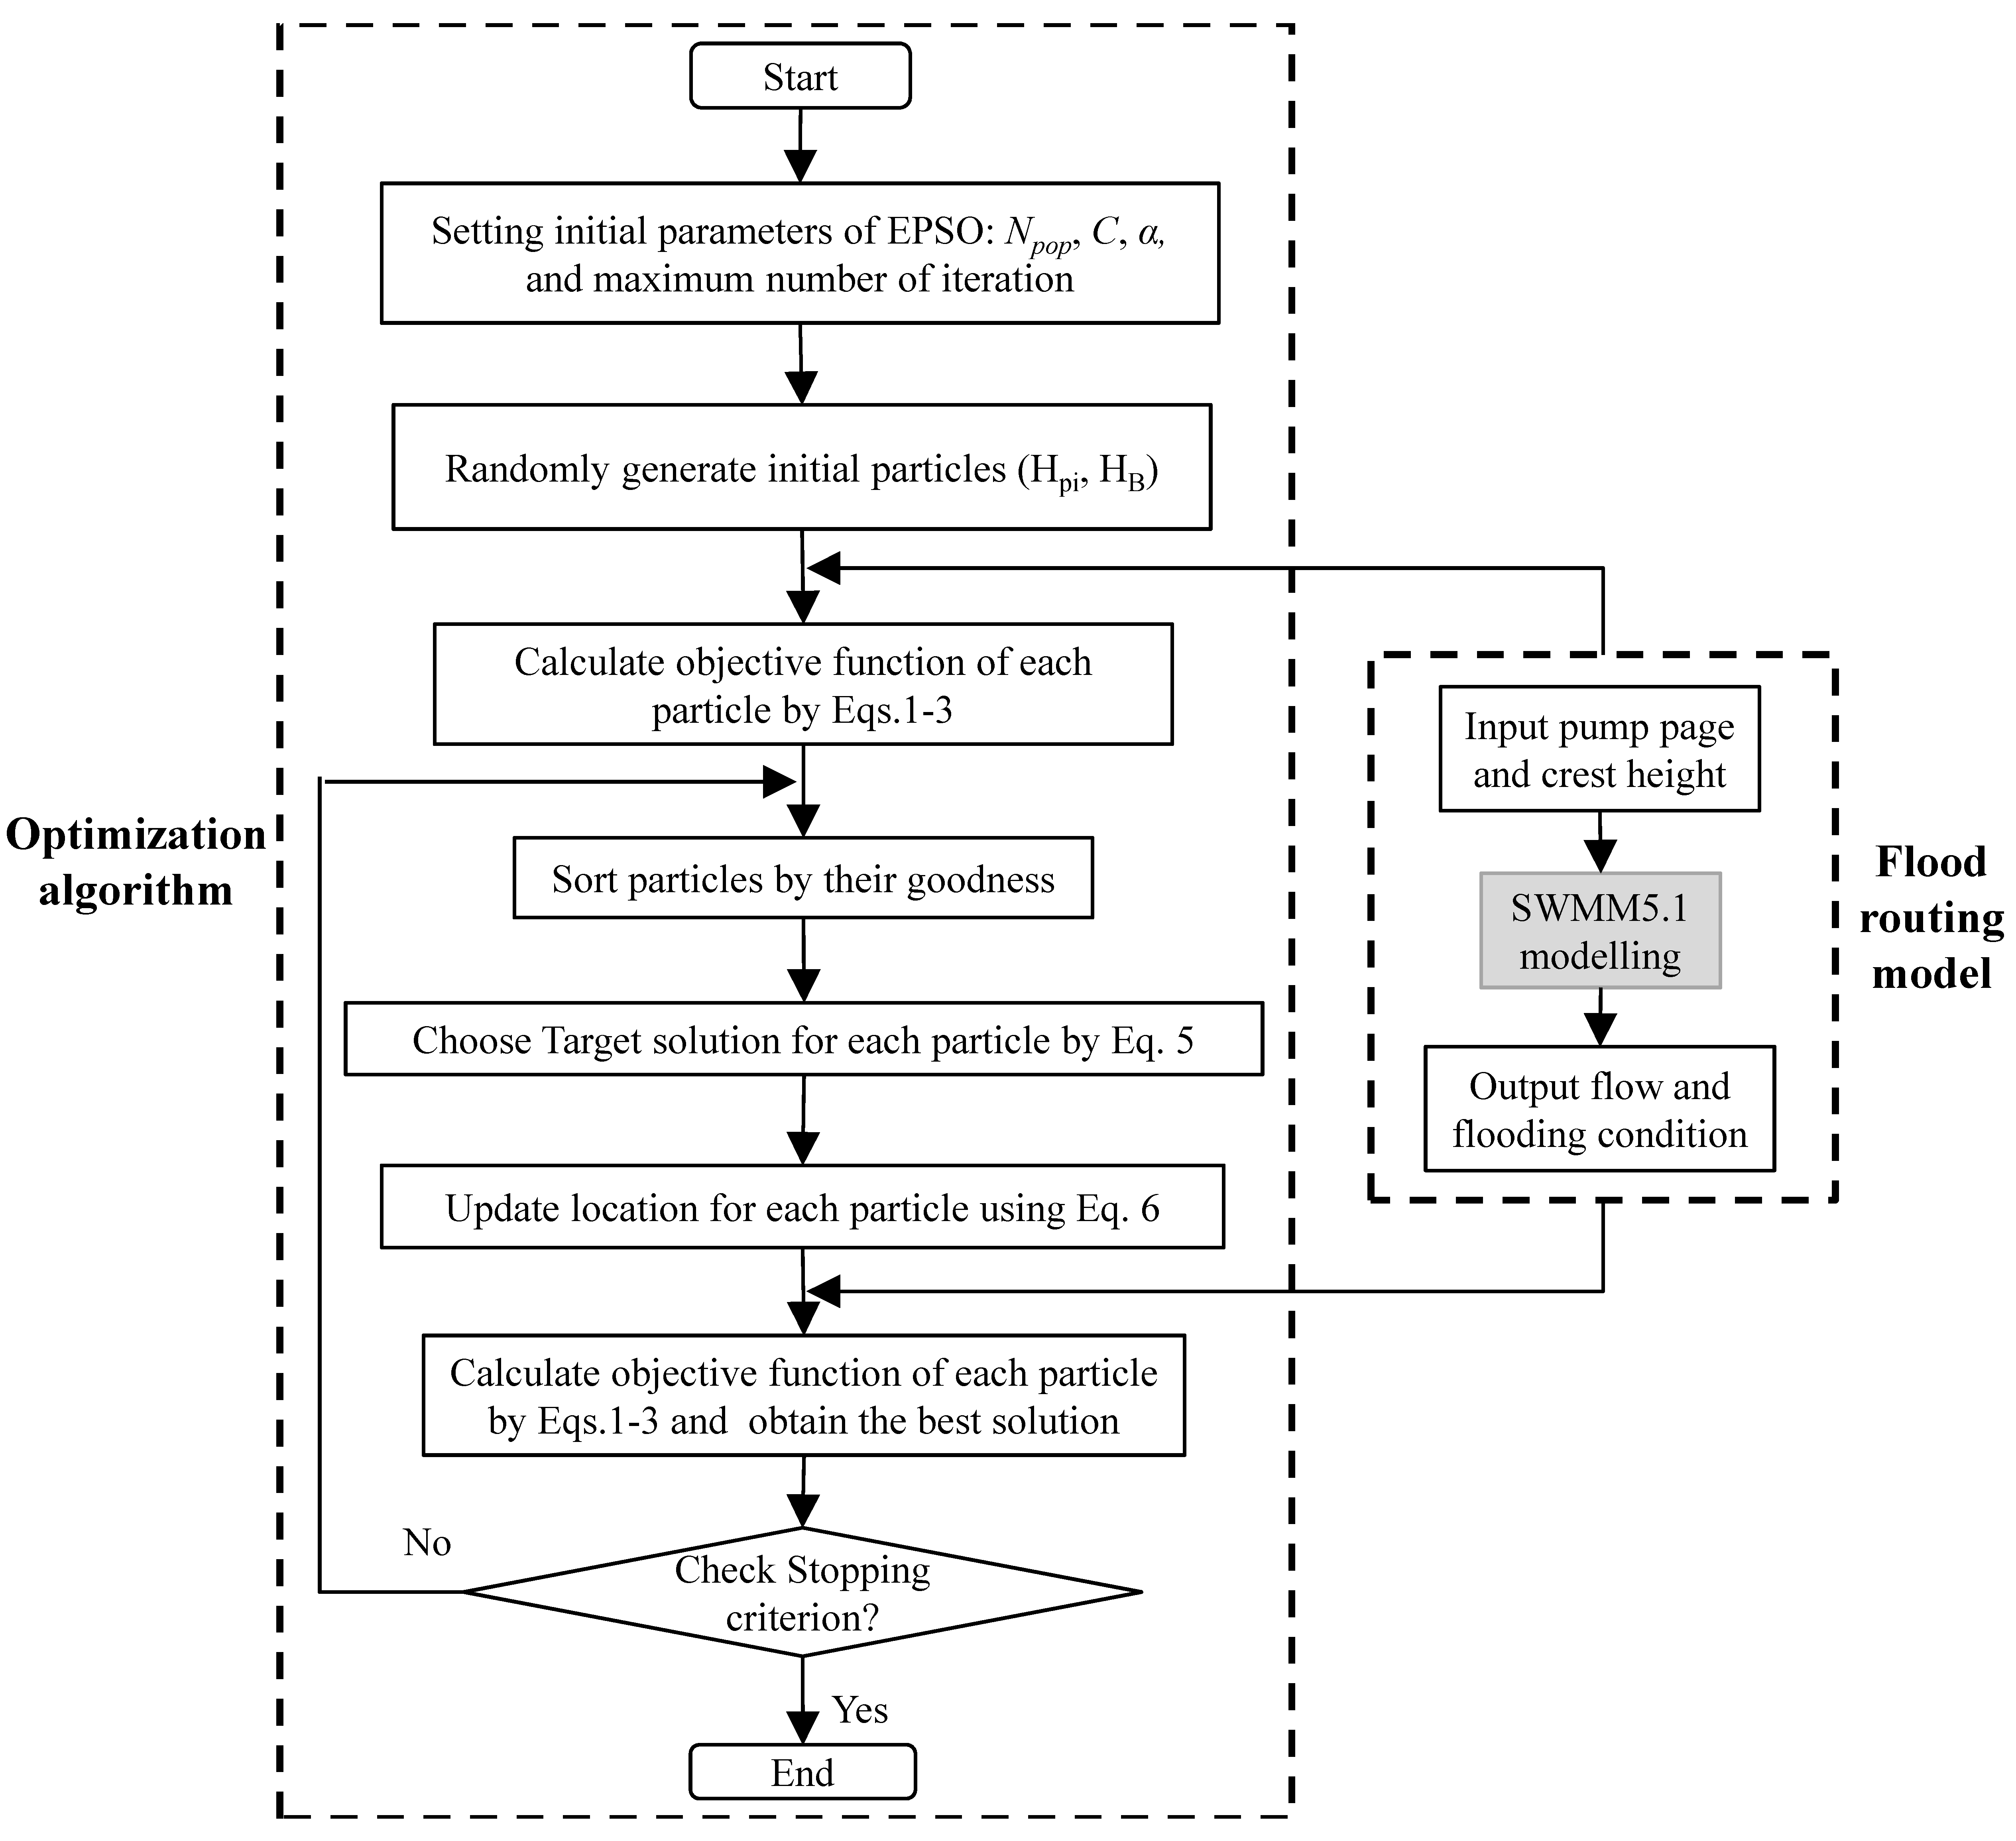
In this study, the EPSO is coupled with a flood routing simulation model called the Storm Water Management Model (EPA-SWMM 5.1) to obtain the optimal pumping schedule and the crest depth in order to minimize the maximum water level at the control location downstream. The decision variables obtained in the optimization model include the working depths of
n pump units
(Hpi)n and the weir crest height
HB. These will be used to generate pump curves and the parameters of the weir that will be input into the flood routing model, SWMM. The detailed procedure is described in the following flowchart (
Figure 2).
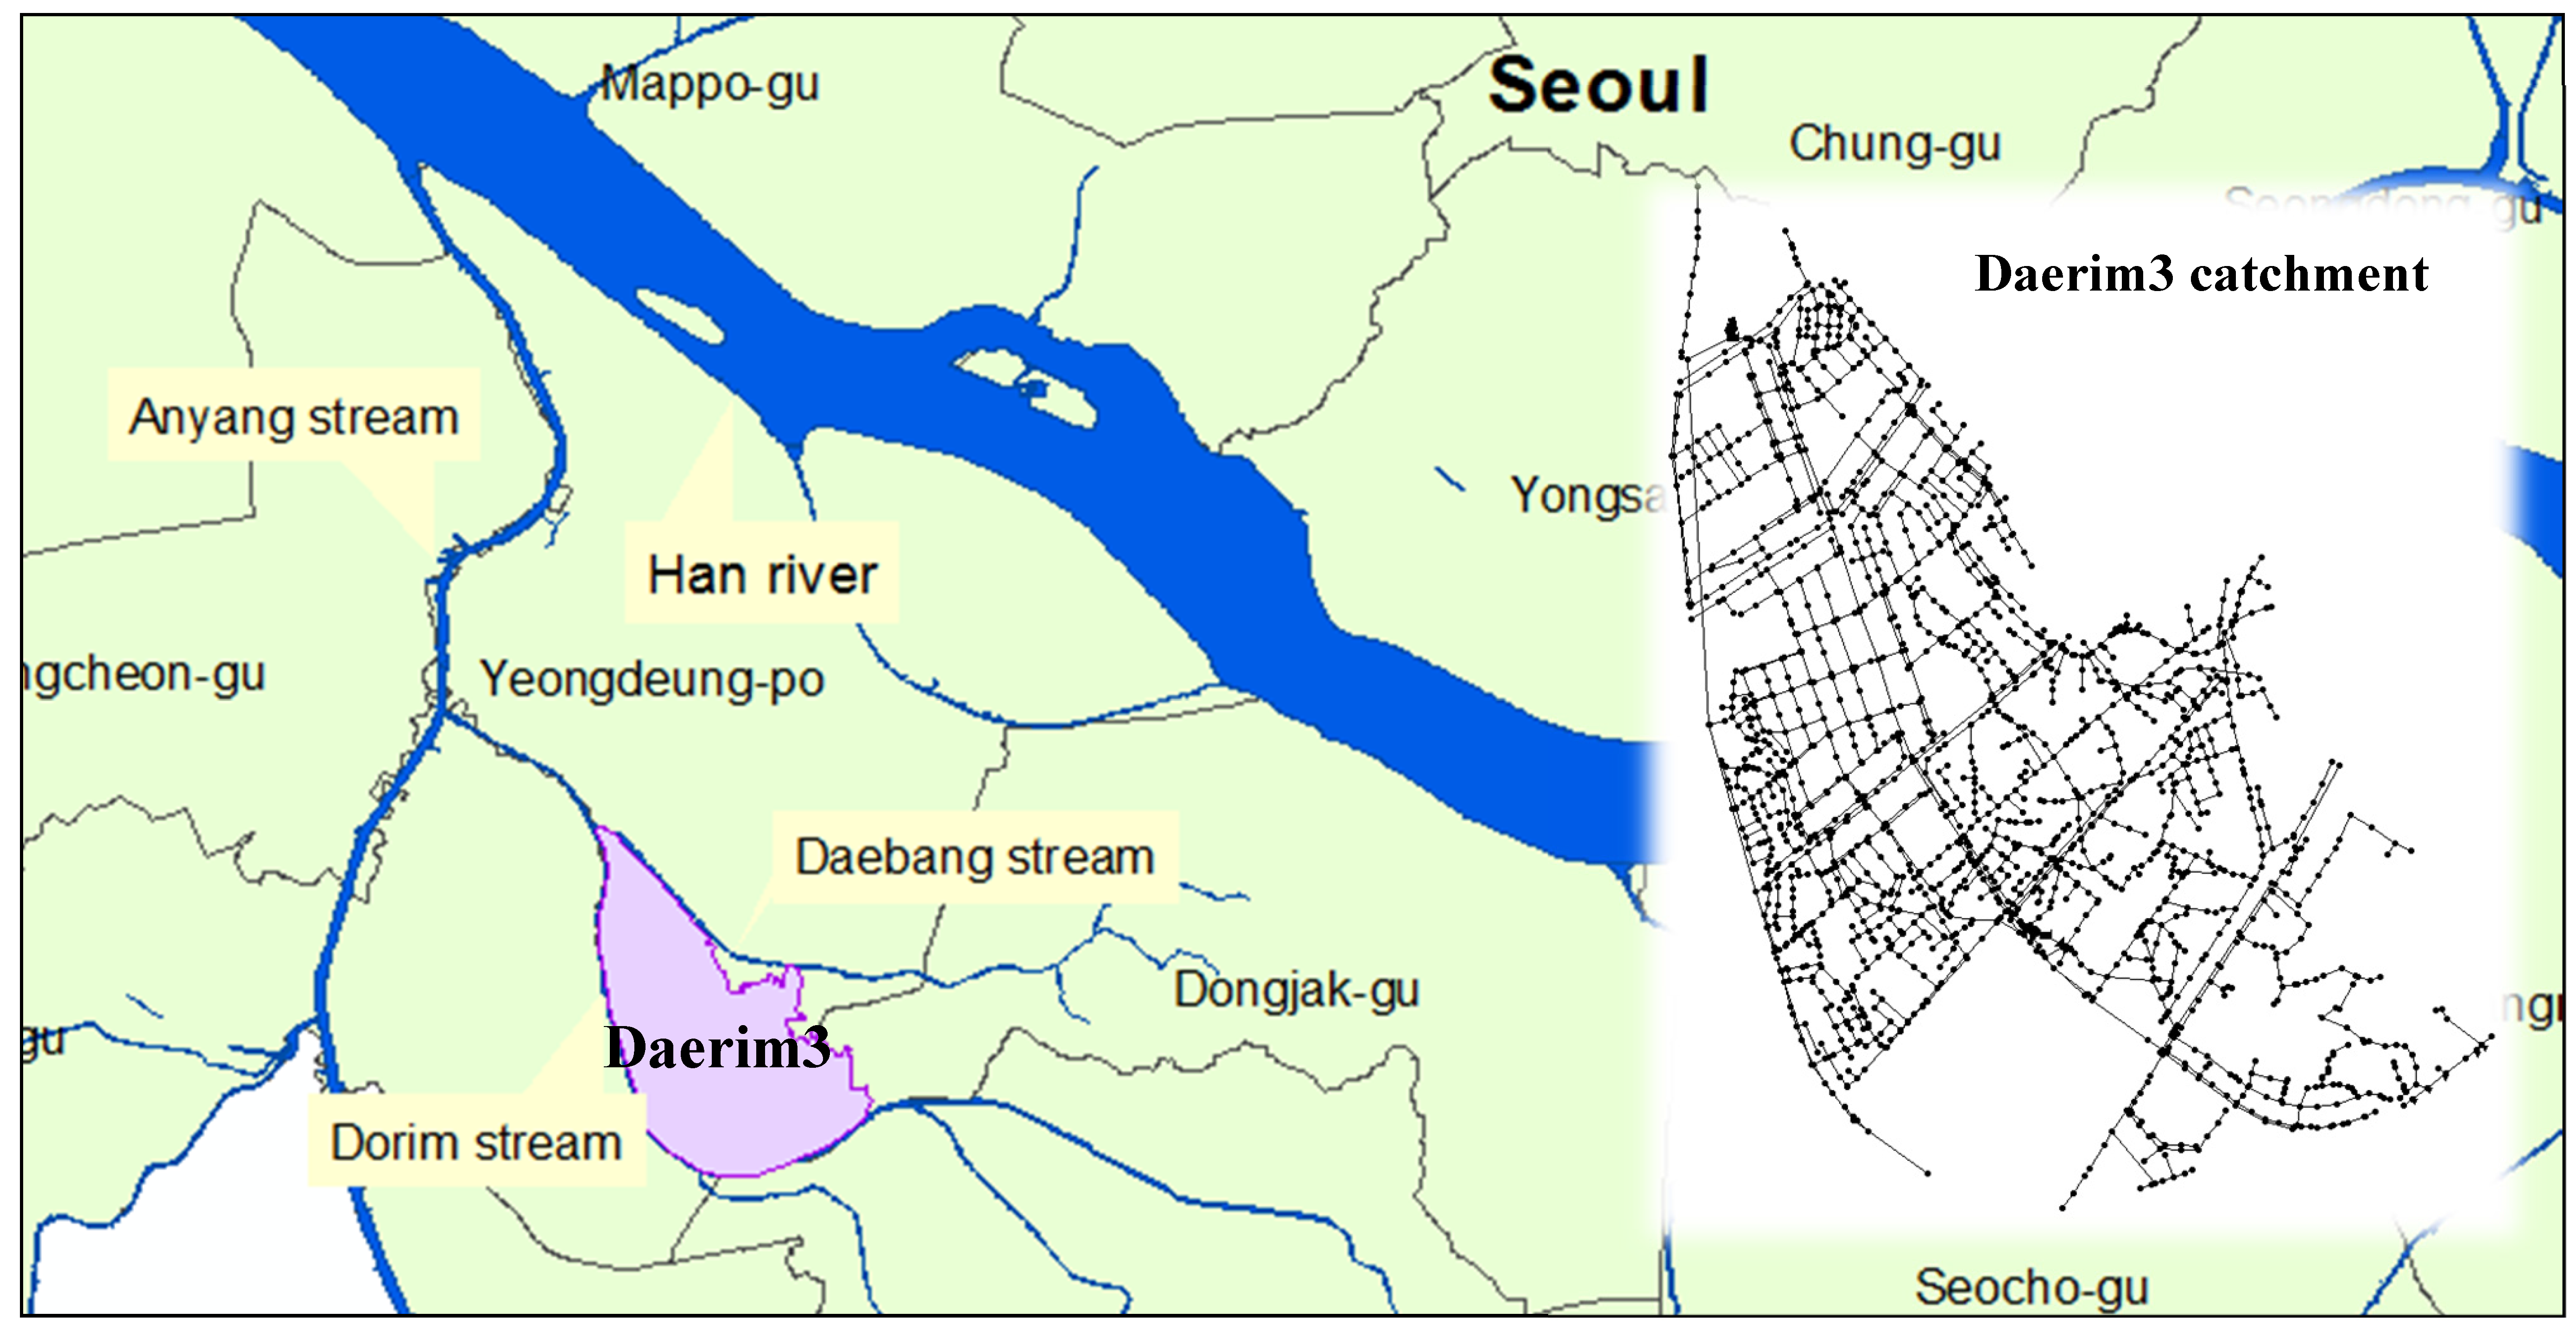
3. Study Area
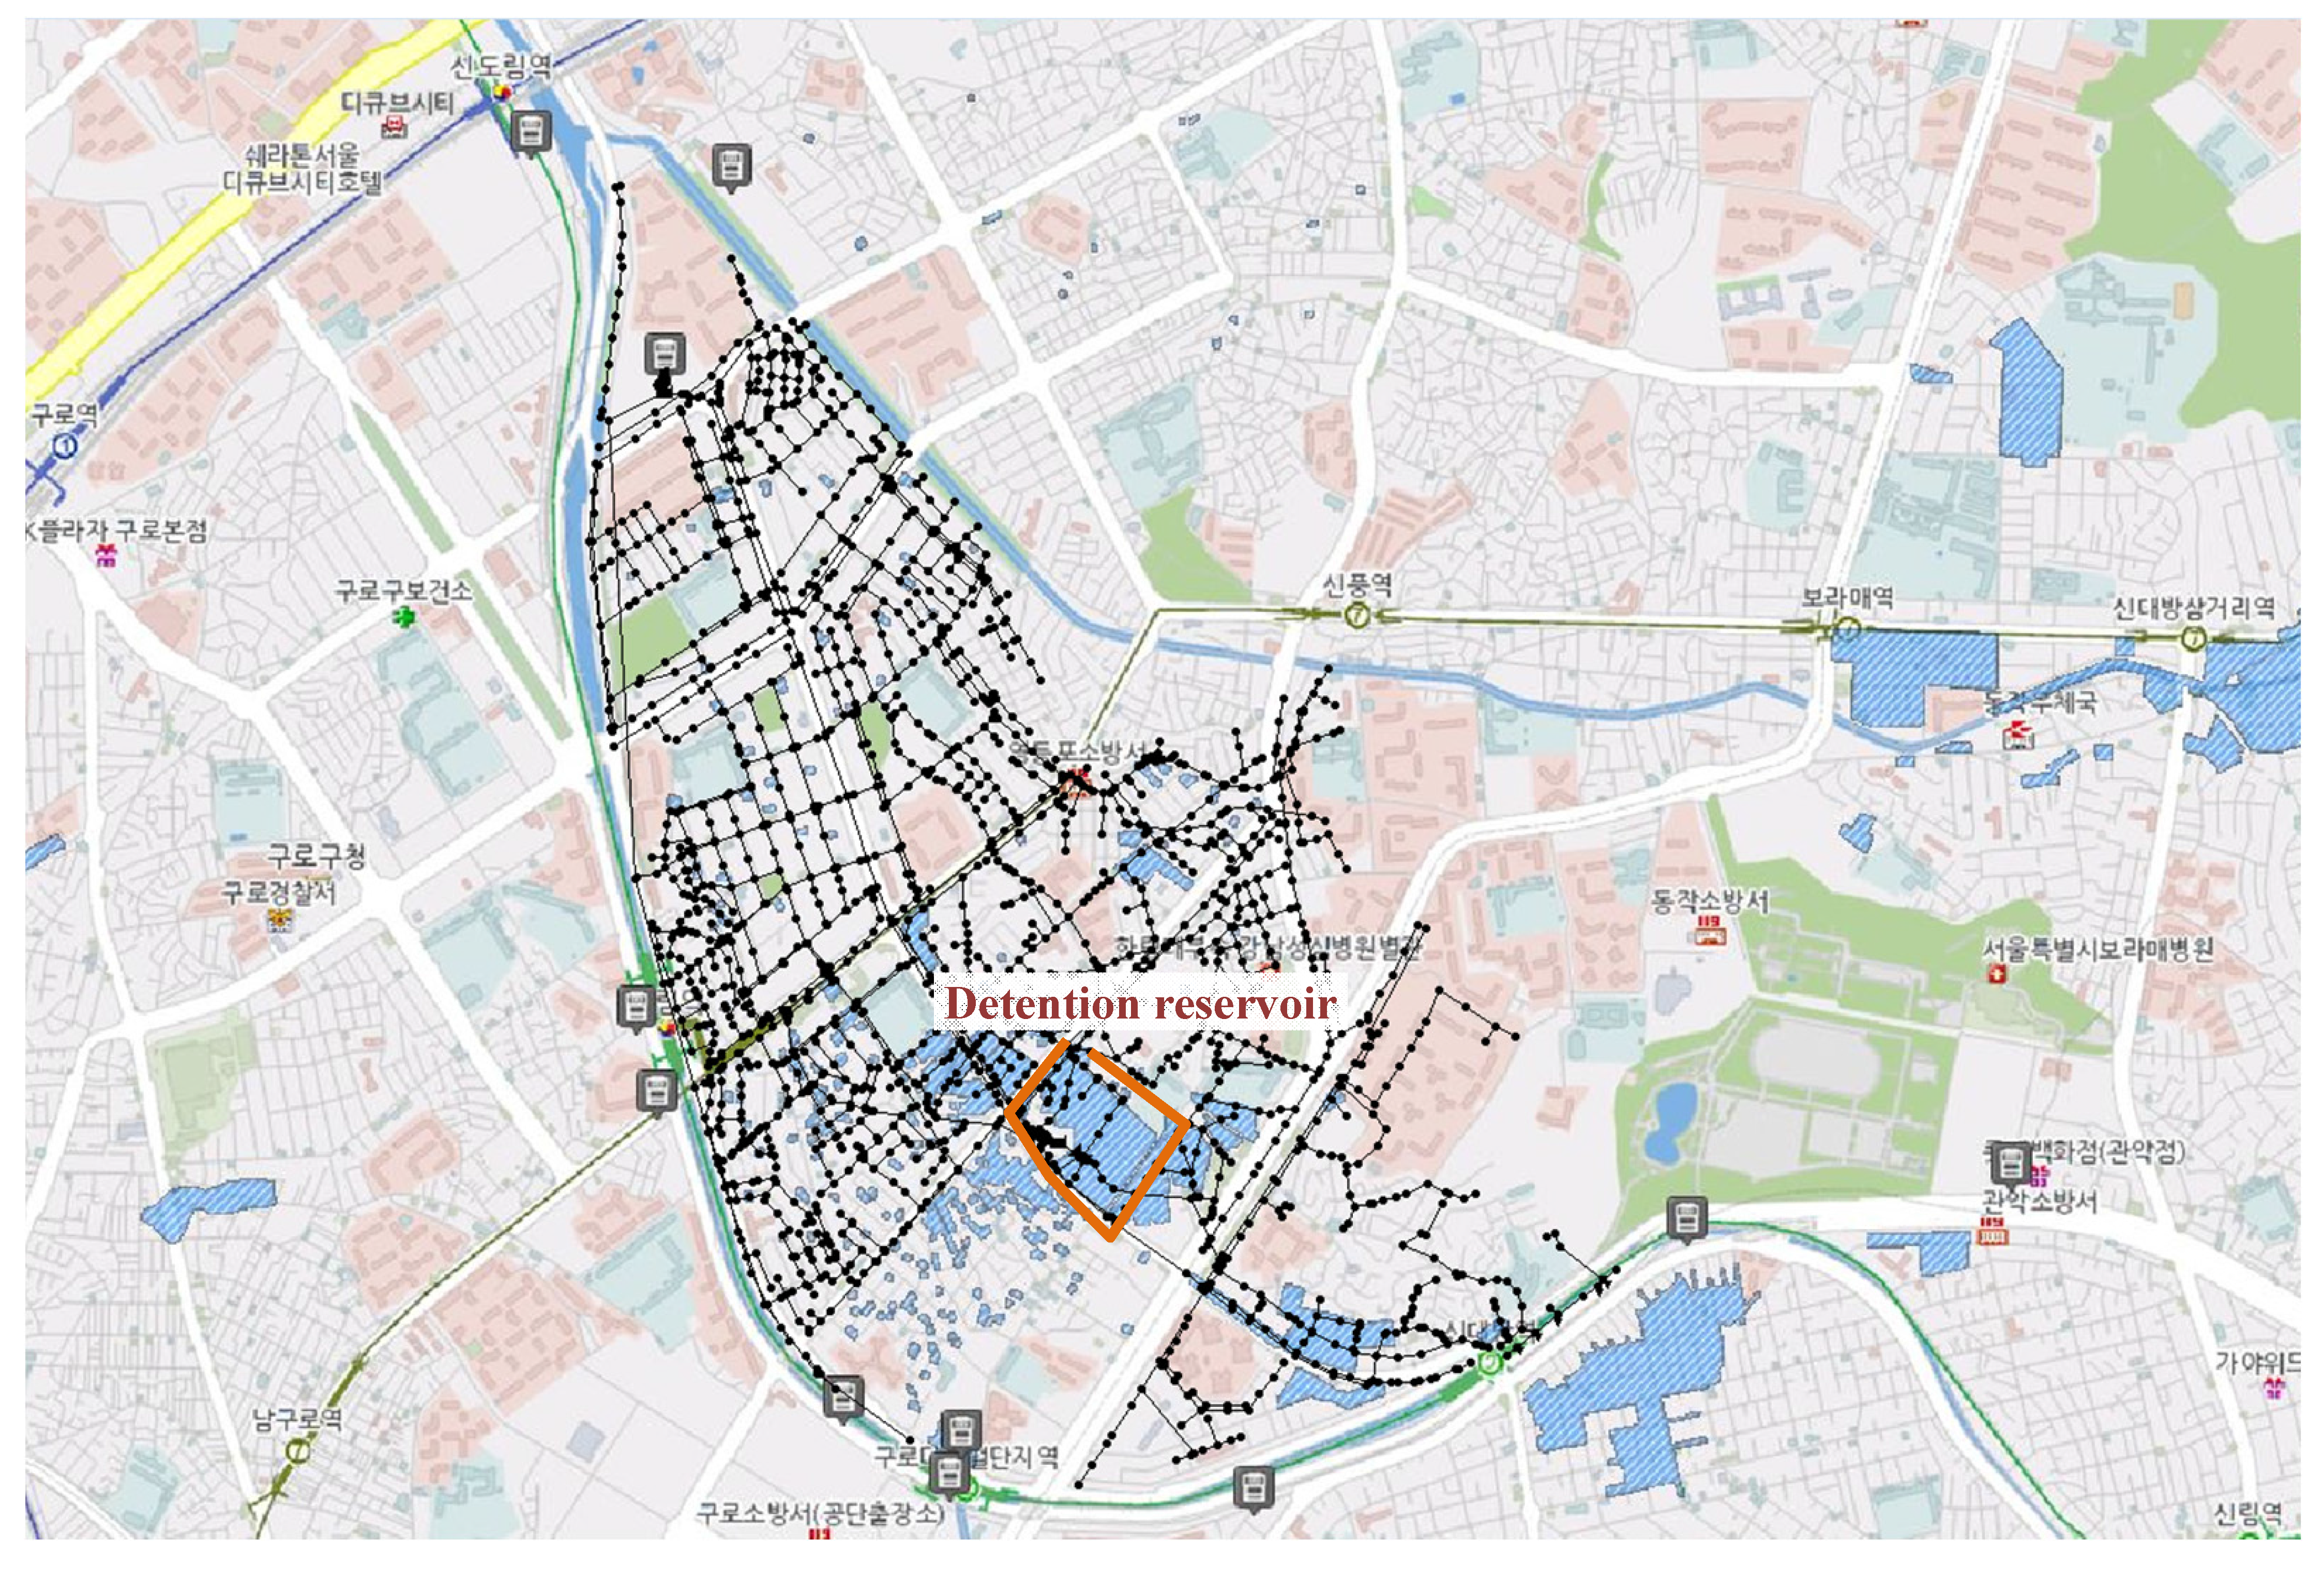
The study area is an urban drainage system located in the Dorim stream watershed, Daerim3. The Dorim stream is one of the branches of the Han River that flows through Seoul, the capital of South Korea (
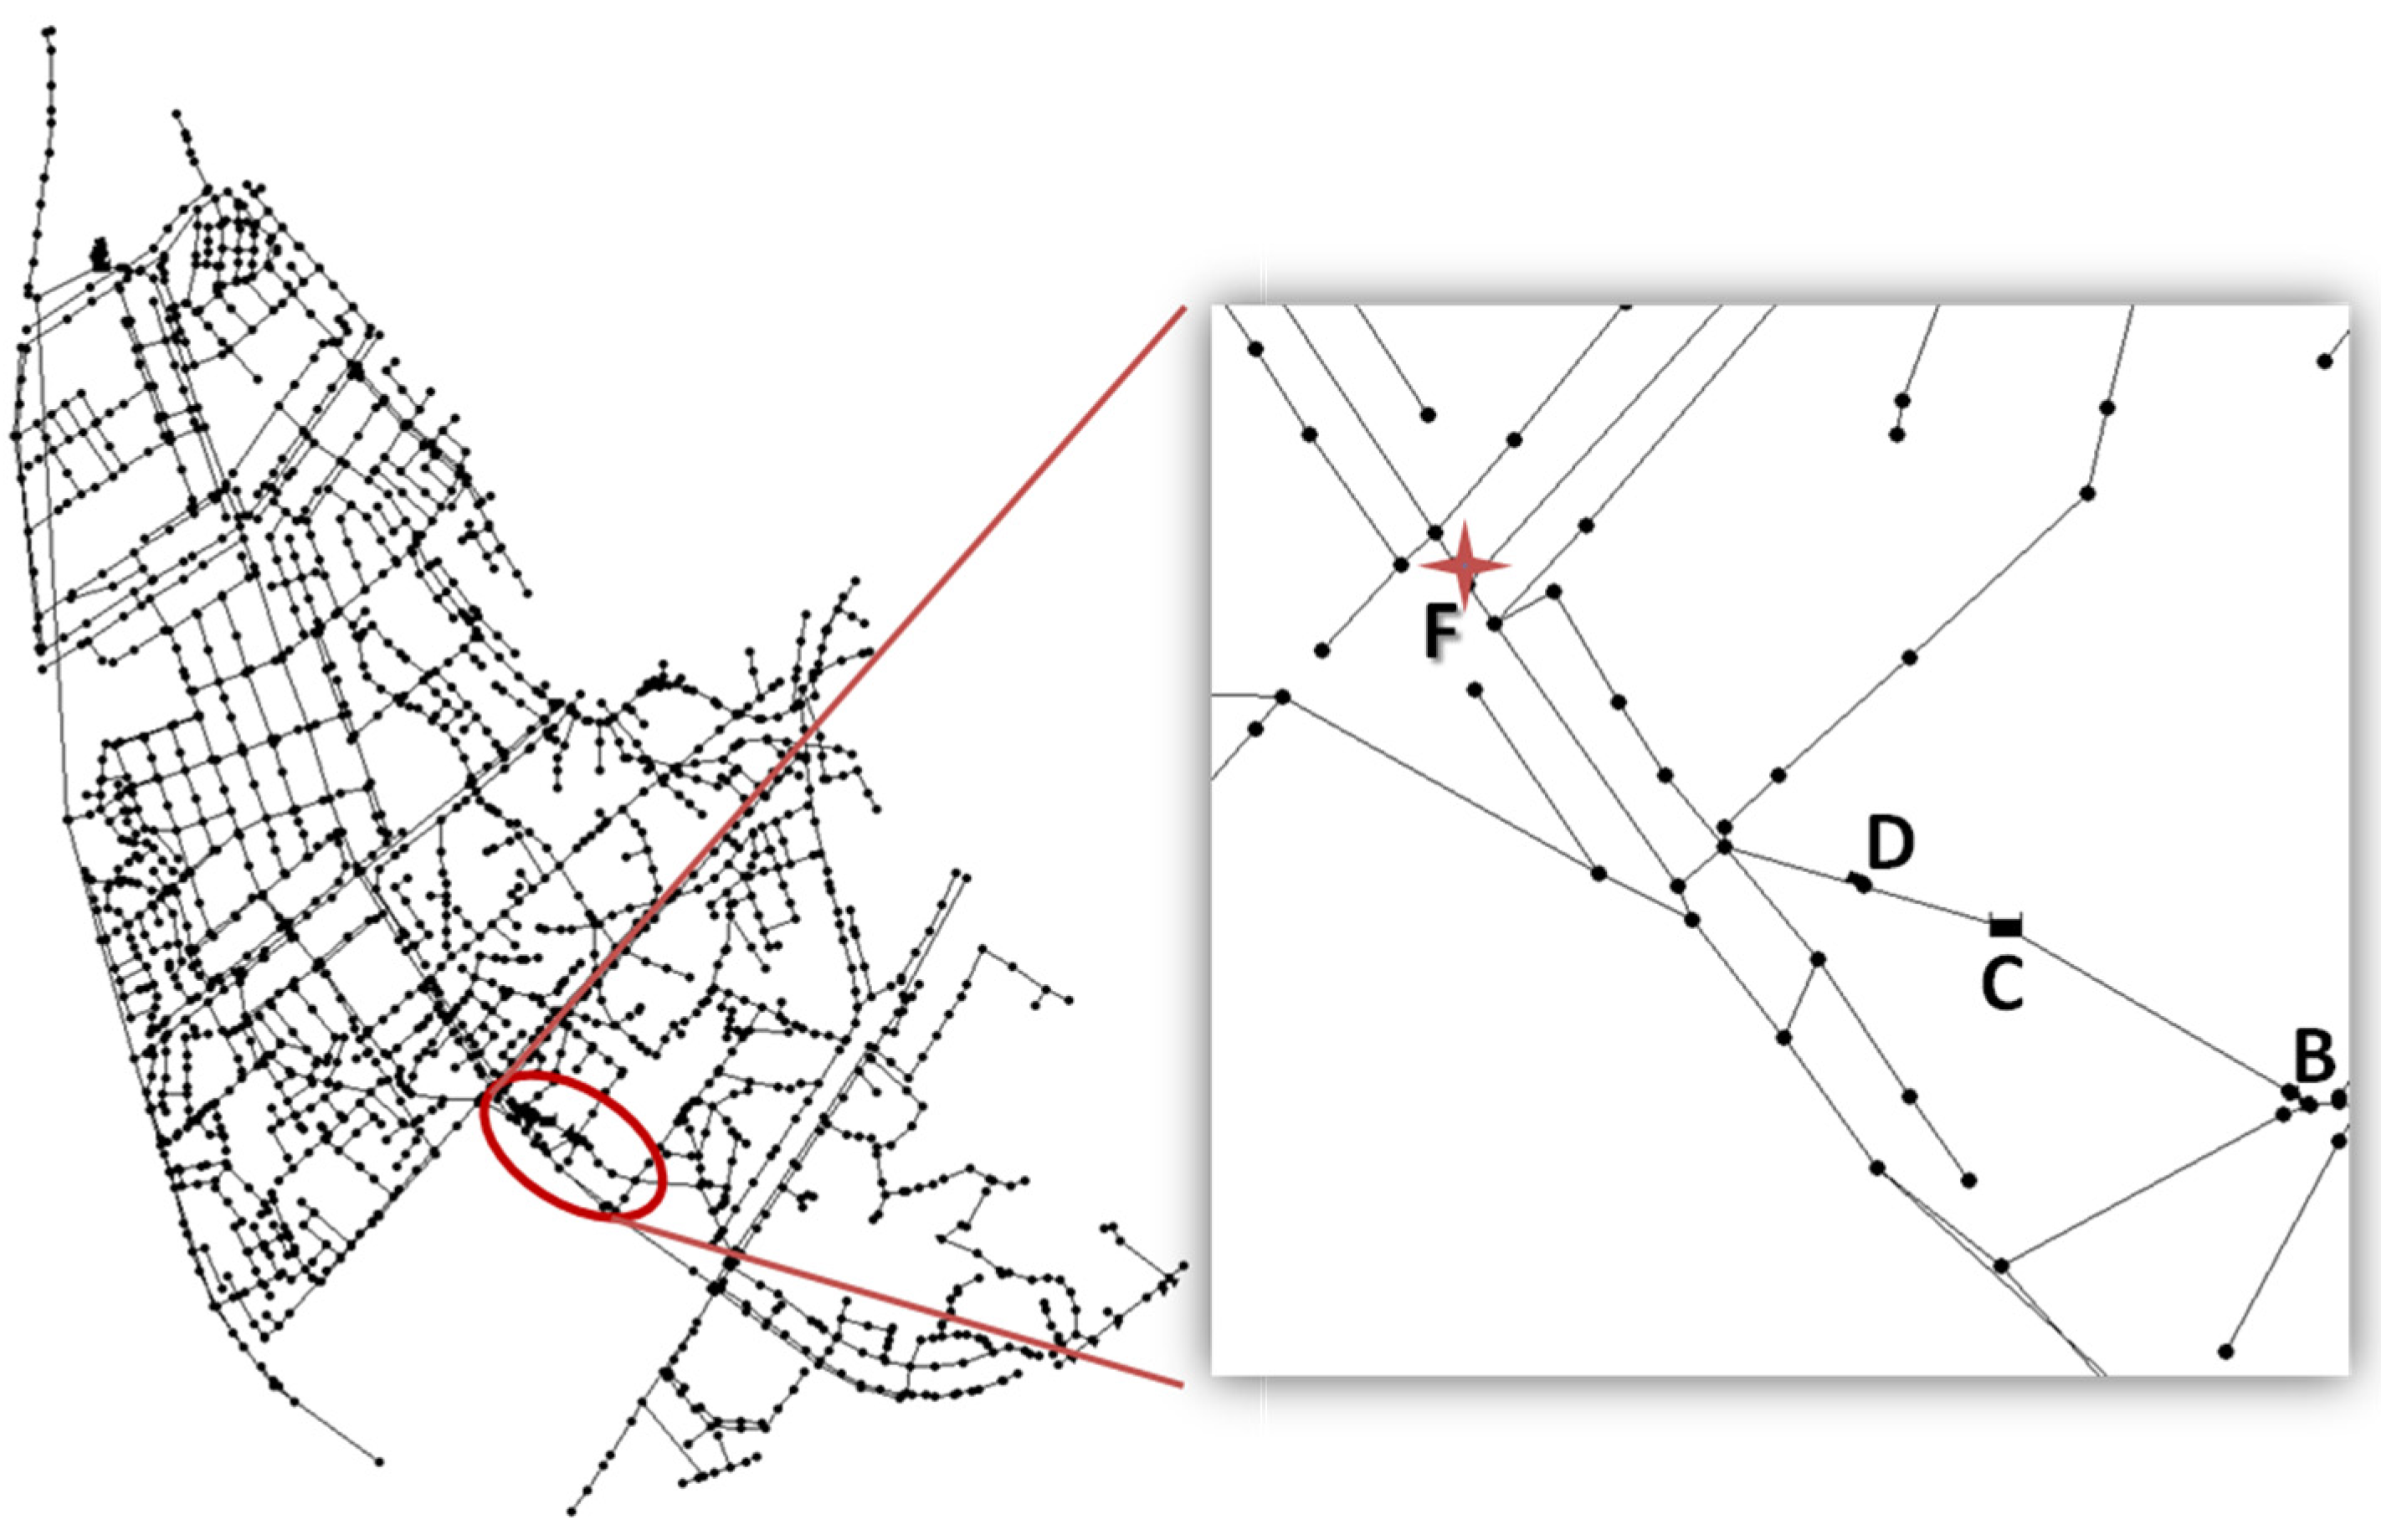
Figure 3). The drainage network occupies an area of 248.5 ha with 1977 pipes and 1576 subcatchments. The area used to suffer inundation in the rainy season due to insufficient conveyance by the conduit system. In 2009, a detention reservoir was built upstream of the network to temporarily impound flood water and then slowly drain the water into the main sewer network. The detention reservoir consists of a storage unit with a total capacity of 2447 m
3, a side-weir inlet and a pipe transferring flood water from the main conduit to the storage unit, and a pump station that releases water to the main conduit at a rate of 9 m
3/min per pump unit (
Figure 4 and
Table 1). In flood events, when the water level in the upstream conduit is higher than the crest height of weir B, flood water will flow into storage unit C. Currently, the pump station only operates when either the water level at storage unit C reaches 2.33 m or a rainfall event ends. It stops when the storage is empty. The weir and storage unit are designed according to five-year and 20-year return periods, respectively.
In 2010, a rainfall event on 21 September with a total rainfall of 259.5 mm caused flooding in the Daerim3 area, in particular in the area near the detention reservoir C (
Figure 5). The frequency estimations of this rainfall event corresponding to the Huff method [
24], the practical method applied in Seoul, are different for various rainfall durations. The return period estimated for a 60 min duration is around 20 years, but those of 90 min and 120 min durations are 50 and 120 years, respectively. In Korea, short rainfall durations, less than or equal to an hour, are normally applied for the design of urban drainage system facilities [
25]. Even though the detention storage was designed for 20 year storms, during this storm event, the capacity of the detention reservoir was exceeded, causing flooding in the area of the detention reservoir. The optimal operating conditions and design of detention reservoir facilities are necessary to mitigate flood damage in the neighboring area. Because of the limitation of the area in the urban catchment, the crest height of the weir and the pumping schedule are considered as decision variables in this study. As discussed in
Section 2, the aim of the optimization model is minimizing the maximum flood water depth at a controlled downstream node known as point F in
Figure 4 while considering the flood risk in the detention area. This controlled node F is located on the main conduit at which the peak water level is stable during the pumping period from the detention reservoir. Flooding at this node may cause significant damage to roads and commercial buildings.
The storage maximum depth (
HCmax = 3.2 m) is discretized into 0.1 m levels to assign the operation of two pump units. For the side-weir, the crest height is determined based on 0.1 m increments ranging from zero to 1.1 m (i.e.,
). The size of the total search space in this case study is 12 × 32
2 = 12,288 combinations. This total number of combinations coupled with the flood routing model will cause cumbersome computational efforts to seek the best design and schedule of detention reservoir facilities. Therefore, EPSO is applied to find the optimal pumping schedule and weir crest height, significantly reducing the time required. The SWMM model, after calibration, is coupled with EPSO to obtain the optimal solution. The 10 min time series of the rainfall event in September 2010 is used as a typical storm with various return periods for different rainfall durations for this optimization model following the scheme shown in
Figure 2.
4. Results and Discussion
4.1. Optimization of Pump Operation
The typical flood event of September 2010 is modeled by SWMM version 5.1 to simulate the flooding situation in the study area. For the current operation, the simulation time is around 260 s, and it consumes approximately 887 h to process a total of 12,288 combinations of crest height and pumping schedules. Using the proposed optimization model, 12 crest height cases were considered to find the optimal pumping schedule. The runtime of the optimization model coded in MATLAB with 500 function evaluations on an Intel Core i5 3.4 GHz system with 8 GB RAM was around 24 h for all 12 cases of side-weir crest height. The recommended parameters used to solve the constraint problem shown in Equations (1)–(3), including a penalty coefficient, a combined coefficient, and the potential range, are set as
p = 10
3,
C0 = 0.3, and α = 0.8, respectively, according to information in the literature [
23].
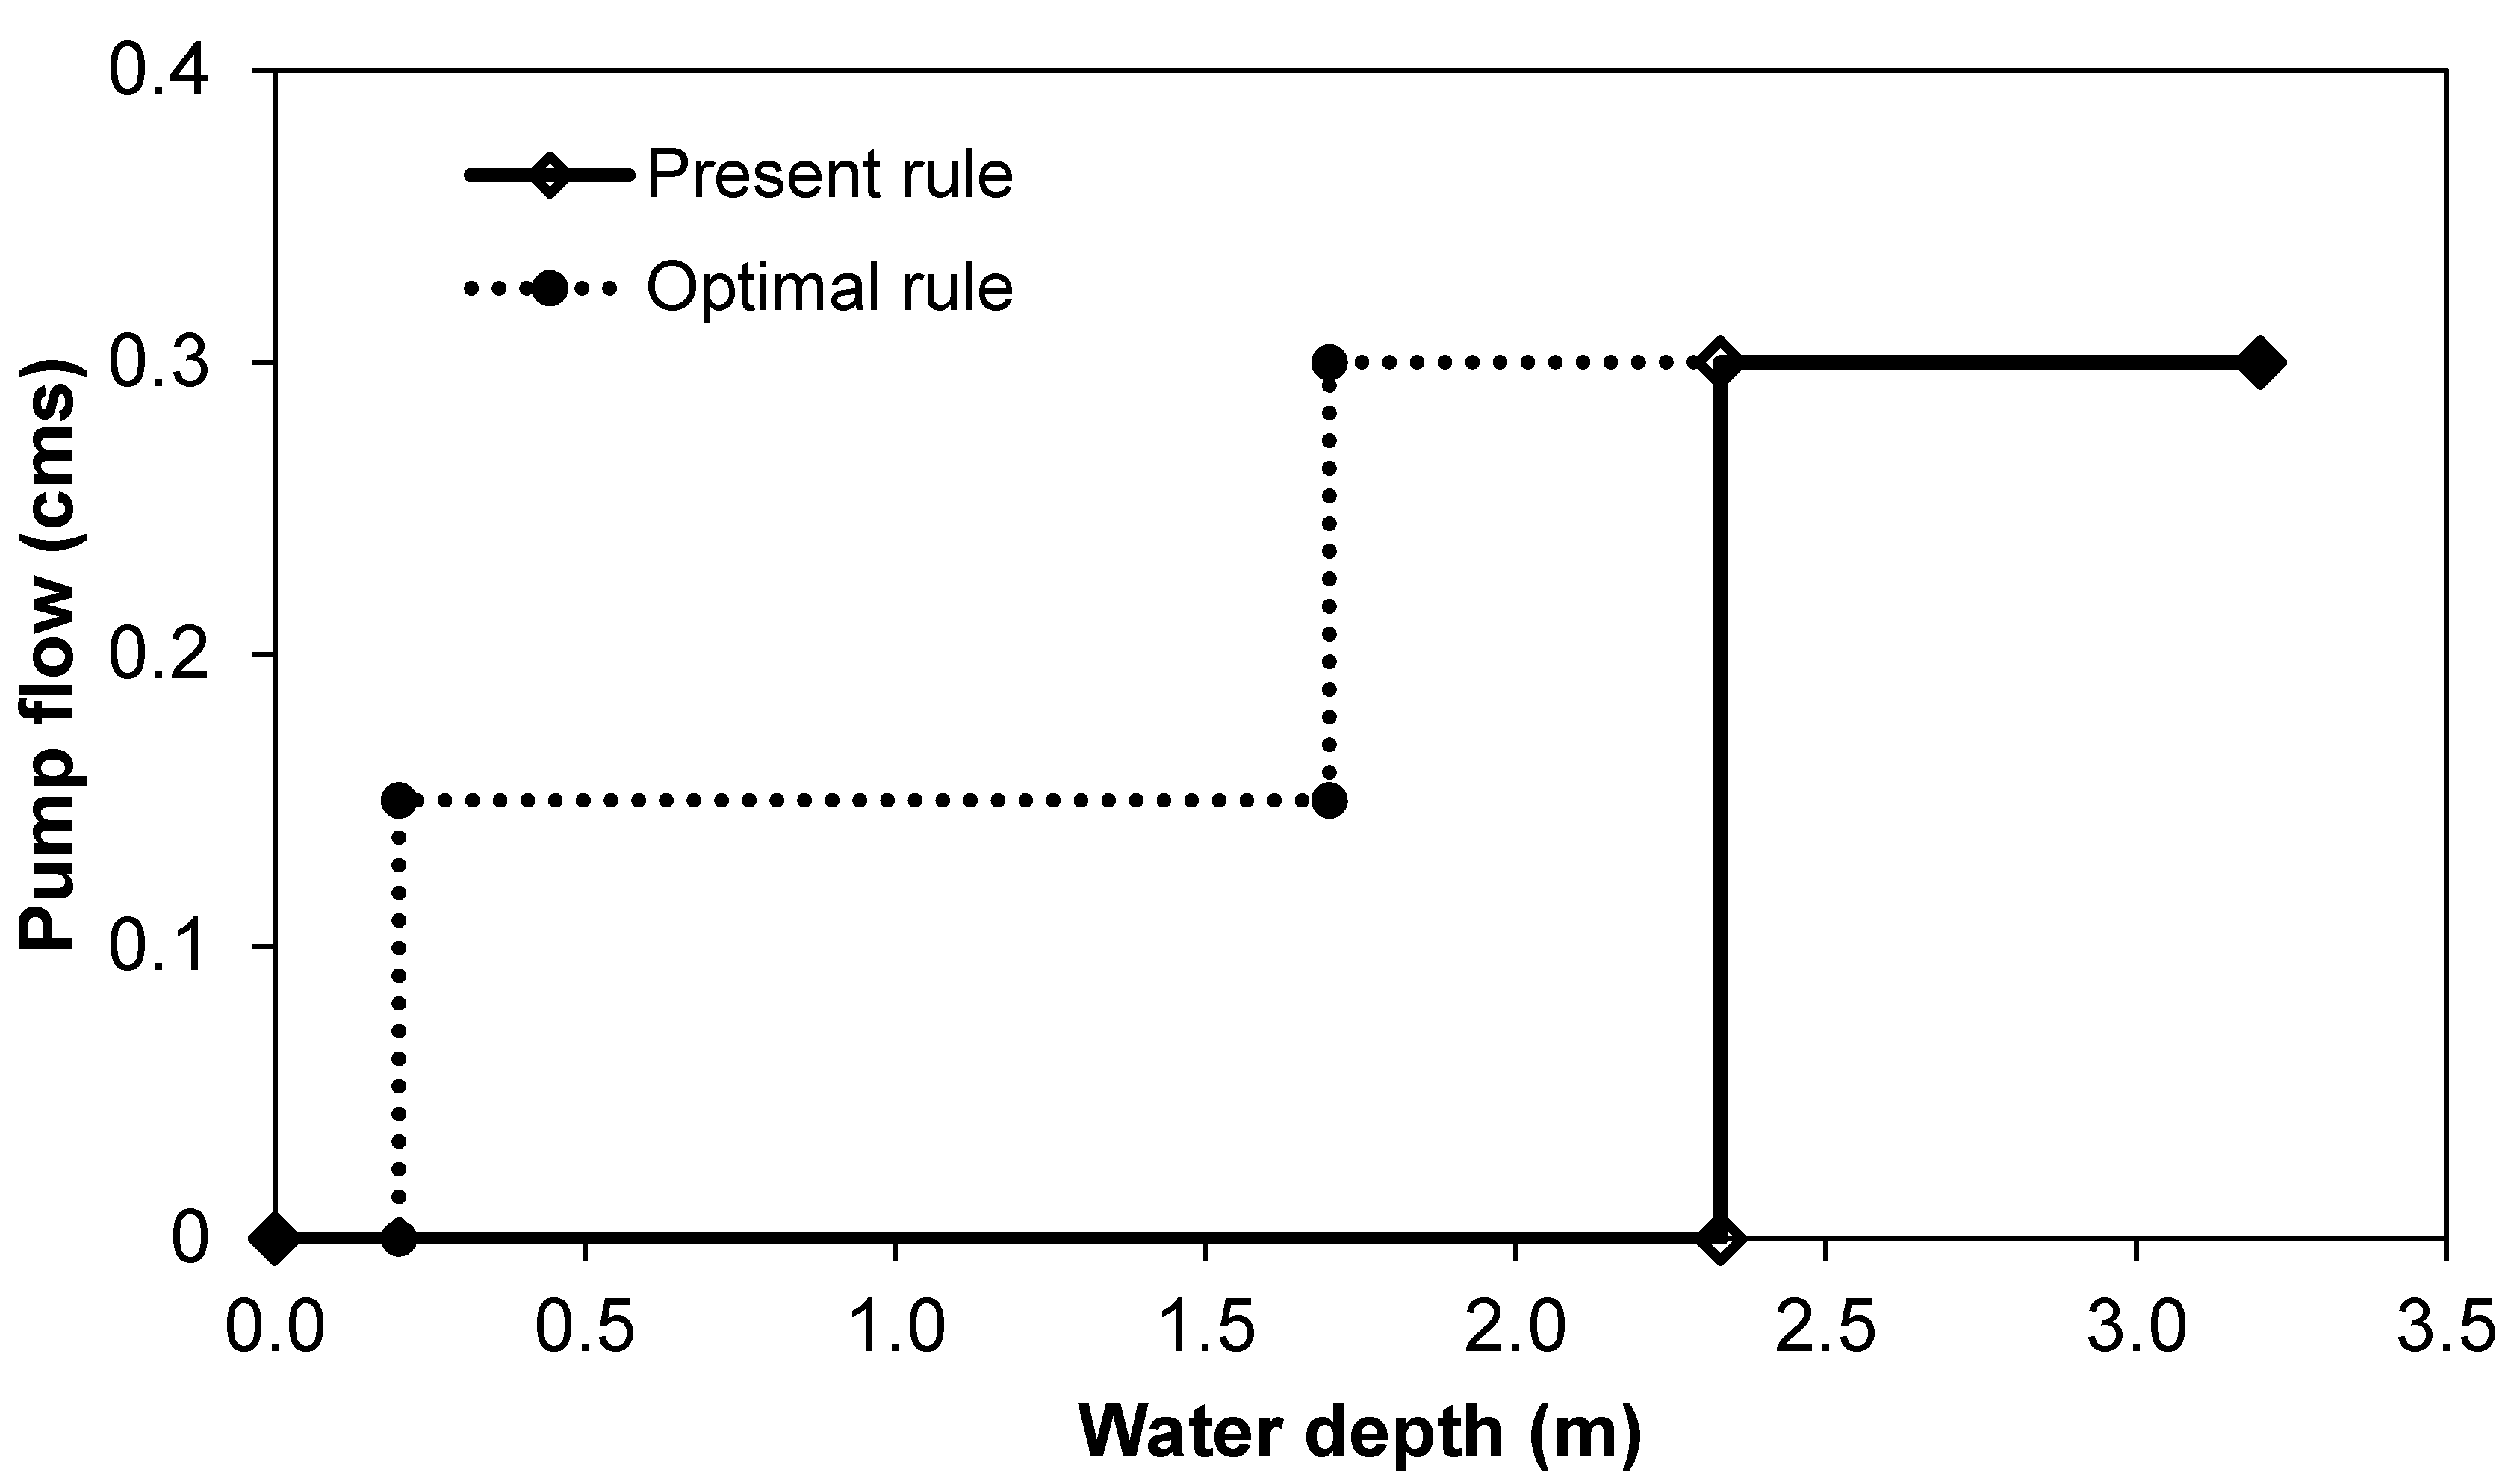
The optimal solution obtained from the optimization model is shown in
Table 2 and
Figure 6, in which the optimal crest height
HB is 0.4 m and the working depths of the pumps start at 0.2 m and 1.7 m for the first and second pump units, respectively.
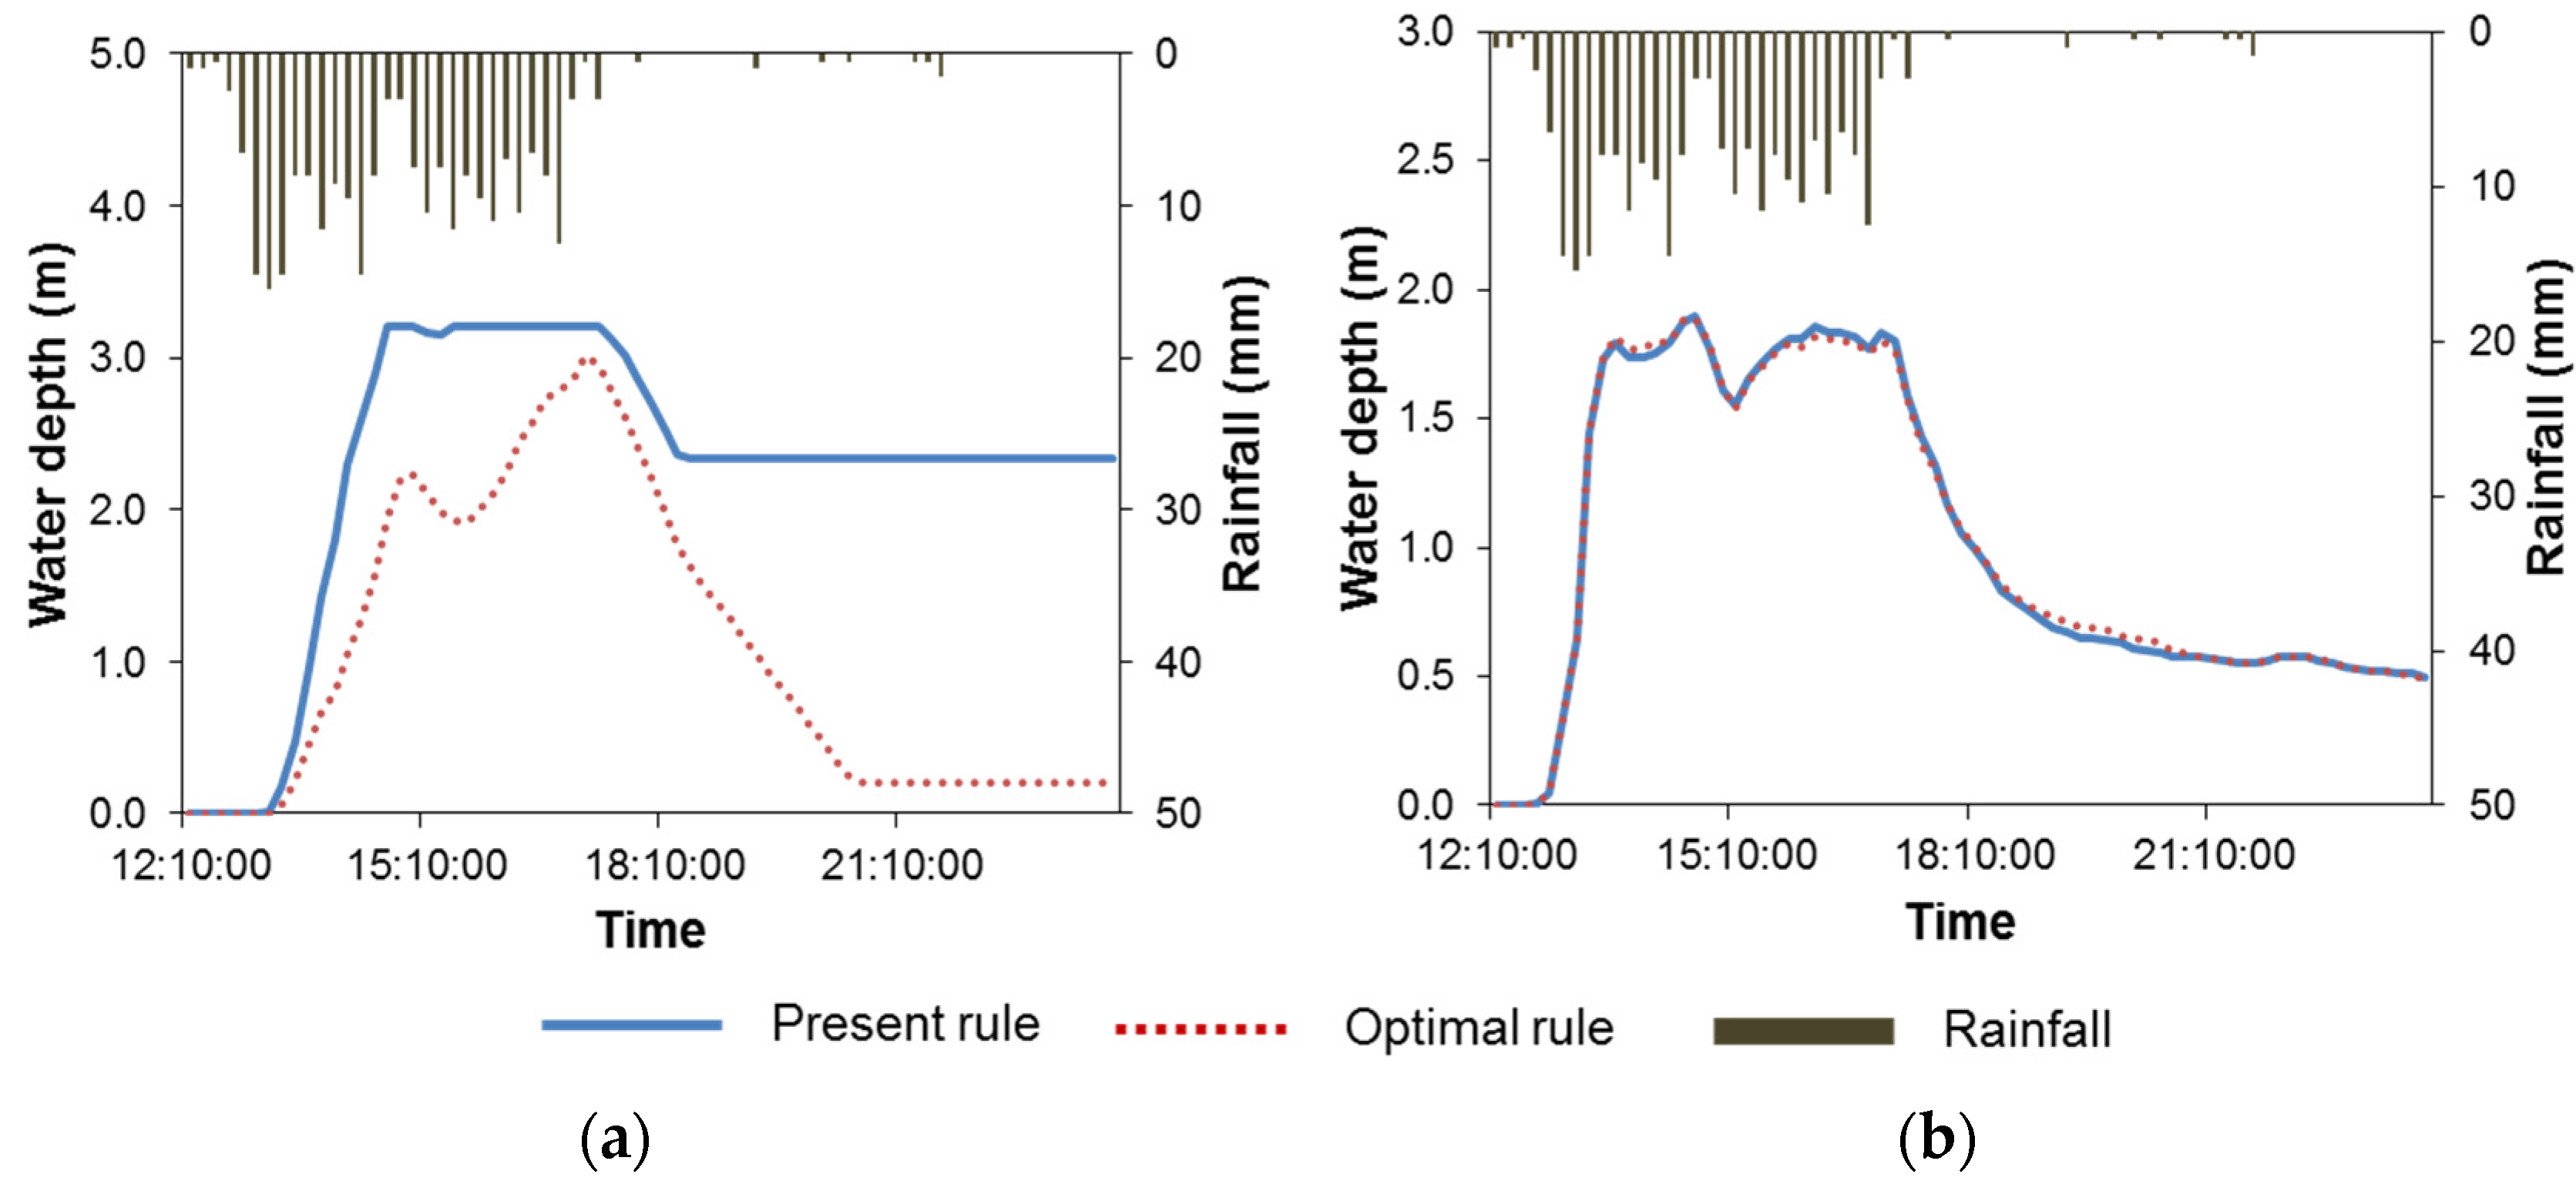
Figure 7 presents a comparison between two operating scenarios in term of water levels at the detention storage and the control node F in the flood event on 21–22 September 2010. In the current design and pumping strategy, the water depth at the detention storage unit exceeded the maximum level of the pond and caused extreme flooding for 150 min in this area. With the optimal operation rule and design obtained from the optimization model (
Figure 7a), the water depth in the detention pond is maintained lower than the allowable level, avoiding inundation in the neighboring area. In this case, the peak water depth in the detention pond is dramatically smaller than that in present case (a decrease of 0.19 m). For the control node in
Figure 7b, the water depth in the optimal strategy shows a decrease of 0.11 m compared to that of the current operation. The total flooded volume and the number of flooded nodes with optimal facilities were also remarkably reduced from 6.729 × 10
3 to 1.426 × 10
3 m
3 (79%) and from 18 to 16 nodes (11%), respectively (
Table 3).
Comparing the present and optimal scenarios, it can be seen that the present pump operation and weir crest height in the detention basin are inefficient at controlling flooding. The current low crest height of weir B drains flood water to detention reservoir C, while the high working levels of the pump station compounds this amount of water in the detention reservoir instead of releasing it to the main conduit E. This causes flooding in the detention area despite utilizing the whole detention volume while the main pipe is still able to convey more flood water. The functional efficiency of the detention facilities is improved under the optimal operation and design conditions. The higher crest height and lower starting level of the pump units help the pump station drain more water to the main conduits without increasing the water depth at the downstream control node. The storage volume of the detention reservoir C is also successfully utilized to reduce flooding in the neighboring area. Although only 95% of the storage volume of the detention reservoir (according to a water depth of 3.01 m) is used, flood damage is reduced in terms of the inundation in the detention area and the flood peak at the downstream control point.
4.2. Verification of Optimization Techniques
As mentioned in
Section 3, there are 12 × 32
2 = 12,288 combinations of potential operating conditions for the detention facilities in this study, which consumes 887 h (around 37 days) for the simulation. Due to this time, the simulation of all possible alternatives is regarded as an impractical approach. The optimization technique, namely EPSO, is used instead to determine the optimal detention basin facility parameters without the time challenge. It should be noted that the optimizer cannot guarantee finding the global optimum, especially in engineering problems. This section, therefore, verifies the efficiency of the proposed optimization method by comparing its result with that obtained from a straightforward approach.
All possible cases are evaluated using SWMM to find the global optimum. The simulated results, including the peak water depth at control node F and the total flooded depth at detention storage C, are used to calculate the objective function in Equation (1). The optimal solution is determined by finding the minimum objective function.
Table 4 illustrates the results obtained from the simulation of all alternatives.
The optimal conditions derived from the simulation of all possible combinations are weir crest height at 0.4 m and working depths for the first and second pumps at 0.2 and 1.7 m, respectively. This global optimum is equivalent to that obtained by the optimization technique. Therefore, the proposed method of integrating the optimizer with the simulation modeling is efficient in seeking the optimal detention facility conditions to minimize flood damage.
4.3. Performance of Optimal Pump Operation
To evaluate the efficiency of the optimal facility conditions, a recorded rainfall event and several designed rainfall scenarios are used to simulate the drainage system Daerim3 while the detention facilities are operated with the optimal conditions. It is noted that the optimal conditions increase the threshold for transferring flood water to the detention storage of weir B and reduce the starting level of pump station D. These conditions may raise the water depth at control node F if more flood water is drained to the main conduit E. The criteria consisting of the maximum water depth in the storage unit and control node, total flooded volume, and number of flooded nodes are considered to assess the performance of the new optimal operation conditions.
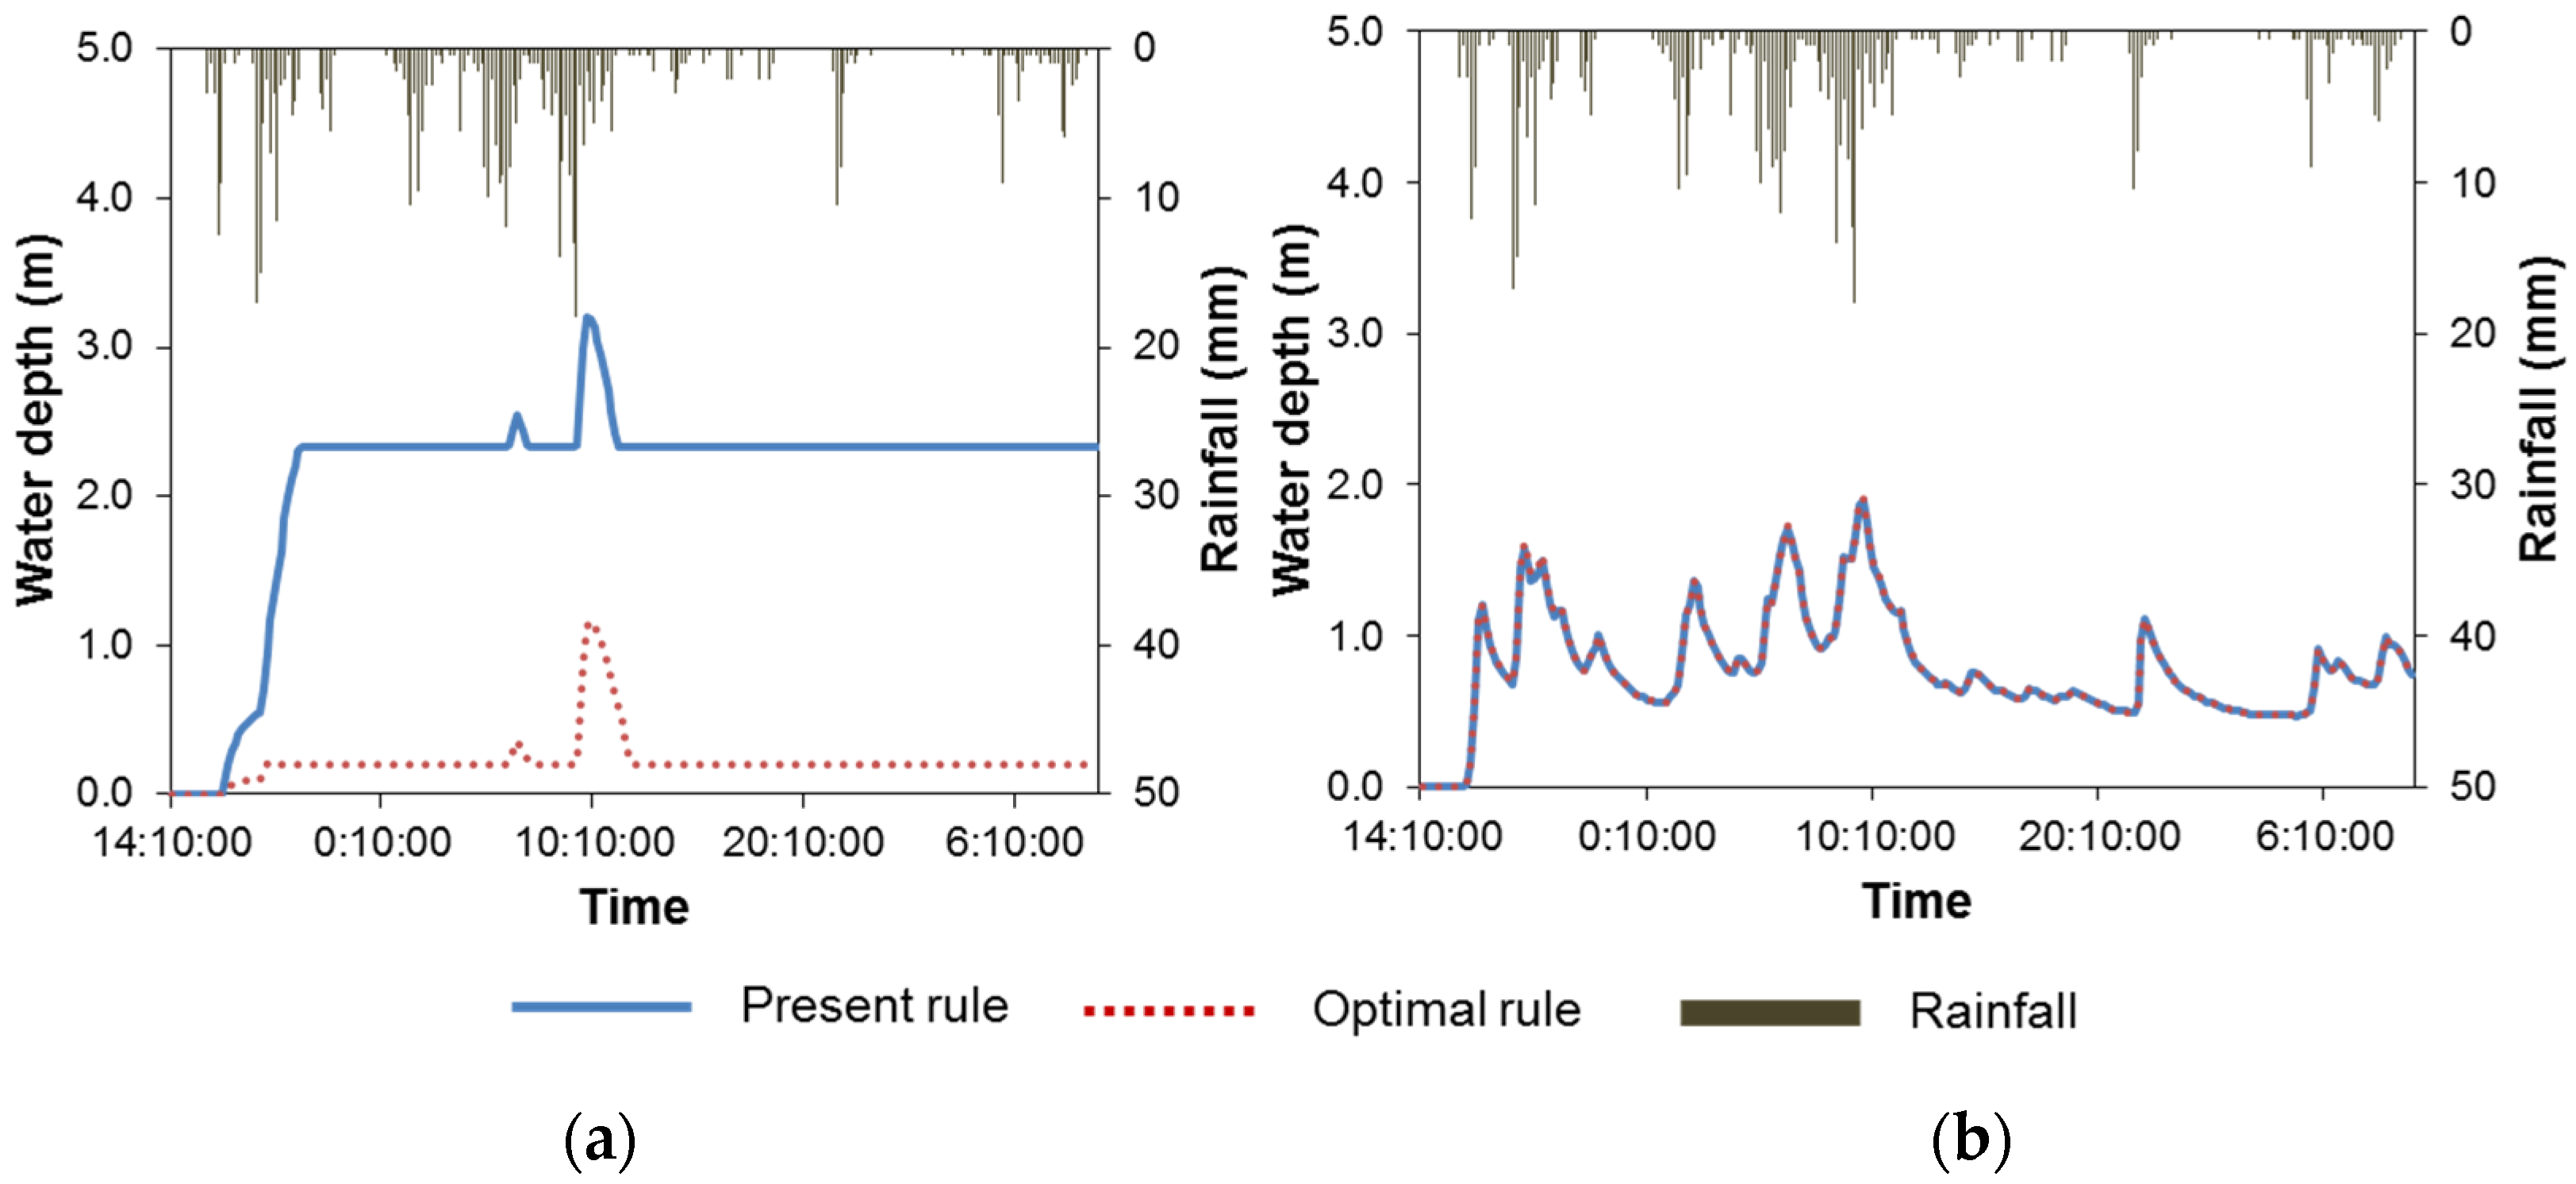
A rainfall event in 2011 lasted two days (26–28 July) and resulted in extreme inundation in the southern part of Seoul. The estimated return periods of this event vary with different rainfall durations; e.g., there is a 10-year return period for a 1 h rainfall, but more than 50 years for a 6 h or greater rainfall [
25,
27]. The implementation of the optimal conditions and design in this flood event in 2011 is represented in
Figure 8 and
Table 5.
In general, the optimal facility conditions outperform the present conditions in terms of flood peak at the detention storage and flooded volume in the whole catchment. The water depth in the storage unit dramatically decreases by 2.03 m (63% of maximum water depth in the present operation), preventing inundation in the neighboring area and reducing energy consumption by using only one pump unit during the rainfall event. Under optimal operation, flooding occurs at 14 nodes with total flood water of 0.491 × 10³ m3, a decrease of 19% of the flooded volume compared to the present operation. These results for severe flood events in 2010 and 2011 with different return periods for different rainfall durations show that the optimal conditions surpass the present operation in terms of flood damage reduction for both the detention area and the entire watershed in extreme flood events.
To comprehensively verify the efficiency of the optimal facilities in both normal and severe flooding situations, various designed rainfall scenarios are built for different durations (60, 90, 120, and 180 min) and return periods (20, 30, and 50 years). The Huff method [
24] is used to generate rainfall hyetographs corresponding to pairs of rainfall depth and duration. The hydrological model, SWMM 5.1, is applied to simulate flood events caused by the synthetic rainfall events. A full comparison between the present and optimal facilities under the different designed rainfall scenarios is made and the results in terms of the maximum water level at storage unit C and control node F, total flooded volume, and number of flooded nodes in the entire watershed are shown in
Table 6.
Under the optimal conditions, the maximum water level at the detention storage is dramatically reduced in most of the rainfall scenarios except for only minor reductions in the 50-year 180 min scenario. In severe scenarios with 30- and 50-year return periods, the water depth reduction is about 0.5–1.0 m, which significantly mitigates flooding in the detention area that occurs when flood water exceeds conveying ability. At control node F, water depths in the rainfall scenarios show a small fluctuation, slightly increasing in low return periods and short durations and gradually decreasing in severe scenarios (with a magnitude of around 5 cm). The total flooded volumes in the whole watershed are reduced using the optimal operating conditions compared to those in the present operation except in normal scenarios with low return periods and short durations. The flooding decrease is significant for the designed flood events lasting 180 min (around 15% of the total flooded volume for 20-year, 30-year, and 50-year return periods). Moreover, the number of flooded nodes using the optimal operating conditions is reduced in most of the rainfall scenarios except for the short-duration rainfall events.
5. Conclusions
The study presents a promising method for optimizing detention facilities for flood control purposes. The new pumping operation and weir design are derived from an approach that couples optimization techniques with a flood routing model and outperforms the present operation in terms of flooding in both the detention area and the entire watershed. The straightforward approach of finding the global optimum is conducted to verify the efficiency of the optimization method. This comparison shows that the optimizer is successful in searching for the optimal detention facility conditions in the study area. The optimal solution is then assessed by applying it to a severe historical flood event in 2011 and various designed rainfall scenarios. The optimal conditions outperformed the present in both historical flood events and designed rainfall scenarios. With regard to flooding mitigation in the detention area, the application of the new design and operation would be significant.
Even though this method has advantages of flood reduction and reduces computation time, it still contains uncertainties in simulation modeling due to calibration methods and data availability. The spatial and temporal variability of recorded rainfall data could result in uncertainty of designed rainfall scenarios. Moreover, the quantity and quality of rainfall data are also considered as uncertain sources. Further research will be aimed at handling these uncertainties. The constrained objective function evaluated in this study also needs to be improved in future work.


