Article

Willingness-To-Pay for Improving Marine Biodiversity: A Case Study of Lastovo Archipelago Marine Park (Croatia)

1
Department of Spatial Planning, Vienna University of Technology, Vienna 1040, Austria
2
E.C.O. Institute of Ecology, Klagenfurt 9020, Austria
3
Association for Nature, Environment and Sustainable Development–SUNCE, Split 21000, Croatia
*
Author to whom correspondence should be addressed.
Water 2017, 9(1), 2; https://doi.org/10.3390/w9010002
Submission received: 14 November 2016 / Revised: 12 December 2016 / Accepted: 19 December 2016 / Published: 23 December 2016

Abstract

:
The sustainable financing of marine protected areas is still an important issue on the conservation agenda even in European countries with strong governance and regulatory frameworks. With the example of the Lastovo Archipelago Marine Park in Croatia, this paper discusses options for funding based on visitors’ willingness-to-pay to conserve marine biodiversity. The site is attractive to general tourists coming by ferries and sailors with private boats alike, which is at the same time a challenge and an opportunity for designing an efficient and effective funding scheme. The authors investigate the willingness-to-pay (WTP) of these two groups of visitors for the conservation of characteristic habitats and species based on the visualization of three different scenarios. In the statistical analysis, the authors find a significant WTP that could contribute to the long-term management and financing of the site, taking into account the perceptions and attitudes of the different groups of tourists. All in all, this study provides several conclusions for levying entry fees depending on a segmentation of tourists with respect to their preferences, behavior, socio-economic characteristics, and alternative destinations.

1. Introduction and Background

As anthropogenic impacts are main drivers for the degradation of coastal and marine ecosystems ([1]), the establishment of marine protected areas has appeared to be an appropriate and effective conservation strategy to reduce (marine) biodiversity loss. Hence, the CBD (Convention on Biological Diversity) calls for the establishment and extension of coastal and marine areas to be “conserved through effectively and equitably managed, ecologically representative and well connected systems of protected areas” of at least 10 percent until 2020 ([2], goal 11). This goal is far from being reached, but the awareness for the importance of the complex and fragile marine ecosystems has increased significantly within the last years. New questions on the selection ([3]), on the management (e.g., [4]), on the governance (e.g., [5]), and on the economy of these sites are emerging (e.g., [6]). From an economic perspective, the interrelation between protected areas and (eco-) tourism has become a relevant topic both from a scientific as well as a practical and managerial perspective. Despite conflicting issues such as coastal infrastructures (e.g., piers, harbors, resorts) and pollution owing to boating, recent studies suggest that the conservation of marine ecosystems and (eco-) tourism may well be complements. In this context, it is of particular importance that the World Conservation Union ([4], p. 27) indicates that “non-extractive” recreational activities can be in line with almost all categories of marine protected areas. Increasingly environmentally aware tourists are no longer content to swim, snorkel, and fish or dive in degraded marine environments, and thus appear to be willing to contribute to a favorable conservation status, which also includes the acceptance of spatial or temporary bans of access to certain ecologically sensitive areas. In addition, studies also suggest that these recreational activities have an increasing economic potential with respect to local and regional development (e.g., [7,8]).
Against this background, the aim of this paper is to shed more light on the visitors’ perspectives and perceptions with respect to conservation and (eco-) tourism, as well as their willingness-to-pay for a certain quality of marine ecosystems and marine biodiversity. In particular, the purpose of this paper is to find answers to the following questions:
  • Is there a measurable willingness-to-pay (WTP) for intact marine ecosystems?
  • Is this WTP economically significant, and could relevant revenues be generated for the ecological management of the sites?
  • What implications do the results have for planning of and managing the Lastovo Archipelago Marine Park (Croatia) in particular and of marine sites in general?
The structure of the paper is as follows: Section 2 provides a brief overview of the literature on valuing marine biodiversity by visitors. In Section 3, the Lastovo Archipelago Marine Park, the site selected for this study, the research hypotheses, and the survey are described. In Section 4.1, the descriptive results of the study are discussed, and in Section 4.2 and Section 4.3 the econometric results with respect to the determinants of the respondents’ travel frequency, as well willingness-to-pay are presented. Finally, in Section 5, the results are summarized, and conclusions for biodiversity and park management are drawn with a specific emphasis on the potential for funding the park’s administration based on user fees.

2. Valuing Marine Biodiversity and Implications for Conservation Management: A Brief Overview

The emergence of marine protected areas has provoked and triggered substantial research on the economy of marine biodiversity in general and, specifically, on the costs, benefits, and ecosystem services of marine protected sites (e.g., [9,10,11,12,13]).
Ami et al. [14] investigate the biologic and economic functions of marine protected areas by means of numerical simulations and find that—under the precondition of a proper management—both functions can be enhanced. For instance, under a strict management framework including access bans and ecological management, (eco-) tourism might also be increased. Similarly, Hussain et al. ([15], p. 828) calculate the benefits arising from marine protected areas as proposed in the UK Marine Bill ex ante, and come up with impressive figures, namely a “benefit range from designation of between 10.2 billion Great British Pounds (GBP) and GBP 23.5 billion in present value terms”. A choice experiment in the same context even “suggests that welfare improvements from the Marine Bill significantly outweigh projected regulatory costs” ([16], p. 412). In this paper, the authors focus more specifically on the interrelation between (eco-) tourism and conservation in general and the willingness-to-pay (WTP) approach in particular.
Studying three major diving areas on the Philippines, Arin et al. ([17], p. 172) demonstrate that “substantial amounts of revenues may be collected through entrance fees to support coral reef conservation”. Interestingly, “most tourists interviewed preferred NGOs (Non-governmental organizations) as the most trustworthy organization type to collect and manage entrance fees.” In a similar context, Asafu-Adjaye and Tapsuwan ([18], p. 1122) conclude for the Mu Ko Similan Marine National Park (Thailand) “that divers are willing to pay about 27–63 United States Dollars (USD) per person per annum”.
By the example of a specially protected marine area in Göcek Bay (Turkey), Can et al. [19] demonstrate that local residents are willing to pay 14.8 Turkish Lira (TRY) (4.40 Euros (EUR)) per month and that tourists are willing to pay TRY 11.2 (EUR 3.40) per tour for improvements in marine life. The authors are convinced that these results have the potential to “pave the way for new policies and measures against the deterioration of the marine environment” ([19], p. 291). Gelcik et al. ([20], p. 975) find by assessing a marine site in Chile that “nature-based tourists state median WTP values of USD 4.38 (EUR 3.8) and sun–sea–sand tourists USD 3.77 (EUR 3.3). Overall, entry fees could account for 10%–13% of MPA [Marine Protected Areas] running costs.” A study on scuba divers’ WTP in Barbados highlights “the potential for substantial additional economic contributions with improvements to the quality of a variety of reef attributes” ([21]). Nevertheless, Uyarra et al. [22] warn that any entry fee system must be ‘reasonable’. For the Bonaire National Marine Park (Antilles), they find that divers’ willingness-to-pay (WTP) appears to have decreased since 1991” ([22], p. 515).
Finally, some of the studies focus on the fact that willingness-to-pay (WTP) may be expressed by simple figures, but is a result of complex societal processes. Ressurreição et al. [23] examine cultural differences in WTP and find that WTP of 1502 interviewees towards different taxa of marine biodiversity appears to be culturally determined. Togridou et al. [24] examine and discuss “the influence of visitors’ profile, information sources, environmental dispositions, and visit evaluation on visitors’ willingness-to-pay (WTP)” by the example of the National Marine Park of Zakynthos (Greece). In any case, as discussed by Getzner and Thapa [25], it is problematic to directly calculate the potential additional revenue collected from tourists in terms of increased entry fees since tourists react to the increased prices at a site. Therefore, a demand curve for visits that depends on the level of the entry fee has to be derived in order to calculate realistic revenues for the park’s management. However, international tourists in prominent protected areas such as internationally recognized national parks may be less sensitive to increases of entry fees than local or regional visitors.

3. The Study Site and the Empirical Survey

3.1. The Lastovo Island Marine Park and Changes of Management for Marine Biodiversity Conservation

Given “an era of economic crisis and geopolitical instability” some years ago, marine conservation in the Mediterranean Sea is still considered a particular challenge ([26], p. 31). Marine and coastal habitats and in total some 10,000 isles and islands require protection and effective frameworks for sustainable development, balancing both ecological restoration and conservation, and (eco-) tourism. The whole Lastova Archipelago (Croatia) is one of these sites.
The archipelago was declared a protected area in 2006 as the eleventh nature park in Croatia due to its outstanding landscape values, such as thick forests and fertile fields rich with ponds, high coastal cliffs, land and sea caves, numerous rare terrestrial and marine species and habitats, exceptional purity of the sea and rich cultural and historical heritage (Management Plan, 2013; [27]). It belongs to the South Dalmatian group of islands and consists of 44 islands, islets, rocks and reefs with total area of 53 km2 of land and 143 km
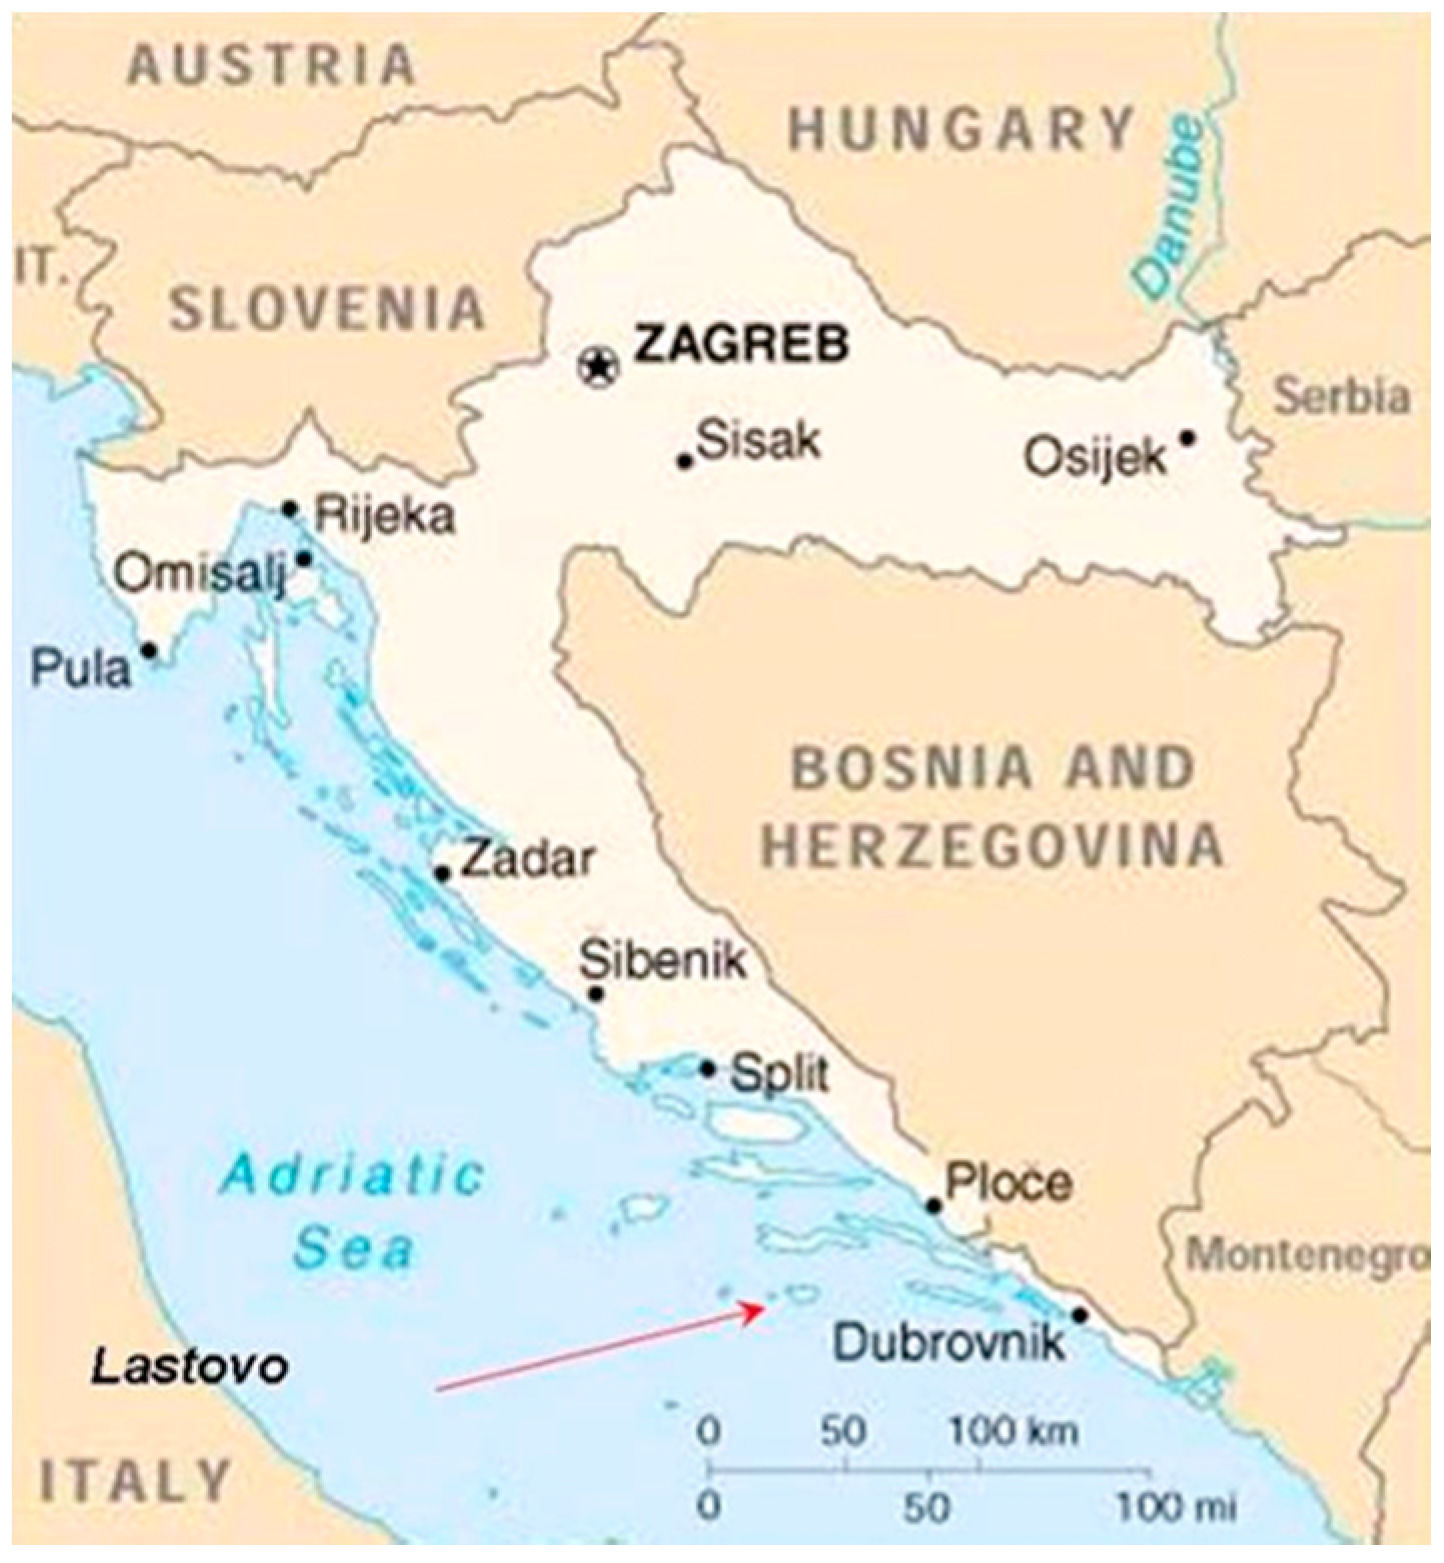
2 of sea, making it the second largest marine PA (protected area) in Croatia. The largest among the islands, according to which the whole group was named, is Lastovo Island (for the location of the archipelago, see Figure 1).
The area has a typical Mediterranean type of climate, characterized by mild, wet winters and hot, dry summers. The geological basis of the Lastovo Archipelago consists of Jurassic and Cretaceous sedimentary layers including dolomite, dolomite limestone and pure limestone. Due to the composition of rocks, small land areas and the climate, the Lastovo Archipelago does not have permanent inland water streams, but the fertility of fields is increased by their ability of retaining the moisture, which is particularly important for agriculture.
The park represents one of the richest and best preserved botanical areas in the Mediterranean, determined by the isolation of the open sea, plenty of sunlight, night humidity and deep soil. The sea of the Archipelago is strongly influenced by the South Adriatic deep waters. The sea transparency (visibility) level is one of the highest recorded of all in the Adriatic Sea. Frequent rise of deep water rich with nutrients (“upwelling”) results in an inflow of mesoplanktonic and deep-sea species. This diversity of planktonic organisms causes a huge variety of benthic organisms. There are 248 species of marine flora, 330 species of marine invertebrates and 150 species of fish recorded in the area, as well as several dolphin and marine turtle species.
The continuity of life on the Lastovo Island can be traced back to the Early Bronze Age resulting in the numerous protected cultural heritage sites. The intangible cultural heritage of Lastovo Archipelago is, for instance, Lastovo Carnival (celebrated in continuity from the Middle Ages, protected as non-material cultural good) and the Statute of Lastovo (a book of rules and customs adopted at a public gathering 700 years ago).
Currently, there are close to 800 residents with a trend towards out-migration recorded in the Park. The main traditional activities of Lastovo inhabitants are agriculture, with grapevines and olive trees as dominant cultivated plants, and fishery as a traditionally important source of income for the local population. There are 45 fishermen authorized for traditional fishing and 80 authorized for traditional small-scale fishing within the Park. The development of Lastovo’s tourism started after the Croatian independence due to the fact that the area was a strong military base during Yugoslavia times. Formerly, access was banned for foreign tourists. Today, (international) tourism is becoming increasingly important for the local and regional economy. Tourism in the area is based on the good climate, preserved natural and historical heritage, great distance from the mainland making it a peaceful and quiet destination, quality accommodation, local food, vines, and diverse opportunities for recreational activities (e.g., hiking, cycling, swimming, scuba diving, snorkeling, recreational fishing, kayaking). The tourist season starts in May and ends in October, with peaks in July and August.
There are basically two groups of visitors coming to the Lastovo Archipelago: visitors coming by car, train, bus, or otherwise and further connecting via public ferry or fast boat (called ‘group A visitors’ in this paper); and visitors (sailors) coming by private or rented boats (called ‘group B visitors’). Accommodation is provided in one hotel (three stars), private apartments, camps and lighthouses. For sailors (group B visitors), there are three mooring sites for boats on the main island, one in front of a hotel and two in front of restaurants. Two diving centers offer diving trips to a number of unique diving locations. In 2013, Lastovo Archipelago recorded a total of 39,788 overnight stays, and 5416 visitors’ arrivals. The first daily counting of (private) boats (excluding ferries) conducted in 2012 recorded 8270 boats during 122 days of counting (Lastovo Municipality Tourist Board, 2014; [27]). In general, group B visitors (sailors) are perceived as visitors with greater purchasing power whose visits lead to significant revenues of the local economy. They also co-finance the work of public institutions by paying a certain ‘entry fee’ for accessing the area. Unfortunately, this type of private boat tourism also has major impacts on environment, mostly on Posidonia oceanica meadows which are important habitats for various types of species. Areas with such meadows are also areas most suitable for anchoring, resulting in great human pressure on these meadows. Since Posidonia oceanica grows very slowly, it takes a long time to recolonize once damaged or removed from the area (www.iucnredlist.org).
The Lastovo Archipelago Nature Park is managed by a public administrative body established in 2007 by the Croatian government with the tasks of protection, maintenance, and promotion of the protected area (Croatian Nature Protection Act, OG 80/13, Article 131). The management of the park is financed mainly through the central government’s budget. Some revenues are generated from the access and use of the protected area (e.g., fishing concession license, sailors’ entry fees, recreational fishing permits, souvenirs and merchandize) and donations from various ministries, funds and foundations (Management Plan, 2013). In 2013, the total annual budget of the management authority was approximately 300,000 EUR of which 65% was contributed by the central government. The largest share of annual expenditure was personnel costs of employees (64%), capital investments (34%), and concrete nature protection programs (only 2%).
The future implementation of the recently developed management plan is expected to contribute to a more effective conservation and thus improvement of marine biodiversity, but at the same time represents a new financial challenge to the park’s management owing to a range of new conservation programs and policies. Through the mechanism of user fees, tourism and recreation may represent potentially important sources of additional revenues for the Lastovo Archipelago Nature Park.

3.2. Testable Hypotheses and the Empirical Survey

Based on the theoretical background, the research questions of the current paper presented in Section 1, and the existing empirical literature on the management of marine protected areas in the context of travel cost and willingness-to-pay studies discussed in Section 2, the main hypotheses of this paper to be tested are (the description of variables can be found in Table 1):
H1a:
TRAVELFRQGroupA ≠ TRAVELFRQGroupB
H1b:
NIGHTSGroupA > NIGHTSGroupB
H2:
WTPGroupA > WTPGroupB
H3:
TRAVELFRQi and WTPi depend on a range of socio-economic, perceptional and visit-specific variables of respondents.
First, we want to address the hypothesis H1a stating that the travel frequency of group A tourists coming by car, bus or train (or other modes of transport) is substantially different to the one of group B tourists (sailors) visiting the Lastovo Islands area on their own (or rented) boats. A reason for this difference which will also be explored in the empirical part of this paper might be that sailors cross the area more regularly when cruising along the Croatian coast and thus exhibit a higher frequency of visits. In addition, we test whether group B tourists (sailors) in fact stay much shorter than other visitors as Lastovo Islands might only be a short-term anchoring point for staying overnight, than a sole destination of the whole vacations (H1b).
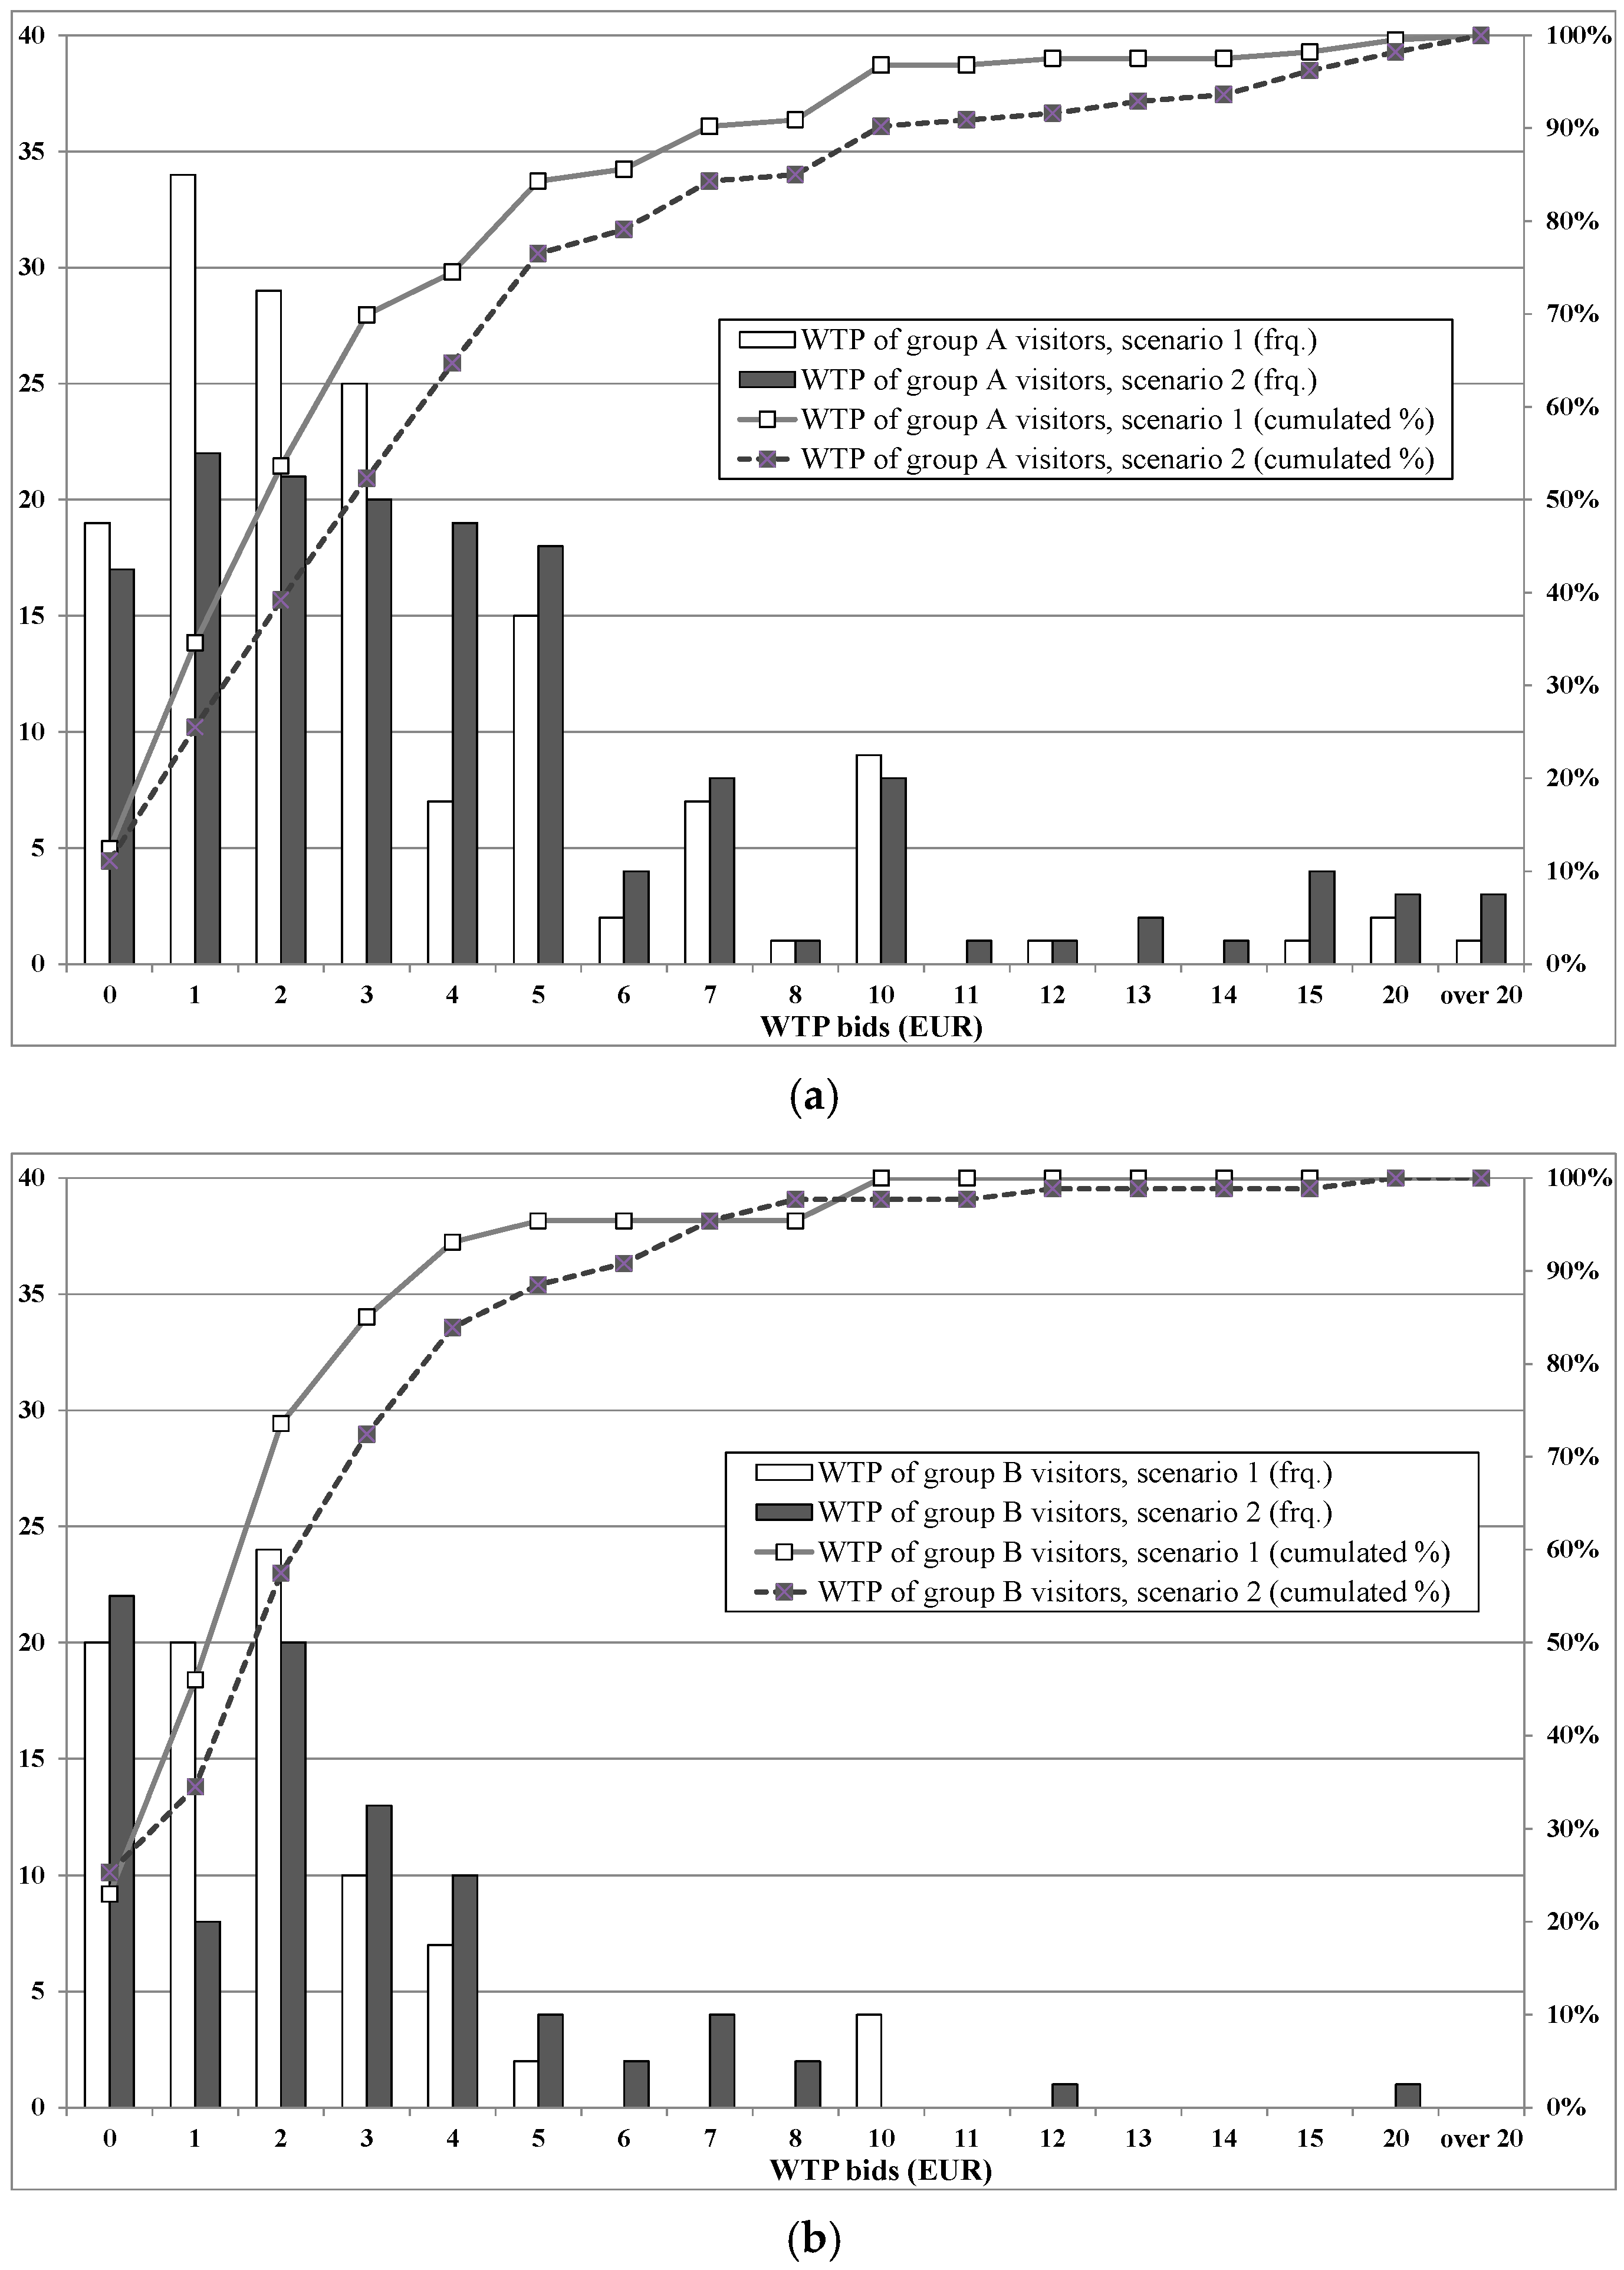
Second, we ascertain the respondents’ willingness-to-pay and explore differences between the two visitor groups (groups A and B). All other things being equal, we hypothesize that group A visitors express a higher willingness-to-pay than group B visitors since the latter have fewer substitutes for holiday resorts available (H2). (Sailors might just cruise to a different place/harbor if they do not like to stay at Lastovo Islands for some reason.) Thus, we hypothesize that the elasticity of demand for visits to Lastovo Islands is significantly different between the two groups of tourists.
Third, we assume that travel frequency, as well as willingness-to-pay, depend on a range of socio-economic (e.g., income, age) and trip-specific variables (e.g., length of stay, main activities in the area) in addition to variables describing environmental preferences and perceptions (e.g., environmental quality at Lastovo Islands) (H3).
In order to explore and answer the research questions, and to test the hypotheses of this paper presented above, a face-to-face survey of visitors at Lastovo Islands took place in the summer of 2013 (July and August). By means of a questionnaire, the two groups of visitors (n = 240 in total) were surveyed with respect to their travel behavior and frequency, their willingness-to-pay for biodiversity improvements, and several other dimensions describing their vacations in the archipelago area. As mentioned before, one group (group A visitors) consisted of families and individuals who came to visit Lastovo Islands by car, train, bus, or otherwise, and further connecting via public ferry or fast boat; the other group (group B visitors) consisted of sailors anchoring at one of the harbors or moored buoys in the area. In order to test for the different hypotheses described above, two empirical models are estimated.
The first model estimates the number of visits (vacations) at the Lastovo Archipelago depending on travel costs, and a range of socio-economic, ecological (site-specific) and recreation-specific variables. The model is—as described above in 
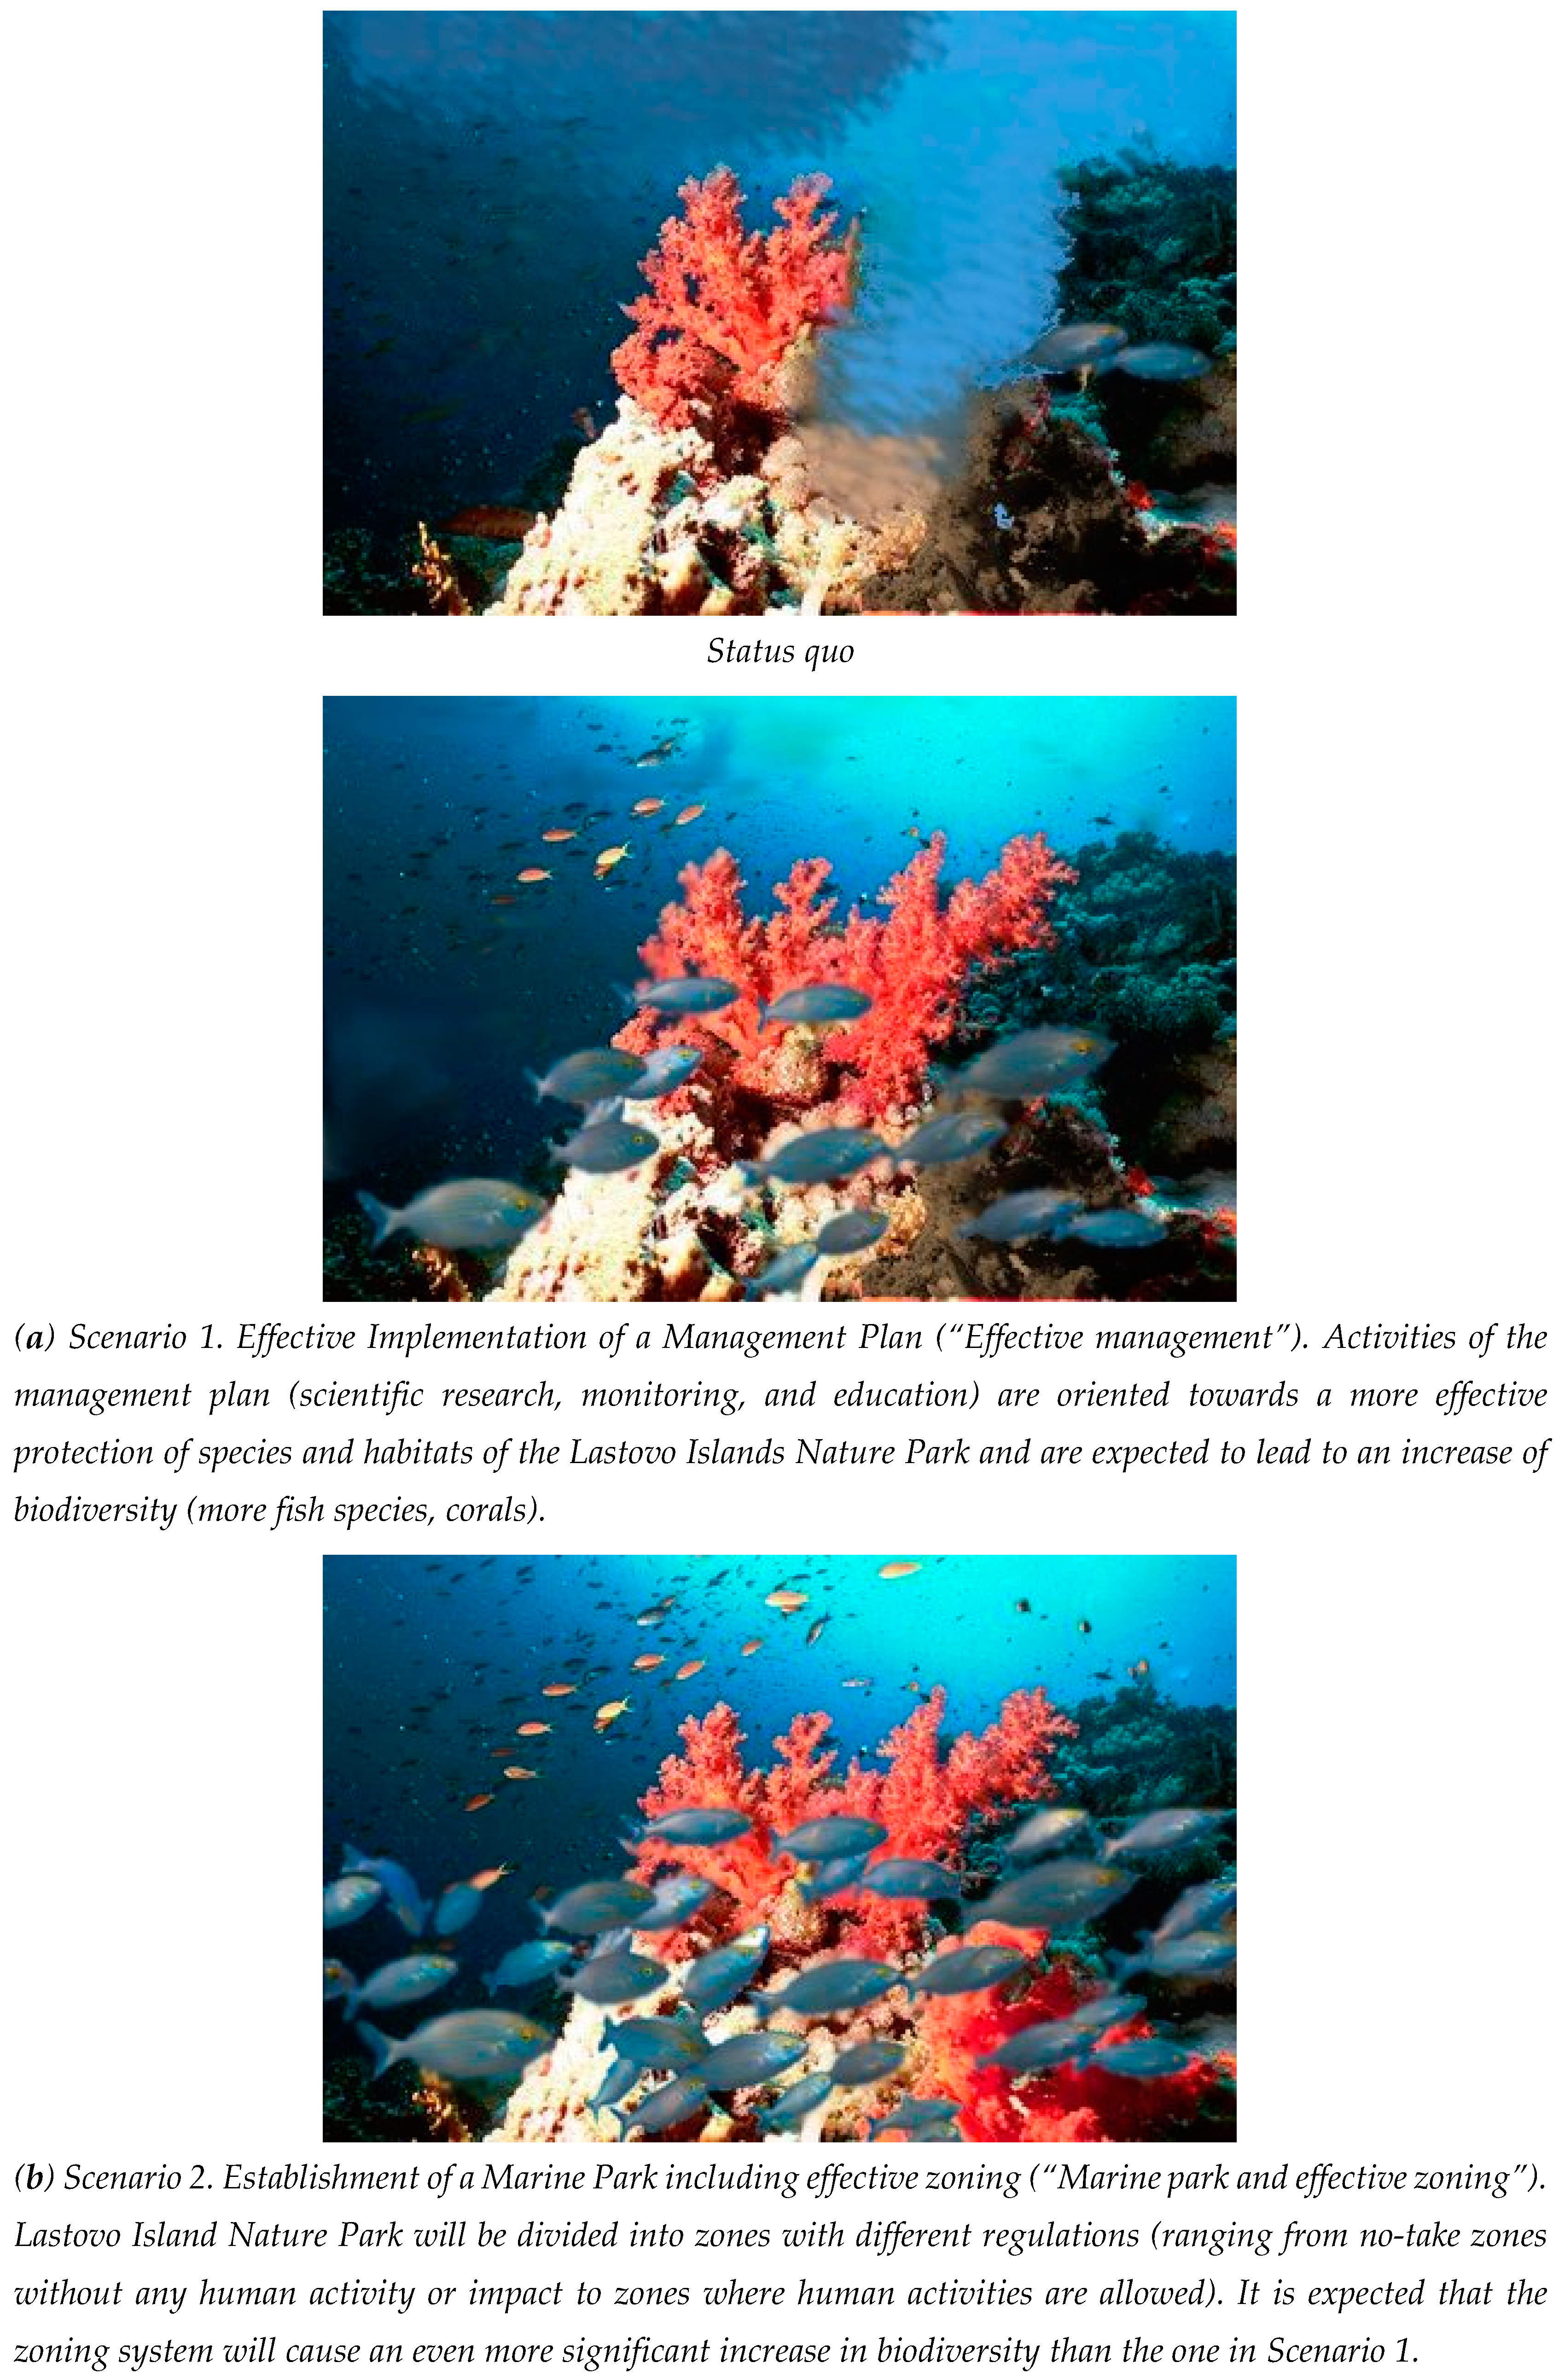
Section 2—a combination of revealed and stated preferences, and is based on a pooled data set of actual travel behavior (“status quo”) and two scenarios of biodiversity conservation (see Figure 2 for the representation of the scenarios in the questionnaire). The different scenarios were described verbally, and by means of manipulated pictures to highlight the impacts of different management scenarios on the appearance of the underwater seascape (cf. for the design and use of such scenarios [28,29,30]). The model is estimated as a count data model assuming a standard negative binomial distribution (see Equation (1)).
TRAVELFRQi = f(Ti, Si, Ri, Ei)
The variables of the econometric models are presented and described in Table 1. The second model consists of a maximum-likelihood Tobit model exploring determinants of WTP of both groups of visitors (groups A and B) with the following empirical model (Equation (2)):
WTPi = g(Ti, Si, Ri, Ei)
For both equations, the models assume a slightly different inclusion of potentially significant explanatory variables. The vector Ti includes a range of variables describing the travel to Lastovo Islands (travel costs), and the length of stay in the area. In addition, several studies showed that the travel frequency and willingness-to-pay might significantly depend on whether a specific area is the sole destination of the whole trip.
Variables grouped by Si denote socio-economic variables such as the respondent’s household income; age; nationality; and whether the respondent i belonged to group A or B, as the demand for traveling and holidays, as well as the willingness-to-pay for biodiversity improvement, can be reasonably assumed to depend on these socio-economic variables (e.g., more frequent trips to the area, as well as, higher willingness-to-pay with higher income of households according to standard economic demand theory).
The vector Ri includes variables that describe recreation-specific attributes of the stay at Lastovo Islands; for instance, trip preferences and attitudes towards biodiversity conservation in the area may significantly depend on the kind of activities (e.g., sports), and the level of satisfaction of the whole vacations in the area.
Finally, the models include several environmental attributes of the Lastovo Islands (Ei); on the one hand, we include perceptions of respondents with respect to the protection status, and the main motive for expressing willingness-to-pay for more effective biodiversity conservation. On the other hand, this group of variables accounts for preferences regarding undisturbed nature, and the respondent’s experience with marine parks. Finally, two dummy variables denote the hypothetical realization of Scenarios 1 or 2.

4. Results

4.1. Descriptive Survey Results

As the hypotheses outlined above emphasize, the focus of this paper is to test for differences in behavior, perception and attitudes of different groups of visitors (groups A and B). In the following, selected descriptive survey results are presented; an analytical framework for econometrically testing differences between these two groups is provided in Section 4.2 and Section 4.3.
The first part of the descriptive analysis concentrates on traveling to the Lastovo Islands. Table 2 presents results concerning the place of residence, the duration of the journey to the islands, and the main reasons for visiting the area.
First of all, while environmental awareness seems evenly distributed between the two user groups, a majority of respondents of group A stated that the Lastovo archipelago would be the primary and final destination of their vacations (69%). On the contrary, only a small share of group B visitors (sailors) named the islands as their final destination (6%). This result is interesting and important since group A visitors rely on the islands, i.e., ecological quality, to a much larger extent, while group B visitors apparently have many substitutes available if, for some reasons, the islands are not as perceived as attractive anymore, e.g., because access is restricted, or entry fees would be substantially increased.
The place of residence is again very different between user groups; group A visitors are mainly from Croatia, Italy and Slovenia, while international residences dominate the group B visitors (sailors).
Sailors (group B) exhibit a longer travel to Lastovo Islands than group A tourists, which may be attributed to the higher share of international visitors in the first group.
Finally, the main reasons for visiting the archipelago are quite evenly distributed between groups; both groups enjoy the natural underwater and the remoteness of the area.
Table 3 presents the results of the current visit of group A and B tourists at Lastovo Islands. The main activities are more disperse in group A (with swimming, hiking, and underwater sports as the main activities) while group B visitors largely enjoy swimming and some underwater sports in the area.
Most respondents in both groups stated that they would visit the islands on average about once per year; the largest share of respondents in both groups are first-time visitors; however, it seems that the group B of visitors (sailors) has visited the area more frequently in the past.
Regarding changes of the marine biodiversity in terms of more effective management, about 80% in both user groups would not change their travel frequency if one of the scenarios were realized. However, differences occur regarding the extent to which some respondents would reduce the frequency of trips. About 7% of group B would actually reduce the number of visits to the islands, while practically all respondents in group A with travel frequency changes would increase their number of visits.
On average, groups A and B exhibit a rather equal number of trips to the area, about 2.7 times over 5 years. The different reactions to the potential realization of the two scenarios are also mirrored in the mean travel frequencies in the case of the realization of one of the scenarios; while group A visitors would increase their trip frequency by roughly 1.2 to 1.3 times per 5 years (on average), the mean increase in group B (sailors) only amounts to 0.2 to 0.6 times per 5 years. This result may be reasoned by the higher sensitivity of sailors with respect to potential (expected or factual) restrictions of access or activities to certain areas of the archipelago if effective marine biodiversity conservation policies were in place. In addition, as longer sailing trips of group B visitors are planned under a wide range of circumstances, the ecological quality at Lastovo Islands might only play a minor role as a decisive factor in their destination choice.
Finally, there is not much difference between the groups in terms of experiences with marine parks, the opinions on the current level of degradation of the area by human activities, and the alternatives to vacations at Lastovo Islands if access were restricted on conservation grounds with some small differences indicting that ‘sailors’ have more substitutes available, and slightly more experience with marine parks (which could be expected).
Willingness-to-pay and the perception of biodiversity conservation policies are detailed in Table 4 and Figure 3. Again, there are some differences with respect to perceived objectives of conservation policies—it seems that group B visitors (sailors) are slightly more oriented towards recreation objectives but also think more strongly about the sustainable use of natural resources. However, differences occur with respect to the principal willingness-to-pay (WTP) of respondents in both groups with group B visitors expressing a higher propensity for a positive WTP.
Again, similar to the average frequency of trips, respondents of group A are willing to pay higher amounts for the realization of one of the scenarios than group B visitors (sailors). In both groups, the scale effect can be detected with higher WTP bids for the Scenario 2 compared to WTP for Scenario 1. The distribution of WTP bids in both groups, as well as the cumulated percentage, can be seen in Figure 3. WTP bids in both groups are shifted to the right from Scenario 1 to Scenario 2.

4.2. Determinants of Trip Frequency and Dependence on Conservation Scenarios

As described above, the first analytical model estimates the number of visits to Lastovo Islands depending on several potentially significant variables which are described in Table 1 while the results of the estimations are presented in Table 5. This table is divided into three blocks: the first presented the estimation results limited to group A visitors; the second block is concentrated on group B visitors (sailors); the third and last block contains the results of the pooled sample with a dummy variable denoting group B visitors.
First of all, the results of this travel cost model (TCM) show that for the group A visitors, travel costs (variable TRAVELCOST) are negatively correlated with trip frequency as expected. While this result is replicated in the pooled sample, travel costs of group A visitors (sailors) do not seemingly exhibit any significant influence on trip frequency. This result is, at first sight, surprising since economic theory would predict that higher travel cost should lead to fewer trips. However, we assume that—besides the rather small sample size which might not exhibit all statistically significant correlations—group B visitors (sailors) are a specific group of tourists who cruise the Croatian coast with some fixed route; Lastovo Islands might only be a part of the whole trip which sailors would visit anyway for food and supplies. This group potentially depends on visiting the archipelago, and thus does not exhibit large variations with respect to distance from the respondent’s home, and trip frequency. This result is also corroborated by the significance of the variable LASTOVODEST denoting whether the archipelago is the sole destination of the vacations. It seems that group A visitors with the final destination of the islands exhibit a higher frequency of trips while for group B (sailors), this variable is not significant at all.
The length of stay (variable NIGHTS) is significant for both groups of visitors; this means that respondents who stay longer in the area are also more frequent visitors. With respect to socio-economic variables, Lastovo Islands seem to attract younger visitors only within the group of ‘tourists’ (variable AGECLASS). Ceteris paribus, Lastovo Island is also attractive for Croatian residents (and, presumably, better known) (variable CROATIA). Other socio-economic variables are not included owing to potential multi-collinearity problems, and the sample size being too small for the inclusion of an extensive set of socio-economic variables (such as gender, education, profession).
With respect to activities, visitors specifically looking for diving in the areas exhibit fewer trips to the area (variable ACT_DIVE) while visitors who stated a high satisfaction level (variable SATISF_VERY) in turn exhibited a higher frequency of trips. Interestingly, this variable is not significant for group B visitors (sailors) underlining the above-mentioned result that Lastovo Islands are, in any case, visited by this group on their route along the Croatian coast.
The status of biodiversity conservation (variables PROTECTED) exhibits—all other things being equal—an interesting influence on visitors: while group A visitors are somewhat deterred from visiting the islands if they knew that the area is protected, group B tourists (sailors) are attracted by the marine protected area, and thus visit the archipelago more frequently.
Trip frequency is also positively correlated with the payment motivation of visitors regarding willingness-to-pay for more effective biodiversity conservation. In both groups, visitors with a strong bequest motive are more frequent visitors (variable MOTIVEWTP_HERITAGE).
While group A tourists seem to enjoy the clean environment and thus exhibit a higher trip frequency (variable REASON_CLEAN), group B visitors (sailors) seem to independently choose Lastovo Islands for their trip.
Finally, the realization of scenarios influences trip frequency. Visitors of group A would significantly increase trip frequency if one of the two scenarios were realized (variables SCEN1, SCEN2); however, the two coefficients are not significantly different in this group of tourists. This group seems to react positively to improvements of marine biodiversity, but apparently does not value the improvements differently. In the pooled sample, the differences between scenarios are more pronounced but still not significant. Group B visitors (sailors) are somewhat attracted by stricter biodiversity conservation, but this influence seems to be weak.
In all, the explanatory power of the models is satisfying; however, the estimation for group A tourists exhibits a higher level of explanation than the estimation for group B visitors (sailors). A caveat to this qualification may lie in the different sample size.

4.3. Willingness-To-Pay of Different Visitor Groups for Biodiversity Conservation Scenarios

The second model estimated in this paper ascertains potentially influential variables on willingness-to-pay of respondents (visitors) to Lastovo Islands. As described before, respondents were asked to state their willingness-to-pay for two biodiversity conservation scenarios described verbally and by manipulated underwater pictures. The results of the estimation of the willingness-to-pay functions are presented in Table 6.
First, almost all variables describing the actual trip to the Lastovo archipelago are significant for both groups of respondents. Both groups of tourists exhibit a negative coefficient for the variable LASTOVODEST suggesting that respondents whose primary destination of the vacations was the archipelago state a below-average willingness-to-pay for biodiversity conservation. This result can be explained by the fact that those who perceive the Lastovo Islands as their primary destination without readily having a substitute at hand, and who therefore cannot easily avoid increased payments in terms of entry fees, are more cautious in stating a certain willingness-to-pay bid. In addition, the length of stay in turn also increases willingness-to-pay (variable NIGHTS). Respondents who may more extensively enjoy a higher level of biodiversity by staying longer also state a higher willingness-to-pay. Interestingly, willingness-to-pay of group B visitors who stay shorter than group B visitors does not significantly depend on the length of stay, presumably owing to the small variation.
The variable INCOME is significantly influencing willingness-to-pay in the group A visitors, thus conforming to theoretical expectations; this result also shows up with the pooled sample. However, visitors of group B largely state willingness-to-pay bids without influences of the household’s income which might also be due to the little variation in income in this sub-sample. Other socio-economic characteristics such as gender, education or profession of respondents were not considered in the current estimation owing to the rather small sample size compared to the already extensive list of other determinants. In addition, some of the variables proved to exhibit multi-collinearity with respect to income (such as the profession and education of respondents).
Respondents with a Croatian residence (variable CROATIA) are more likely to express a willingness-to-pay for biodiversity improvements in the area; this result may be reasoned by the fact that Lastovo Island is also considered a natural heritage area by the Croatian population. While visitors of group B (sailors) exhibited—ceteris paribus—a higher trip frequency to the area than other tourists (group A) (see Section 4.2 and Table 5), their average willingness-to-pay is significantly smaller than the one of the other group (variable GROUP). Again, sailors seemingly have more short-term and easily accessible substitutes available along the Croatian coast, and thus also express a smaller willingness-to-pay.
Interestingly, diving as the main recreational activity during the stay at Lastovo Islands does not influence willingness-to-pay (variable ACT_DIVE). It can be expected that divers might be more sensitive to underwater biodiversity conservation since their experience closely depends on sighting coral reefs and fish species. However, while we find a positive coefficient for the pooled and the group A visitors, this coefficient is not significant.
If respondents thought that the quality of the environment worsened over the years (variable DEGRADATION), the amount of willingness-to-pay is—ceteris paribus—higher. While this result may be expected, the variable PROTECTED shows a significantly negative coefficient, indicating that respondents who knew about the conservation status of the archipelago stated below-average willingness-to-pay. This result may be reasoned by the respondent’s consideration that conservation policies are already in place, and that further funding by visitors should not take place.
The respondent’s motives to express a positive willingness-to-pay amount (variables MOTIVEWTP_HERITAGE, MOTIVEWTP_BIODIV) are also significant explanatory variables in both groups; this indicates that respondents whose primary motives lie in the bequest and existence values state higher WTP bids than respondents with option or use values as their main payment motives.
The variable REASON_NATURE also conforms to the expectations since respondents who came to Lastovo Islands primarily because of the undisturbed natural environments also state higher WTP bids for biodiversity conservation.
Interestingly, respondents of group A tourists with some experience with marine parks in other areas (variable MARINEPARKS) are likely to express a higher willingness-to-pay for biodiversity conservation (presumably because they are better informed about the benefits of marine parks). In the other group (sailors), the effect of past experiences with marine parks has an adverse effect. Because sailors are well aware that biodiversity conservation also means that there might be some restrictions on using the water for recreational (e.g., fishing) purposes, their stated WTP is smaller.
Finally, while preferences of respondents in both groups (and in the pooled sample) are not very different for the two scenarios (variable SCEN2), they still express a higher willingness-to-pay for the management scenarios that offer an even more strict biodiversity conservation program.

5. Discussion, Summary and Conclusions

The results of this paper indicate that visitors are willing to support biodiversity improvements by paying entry fees which could yield approximately EUR 330,000 to 451,000 per year depending on the conservation policies implemented to enhance biodiversity. In any case, implementation of more effective management policies could generate enough revenues to cover estimated costs of implementing activities under the management plan of the Lastovo Islands Nature Park. For other costs, the park’s management should also consider international sources, especially EU (European Union) structural funds which are becoming increasingly important for Croatia as a EU member state. The analysis of the registered biodiversity conservation projects show that a significant number of the institutions within the nature protection system are not using international funds at all, although there is a great potential for it [27].
The survey conducted to explore and answer the research questions in this paper also provided the most comprehensive research on visitors’ socio-economic and trip-specific characteristics in the Lastovo Archipelago Nature Park, to date. This information, as well as visitor’s segmentation, which revealed that there are significantly different groups of visitors (group A traveling by land transport and crossing over to Lastovo Islands by public ferries; group B cruising along the coast in private or rented boats), provide valuable data for the park’s management as they can be used to promote appropriate protected area attributes, identify programs and services of visitors’ interests and facilitate planning of activities related to tourism in order to increase the level of visitors’ satisfaction and thus increase economic benefits. Personal communication of interviewers and respondents through face-to-face interviews also revealed the current low level of communication between the park’s management and visitors, and the need for its improvement in order to increase visitors’ understanding of the park’s values and the need for protection.
The results of the survey concerning the type of destination (single destination or part of a multi-segment trip), the levels of increase of travel frequency, the alternatives to vacations at Lastovo Archipelago in case of restrictions, and the WTP for the realization of scenarios, revealed that general tourists (group A visitors) rely more heavily on ecological attributes of the park than group B visitors (sailors). The latter’s responses indicated that they have much more substitutes available and thus are more sensitive to potential spatial and temporal restrictions in case of implementing more effective marine biodiversity protection. As Croatia is becoming a more and more popular summer destination, destinations such as the Lastovo Archipelago which is still not too crowded during the peak season are increasingly hard to find for tourists.
The results of a pooled sample of all visitors revealed that trip frequency depends on several significant variables. Trip frequency is negatively correlated with travel costs but positively correlated with the length of stay, Lastovo being a primary and final destination, strong bequest WTP motives and the different realization of scenarios. Separated results for the two groups of visitors showed that the general tourists’ group (group A of visitors) has a higher level of explanatory power than the estimations for the other group (sailors) which could be explained by the rather small sample size which does not reveal all statistically significant correlations, but also with the fact that, for the majority of sailors, Lastovo is part of their usual cruising route during which Lastovo is visited anyway along the route.
Furthermore, the results of the pooled sample of visitors revealed the influence of potential variables on the WTP level. Variables describing the actual trips were significant for WTP levels, with Lastovo as a primary and final destination showing a negative correlation (possibly as the result of more cautious responses from those who will not easily avoid increased payment), while the respondent’s opinion on the level of degradation, strong bequest and existing WTP motivation, as well as the undisturbed natural environment being the primary visit motive showed a positive correlation in relation to stated WTP levels.
Marine protected areas in Croatia are attractive to sailors who also provide high financial contributions to the national and local economy (Ministry of the Sea, Transport and Infrastructure and Ministry of Tourism, 2008) and thus, the park’s administration should emphasize cross-sectoral co-operation with the nautical sector to act jointly in preserving the area. In general, the results of this study are in line with the literature on the economic valuation of marine biodiversity and of marine recreational benefits [31,32].
The results also revealed that Croatian residents are more frequent visitors as they are more familiar with the attractiveness of the Lastovo Archipelago and, furthermore, they were also more likely to express a willingness-to-pay for biodiversity improvements, highlighting the fact that Croats put a high value on their natural heritage. This finding complements the results of the study ‘Valuation of Tourism Benefits for Croatian’s Protected Areas’, conducted in 2011, which evaluated visitors’ WTP to preserve and improve protected areas. The stated WTP values in this study indicated a strong willingness of Croats to contribute to managing Croatia‘s valuable natural resources, in addition to what they already contribute through the tax system.
In terms of policy conclusions, the results of this study emphasize the broad scope of additional management and funding options (see also [33,34,35]) since the provision of marine biodiversity is on the one hand costly, and on the other hand requires a broad range of management strategies and instruments (see [36]) in order to effectively conserve marine biodiversity. Both issues require more stringent governance frameworks. However, while the current study has stressed the high values attributed by visitors to the conservation of marine biodiversity, the results also show that a balanced approach, taking the preferences and perceptions of all groups of tourists into account, may lead to a differentiated and efficient funding scheme, and may also guide the concrete management instruments and steps for the conservation of biodiversity in the Adriatic sea. Based on the results of this survey, funding schemes might therefore go into the following directions. (1) A funding scheme targeted towards sailors should be managed on a national level. Since sailors have plenty of alternative routes, and substitutes to cruising to the Lastovo Islands, local or regional entry fees are inefficient as sailors could easily avoid paying local fees. Rather, a national permit system should be established with a flat fee in addition to a standardized mooring fee; revenues of this system could be collected and distributed to the several park administrations along the Croatian coast. (2) For visitors coming to the Lastovo Islands by ferry, contributions to biodiversity conservation may even be more easily collected in the form of a tourism (overnight) tax. Alternatively, the system of marine protected areas in Croatia might introduce discounts for regular visitors, or annual passes.
Regardless of which system may be implemented, the current study shows that detailed knowledge about the economics of destination choice can provide substantial insights for improving biodiversity conservation. Besides the different perceptions and activities of visitors to the marine parks, economic arguments of available substitutes can inform policy makers in their choice of appropriate, i.e., effective and efficient, funding instruments for marine park management.

Acknowledgments

The authors would like to thank the Lastovo Islands Marine Park administration and local community for their support in carrying out the field survey. Anonymous reviewers provided many helpful suggestions for substantial improvements of the paper. All errors are, of course, the responsibility of the authors.

Author Contributions

Michael Getzner, Michael Jungmeier and Matea Špika conceived and designed the survey and the frame of the research; Matea Špika carried out the survey; Michael Getzner and Matea Špika analyzed the data; Michael Getzner and Michael Jungmeier wrote the paper.

Conflicts of Interest

The authors declare no conflict of interest.

References

  1. United Nations Environmental Program (UNEP). Marine and Coastal Ecosystems and Human Well-Being: A Synthesis Report Based on the Findings of the Millennium Ecosystem Assessment; UNEP: Nairobi, Kenya, 2006. [Google Scholar]
  2. Convention on Biological Diversity (CBD). 2010 Biodiversity Target. 2010. Available online: www.cbd.int (accessed on 10 June 2016).
  3. Hansen, G.J.A.; Ban, N.C.; Jones, M.L.; Kaufman, L.; Panes, H.M.; Yasué, M.; Vincent, A.C.J. Hindsight in marine protected area selection: A comparison of ecological representation arising from opportunistic and systematic approaches. Biol. Conserv. 2011, 144, 1866–1875. [Google Scholar] [CrossRef]
  4. International Union for Conservation Nature (IUCN). Guidelines for Applying the IUCN Protected Area Management Categories to Marine Protected Areas; Best Practice Protected Area Guidelines; IUCN: Gland, Switzlerand, 2012. [Google Scholar]
  5. Jones, P.J.S. Governing Marine Protected Areas—Resilience through Diversity; Routledge: London, UK, 2014. [Google Scholar]
  6. McCrea-Strub, A.; Zeller, D.; Sumaila, U.R.; Nelson, J.; Balmford, A.; Pauly, D. Understanding the cost of establishing marine protected areas. Mar. Policy 2011, 35, 1–9. [Google Scholar] [CrossRef]
  7. Pascoe, S.; Doshi, A.; Dell, Q.; Tonks, M.; Kenyon, R. Economic value of recreational fishing in Moreton Bay and the potential impact of the marine park rezoning. Tour. Manag. 2014, 41, 53–63. [Google Scholar] [CrossRef]
  8. Ransom, K.P.; Mangi, S.C. Valuing Recreational Benefits of Coral Reefs: The Case of Mombasa Marine National Park and Reserve, Kenya. Environ. Manag. 2010, 45, 145–154. [Google Scholar] [CrossRef] [PubMed]
  9. Rees, S.E.; Attrill, M.J.; Austen, M.C.; Mangi, S.C.; Rodwell, L.D. A thematic cost-benefit analysis of a marine protected area. J. Environ. Manag. 2013, 114, 476–485. [Google Scholar] [CrossRef] [PubMed]
  10. Reithe, S.; Armstrong, C.W.; Flaaten, O. Marine protected areas in a welfare-based perspective. Mar. Policy 2014, 49, 29–36. [Google Scholar] [CrossRef] [Green Version]
  11. Sanchirico, J.N.; Cochran, K.A.; Emerson, P.M. Marine Protected Areas: Economic and Social Implications; Resources for the Future Discussion: Washington, DC, USA, 2002. [Google Scholar]
  12. Beaumont, N.J.; Austen, M.C.; Atkins, J.P.; Burdon, D.; Degraer, S.; Dentinho, T.P.; Derous, S.; Holm, P.; Horton, T.; van Ierland, E. Identification, definition and quantification of goods and services provided by marine biodiversity: Implications for the ecosystem approach. Mar. Pollut. Bull. 2007, 54, 253–265. [Google Scholar] [CrossRef] [PubMed]
  13. Cognetti, G.; Maltagliati, F. Ecosystem service provision: An operational way for marine biodiversity conservation and management. Mar. Pollut. Bull. 2010, 60, 1916–1923. [Google Scholar] [CrossRef] [PubMed]
  14. Ami, D.; Cartigny, P.; Rapaport, A. Can marine protected areas enhance both economic and biological situations? C. R. Biol. 2005, 328, 357–366. [Google Scholar] [CrossRef] [PubMed]
  15. Hussain, S.S.; Winrow-Griffin, A.; Moran, D.; Robinson, L.A.; Fofana, A.; Paramor, O.A.L.; Frid, C.L.J. An ex ante ecological economic assessment of the benefits arising from marine protected areas designation in the UK. Ecol. Econ. 2010, 69, 828–838. [Google Scholar] [CrossRef]
  16. McVittie, A.; Moran, D. Valuing the non-use benefits of marine conservation zones: An application to the UK Marine Bill. Ecol. Econ. 2010, 70, 413–424. [Google Scholar] [CrossRef]
  17. Arin, T.; Kramer, R.A. Divers’ willingness to pay to visit marine sanctuaries: An exploratory study. Ocean Coast. Manag. 2002, 45, 171–183. [Google Scholar] [CrossRef]
  18. Asafu-Adjaye, J.; Tapsuwan, S. A contingent valuation study of scuba diving benefits: Case study in Mu Ko Similan Marine National Park, Thailand. Tour. Manag. 2008, 29, 1120–1130. [Google Scholar] [CrossRef]
  19. Can, Ö.; Alp, E. Valuation of environmental improvements in a specially protected marine area: A choice experiment approach in Göcek Bay, Turkey. Sci. Total Environ. 2012, 439, 291–298. [Google Scholar] [CrossRef] [PubMed]
  20. Gelcich, S.; Amar, F.; Valdebenito, A.; Castilla, J.C.; Fernandez, M.; Godoy, C.; Biggs, D. Financing marine protected areas through visitor fees: Insights from tourists’ willingness to pay in Chile. Ambio J. Hum. Environ. 2013, 42, 975–984. [Google Scholar] [CrossRef] [PubMed]
  21. Schuhmann, P.W.; Casey, J.F.; Horrocks, J.A.; Oxenford, H.A. Recreational SCUBA divers’ willingness to pay for marine biodiversity in Barbados. J. Environ. Manag. 2013, 121, 29–36. [Google Scholar] [CrossRef] [PubMed]
  22. Uyarra, M.C.; Gill, J.A.; Côté, I.M. Charging for Nature: Marine park fees and management from a user perspective. Ambio J. Hum. Environ. 2010, 39, 515–523. [Google Scholar] [CrossRef] [Green Version]
  23. Ressurreição, A.; Gibbons, J.; Kaiser, M.; Dentinho, T.C.; Zarzycki, T.; Bentley, C.; Austen, M.; Burdon, D.; Atkins, J.; Santos, R.S.; et al. Different cultures, different values: The role of cultural variation in public’s WTP for marine species conservation. Biol. Conserv. 2012, 145, 148–159. [Google Scholar]
  24. Togridou, A.; Hovardas, T.; Pantis, J.D. Determinants of visitors’ willingness to pay for the National Marine Park of Zakynthos, Greece. Ecol. Econ. 2006, 60, 308–319. [Google Scholar] [CrossRef]
  25. Getzner, M.; Thapa, K. Preferences of international tourists for conserving ecosystem services at Langtang National Park (Nepal). Environ. Nat. Resour. Res. 2015, 5, 66–80. [Google Scholar] [CrossRef]
  26. Katsanevakis, S.; Levin, N.; Coll, M.; Giakoumi, S.; Shkedi, D.; Mackelworth, P.; Lan, L.; Velegrakis, A.; Koutsoubas, D.; Caric, H.; et al. Marine conservation challenges in an era of economic crisis and geopolitical instability: The case of the Mediterranean Sea. Mar. Policy 2014, 51, 31–39. [Google Scholar] [CrossRef]
  27. Jakl, Z.; Bitunjac, I.; Medunic-Orlic, G. Association for nature, environment and sustainable development. In Nautical Tourism Development in the Lastovo Islands Nature Park; Sunce: Split, Croatia, 2009. [Google Scholar]
  28. Getzner, M.; Svajda, J. Preferences of tourists with regard to changes of the landscape of the Tatra National Park in Slovakia. Land Use Policy 2015, 48, 107–119. [Google Scholar] [CrossRef]
  29. Getzner, M.; Färber, B.; Yamu, C. 2D Versus 3D: The relevance of the mode of presentation for the economic valuation of an Alpine landscape. Sustainability 2016, 8, 591. [Google Scholar] [CrossRef]
  30. Lienhoop, N.; Ansmann, T. Valuing water level changes in reservoirs using two stated preference approaches: An exploration of validity. Ecol. Econ. 2011, 70, 1250–1258. [Google Scholar] [CrossRef]
  31. Beaumont, N.J.; Austen, M.C.; Mangi, S.C.; Townsend, M. Economic valuation for the conservation of marine biodiversity. Mar. Pollut. Bull. 2008, 56, 386–396. [Google Scholar] [CrossRef] [PubMed]
  32. Chae, D.R.; Wattage, P.; Pascoe, S. Recreational benefits from a marine protected area: A travel cost analysis of Lundy. Tour. Manag. 2012, 33, 971–977. [Google Scholar] [CrossRef]
  33. Flannery, W.; O’Hagan, A.M.; O’Mahony, C.; Ritchie, H.; Twomey, S. Evaluating conditions for transboundary Marine Spatial Planning: Challenges and opportunities on the island of Ireland. Mar. Policy 2015, 51, 86–95. [Google Scholar] [CrossRef]
  34. Stelzenmüller, V.; Fernández, T.V.; Cronin, K.; Röckmann, C.; Pantazi, M.; Vanaverbeke, J.; Stamford, T.; Hostens, K.; Pecceu, E.; Degraer, S.; et al. Assessing uncertainty associated with the monitoring and evaluation of spatially managed areas. Mar. Policy 2015, 51, 151–162. [Google Scholar] [CrossRef]
  35. Voyer, M.; Gladstone, W.; Goodall, H. Obtaining a social licence for MPAs: Influences on social acceptability. Mar. Policy 2015, 51, 260–266. [Google Scholar] [CrossRef]
  36. Worboys, G.L.; Lockwood, M.; Lacy, T.D. Protected Area Management, Principles and Practice; Oxford University Press: Melbourne, Australia, 2005. [Google Scholar]
Figure 1. Location of the Lastovo archipelago nature park (Croatia) (source: [27]).
Water 09 00002 g001
Figure 2. Pictures and descriptions of the status quo of marine biodiversity at Lastovo Islands, and visualization and description of management Scenarios 1 (a) and 2 (b) (source: own pictures and manipulations).
Water 09 00002 g002
Figure 3. Frequency and cumulated percent of WTP bids (in EUR) of respondents: (a) group A visitors (n = 153); (b) group B visitors (n = 87).
Water 09 00002 g003
Table 1. Variables of the empirical estimations.
Variable NameDescription
Dependent variables
TRAVELFRQFrequency of trips (vacations) at Lastovo Islands in the last five years for the status quo, and—in the pooled dataset—if one of the two scenarios were realized
WTPWillingness-to-pay (WTP) of respondents for the realization of one of the scenarios (Euros (EUR))
Explanatory Variables
Ti
TRAVELCOSTTravel costs of visitors (EUR) from their home (residence) to Lastovo Islands
LASTOVODEST= 1 for respondents with the Lastovo Islands as their main destination
NIGHTSNumber of nights respondents stay in the area
Si
INCOMENet income of the respondent’s household (class mean, EUR)
AGE_CLASSClass mean of age of respondents (six classes ranging from ‘below 20’ to ‘over 60’)
CROATIA= 1 for residents of Croatia
GROUP= 1 for visitors coming with their own (or rented) boat (group B visitors)
Ri
ACT_DIVE= 1 for respondents for whom diving is one of their main activities
SATISF_VERY= 1 for respondents stating that they were very satisfied with their vacations at Lastovo Islands (on a 5-point Likert scale)
DEGRADATION= 1 for respondents who thought that the environmental quality at Lastovo Islands was reduced by the large number of tourists in the area
Ei
PROTECTED= 1 for respondents who stated that they knew they would visit a protected area
MOTIVEWTP_HERITAGE= 1 for respondents whose main motive for expressing a willingness-to-pay was conserving heritage (bequest motive)
MOTIVEWTP_BIODIV= 1 for respondents whose main motive for expressing a willingness-to-pay was conserving biodiversity (existence motive)
REASON_CLEAN=1 for respondents who stated that they came to Lastovo Island mainly because of the clean environment (e.g., water quality)
REASON_NATURE= 1 for respondents who stated that they came to Lastovo Island mainly because of the undisturbed natural environment (e.g., high biodiversity)
MARINEPARKS= 1 for respondents who are familiar with marine parks and visited such parks before
SCEN1= 1 for Scenario 1 (“Effective management”)
SCEN2= 1 for Scenario 2 (“Marine park and effective zoning”)
Table 2. Descriptive results: traveling to Lastovo Islands.
Variable/DimensionGroup A Visitors (n = 153)Group B Visitors (n = 87)
Concern of environmental protection (mean [std.dev.] on a five point Likert Scale)4.24 [0.80]4.15 [0.83]
Lastovo Islands Nature Park as the only destination of the vacations69%6%
Place of residence
Croatia41.8%5.7%
Italy17.6%25.3%
Slovenia17.6%16.1%
Austria4.6%13.8%
Germany4.6%13.8%
Others13.7%25.3%
Duration of the journey (home of the respondent to Lastovo Islands) (h, mean)12.7519.53
Duration of the journey (home of the respondent to Lastovo Islands) (h, std.dev.)6.8311.77
Length of distance (kms, mean)767.521200.57
Length of distance (kms, std.dev.)1055.221732.16
Main reason for visiting Lastovo Islands
Natural underwater, terrestrial areas26.1%28.7%
Cleanliness of environment (Water, air)9.8%13.8%
Remote area, not crowded43.1%36.8%
Recommended by family, friends14.4%17.2%
Coincidence1.3%3.4%
Table 3. Descriptive results: visiting Lastovo Islands.
Variable/DimensionGroup A Visitors (n = 153)Group B Visitors (n = 87)
Main activities in the area
Fishing2.6%6.9%
Swimming59.5%79.3%
Hiking43.8%11.5%
Photography17.0%13.8%
Scuba diving5.9%2.3%
Snorkling23.5%18.4%
Cycling7.2%2.3%
Other activities7.2%12.6%
Frequency of visits to the area
Two times or more per year5.2%2.3%
Once per year28.1%33.3%
About once every 2 years9.2%12.6%
About once every 5 years2.6%6.9%
More rarely then once every 5 years5.2%9.2%
First time at Lastovo Islands49.7%35.6%
Change of visit frequency for Scenario 1
More often16.3%10.3%
Same frequency83.0%82.8%
More rarely or not anymore0.7%6.9%
Change of visit frequency for Scenario 2
More often19.6%16.1%
Same frequency79.1%77.0%
More rarely or not anymore1.3%6.9%
Mean frequency of visits
Status quo (mean)2.792.71
Status quo (std.dev.)2.792.32
Scenario 1 (mean)4.032.91
Scenario 1 (std.dev.)3.442.27
Scenario 2 (mean)4.143.30
Scenario 2 (std.dev.)3.562.95
Visits to other marine parks before (mean [std.dev.])75.2% [43.3%]89.7% [30.6%]
Perceived degradation of ecological values by human activities (mean [std.dev.])43.8% [49.8%]37.9% [48.8%]
Destinations/activities in case of restrictions of access
Visit Lastovo islands anyway96.1%87.4%
Visit some other island in Croatia2.6%11.5%
Choose some other destination in Croatia1.3%1.1%
Table 4. Descriptive results: biodiversity conservation and willingness-to-pay.
Variable/DimensionGroup A Visitors (n = 153)Group B Visitors (n = 87)
Main objectives of marine biodiversity conservation
Biodiversity conservation74.5%67.8%
Tourism and recreation22.0%39.0%
Sustainable use of natural resources6.5%25.3%
Sustainable fishing4.6%2.3%
Education and information4.6%2.3%
Regional development2.6%1.1%
Positive willingness-to-pay for Scenario 1 (mean [std.dev.])87.6% [33.1%]77.0% [42.3%]
Positive willingness-to-pay for Scenario 2 (mean [std.dev.])98.0% [31.5%]75.0% [43.7%]
Willingness-to-pay (WTP) of respondents for the two scenarios
WTP for Scenario 1 (mean), EUR3.412.03
WTP for Scenario 1 (std.dev.), EUR3.862.19
WTP for Scenario 2 (mean), EUR4.312.75
WTP for Scenario 2 (std.dev.), EUR4.323.09
Motives to state a positive willingness-to-pay
To support conservation44.8%39.1%
To enhance recreational activities in the area8.0%10.3%
To endow future generations with natural resources14.9%13.8%
I was very satisfied by the visit and this is a way to show my appreciation6.9%6.9%
The Government alone cannot support all the park’s programs and activities2.3%4.6%
Table 5. Econometric results: travel frequency of different visitor groups to Lastovo Islands.
VariableGroup A VisitorsGroup B VisitorsPooled Sample
Coeff.z-Stat.Sign.Coeff.z-Stat.Sign.Coeff.z-Stat.Sign.
C1.2615.677***−0.066−0.231 0.6393.588***
TRAVELCOST−0.003−3.526***0.0010.699 −0.002−2.66***
LASTOVODEST0.3103.628***0.0600.256 0.2833.667***
NIGHTS0.0336.375***0.0573.500***0.0285.617***
AGE_CLASS−0.01−2.872***0.0061.273 −0.003−1.01
CROATIA0.1851.947*0.3161.295 0.3424.206***
GROUP −0.371−4.049***
ACT_DIVE−0.309−3.788***−0.041−0.358 −0.259−3.807***
SATISF_VERY0.1481.915*−0.121−1.192 0.071.132
PROTECTED−0.237−1.636*0.5393.022***0.0650.577
MOTIVEWTP_HERITAGE0.2813.573***0.3052.440**0.2844.219***
REASON_CLEAN0.2842.532**−0.374−2.584***0.030.328
SCEN10.3644.291***0.0900.796 0.2643.762***
SCEN20.3954.669***0.2161.946*0.3274.69***
Pseudo-R20.3050.1210.218
S.E. of regression2.7762.3742.724
Log likelihood−989.333−524.851−1544.288
LR statistic513.333 ***131.036 ***607.234 ***
Akaikeinfocriterion4.3724.3204.331
Schwarz criterion4.4984.2064.427
n15387240
Total (pooled) n459261720
Notes: Dependent variable: TRAVELFRQ; other socio-economic variables such as gender or education are not included as explanatory variables owing to potential multi-collinearity (e.g., with respect to income of households). Count data model (maximum likelihood estimation), negative binomial distribution assumed; *** p < 0.01, ** p < 0.05, * p < 0.1.
Table 6. Econometric results: Determinants of willingness-to-pay for the improvement of marine biodiversity of visitors to Lastovo Islands.
VariableGroup A VisitorsGroup B VisitorsPooled Sample
Coeff.z-Stat.Sign.Coeff.z-Stat.Sign.Coeff.z-Stat.Sign.
C0.8552.544**1.5692.151**1.1234.139***
LASTOVODEST−0.286−2.382**−1.064−2.198**−0.282−2.542**
NIGHTS0.0293.799***0.0170.625 0.0263.795***
INCOME0.0022.828***−0.001−0.612 0.0011.423
AGE_CLASS−0.02−3.446***0.0091.164 −0.009−1.947*
CROATIA0.3382.875***0.3230.756 0.3002.762***
GROUP −0.329−2.400**
ACT_DIVE0.0760.588 −0.046−0.229 0.0490.372
DEGRADATION0.2922.630***0.4692.727***0.3073.453***
PROTECTED−0.357−1.641*−1.210−4.455***−0.633−3.977***
MOTIVEWTP_HERITAGE0.4553.287***0.8703.527***0.4874.229***
MOTIVEWTP_BIODIV0.3412.623***0.6493.384***0.3753.687***
REASON_NATURE0.5044.153***0.0280.147 0.3233.34***
MARINEPARKS0.3562.708***−0.573−1.957*0.1661.423
SCEN20.2242.114**0.2931.863*0.2542.953***
Pseudo-R20.2300.1270.207
Log likelihood−1088.155−501.137−1609.122
LR statistic101.296 ***50.089140.990 ***
Pearson SSR324.169185.658563.611
n15387240
Total (pooled) n306261720
Notes: General linear model, maximum likelihood estimation, negative binomial distribution and log link assumed; *** p < 0.01, ** p < 0.05, * p < 0.1.

