
Increasing Winter Baseflow in Response to Permafrost Thaw and Precipitation Regime Shifts in Northeastern China


Abstract
:1. Introduction
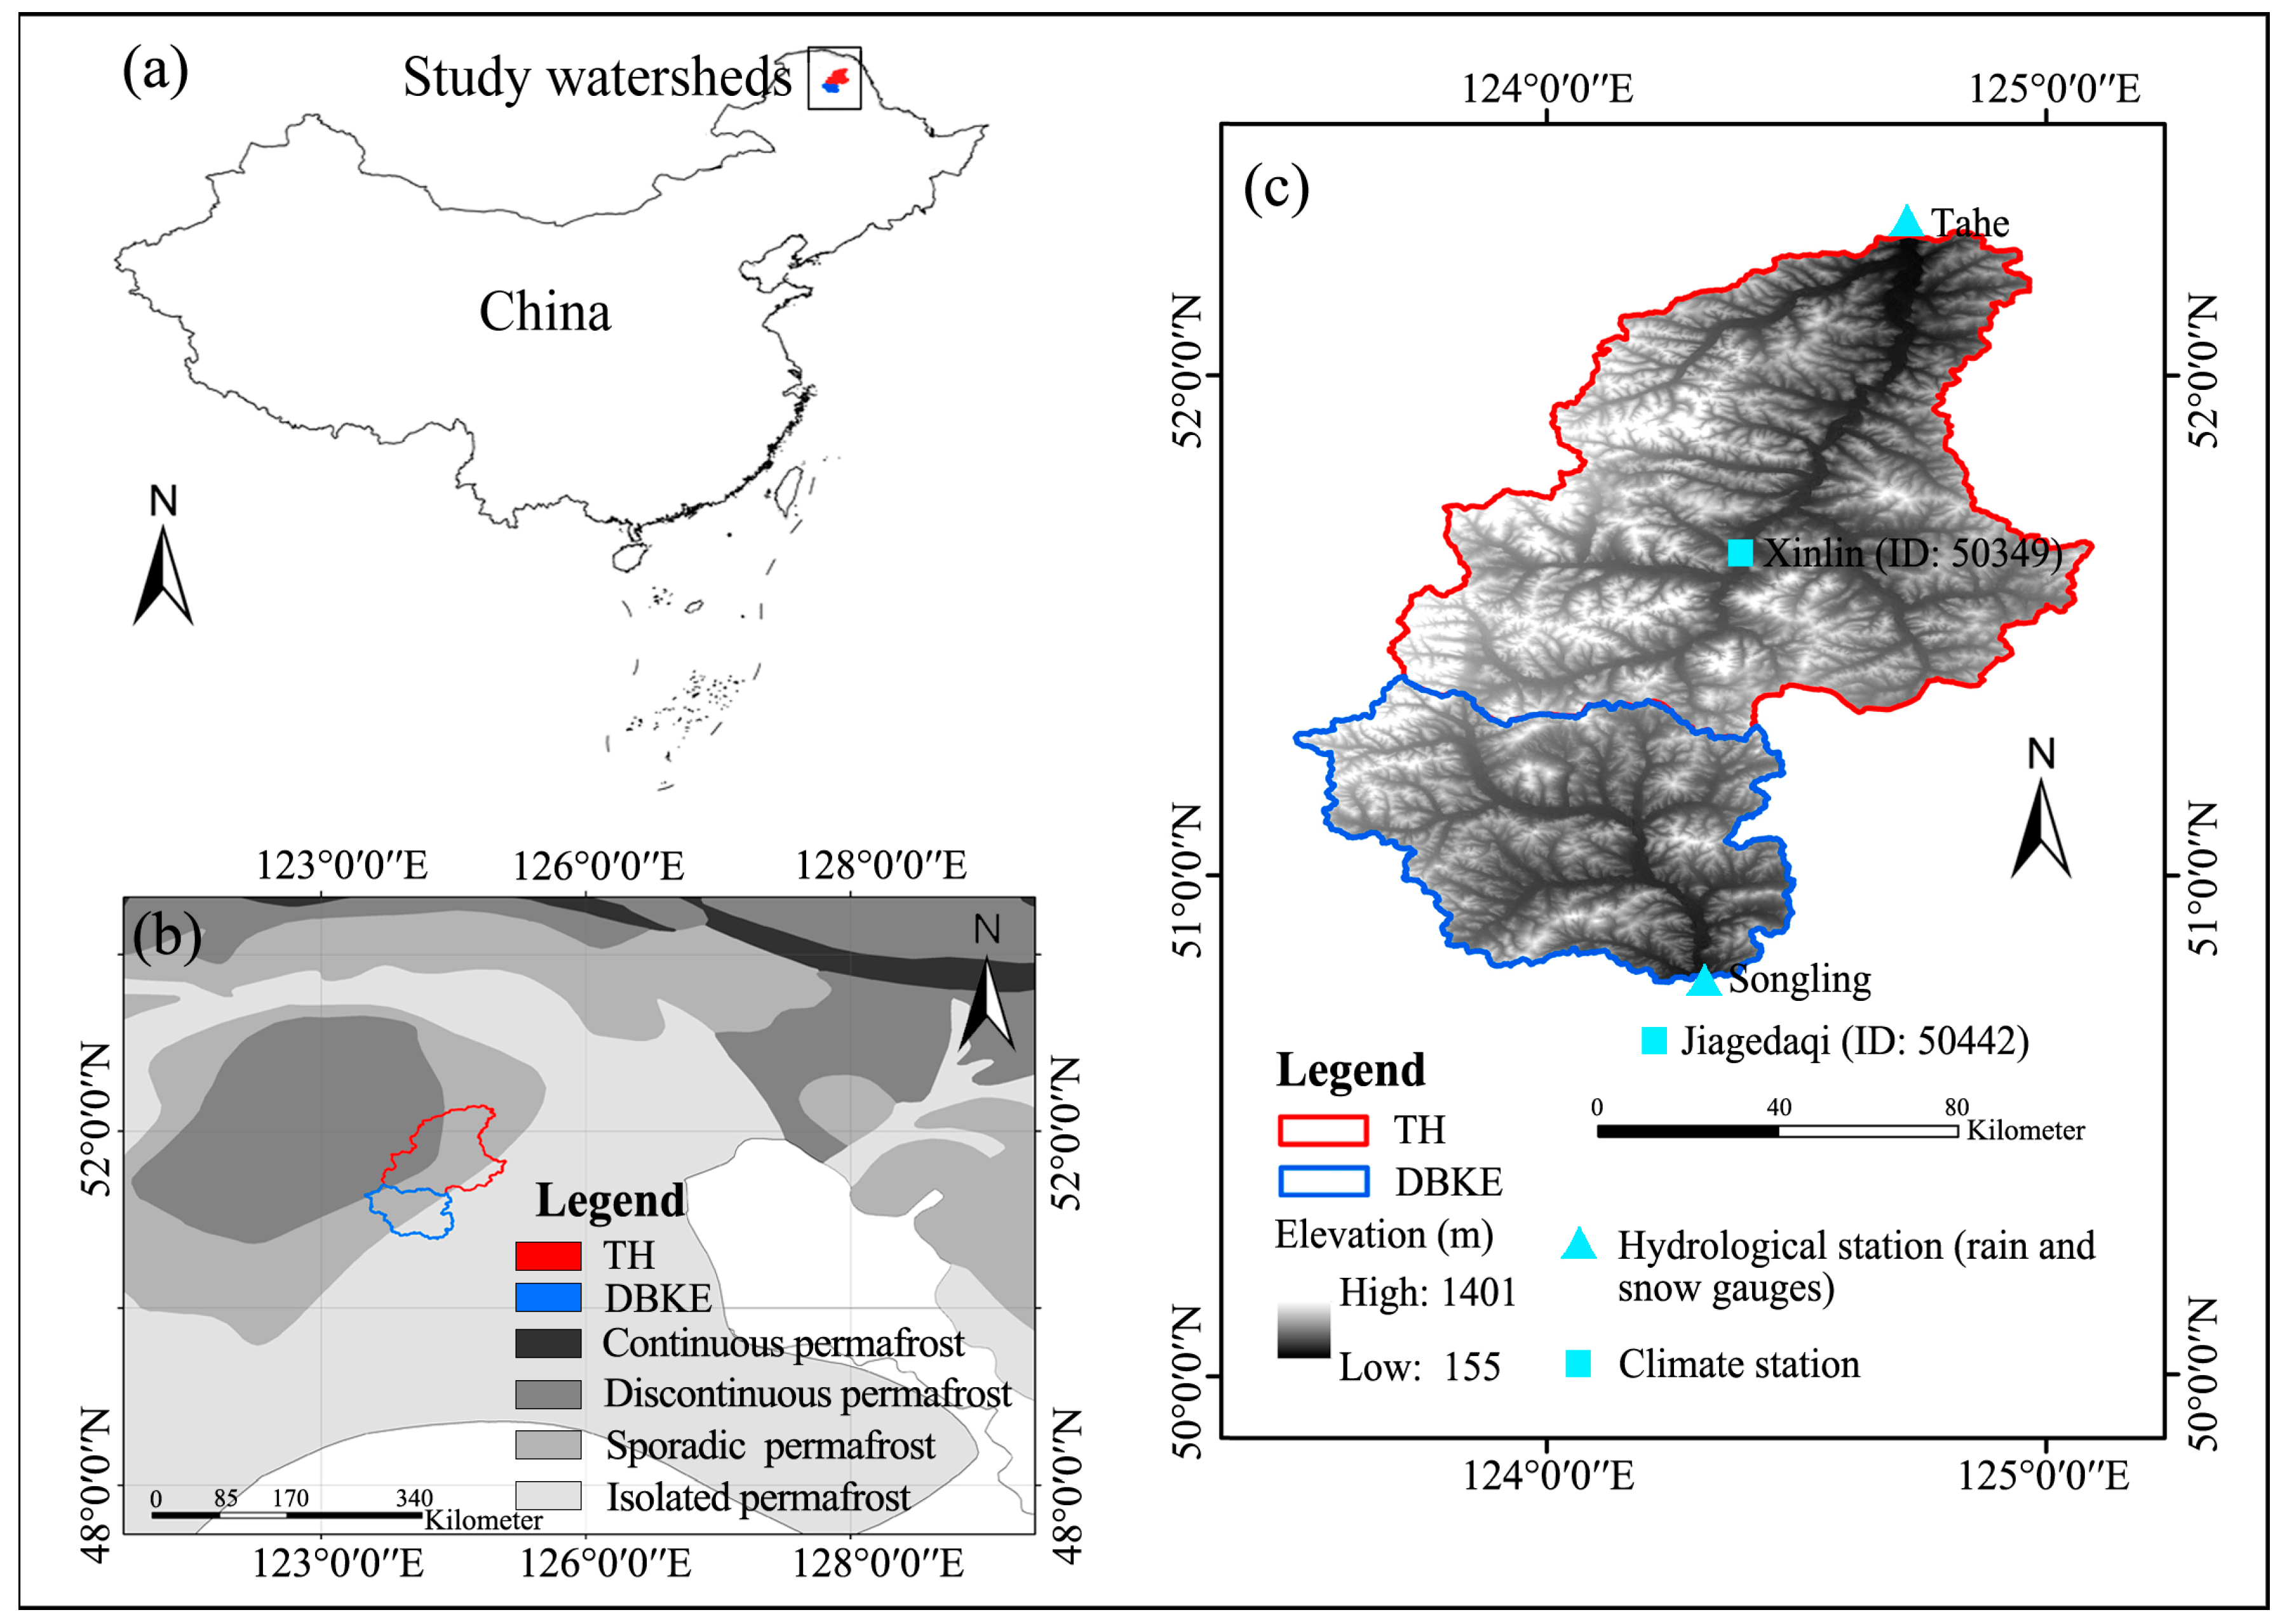
2. Study Area
3. Data and Methods
3.1. Data
3.2. Methods
3.2.1. Trend Analysis
3.2.2. Time Series Correlation Analysis
3.2.3. Breakpoints Analysis
4. Results
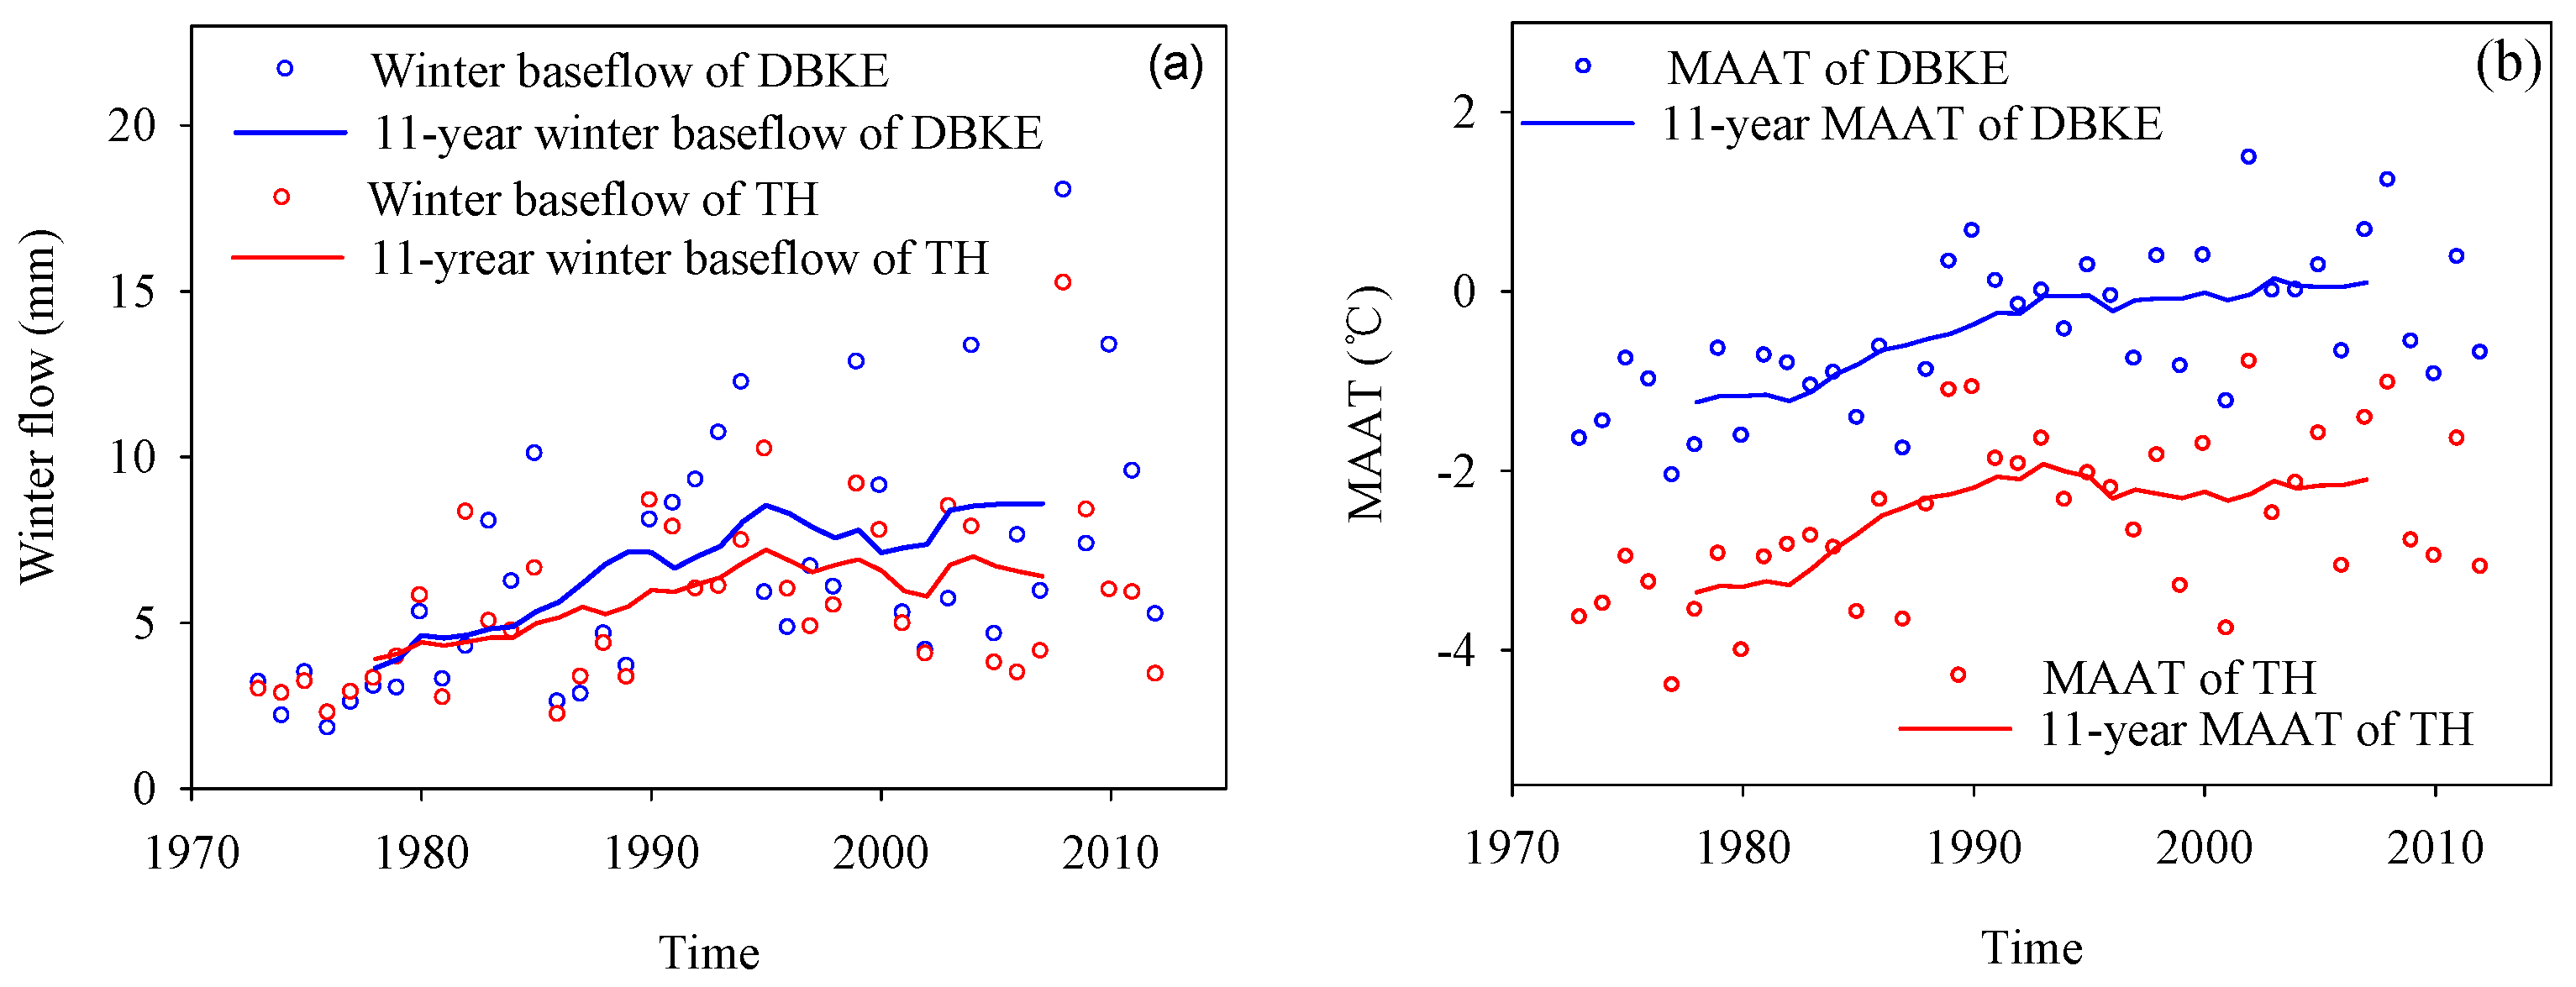
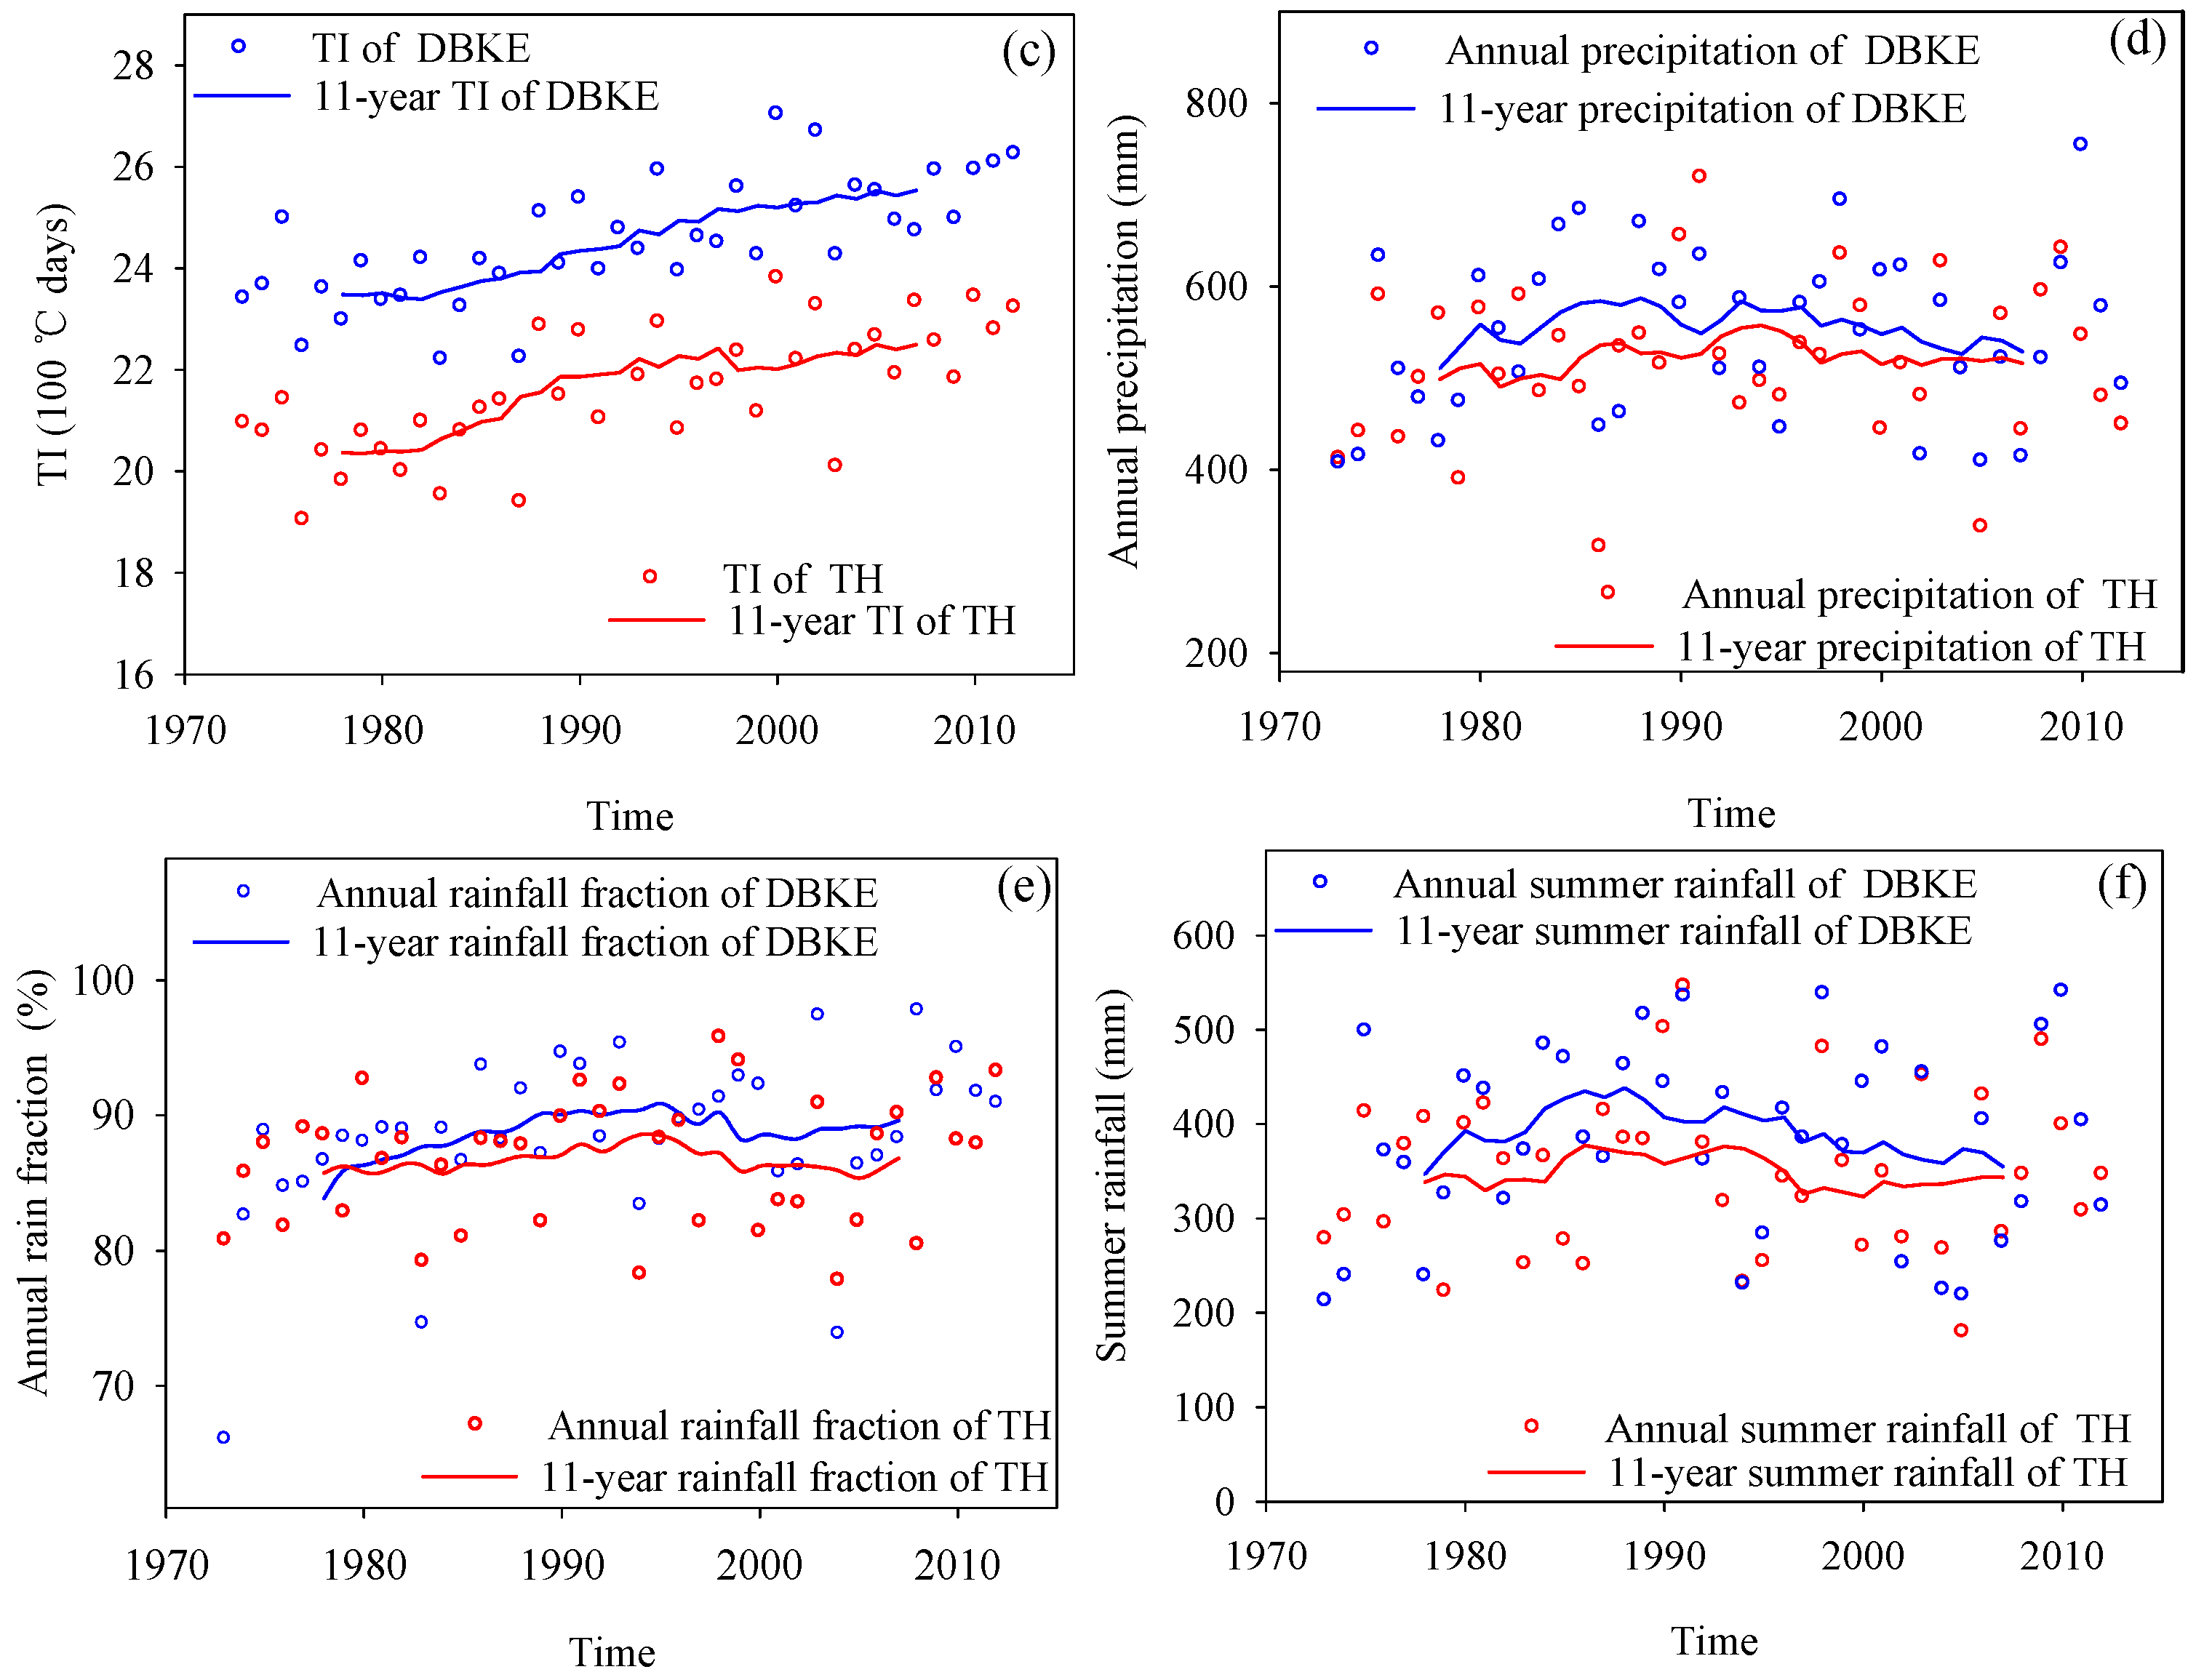
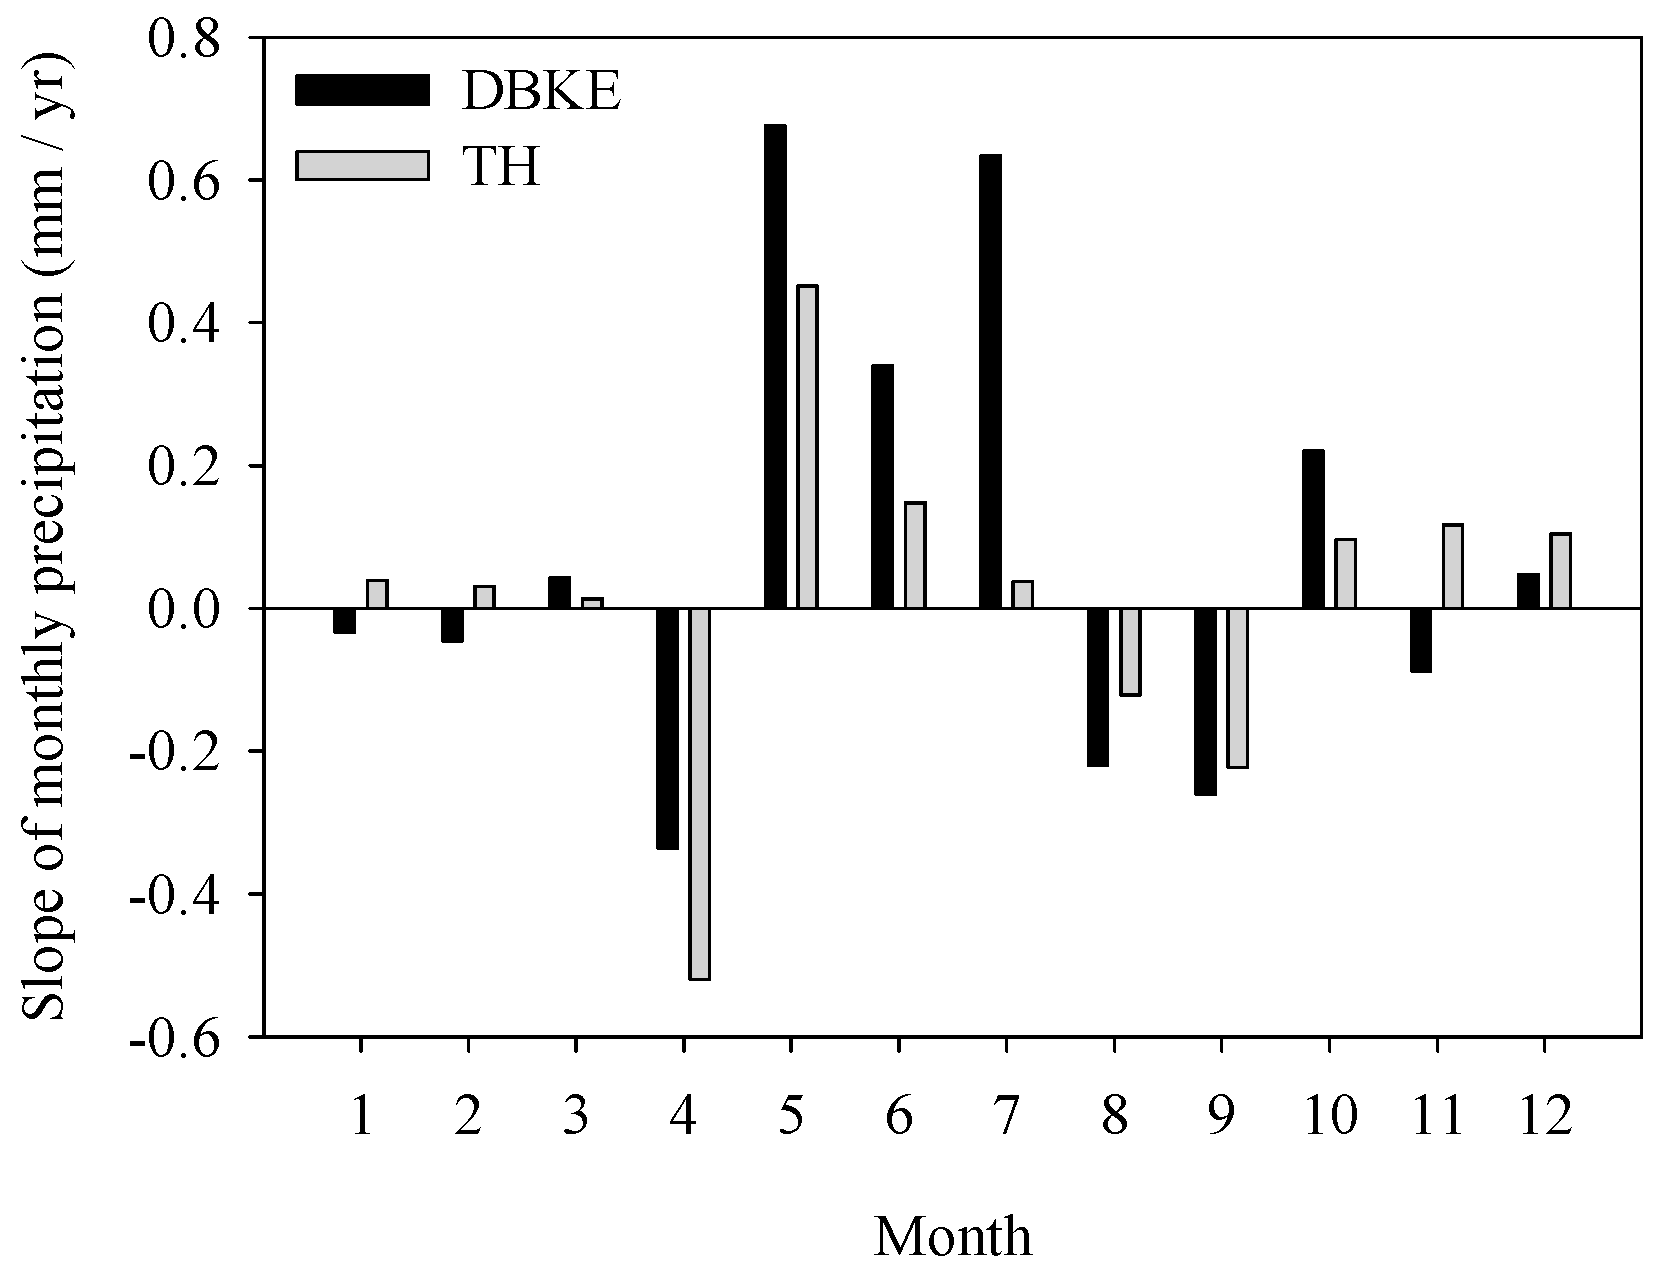
4.1. Trends in Long-Term Winter Baseflow, Permafrost Thaw Metrics, and Precipitation
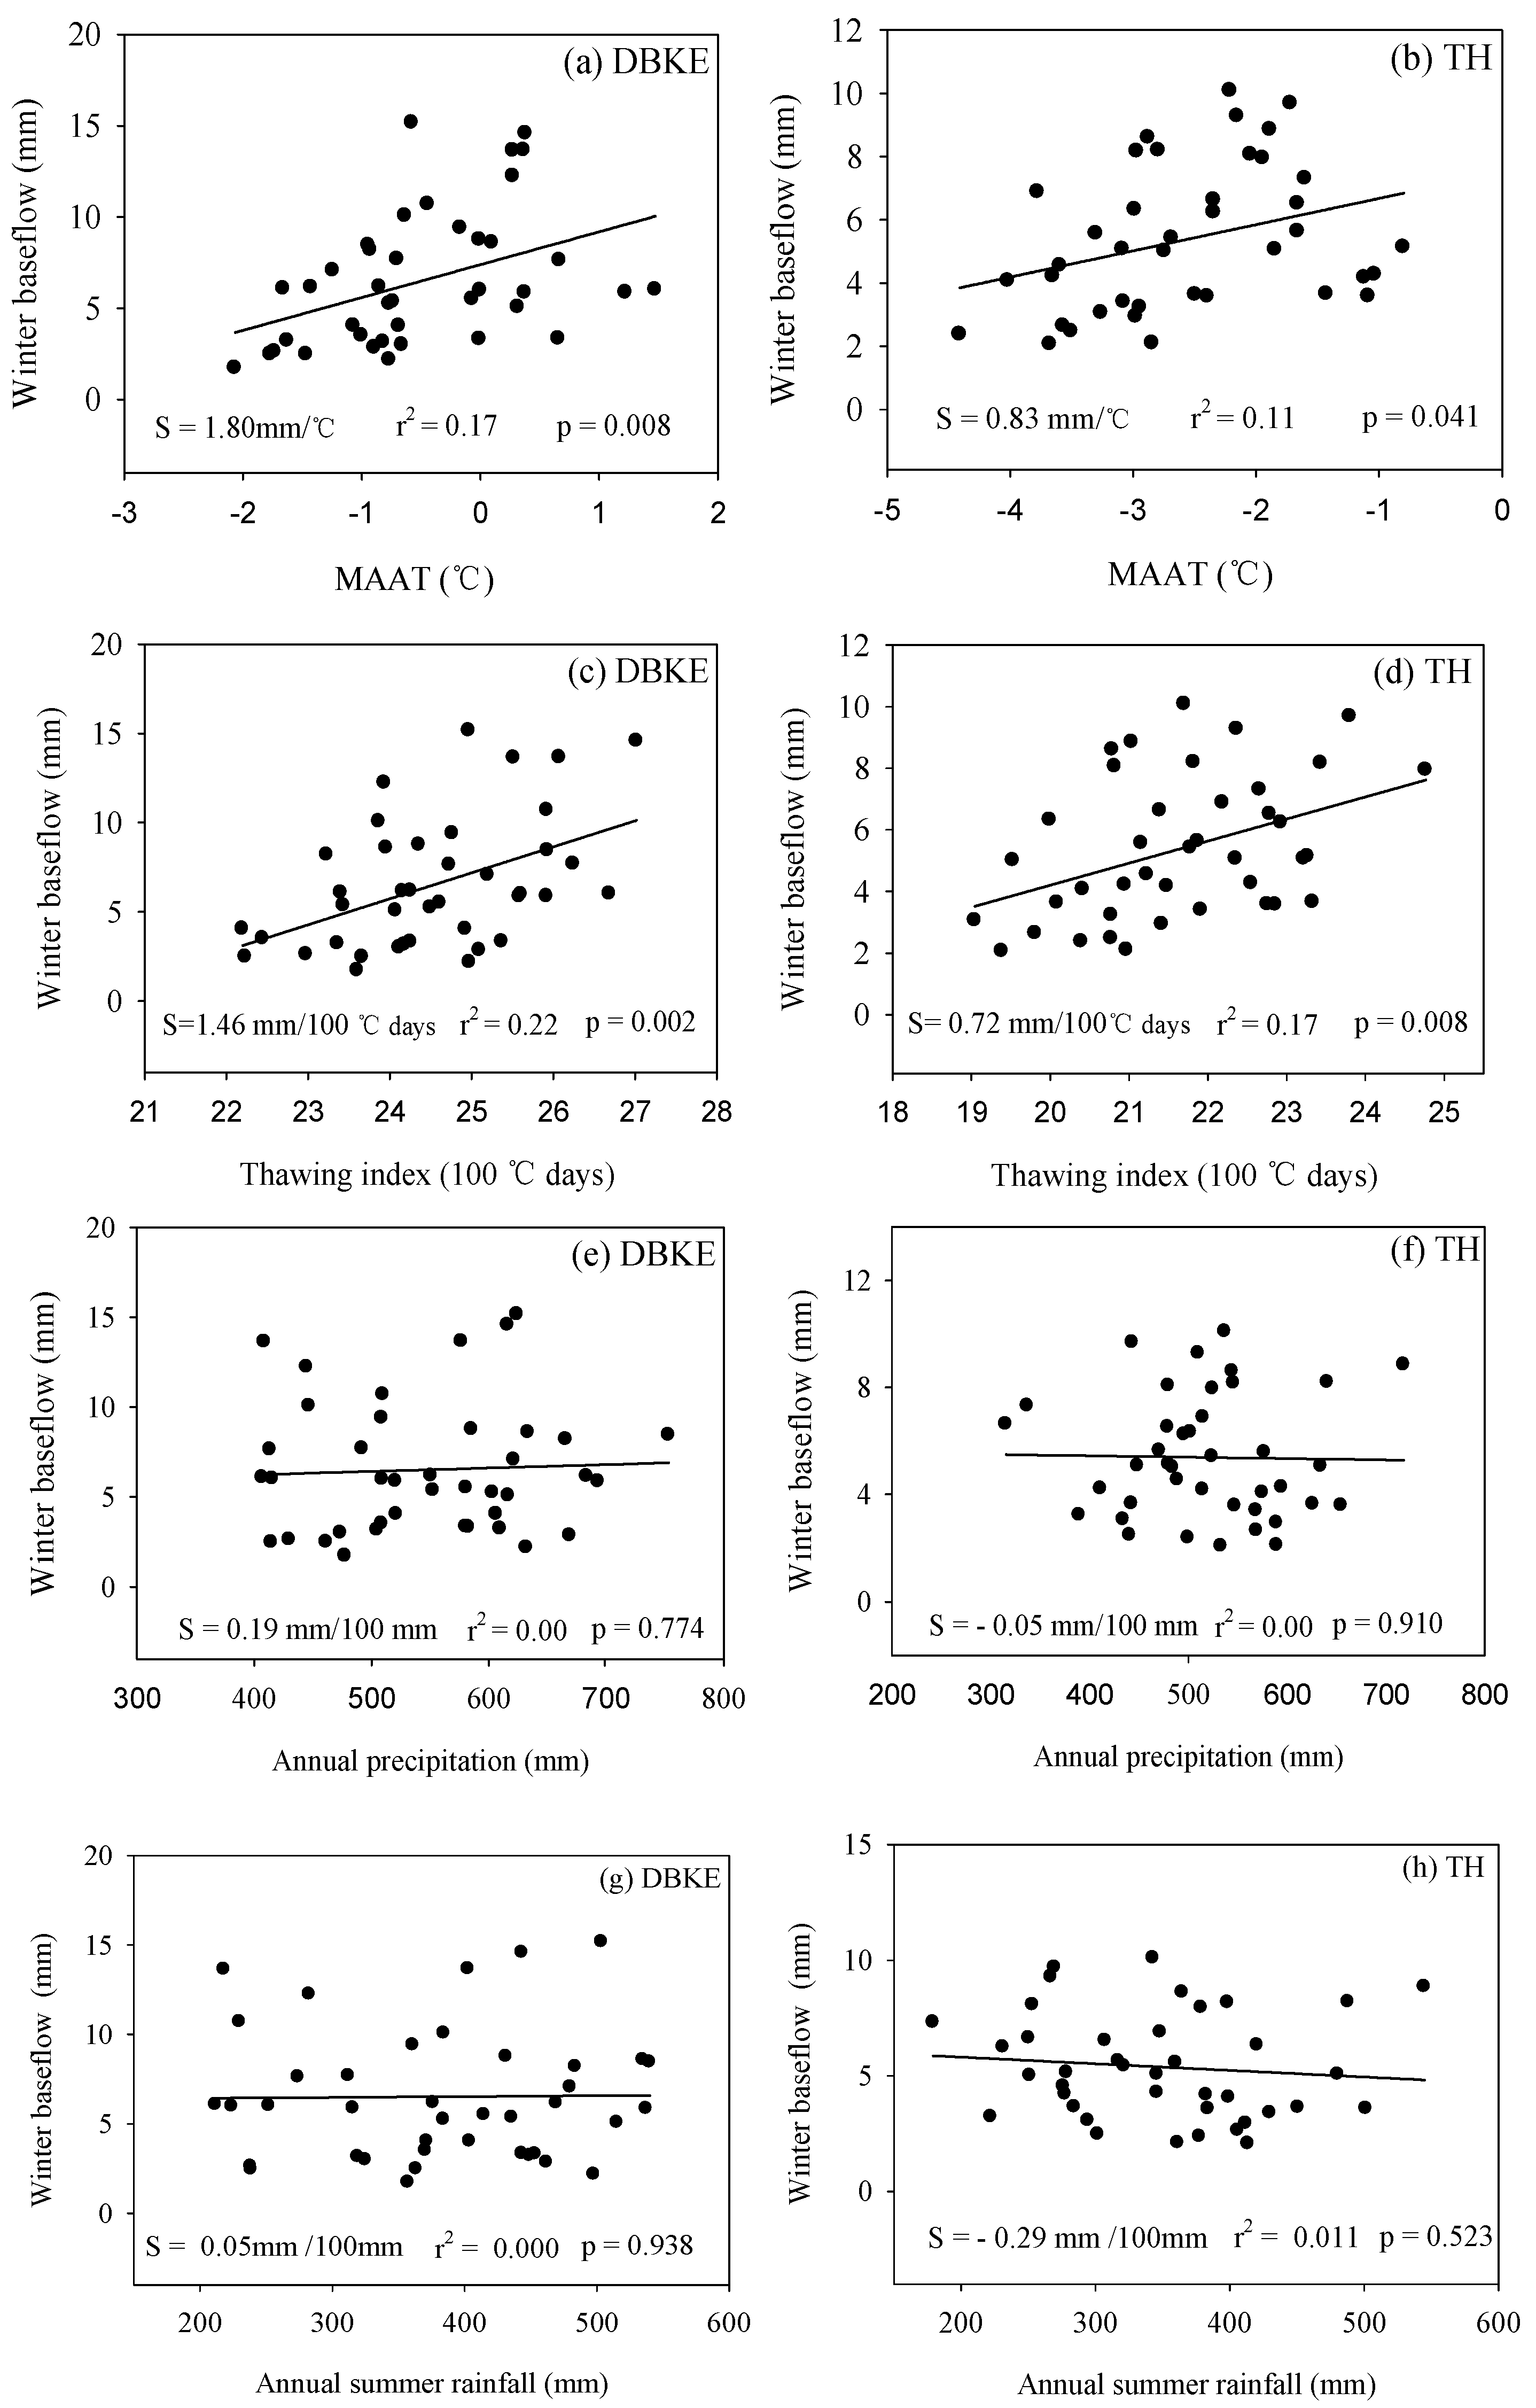
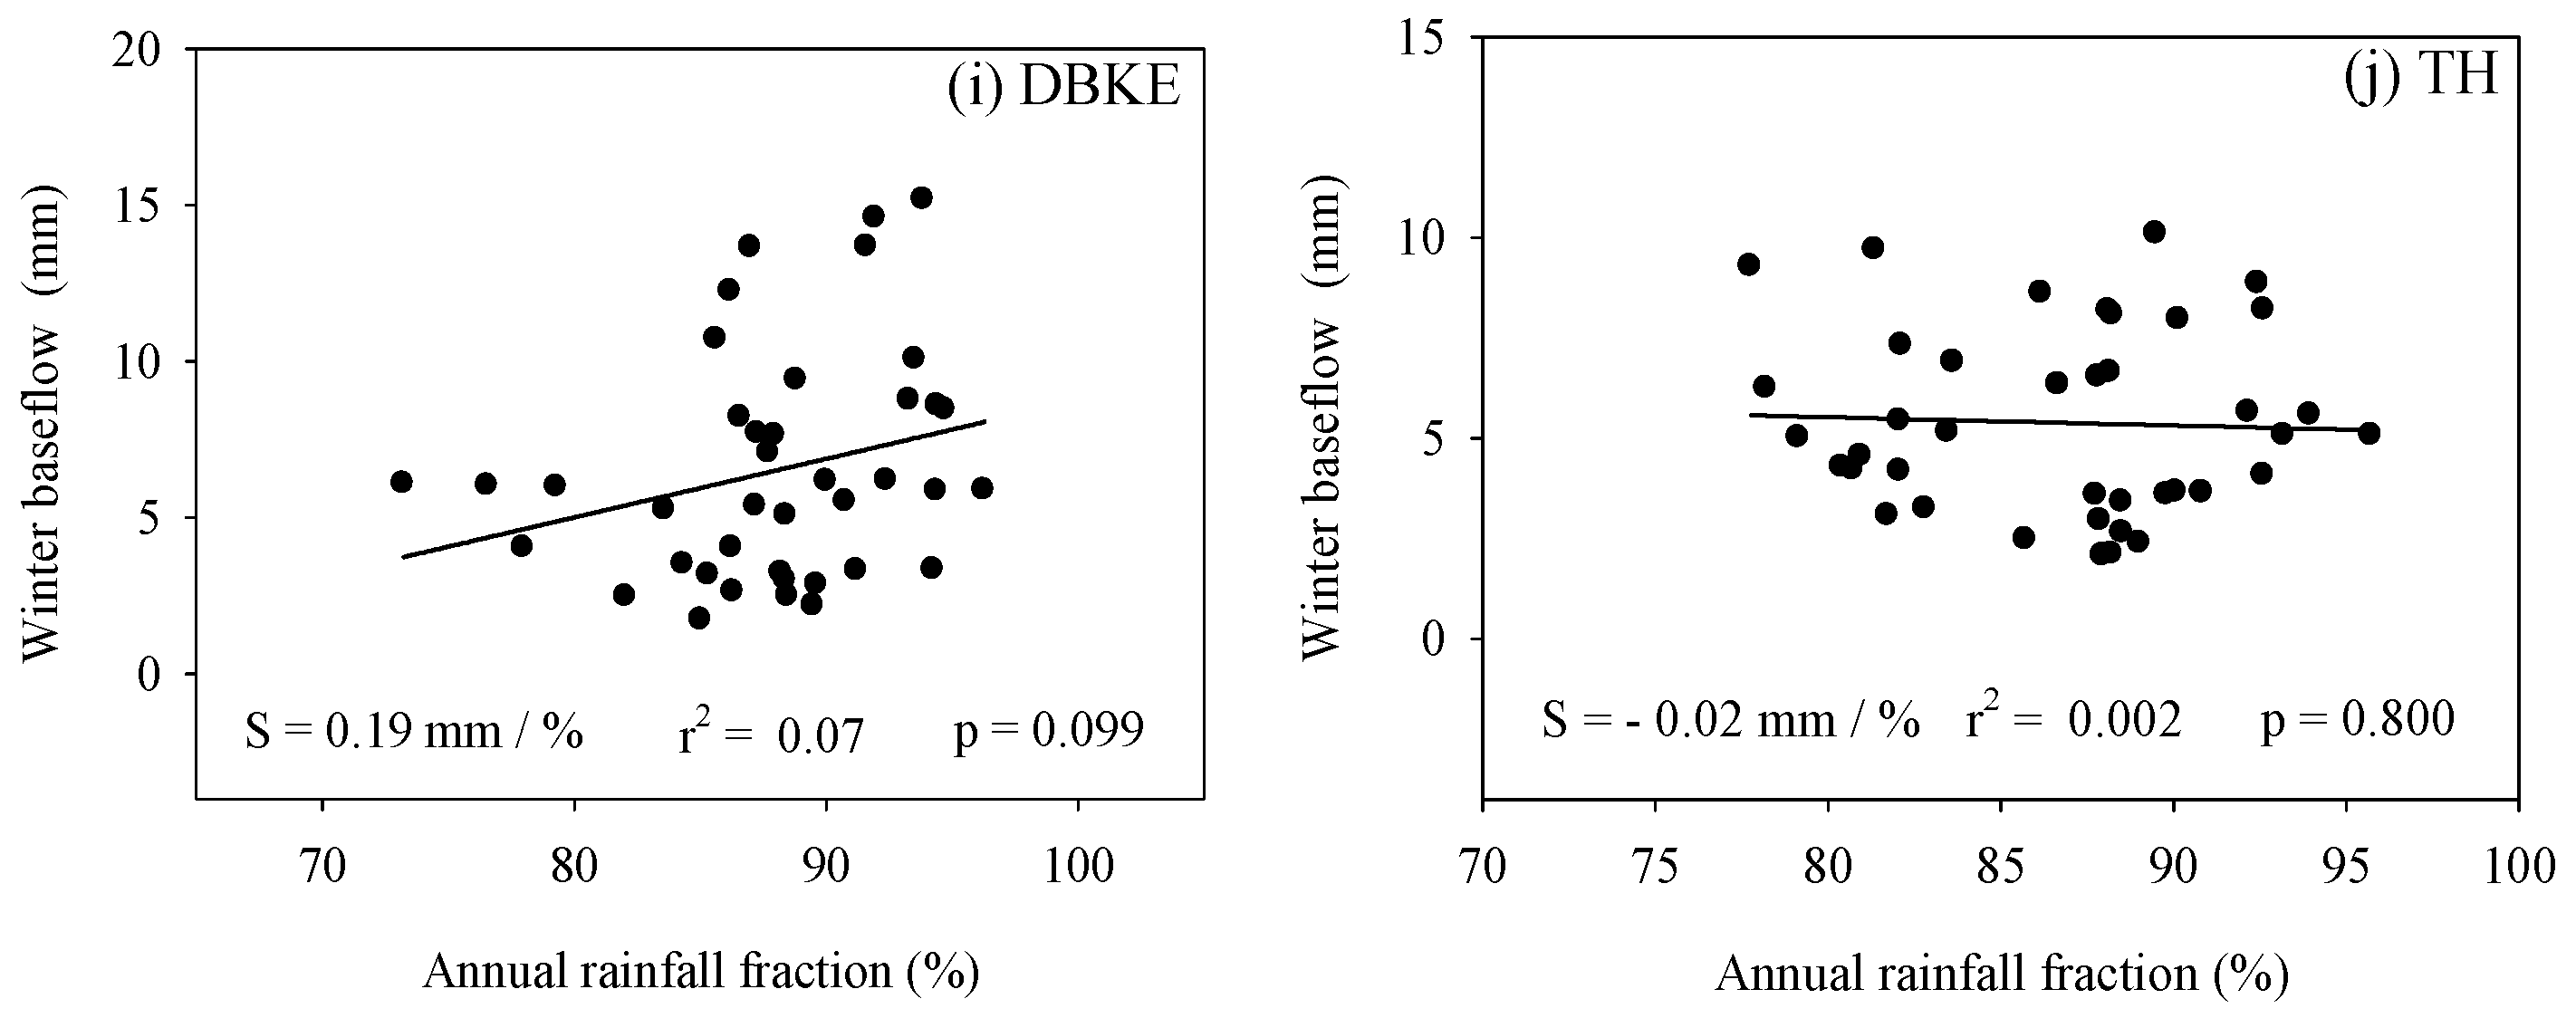
4.2. Relationships between Winter Baseflow, Permafrost Thaw Metrics, and Precipitation
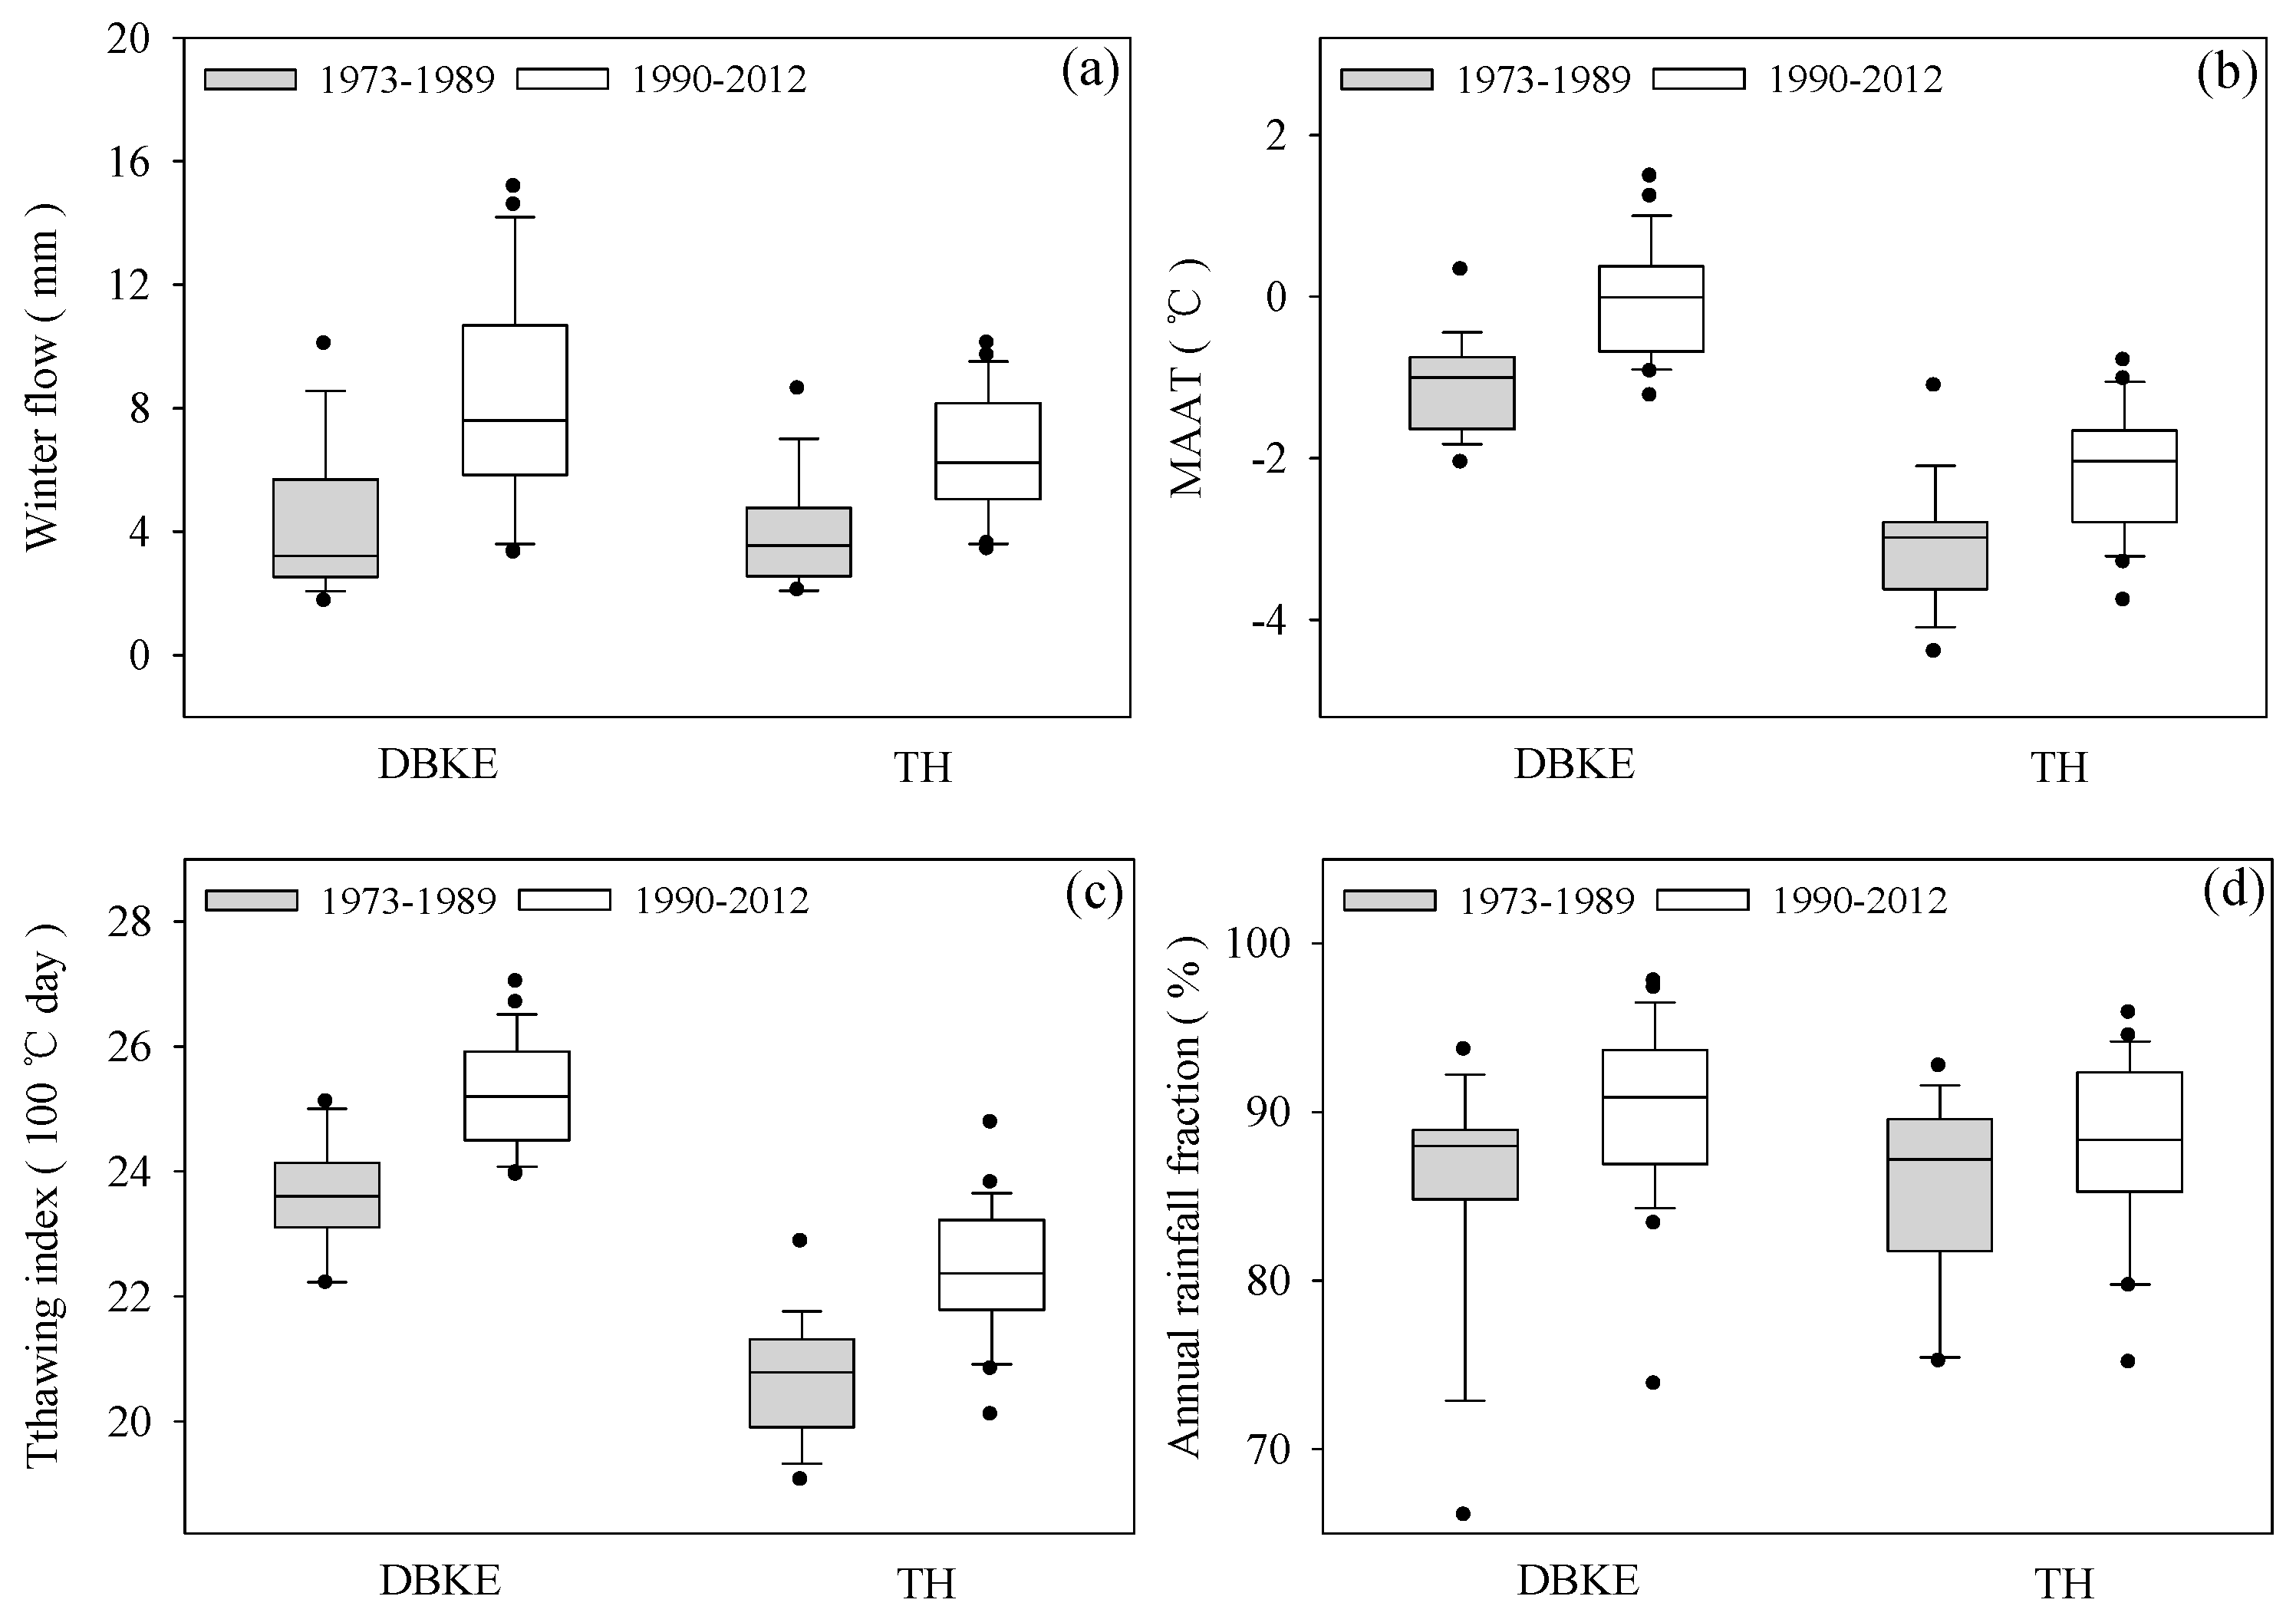
4.3. Phase Shifts in Winter Baseflow
5. Discussion
5.1. The Impacts of Climate Warming-Induced Permafrost Thaw on Winter Baseflow
5.2. Impact of Climate Warming-Induced Precipitation Regime Changes on Winter Baseflow
5.3. Lagged Effects of Winter Baseflow in Response to Climate Warming
6. Conclusions
Acknowledgments
Author Contributions
Conflicts of Interest
References
- Held, I.M.; Soden, B.J. Robust responses of the hydrological cycle to global warming. J. Clim. 2006, 19, 5686–5699. [Google Scholar] [CrossRef]
- Dai, A. Increasing drought under global warming in observations and models. Nat. Clim. Chang. 2013, 3, 52–58. [Google Scholar] [CrossRef]
- Stocker, T.F.; Raible, C.C. Climate change: Water cycle shifts gear. Nature 2005, 434, 830–833. [Google Scholar] [CrossRef] [PubMed]
- Immerzeel, W.W.; Beek, L.P.H.; Konz, M.; Shrestha, A.B.; Bierkens, M.F.P. Hydrological response to climate change in a glacierized catchment in the Himalayas. Clim. Chang. 2012, 110, 721–736. [Google Scholar] [CrossRef] [PubMed]
- Intergovernmental Panel on Climate Change. Climate Change 2014: Mitigation of Climate Change; Cambridge University Press: Cambridge, UK, 2015; Volume 3. [Google Scholar]
- Osterkamp, T.E.; Romanovsky, V.E. Evidence for warming and thawing of discontinuous permafrost in Alaska. Permafr. Periglac. Process. 1999, 10, 17–37. [Google Scholar] [CrossRef]
- Payette, S.; Delwaide, A.; Caccianiga, M.; Beauchemin, M. Accelerated thawing of subarctic peatland permafrost over the last 50 years. Geophys. Res. Lett. 2004, 31. [Google Scholar] [CrossRef]
- Woo, M.K.; Kane, D.L.; Carey, S.K.; Yang, D.Q. Progress in permafrost hydrology in the new millennium. Permafr. Periglac. Process. 2008, 19, 237–254. [Google Scholar] [CrossRef]
- Kurylyk, B.L.; MacQuarrie, K.T.B.; McKenzie, J.M. Climate change impacts on groundwater and soil temperatures in cold and temperate regions: Implications, mathematical theory, and emerging simulation tools. Earth-Sci. Rev. 2014, 138, 313–334. [Google Scholar] [CrossRef]
- Barnett, T.P.; Adam, J.C.; Lettenmaier, D.P. Potential impacts of a warming climate on water availability in snow-dominated regions. Nature 2005, 438, 303–309. [Google Scholar] [CrossRef] [PubMed]
- Berghuijs, W.R.; Woods, R.A.; Hrachowitz, M. A precipitation shift from snow towards rain leads to a decrease in streamflow. Nat. Clim. Chang. 2014, 4, 583–586. [Google Scholar] [CrossRef]
- Stewart, I.T.; Cayan, D.R.; Dettinger, M.D. Changes in snowmelt runoff timing in Western North America under a ‘business as usual’ climate change scenario. Clim. Chang. 2004, 62, 217–232. [Google Scholar] [CrossRef]
- Regonda, S.K.; Rajagopalan, B.; Clark, M.; Pitlick, J. Seasonal cycle shifts in hydroclimatology over the western united states. J. Clim. 2005, 18, 372–384. [Google Scholar] [CrossRef]
- Yang, D.Q.; Kane, D.L.; Hinzman, L.D.; Zhang, X.B.; Zhang, T.J.; Ye, H.C. Siberian lena river hydrologic regime and recent change. J. Geophys. Res.-Atmos. 2002, 107. [Google Scholar] [CrossRef]
- Eckhardt, K.; Ulbrich, U. Potential impacts of climate change on groundwater recharge and streamflow in a central European low mountain range. J. Hydrol. 2003, 284, 244–252. [Google Scholar] [CrossRef]
- Godsey, S.E.; Kirchner, J.W.; Tague, C.L. Effects of changes in winter snowpacks on summer low flows: Case studies in the Sierra Nevada, California, USA. Hydrol. Process. 2014, 28, 5048–5064. [Google Scholar] [CrossRef]
- Jyearkama, M.I.; Sykes, J.F. The impact of climate change on spatially varying groundwater recharge in the grand river watershed (Ontario). J. Hydrol. 2007, 338, 237–250. [Google Scholar] [CrossRef]
- Panagoulia, D.; Dimou, G. Sensitivities of groundwater-streamflow interaction to global climate change. Hydrol. Sci. J. 1996, 41, 781–796. [Google Scholar] [CrossRef]
- Kurylyk, B.L.; MacQuarrie, K.T.; Voss, C.I. Climate change impacts on the temperature and magnitude of groundwater discharge from shallow, unconfined aquifers. Water Resour. Res. 2014, 50, 3253–3274. [Google Scholar] [CrossRef]
- St Jacques, J.M.; Sauchyn, D.J. Increasing winter baseflow and mean annual streamflow from possible permafrost thawing in the Northwest Territories, Canada. Geophys. Res. Lett. 2009, 36. [Google Scholar] [CrossRef]
- Burt, T.; Williams, P.J. Hydraulic conductivity in frozen soils. Earth Surf. Process. 1976, 1, 349–360. [Google Scholar] [CrossRef]
- Kurylyk, B.L.; Watanabe, K. The mathematical representation of freezing and thawing processes in variably-saturated, non-deformable soils. Adv. Water Resour. 2013, 60, 160–177. [Google Scholar] [CrossRef]
- Walvoord, M.A.; Striegl, R.G. Increased groundwater to stream discharge from permafrost thawing in the Yukon River basin: Potential impacts on lateral export of carbon and nitrogen. Geophys. Res. Lett. 2007, 34. [Google Scholar] [CrossRef]
- Brutsaert, W.; Hiyama, T. The determination of permafrost thawing trends from long-term streamflow measurements with an application in eastern Siberia. J. Geophys. Res.-Atmos. 2012, 117. [Google Scholar] [CrossRef]
- Bense, V.F.; Ferguson, G.; Kooi, H. Evolution of shallow groundwater flow systems in areas of degrading permafrost. Geophys. Res. Lett. 2009, 36. [Google Scholar] [CrossRef]
- Ge, S.; McKenzie, J.; Voss, C.; Wu, Q. Exchange of groundwater and surface-water mediated by permafrost response to seasonal and long term air temperature variation. Geophys. Res. Lett. 2011, 38. [Google Scholar] [CrossRef]
- Kurylyk, B.L.; Hayashi, M.; Quinton, W.L.; Mckenzie, J.M.; Voss, C.I. Influence of vertical and lateral heat transfer on permafrost thaw, peatland landscape transition, and groundwater flow. Water Resour. Res. 2016, 52. [Google Scholar] [CrossRef]
- Lyon, S.W.; Destouni, G.; Giesler, R.; Humborg, C.; Morth, M.; Seibert, J.; Karlsson, J.; Troch, P.A. Estimation of permafrost thawing rates in a sub-arctic catchment using recession flow analysis. Hydrol. Earth Syst. Sci. 2009, 13, 595–604. [Google Scholar] [CrossRef] [Green Version]
- Lyon, S.W.; Destouni, G. Changes in catchment-scale recession flow properties in response to permafrost thawing in the Yukon River basin. Int. J. Climatol. 2010, 30, 2138–2145. [Google Scholar] [CrossRef]
- Ding, Y.H.; Ren, G.Y.; Zhao, Z.C.; Xu, Y.; Luo, Y.; Li, Q.P.; Zhang, J. Detection, causes and projection of climate change over China: An overview of recent progress. Adv. Atmos. Sci. 2007, 24, 954–971. [Google Scholar] [CrossRef]
- Zhang, Q.; Gu, X.; Singh, V.P.; Xu, C.Y.; Kong, D.; Xiao, M.; Chen, X. Homogenization of precipitation and flow regimes across China: Changing properties, causes and implications. J. Hydrol. 2015, 530, 462–475. [Google Scholar] [CrossRef]
- Chang, X.; Jin, H.; He, R.; Yang, S.; Yu, S.; Lv, L.; Guo, D.; Wang, S.; Kang, X. Advances in permafrost and cold regions environments studies in the Da Xing’anling (Da Hinggan) Mountains, northeastern China. J. Glaciol. Geocryol. 2008, 30, 176–182. (In Chinese) [Google Scholar]
- Jin, H.J.; Yu, Q.H.; Lii, L.Z.; Guo, D.X.; He, R.X.; Yu, S.P.; Sun, G.Y.; Li, Y.W. Degradation of permafrost in the Xing’anling Mountains, northeastern China. Permafr. Periglac. Process. 2007, 18, 245–258. [Google Scholar] [CrossRef]
- Tong, B. Ice wedges in northeastern China. J. Glaciol. Geocryol. 1993, 15, 41–46. (In Chinese) [Google Scholar]
- Brown, J.; Ferrians, O.J.; Heginbottom, J.A.; Melnikov, E.S. Circum-Arctic Map of Permafrost and Ground-Ice Conditions. Available online: https://nsidc.org/data/docs/fgdc/ggd318_map_circumarctic/ (accessed on 20 December 2016).
- Sun, G.; Jin, H.; Chang, X.; Yu, S.; He, R.; Yang, S.; Lu, L.; Yao, Y.; Yan, X.; Fan, Y. Effect of broad valley landform on formation of marshes in northern Da Hinggan Mountains. J. Glaciol. Geocryol. 2011, 33, 991–998. [Google Scholar]
- Duan, L.; Man, X.; Liu, Y.; Liu, H.; Tian, Y.-H.; Liu, X. Soil moisture spatial variability and affecting factors of natural larch forest in northern region of DaXinganling Mountains of northeastern China. J. Beijing For. Univ. 2014, 4, 6. (In Chinese) [Google Scholar]
- Chang, X.L.; Jin, H.J.; Zhang, Y.L.; He, R.X.; Luo, D.L.; Wang, Y.P.; Lu, L.Z.; Zhang, Q.L. Thermal impacts of boreal forest vegetation on active layer and permafrost soils in northern Da Xing’anling (Hinggan) Mountains, northeast China. Arct. Antarct. Alp. Res. 2015, 47, 267–279. [Google Scholar] [CrossRef]
- Liu, Q.; Sun, Z. Research on the distribution of permafrost and vegetation in the forestry area of Da Hinggan Mountains. J. Glaciol. Geocryol. 1993, 15, 246–251. (In Chinese) [Google Scholar]
- Carey, S.K.; Woo, M.-K. Freezing of subarctic hillslopes, Wolf Creek basin, Yukon, Canada. Arct. Antarct. Alp. Res. 2005, 37, 1–10. [Google Scholar] [CrossRef]
- Woo, M.; Arain, M.; Mollinga, M.; Yi, S. A two-directional freeze and thaw algorithm for hydrologic and land surface modelling. Geophys. Res. Lett. 2004, 31. [Google Scholar] [CrossRef]
- Yi, S.; Arain, M.A.; Woo, M.K. Modifications of a land surface scheme for improved simulation of ground freeze-thaw in northern environments. Geophys. Res. Lett. 2006, 33. [Google Scholar] [CrossRef]
- Riseborough, D.; Shiklomanov, N.; Etzelmüller, B.; Gruber, S.; Marchenko, S. Recent advances in permafrost modelling. Permafr. Periglac. Process. 2008, 19, 137–156. [Google Scholar] [CrossRef]
- Mann, H.B. Nonparametric tests against trend. Econom. J. Econom. Soc. 1945, 13, 245–259. [Google Scholar] [CrossRef]
- Kendall, M.G. Rank Correlation Measures; Charles Griffin: London, UK, 1975; p. 202. [Google Scholar]
- Helsel, D.R.; Hirsch, R.M. Statistical Methods in Water Resources; U.S. Geological Survey: Reston, VA, USA, 2002; Volume 323.
- Liu, W.B.; Cai, T.J.; Fu, G.B.; Zhang, A.J.; Liu, C.M.; Yu, H.Z. The streamflow trend in Tangwang River basin in northeast china and its difference response to climate and land use change in sub-basins. Environ. Earth Sci. 2013, 69, 51–62. [Google Scholar] [CrossRef]
- Dery, S.J.; Hernandez-Henriquez, M.A.; Burford, J.E.; Wood, E.F. Observational evidence of an intensifying hydrological cycle in northern Canada. Geophys. Res. Lett. 2009, 36. [Google Scholar] [CrossRef]
- Lin, Y.; Wei, X.H. The impact of large-scale forest harvesting on hydrology in the willow watershed of central British Columbia. J. Hydrol. 2008, 359, 141–149. [Google Scholar] [CrossRef]
- Zhang, M.F.; Wei, X.H.; Sun, P.S.; Liu, S.R. The effect of forest harvesting and climatic variability on runoff in a large watershed: The case study in the Upper Minjiang River of Yangtze River basin. J. Hydrol. 2012, 464, 1–11. [Google Scholar] [CrossRef]
- Box, G.E.; Jenkins, G.M. Time series analysis: Forecasting and control. In Holden-Day Series in Time Series Analysis; Holden-Day: San Francisco, CA, USA, 1976. [Google Scholar]
- Jassby, A.D.; Powell, T.M. Detecting changes in ecological time-series. Ecology 1990, 71, 2044–2052. [Google Scholar] [CrossRef]
- Yao, Y.F.; Cai, T.J.; Wei, X.H.; Zhang, M.F.; Ju, C.Y. Effect of forest recovery on summer streamflow in small forested watersheds, northeastern China. Hydrol. Process. 2012, 26, 1208–1214. [Google Scholar] [CrossRef]
- Liu, W.; Wei, X.; Liu, S.; Liu, Y.; Fan, H.; Zhang, M.; Yin, J.; Zhan, M. How do climate and forest changes affect long-term streamflow dynamics? A case study in the upper reach of Poyang River basin. Ecohydrology 2015, 8, 46–57. [Google Scholar] [CrossRef]
- Pettitt, A. A non-parametric approach to the change-point problem. Appl. Stat. 1979, 28, 126–135. [Google Scholar] [CrossRef]
- Moraes, J.M.; Pellegrino, G.Q.; Ballester, M.V.; Martinelli, L.A.; Victoria, R.L.; Krusche, A.V. Trends in hydrological parameters of a southern Brazilian watershed and its relation to human induced changes. Water Resour. Manag. 1998, 12, 295–311. [Google Scholar] [CrossRef]
- Boulanger, J.-P.; Leloup, J.; Penalba, O.; Rusticucci, M.; Lafon, F.; Vargas, W. Observed precipitation in the paraná-plata hydrological basin: Long-term trends, extreme conditions and enso teleconnections. Clim. Dyn. 2005, 24, 393–413. [Google Scholar] [CrossRef]
- Zhang, X.P.; Zhang, L.; Zhao, J.; Rustomji, P.; Hairsine, P. Responses of streamflow to changes in climate and land use/cover in the loess plateau, China. Water Resour. Res. 2008, 44. [Google Scholar] [CrossRef]
- Liu, B.H.; Xu, M.; Henderson, M.; Qi, Y.; Li, Y.Q. Taking China’s temperature: Daily range, warming trends, and regional variations, 1955–2000. J. Clim. 2004, 17, 4453–4462. [Google Scholar] [CrossRef]
- Zhou, Y.W.; Guo, D.X. Principal characteristics of permafrost in China. J. Glaciol. Geocryol. 1982, 4, 1–19. (In Chinese) [Google Scholar]
- Wang, C.; Zhang, B.; Liu, F.; Song, C. Marks and phenomena of permafrost degradation in northern China. In Proceedings of the 5th Chinese Conference on Glaciology and Geocryology, Lanzhou, China, 18–22 August 1996; pp. 1063–1070. (In Chinese)
- Jin, H.; Yu, S.; Guo, D.; Lu, L.; Li, Y. Degradation of permafrost in the Da and Xiao Hinggan Mountains, northeast China, and preliminary assessment of its trend. J. Glaciol. Geocryol. 2006, 28, 467–475. (In Chinese) [Google Scholar]
- Smith, L.C.; Pavelsky, T.M.; MacDonald, G.M.; Shiklomanov, A.I.; Lammers, R.B. Rising minimum daily flows in northern Eurasian rivers: A growing influence of groundwater in the high-latitude hydrologic cycle. J. Geophys. Res.-Biogeosci. 2007, 112. [Google Scholar] [CrossRef]
- Ye, B.S.; Yang, D.Q.; Zhang, Z.L.; Kane, D.L. Variation of hydrological regime with permafrost coverage over Lena basin in Siberia. J. Geophys. Res.-Atmos. 2009, 114. [Google Scholar] [CrossRef]
- Paznekas, A.; Hayashi, M. Groundwater contribution to winter streamflow in the Canadian Rockies. Can. Water Resour. J. 2015. [Google Scholar] [CrossRef]
- Walvoord, M.A.; Kurylyk, B.L. Hydrologic impacts of thawing permafrost—A review. Vadose Zone J. 2016, 15. [Google Scholar] [CrossRef]
- Li, Q.; Li, W.; Si, P.; Gao, X.; Dong, W.; Jones, P.; Huang, J.; Cao, L. Assessment of surface air warming in northeast china, with emphasis on the impacts of urbanization. Theor. Appl. Climatol. 2010, 99, 469–478. [Google Scholar] [CrossRef]
- Vincent, L.A.; Wang, X.L.; Milewska, E.J.; Wan, H.; Yang, F.; Swail, V. A second generation of homogenized Canadian monthly surface air temperature for climate trend analysis. J. Geophys. Res. Atmos. 2012, 117, 119–130. [Google Scholar] [CrossRef]
- Stafford, J.M.; Wendler, G.; Curtis, J. Temperature and precipitation of Alaska. Theor. Appl. Climatol. 2000, 67, 33–44. [Google Scholar] [CrossRef]
- Laternser, M.; Schneebeli, M. Long-term snow climate trends of the Swiss Alps (1931–1999). Int. J. Climatol. 2003, 23, 733–750. [Google Scholar] [CrossRef]
- Hamlet, A.F.; Mote, P.W.; Clark, M.P.; Lettenmaier, D.P. Effects of temperature and precipitation variability on snowpack trends in the Western United States*. J. Clim. 2005, 18, 4545–4561. [Google Scholar] [CrossRef]
- Zou, S.; Wang, X.; Wang, Z.; Wang, Z. Groundwater resources and sustainable utilization in northeastern China. Water Resour. Hydropower Northeast China 2006, 24, 38–39. (In Chinese) [Google Scholar]
- Kumar, C.; Seethapathi, P. Assessment of natural groundwater recharge in Upper Ganga Canal command area. J. Appl. Hydrol. 2002, 15, 13–20. [Google Scholar]
- Wu, J.; Zhang, R.; Yang, J. Analysis of rainfall-recharge relationships. J. Hydrol. 1996, 177, 143–160. [Google Scholar] [CrossRef]
- Bense, V.F.; Kooi, H.; Ferguson, G.; Read, T. Permafrost degradation as a control on hydrogeological regime shifts in a warming climate. J. Geophys. Res.-Earth Surf. 2012, 117. [Google Scholar] [CrossRef] [Green Version]
- Tananaev, N.; Makarieva, O.; Lebedeva, L. Trends in annual and extreme flows in the Lena River basin, Northern Eurasia. Geophys. Res. Lett. 2016, 43, 10764–10772. [Google Scholar] [CrossRef]


| Watershed | Winter Baseflow | MAAT | Thawing Index | |||||
| Average (mm) | Slope (mm·Year−1) | TC 2 (%) | AC 2 (%·Year−1) | Average (°C) | Slope (°C·Year−1) | Average (°C·Day) | Slope (°C·Day·Year−1) | |
| DBKE | 6.5 | 0.16 1 | 98.3 | 2.5 | −0.5 | 0.043 | 2453.4 | 7.10 |
| TH | 5.4 | 0.09 | 66.9 | 1.7 | −2.6 | 0.043 | 2164.6 | 7.23 |
| Watershed | Annual Precipitation | Annual Rainfall Fraction | Annual Summer Rainfall | |||||
| Average (mm) | Slope (mm·year−1) | Average (%) | Slope (%·year−1) | Average (mm) | Slope (mm·year−1) | |||
| DBKE | 547 | 1.1 | 88.0 | 0.16 1 | 383 | 0.79 | ||
| TH | 517 | 0.7 | 86.7 | 0.07 | 348 | 0.00 | ||
| Watershed | Model | MAAT | Thawing Index | Annual Rainfall Fraction | ||||||
|---|---|---|---|---|---|---|---|---|---|---|
| Cross-Correlation Coefficient | Model | Lag (Years) | Cross-Correlation Coefficient | Model | Lag (Years) | Cross-Correlation Coefficient | Model | Lag (Years) | ||
| DBKE | (0,0,1) | 0.36 1 | (1,0,0) | 2 | 0.41 | (0,2,1) | 4 | 0.41 | (0,2,1) | 2 |
| TH | (0,0,1) | 0.48 | (1,1,0) | 2 | 0.45 | (0,2,1) | 4 | −0.08 | (0,2,1) | 0 |
| Test | Parameter | DBKE | TH | ||||||
|---|---|---|---|---|---|---|---|---|---|
| W 1 | MAAT | TI 2 | RF 3 | W | MAAT | TI | RF | ||
| Pettitt’s test | Breakpoint | 1991 | 1989 | 1988 | 1986 | 1991 | 1989 | 1988 | 1986 |
| p | 0.000 | 0.000 | 0.000 | 0.045 | 0.000 | 0.000 | 0.000 | 0.811 | |
| Kolmogorov-Smirnov Z-test | Z values | 2.02 | 2.32 | 2.57 | 1.76 | 2.05 | 1.94 | 2.49 | 0.76 |
| p | 0.001 | 0.000 | 0.000 | 0.004 | 0.000 | 0.001 | 0.000 | 0.611 | |
© 2017 by the authors; licensee MDPI, Basel, Switzerland. This article is an open access article distributed under the terms and conditions of the Creative Commons Attribution (CC-BY) license (http://creativecommons.org/licenses/by/4.0/).
Share and Cite
Duan, L.; Man, X.; Kurylyk, B.L.; Cai, T. Increasing Winter Baseflow in Response to Permafrost Thaw and Precipitation Regime Shifts in Northeastern China. Water 2017, 9, 25. https://doi.org/10.3390/w9010025
Duan L, Man X, Kurylyk BL, Cai T. Increasing Winter Baseflow in Response to Permafrost Thaw and Precipitation Regime Shifts in Northeastern China. Water. 2017; 9(1):25. https://doi.org/10.3390/w9010025
Chicago/Turabian StyleDuan, Liangliang, Xiuling Man, Barret L. Kurylyk, and Tijiu Cai. 2017. "Increasing Winter Baseflow in Response to Permafrost Thaw and Precipitation Regime Shifts in Northeastern China" Water 9, no. 1: 25. https://doi.org/10.3390/w9010025