Article

A Laboratory Study on the Filtration and Clogging of the Sand-Bottom Ash Mixture for Stormwater Infiltration Filter Media

Department of Civil and Environmental Engineering, Kongju National University, 1223-24 Cheonan-Daero, Cheonan 31080, Korea
*
Author to whom correspondence should be addressed.
Water 2017, 9(1), 32; https://doi.org/10.3390/w9010032
Submission received: 4 May 2016 / Revised: 3 November 2016 / Accepted: 30 December 2016 / Published: 7 January 2017

Abstract

:
The performance of stormwater infiltration systems depends significantly on the infiltration/filtration characteristics of filter media. Sand media have been frequently used due to their abundance and acceptable pollutant removal efficiency. Bottom ash media, which was known to have a high sorption capacity, are being considered as alternative and/or complement filter media to enhance the overall treatment efficiency. To verify the applicability of bottom ash as filter media, a series of 1-D column infiltration tests were conducted in this study. The filtration and clogging characteristics of the sand-bottom ash mixtures at different mixing ratios were investigated with limitedly focusing on the Total Suspended Solids (TSS) present in stormwater runoff. As a result, the presence of bottom ash was identified to improve the TSS removal efficiency in spite of having a significant increase in clogging potential. All media configurations were observed to experience the premature clogging and the clogging state for varying and constant head flow conditions, respectively. The noticeable amount of crushed bottom ash particles brought by seepage force could be accountable for the rapid occurrence of clogging phenomena. Overall, a homogeneous sand filter is preferred as long as the lifespan of filter system is the primary concern.

1. Introduction

Urbanization is known to alter watershed hydrology; as land becomes covered with surfaces impervious to rain that leads to an increase in volume and rate of rainfall runoff, and water is redirected from evapotranspiration and groundwater recharge to stormwater runoff [1,2]. The development of urban area is well known in increasing impervious areas that generate non-point source pollutants. The constant conveyance of pollutants by stormwater runoff, which are classified as a nonpoint source (NPS) pollution, has a great impact on the quality of receiving waterways [3]. To ease the negative effect of urbanization in the quantity and quality of stormwater runoff, stormwater management systems such as best management practices (BMPs) which include dry and wet ponds, constructed wetlands, tree box filters, infiltration trenches, rain gardens, etc. are implemented.
Structural BMPs are typically designed to reduce the negative impacts of the stormwater pollutants and increase the amount of urban particle control [4,5]. BMP structures usually employ filtration/infiltration and/or settling mechanism in treating stormwater runoff pollutants. In the operation of BMPs employing filtration/infiltration as its primary mechanism, its function is inevitably reduced with time due to clogging as mirrored in the variation in the amount and quality of treated runoff. Clogging is a common phenomenon that occurs in any filtration system and is defined as the formation of a semi-pervious layer throughout a range of depths due to the combined effect of mechanical/physical, biological, and chemical processes [6,7]. Physical clogging process is found to be dominant in practical engineering and is always observed to occur first [8,9,10]. Physical clogging is the blockage of media pores caused by suspension and sedimentation of insoluble matter; and is identified as the main contributing factor to clogging [6,9,11]. Moreover, physical clogging is responsible for acute clogging; whereas, biological and chemical clogging has been found to cause chronic clogging [12,13]. Acute clogging is much easier to remediate via filter purging or management as compared to chronic clogging. Several studies are available that were related to clogging. Blazejewski and Murat-Blazejewska [14] specified that the main factors of clogging are the accumulation of wastewater solids and vegetation debris, the growth of biofilm within the granular medium, roots and rhizomes, and the deposition of chemical precipitates; Langergraber et al. [6] and Winter and Goetz [15] identified that suspended solid loading plays a more vital role in clogging as compared to the growth of biomass which only has a minor effect; Knowles et al. [11] assumed that clogging in a horizontal subsurface flow wetlands are generally caused by physical and biological clogging by which the influence of chemical absorption and precipitation on clogging are minimal and can be neglected. Likewise, clogging phenomenon is unfavorable due to its undesirable effects such as reduction in the outflow that results in an increase on system’s detention time; creation of a highly polluted top media filter layer; and reduction in the systems treated volume of water due to an increase in overflow frequency [16,17]. Knowing the specific nature of stormwater pollution and the colloids, and the importance of clogging analysis in stormwater filtration systems, it is necessary to understand the clogging processes in order to improve and maximize the design and performance of any stormwater filtration media [18,19].
In the design of any infiltration/filtration facilities, the possibility of clogging occurrence is reduced by optimizing the filter bed design and controlling the characteristics of the inflow runoff. Filter bed design includes the presence of vegetation, and the characteristics of filter media such as shape, size, depth, and arrangement [11,18,20,21]. On the other hand, inflow characteristics pertain to the runoff inflow rates, sediment concentration, sediment particle size and distribution, and loading regime [22,23,24,25]. In this paper, the filtration performance and clogging possibility of sand-bottom ash mixtures with different mixing ratio were evaluated by conducting a series of 1-D column infiltration experiments. Non-vegetated clogging experiments were used and executed in order to determine the most effective and reliable filter media mixture that can provide high sediment removal efficiency and longer filter system lifespan. Assessment was done by considering the filter media clogging potential and filtration performance under two two in-situ flow conditions: varying and constant head flow.

2. Materials and Methods

2.1. Filter Media and Properties

Both sand and bottom ash are the filter media selected in preparing different filter columns that were characterized by its media configurations. The first media configuration was classified as the “base case” through which a single layer of sand filter media was used; whereas, the remaining three filter media configuration cases involve three different mixing ratios of sand and bottom ash. The adapted sand to bottom ash mixing weight ratios were 75:25, 50:50, and 25:75. Different filter media mixtures were tested in order to examine the influence of the amount of bottom ash on the systems particle capture efficiency, and lifespan.
Sand was selected due to its abundance, low cost, and high sediment removal rate [26,27]. On the other hand, bottom ash, which is a by-product from coal burning plants, was utilized as a component of experiment filter media due to its known good adsorption behavior [28,29]. Filter media used were selected to have a uniform gradation of 2–4.75 mm for sand, and 0.85–2 mm for bottom ash. The utilized filter media particle ranges were within the 0.5–10 mm target size range. Previous studies [18,20] explained that particles less than 0.5 mm generates a low hydraulic conductivity system whereas bigger particles (such as 10 mm) have a low treatment performance. X-ray diffraction (XRD), Scanning Electron Microscopy (SEM), and standard geotechnical laboratory tests [30,31,32] were performed in order to gather information regarding the particle shape and index properties of sand and bottom ash. The classification of filter columns and physical properties of filter media are summarized in Table 1.

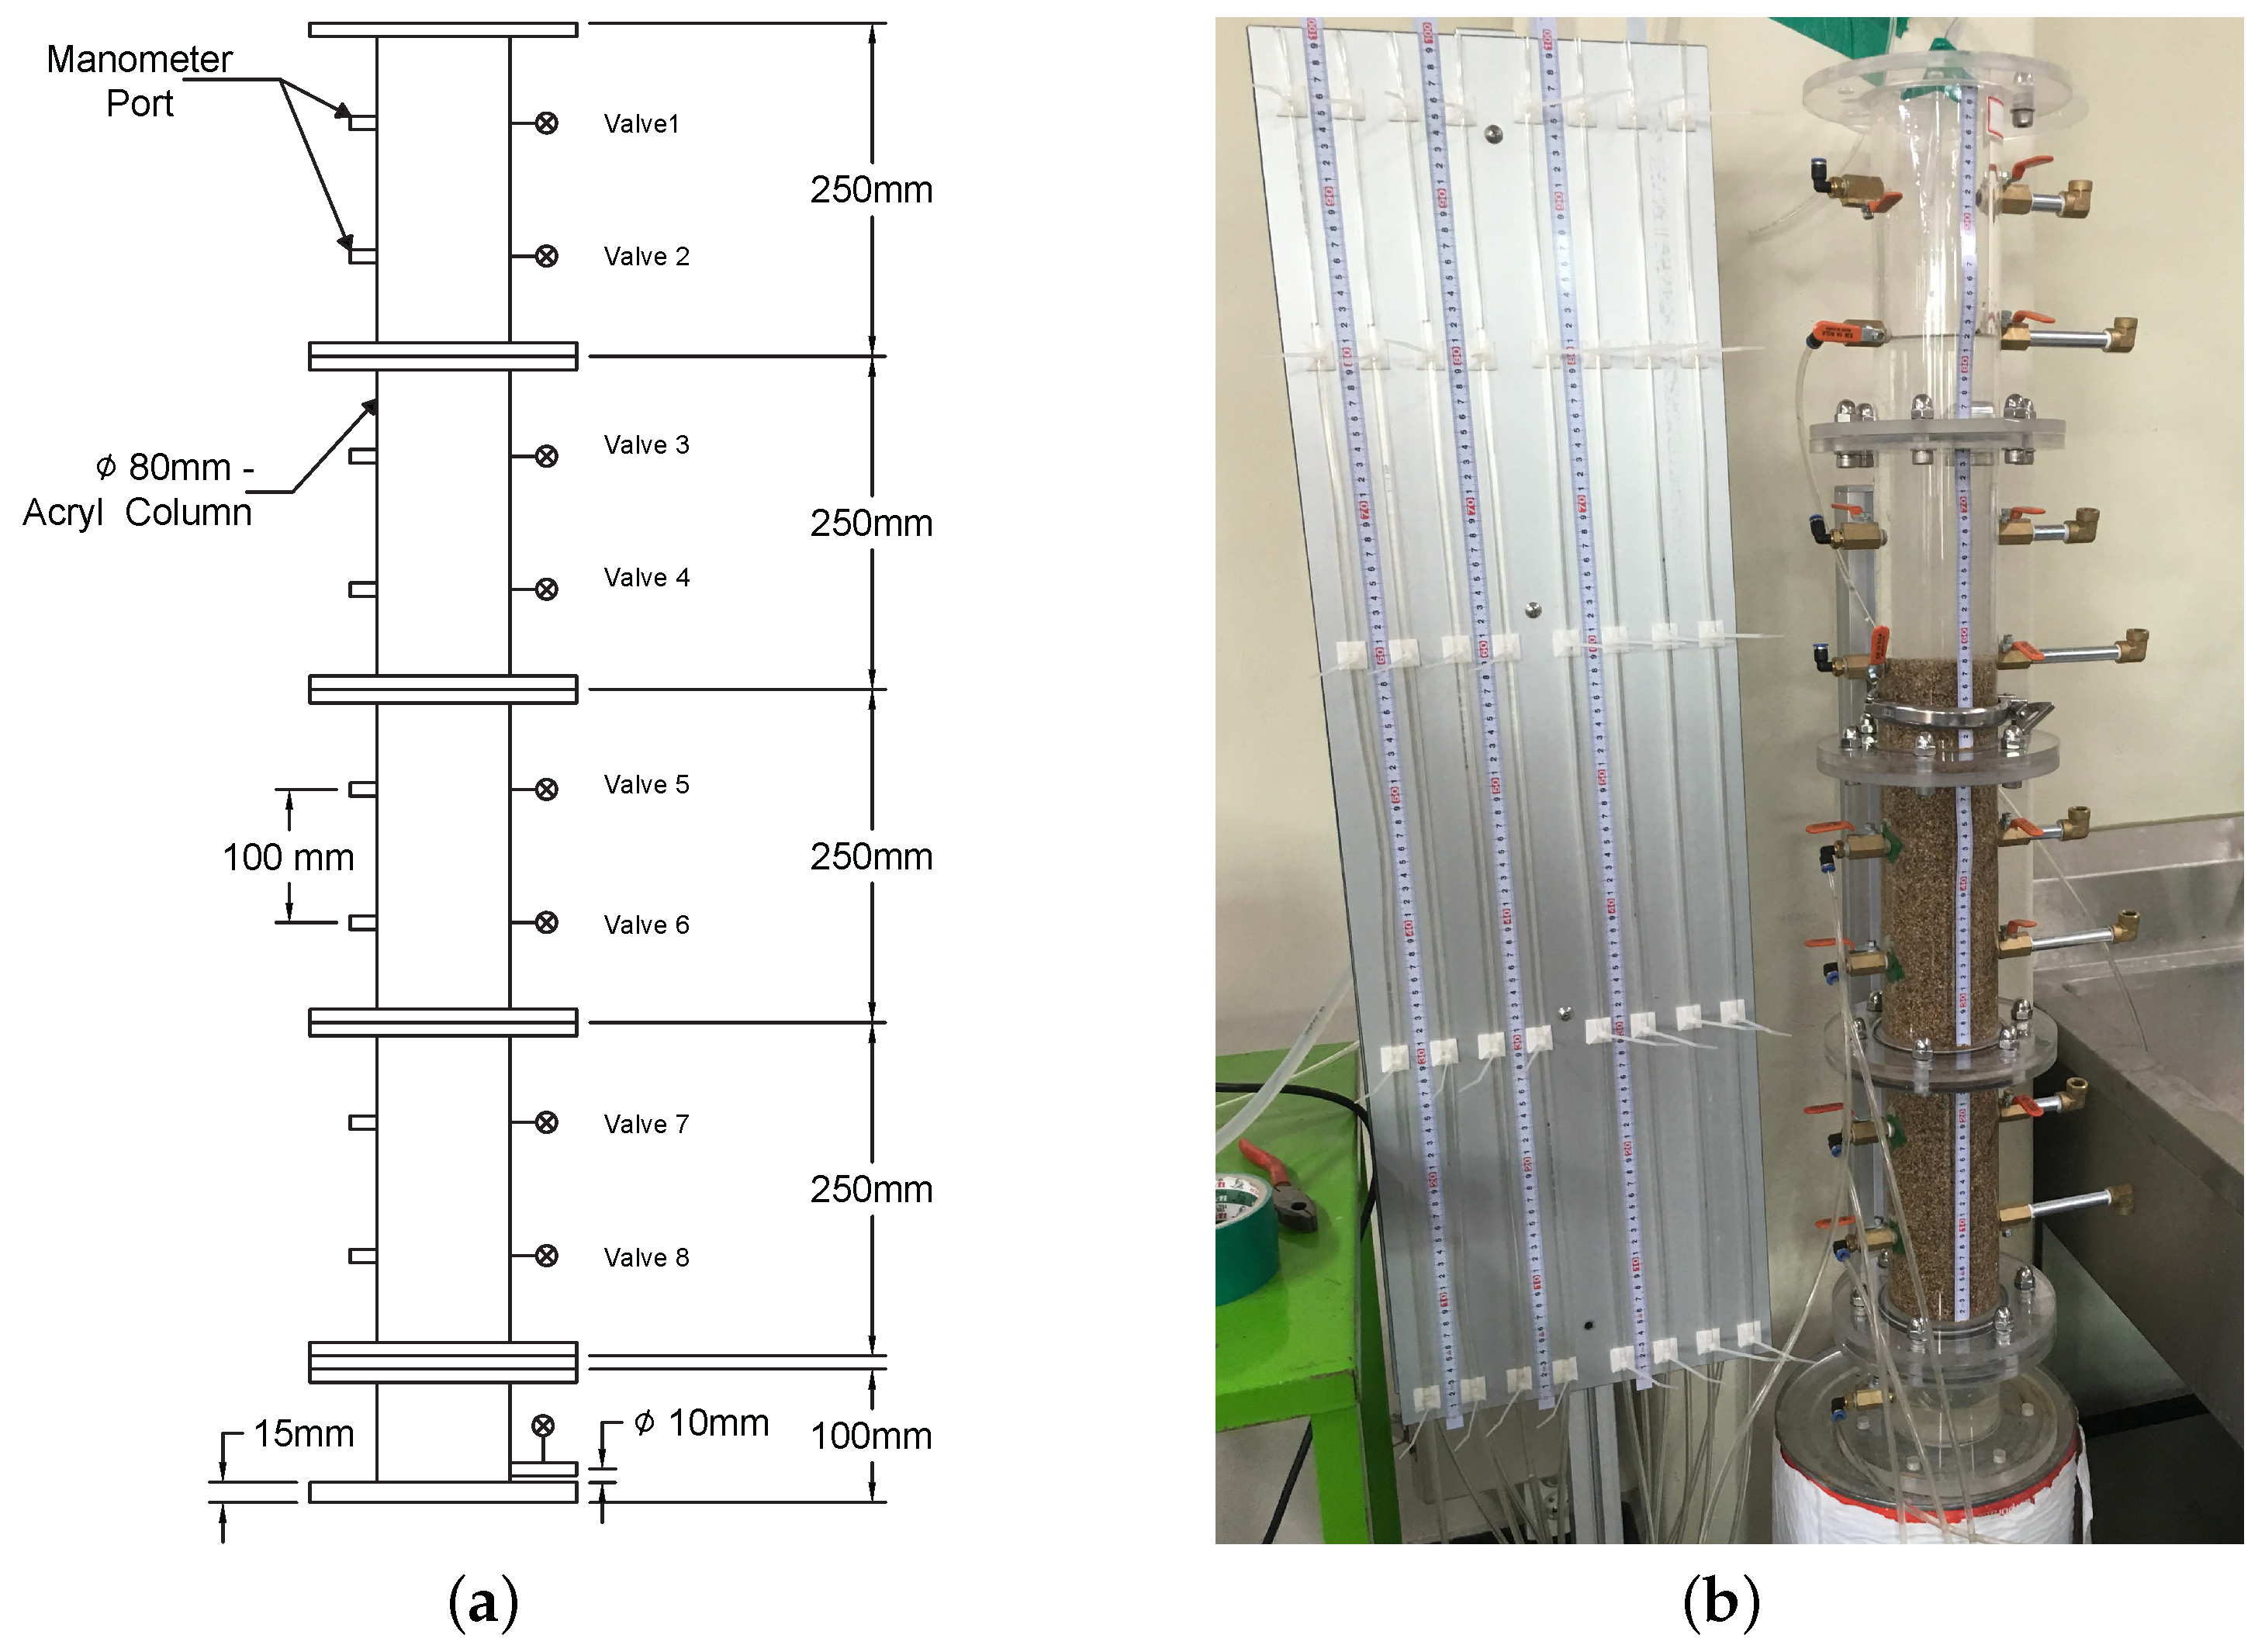
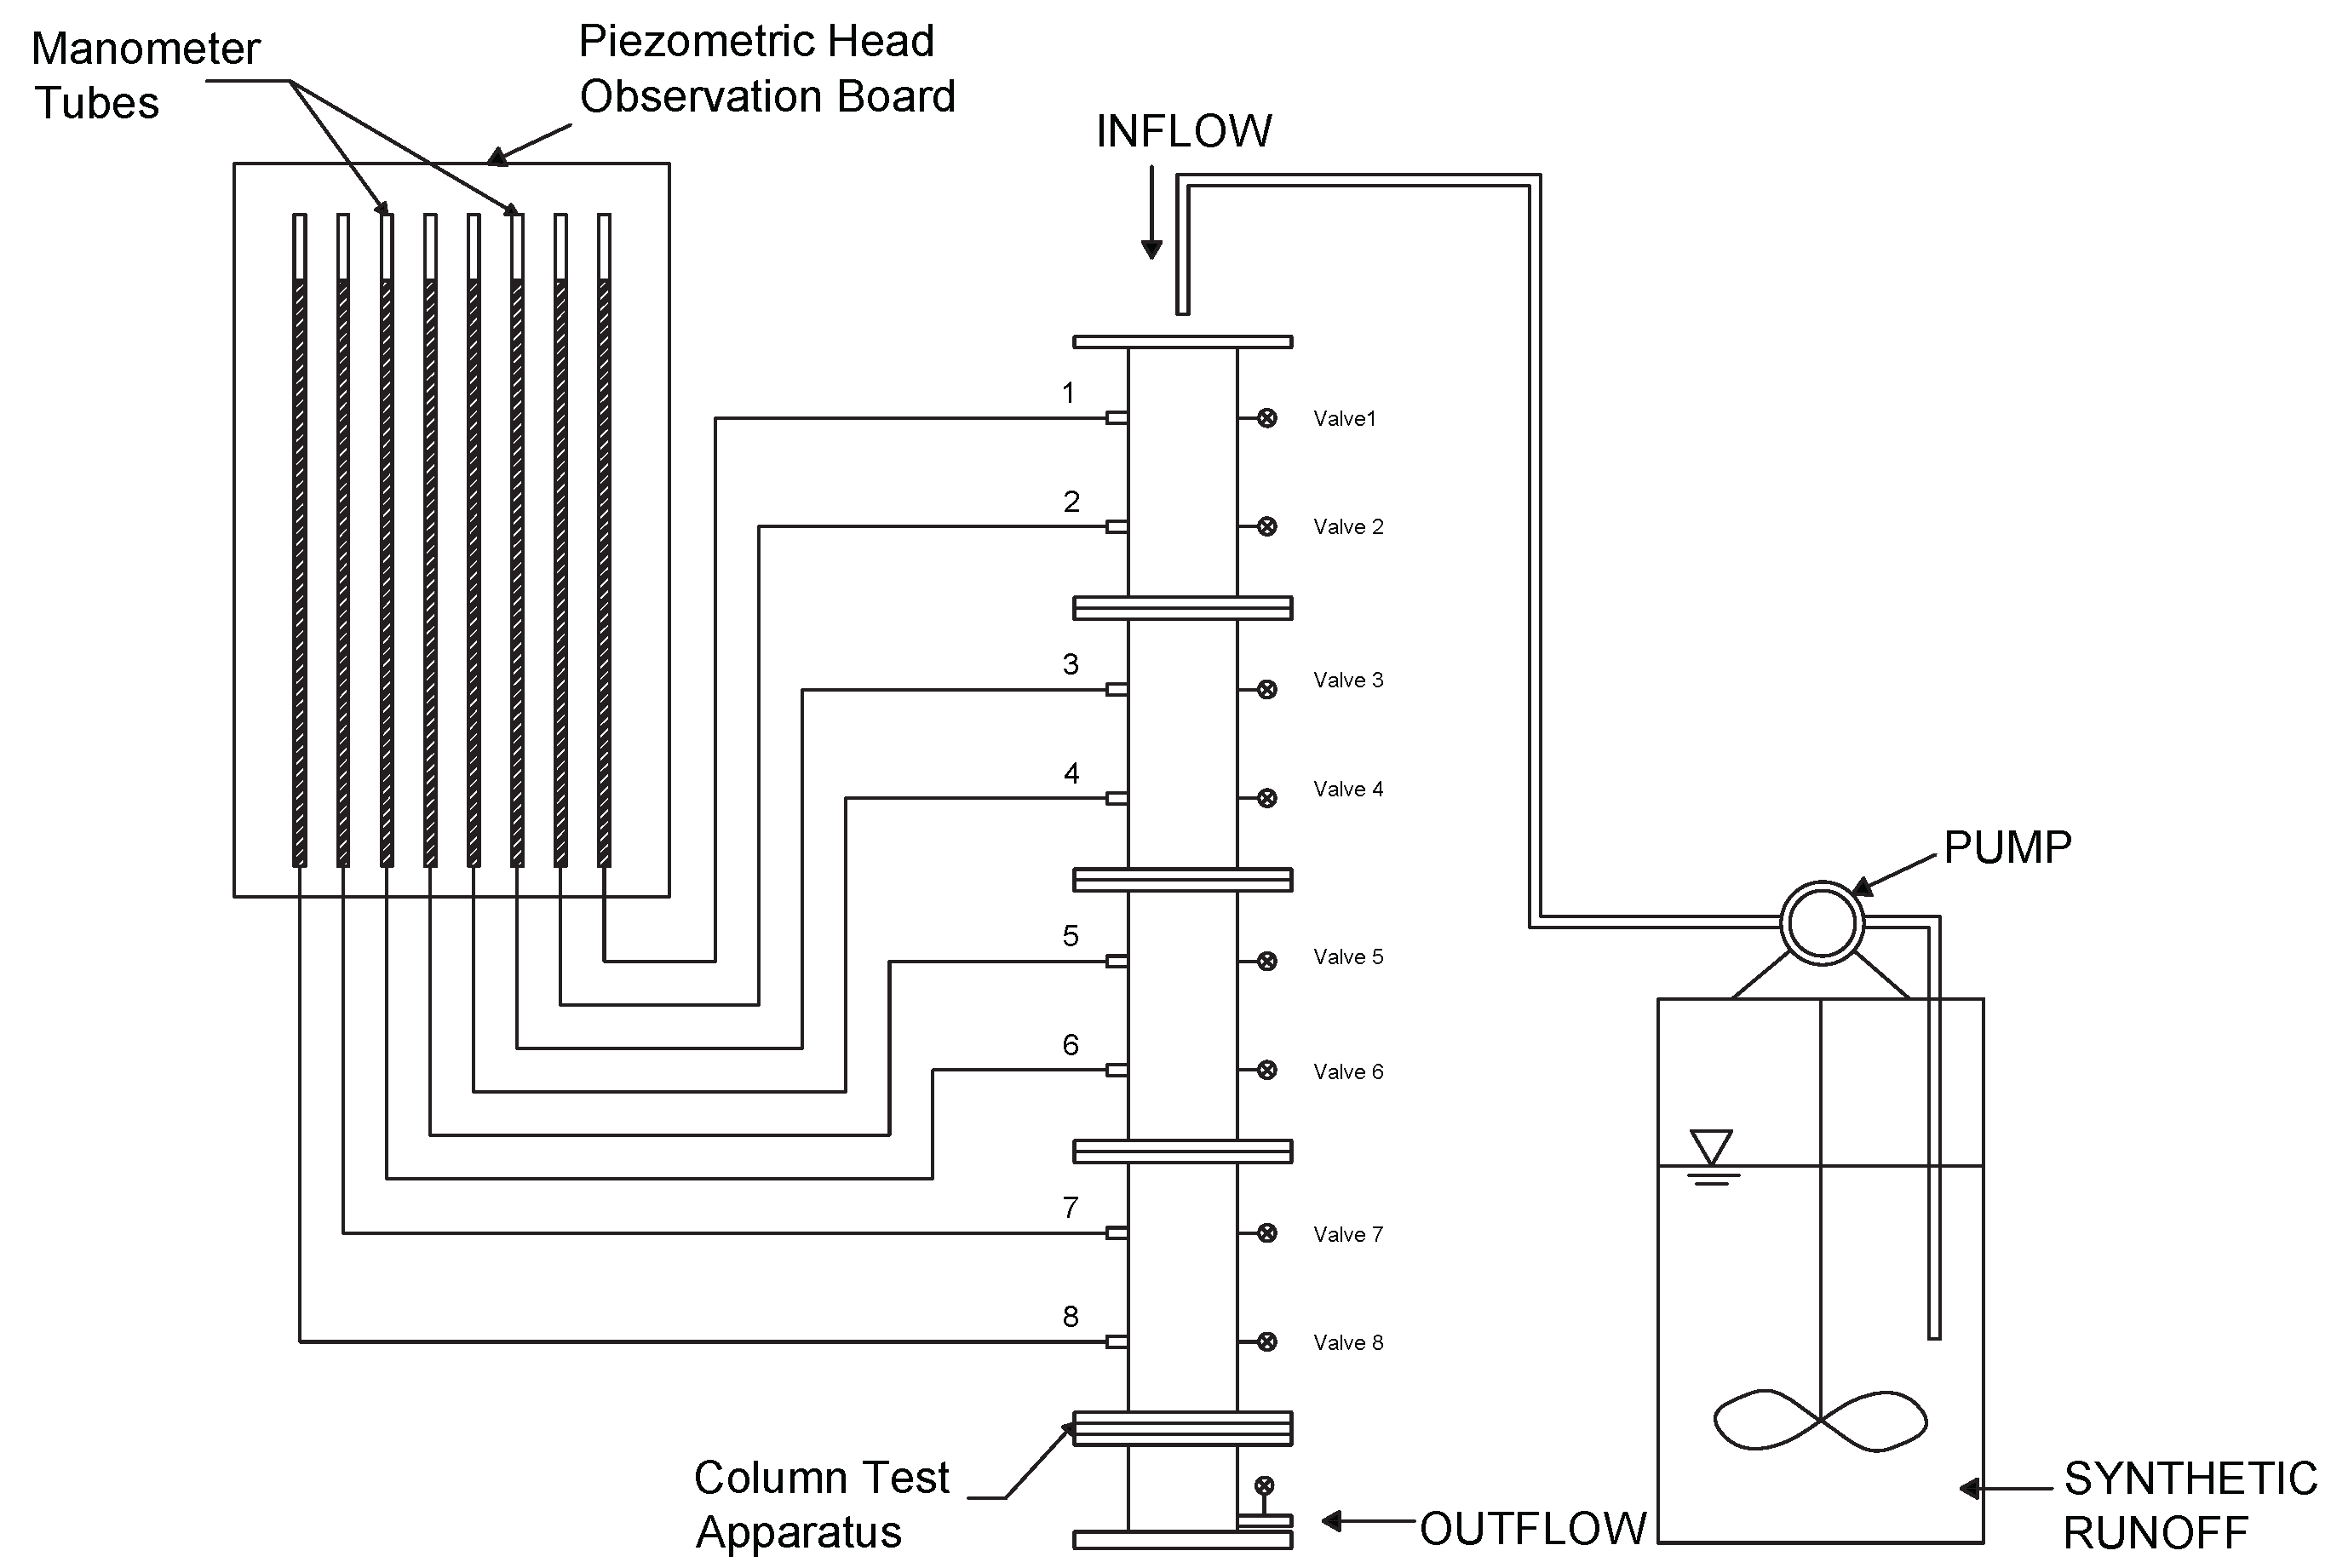
2.2. Improvised 1-Dimensional Column Infiltration Apparatus

A column infiltration testing apparatus was improvised as shown in Figure 1. The column with a height and diameter of 1.1 m and 80 mm respectively, is made of transparent acryl to observe the clogging formation within the filter media column. Manometer ports and tubes are installed at the side of the column to measure the hydraulic pressure head experienced at the designated height of the filter column. Moreover, valves are also placed at the other side of the filter column to assist in any water sampling needed. At the bottom of the column apparatus, a valve is placed to collect outflow water samples. A tape measure is placed along the height of the column to observe the movement of water along the filter media depth. The column apparatus is divided into five sections to assist in soil column set-up and collection of soil samples. Peristaltic pump is used to introduce and control the flow rate of the synthetic runoff influent into the filter column. Figure 2 shows the schematic diagram of the whole experiment system. The column testing apparatus and experiment test setup, as shown in Figure 1 and Figure 2 respectively, are nearly similar to what was used in previous study [21].

2.3. Experiment Methods

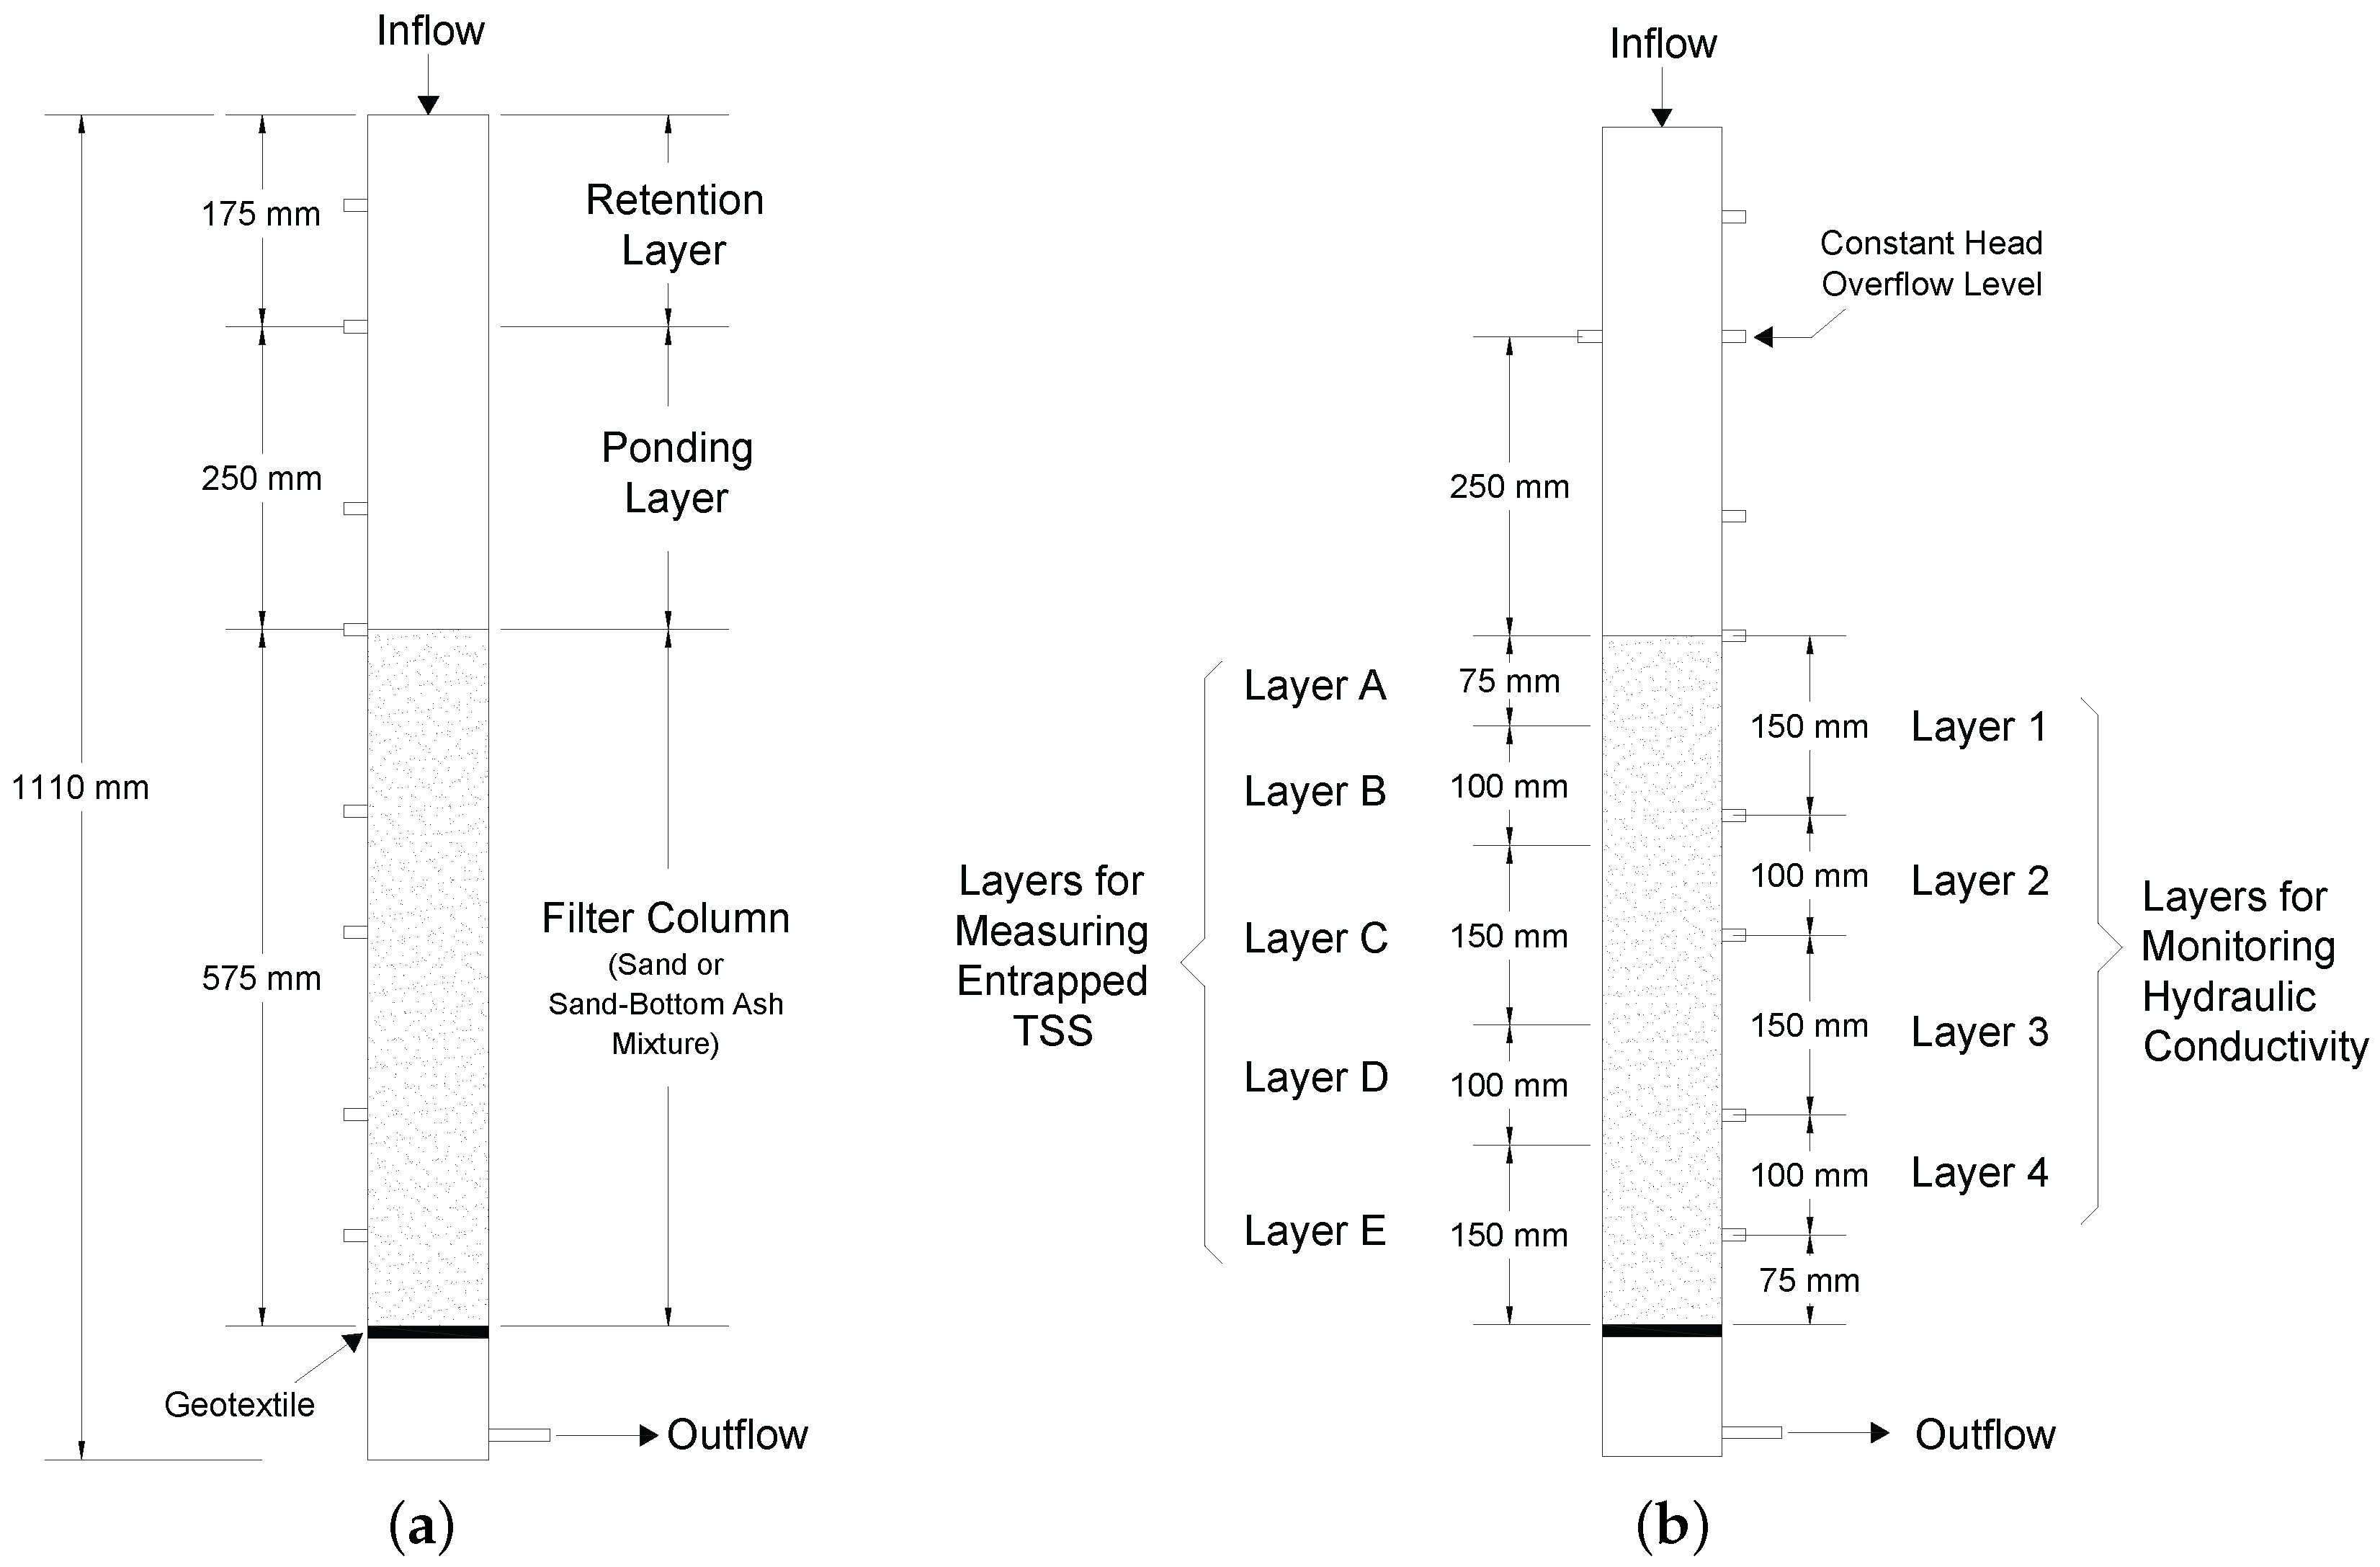
2.3.1. Filter Columns and Synthetic Stormwater

Each filter column setup was made by pouring the filter media into the column without applying compaction effort in order to avoid any media breakage. Also, the filter media column was built in sections as seen in Figure 1 until reaching the desired column height in order to ensure the homogeneity and consistency in filter media infiltration characteristics. The resulting filter column setup was believed to mimic the non-vegetated and un-engineereed (un-compacted) in-situ conditions since necessary procedures and precautions were observed in order to attain the target filter media characteristics.
The detailed measurements and the layering of the filter column setup are shown in Figure 3a,b, respectively. A filter column height of 575 mm was used as shown in Figure 3a. The height was determined based on the facility total depth of 1.0 m (which was within the range of actual facility depth implemented at Kongju National University) subtracted by the typical layer height used for drainage and ponding. The depth of the drainage or retention layer should have a standard depth greater than 125 mm [33], wherein, a fixed 175 mm depth was used in this study. Moreover, a ponding height of 250 mm was used in order to allow any proper vegetative diversity. A geotextile was placed at the bottom of the filter column in order to prevent the migration of filter media to the drainage area and also to replicate the actual field situation wherein it was placed for easy maintenance purposes. The layer designations shown in Figure 3b were used to identify the filter column sections for hydraulic conductivity change monitoring and entrapped suspended solids measurements.
As for the pollutants present in the synthetic runoff, the experiments were limited only to TSS since majority of stormwater pollutants, especially heavy metals and nutrients, were attached to TSS. Artificial/synthetic stormwater runoff made up of TSS and tap water was prepared in a tank with stirrer in order to reach and maintain the target TSS concentration of 150 mg/L. Suspended sediments collected in highways that passed through No. 60 (250 μ m) sieve were used. Utilized TSS concentration and particle size was nearly similar with the values used in previous studies [9,23,34]. Furthermore, 2 mg/L of Sodium Hypochlorite (NaOCl) solution was added to the synthetic runoff in order to disinfect the suspended solids against any biological matters and inhibit any biological activity that may happen within the filter system [35].

2.3.2. Infiltration Experiments

Each experimental column setup was dosed with synthetic runoff that was simulated under two different flow conditions: constant and varying head. A total of 8 column tests were performed: 4 for each flow condition having 1 test for each media configuration. In the varying head condition, synthetic influent water was continuously dosed at flow rate of 6 mL/s simulating the quantity of runoff that enters the infiltration facility during a rainfall event. The flow rate applied was determined by multiplying the four parameters which are the average recorded rainfall intensities in Korea of 6 mm/h [36]; the theoretical catchment area of 400 m2; 90% estimated amount of stormwater runoff captured by the treatment facility; and the actual-laboratory scaling factor of 1/100.
As for the constant head flow experiments, a 250 mm water elevation was maintained above the top layer of the filter media as shown in Figure 3b. The excess water above this level was allowed to overflow through the port installed at the top column section.
Infiltration clogging experiments in previous studies [9,18,20,23] were performed by compressing the systems months of operational life to weeks of experimentation. In this study, continuous dosing event without drying regime was adopted until the conditions for experimental termination had been met due to experimental time constraints and logistical reasons. Standard schema to reasonably terminate the infiltration experiments were devised and applied selectively for each flow conditions.
In both flow conditions, experiments are terminated if the filter columns experience clogging. The term “clogging” is defined as a state where the outflow quantity is reduced to 15%–20% of the initial outflow value. In the varying head condition, clogging is classified into two types: “premature” and “complete” clogging. Premature clogging is a state where ponding that later results to overflow occurs before arriving at the clogging state; whereas, complete clogging represents the state where “clogging” is reached without the occurrence of water overflow. As for the constant head experiments, premature and complete clogging state are not applicable since the water is maintained at the overflow level. Thus, the “clogging” state is used as a condition to terminate constant head experiments.
In both flow head conditions, there can be a case where “clogging” state does not occur or fully develop. A target quantity of infiltrated water needs to be defined in order to dismissthe experiment. The target quantity isestimated by using parameters such as the 1352 mm/year average annual rainfall in Korea [25], and an expected monthly maintenance frequency of filter facility in addition to the hydrologic parameters used in determiningthe dosing flow rate in the varying head condition. The resulting target quantity is equivalent to the amount of runoff treated by the infiltration facility for aone period of maintenance interval. Based on the given parameters, a target water column height quantity of 80 m was calculated.

2.4. Measurement and Analysis

During infiltration in both head flow conditions, water samples at the outlet and inlet were collected at the start of the simulation and every 15 min for the first two hours then after 30 min for the succeeding hours of testing. The outflow rates of the filtration columns were also monitored at the same designated time intervals. For the varying head condition, the water movement along the ponding height was monitored. As for the constant head condition, the developed pressure head along the filter column (Layer 1–4) as shown in Figure 3b was monitored using the manometer tubes. Head values were recorded at the same time interval used for water sampling in order to evaluate any changes in the systems hydraulic conductivity.
At the end of the experiment, collected water samples were analyzed for TSS concentration in accordance with the standard method; and for particle size distribution(PSD) with the use of Coulter counter (Beckman Coulter LS230 Laser Diffraction Particle Size Analyzer) [37]. In addition, the filter column was carefully dismantled to obtain filter media samples at the designated heights (Layer A–E) of the filter column as shown in Figure 3b. The accumulated sediments at the filter column layers were determined by drying and sieving the soil samples then weighing the particles less than 250 μ m. Collected sediments less than 250 μ m were also analyzed for its particle size distribution.
For the varying head conditions, the changes in water flux (or hydraulic loading rate) and sediment flux (or mass loading rate) between inflow and outflow were monitored until clogging or the target amount of water passed was reached. The changes in water flux and sediment flux were calculated using the measured data and Equations (1) and (2).
Δ W a t e r F l u x = Q A s | i n Q A s | o u t
Δ S e d i m e n t F l u x = T S S × Q A s | i n T S S × Q A s | o u t
Q (m 3 /h) is either the inflow and outflow discharge; A s (m 2 ) is the surface area of the filter column; and T S S (mg/L) is either the influent and effluent concentration of total suspended solids. Careful unit conversion must be observed in utilizing both equations.
For the constant head condition, the variation in hydraulic conductivity of the filter column was calculated as clogging develops. The calculation of saturated hydraulic conductivity of filter media sample in a 1-D saturated soil column having uniform cross under constant head flow condition was made possible by utilizing the Darcy’s equation. The Darcy’s equation for hydraulic conductivity, K, is given as:
K = V L A t ( H 1 H 2 )
where A is the sample cross-sectional area; H 1 H 2 , is the constant head difference of the soil sample across the test sample length; L, and V is the volume of the test fluid that flows through the system during time t.

3. Results and Discussion

3.1. Varying Head Flow Condition

3.1.1. Clogging Characteristics

To illustrate clogging formation in filter columns, variations of the outlet water flux with the duration of infiltration time are plotted in Figure 4 wherein the recorded water fluxes in all cases are normalized by its initial flux value. Significant decrements of the outlet water flux are obvious in Figure 4. In all filter cases, premature clogging is found to prevail. The entrapment and entrainment of suspended solids deeper into the filter column together with the particle rearrangement in the column significantly reduce the active pore volume of the filter media; thus affecting its hydraulic conductivity.
As shown in Figure 4, all cases of sand-bottom ash filter have the same time of ponding occurrence that happen after 1.5 h of continuous infiltration. At the time where water ponding starts, sand-bottom ash filters experience a remarkable rapid steep decline in outflow water flux with respect to time as compared to the base case. Results show that the base case has a higher capacity to resist clogging as compared to any sand-bottom ash cases. However, for cases wherein bottom ash media are needed to be mixed with sand for an important purpose or function, the 50-50 sand-bottom ash media ratio would perform better than any mix ratios for it exhibits a lower reduction in the outlet water flux thus having a longer operational life.
In Figure 5, changes in water flux between inflow and outflow ( Δ W a t e r F l u x ) are plotted cumulatively with the time of infiltration. In the base case, premature clogging is achieved at a cumulative change in water flux of 3.707 m/h; which is almost the same as the 75-25 case having a value of 3.772 m/h. If the time where the peak cumulative change in water of flux of the 75-25 case is to be considered, it is identified that the base case has the least value of cumulative change in water flux followed by the 50-50 and the 25-75 cases. The slope of the curve with respect to time shown in Figure 5 defines the degree of permeability reduction experienced by the filter media; through which, results imply that, for the sand-bottom ash cases of 75-25 and 50-50, respectively, has the highest and least possibility to clog filter system.
Infiltration time as illustrated in the time of infiltration in Figure 6. In the curves shown in Figure 6a,b, a linear increase in trend for both the base and the sand-bottom ash cases are evident, indicating that the accumulated sediment along the filter media is constantly increasing over time. A cake-like layer was observed to form at the top layer of the filter media during the experiment. As the filter system captures the sediments present in the influent, a cake layer is formed in the media that further results in hydraulic conductivity reduction over time [9,21,38]. Comparing Figure 6a,b, the curves of the sand-bottom ash cases are witnessed to be a little steeper than that of the base case. The observed slope increase in the curves of sand-bottom ash cases clearly implies its higher ability of capturing suspended solid particles due to the presence of the finer bottom ash filter particle. Moreover, as seen in Figure 6b, the curves for all sand-bottom ash cases overlap each other implying that they exhibit the same performance or efficiency in removing sediments contained in influent water.

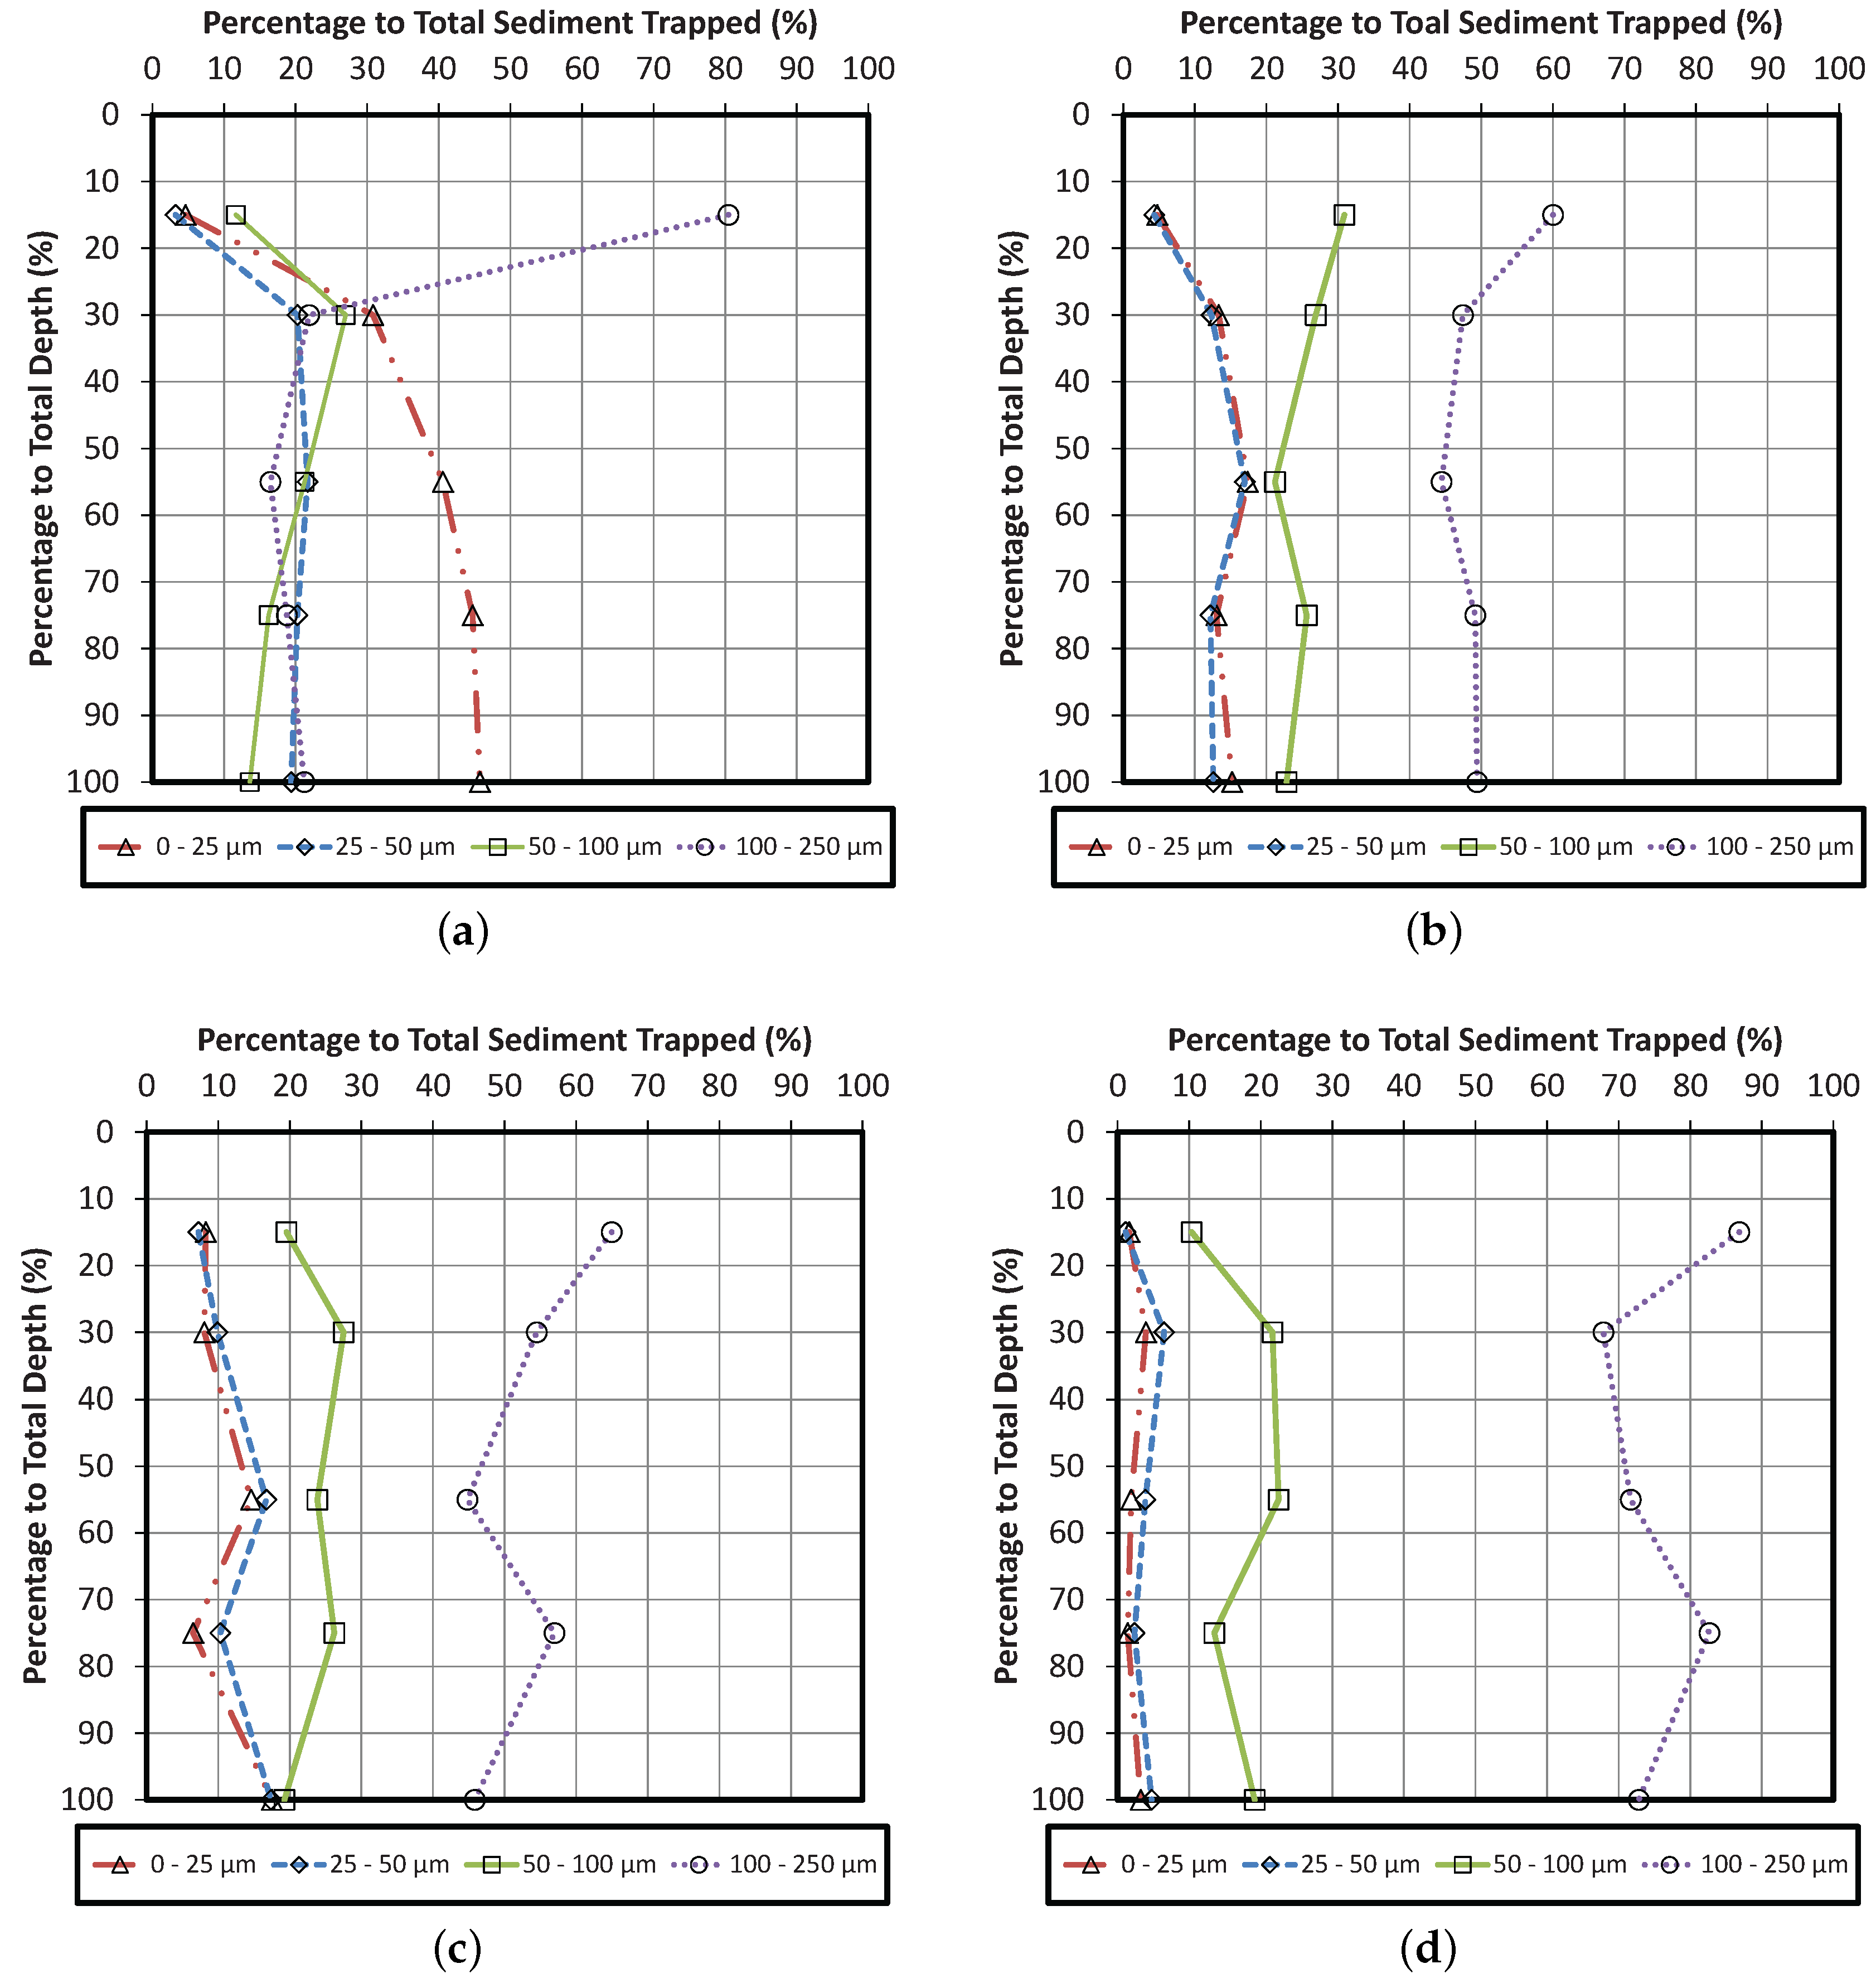
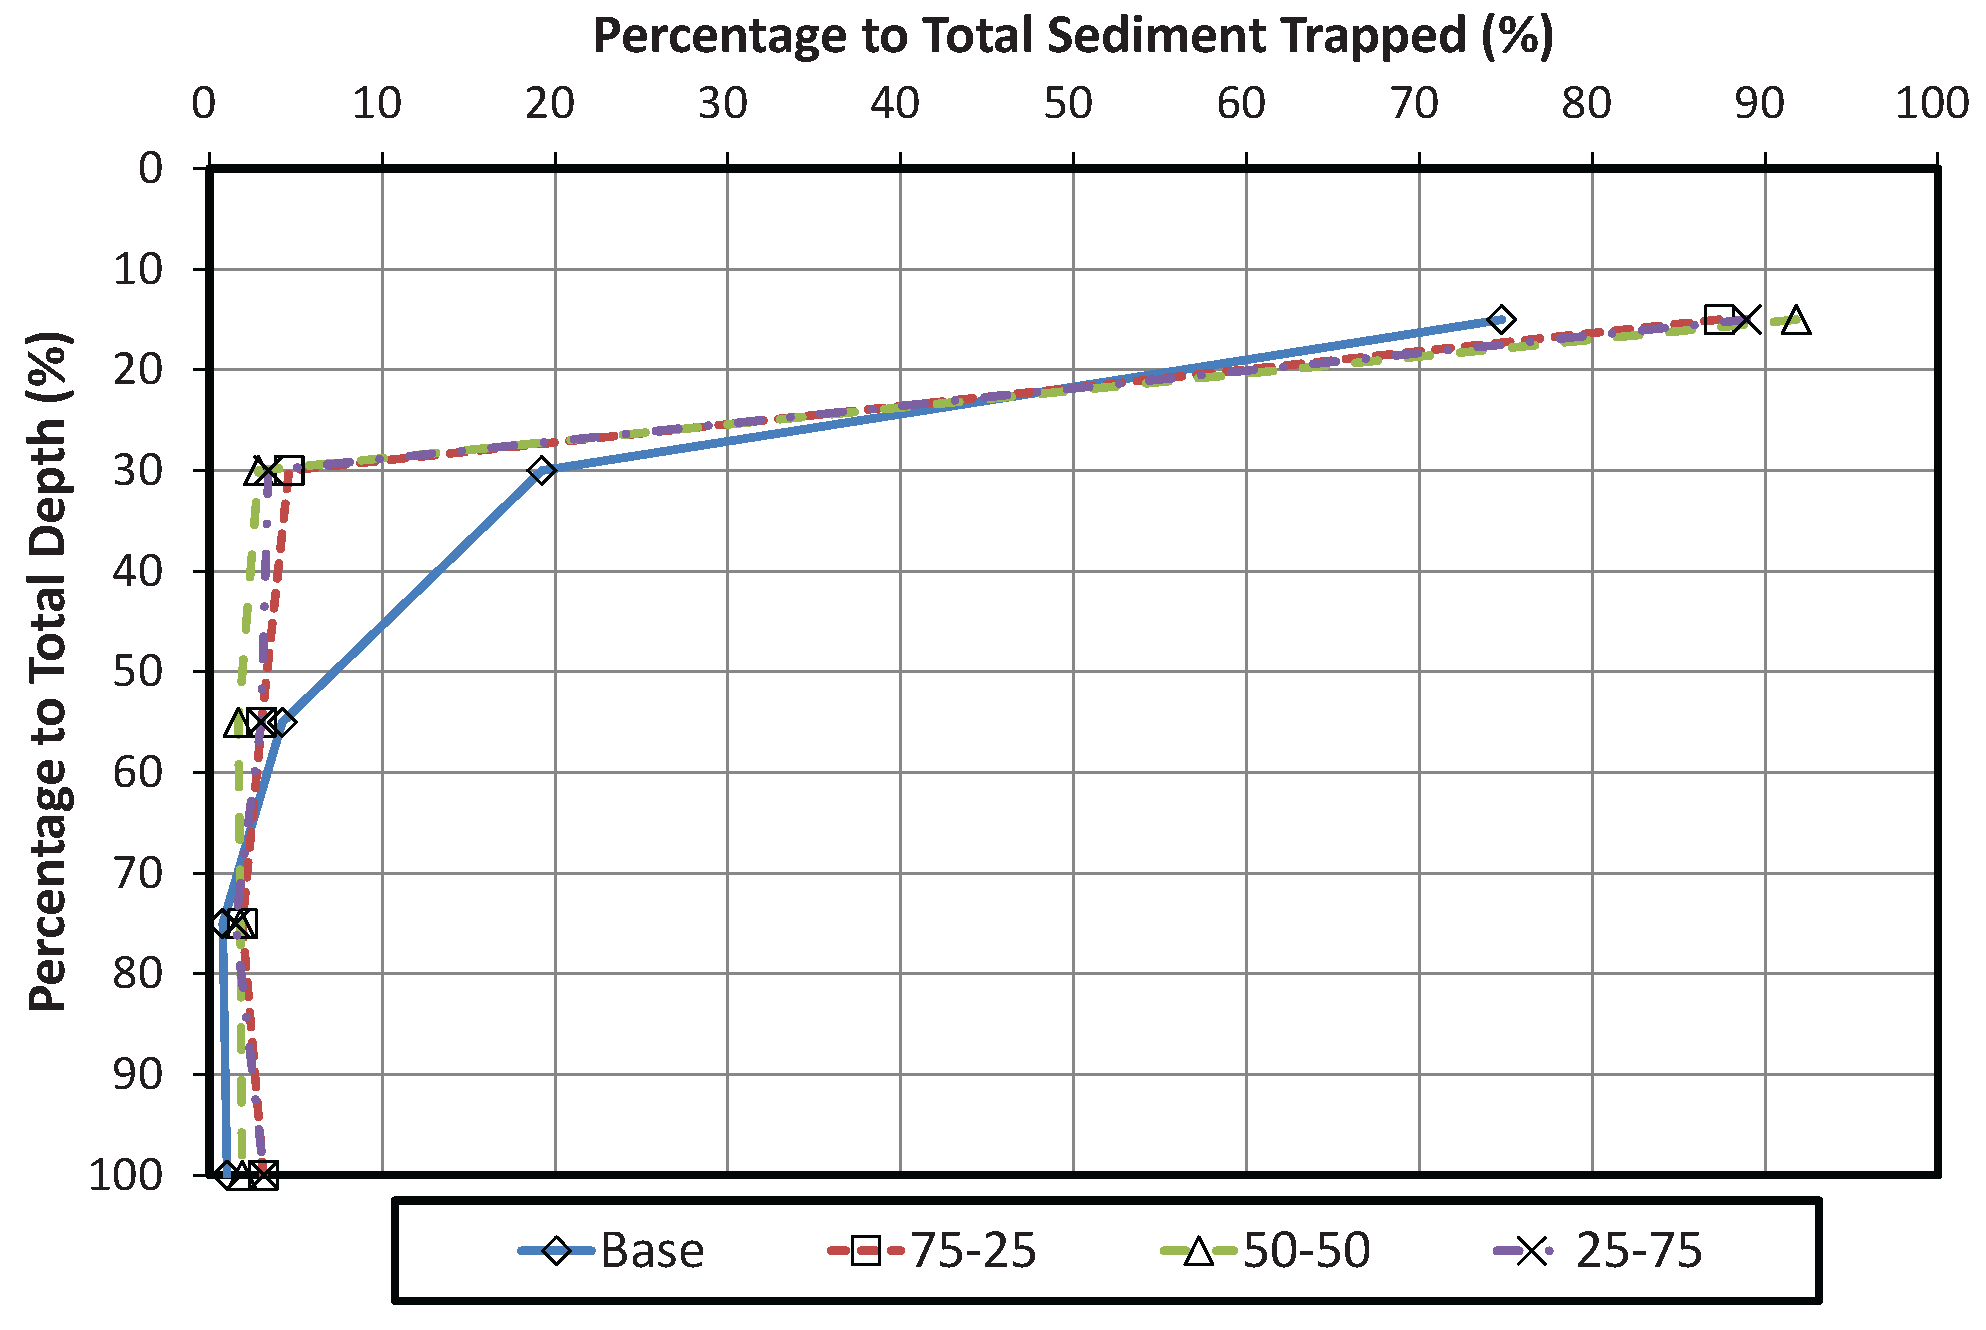
3.1.2. Trapped Sediments in Filter Column

Trapped sediments along the height of filter column were quantified by sieving the filter media sample obtained from the designated layers (Figure 3b) and determining the amount of sediments that passed No. 60 (250 μ m) sieve. The distributions of the amount of trapped sediments along depth for each cases of filters are illustrated in Figure 7. It is observed that the amount of sediment accumulated in all filter column cases are highest at the upper 15% of depth then rapidly decreases as it reaches the bottom. Both base case and 75-25 sand-bottom ash case give the same amount of the total sediment trapped in the upper 15% of the filter column depth having a corresponding value of 79%, while the 25-75 and 50-50 cases respectively give 70.21% and 84.10%. A cake layer found to form at the surface top of the filter column are found to be significant in the results that were obtained. All filter cases exhibit significant decrease in the amount of sediments trapped from the upper 15 to 30% of the filter depth. The presence of finer bottom ash media in the sand-bottom ash cases helps on improving the entrainment of the influent suspended solids that further results in a lesser amount of sediments trapped at the lower depths of the filter column. On the other hand, all sand-bottom ash cases are observed to exhibit a higher percentage of sediments trapped at the lower depths as compared to the base case as shown in Figure 7. Among the sand-bottom ash cases, the amount of particles less than 250 μ m found at the deeper section of filter column is highest for the 25-75 case and lowest for the 75-25 case. It is hypothesized that the breakage of bottom-ash media due to packing and infiltration forces has increased the amount of smaller particles found at filter layers. The amount of small particles present at layer depths is found to be directly proportional to the amount bottom-ash used as filter media.

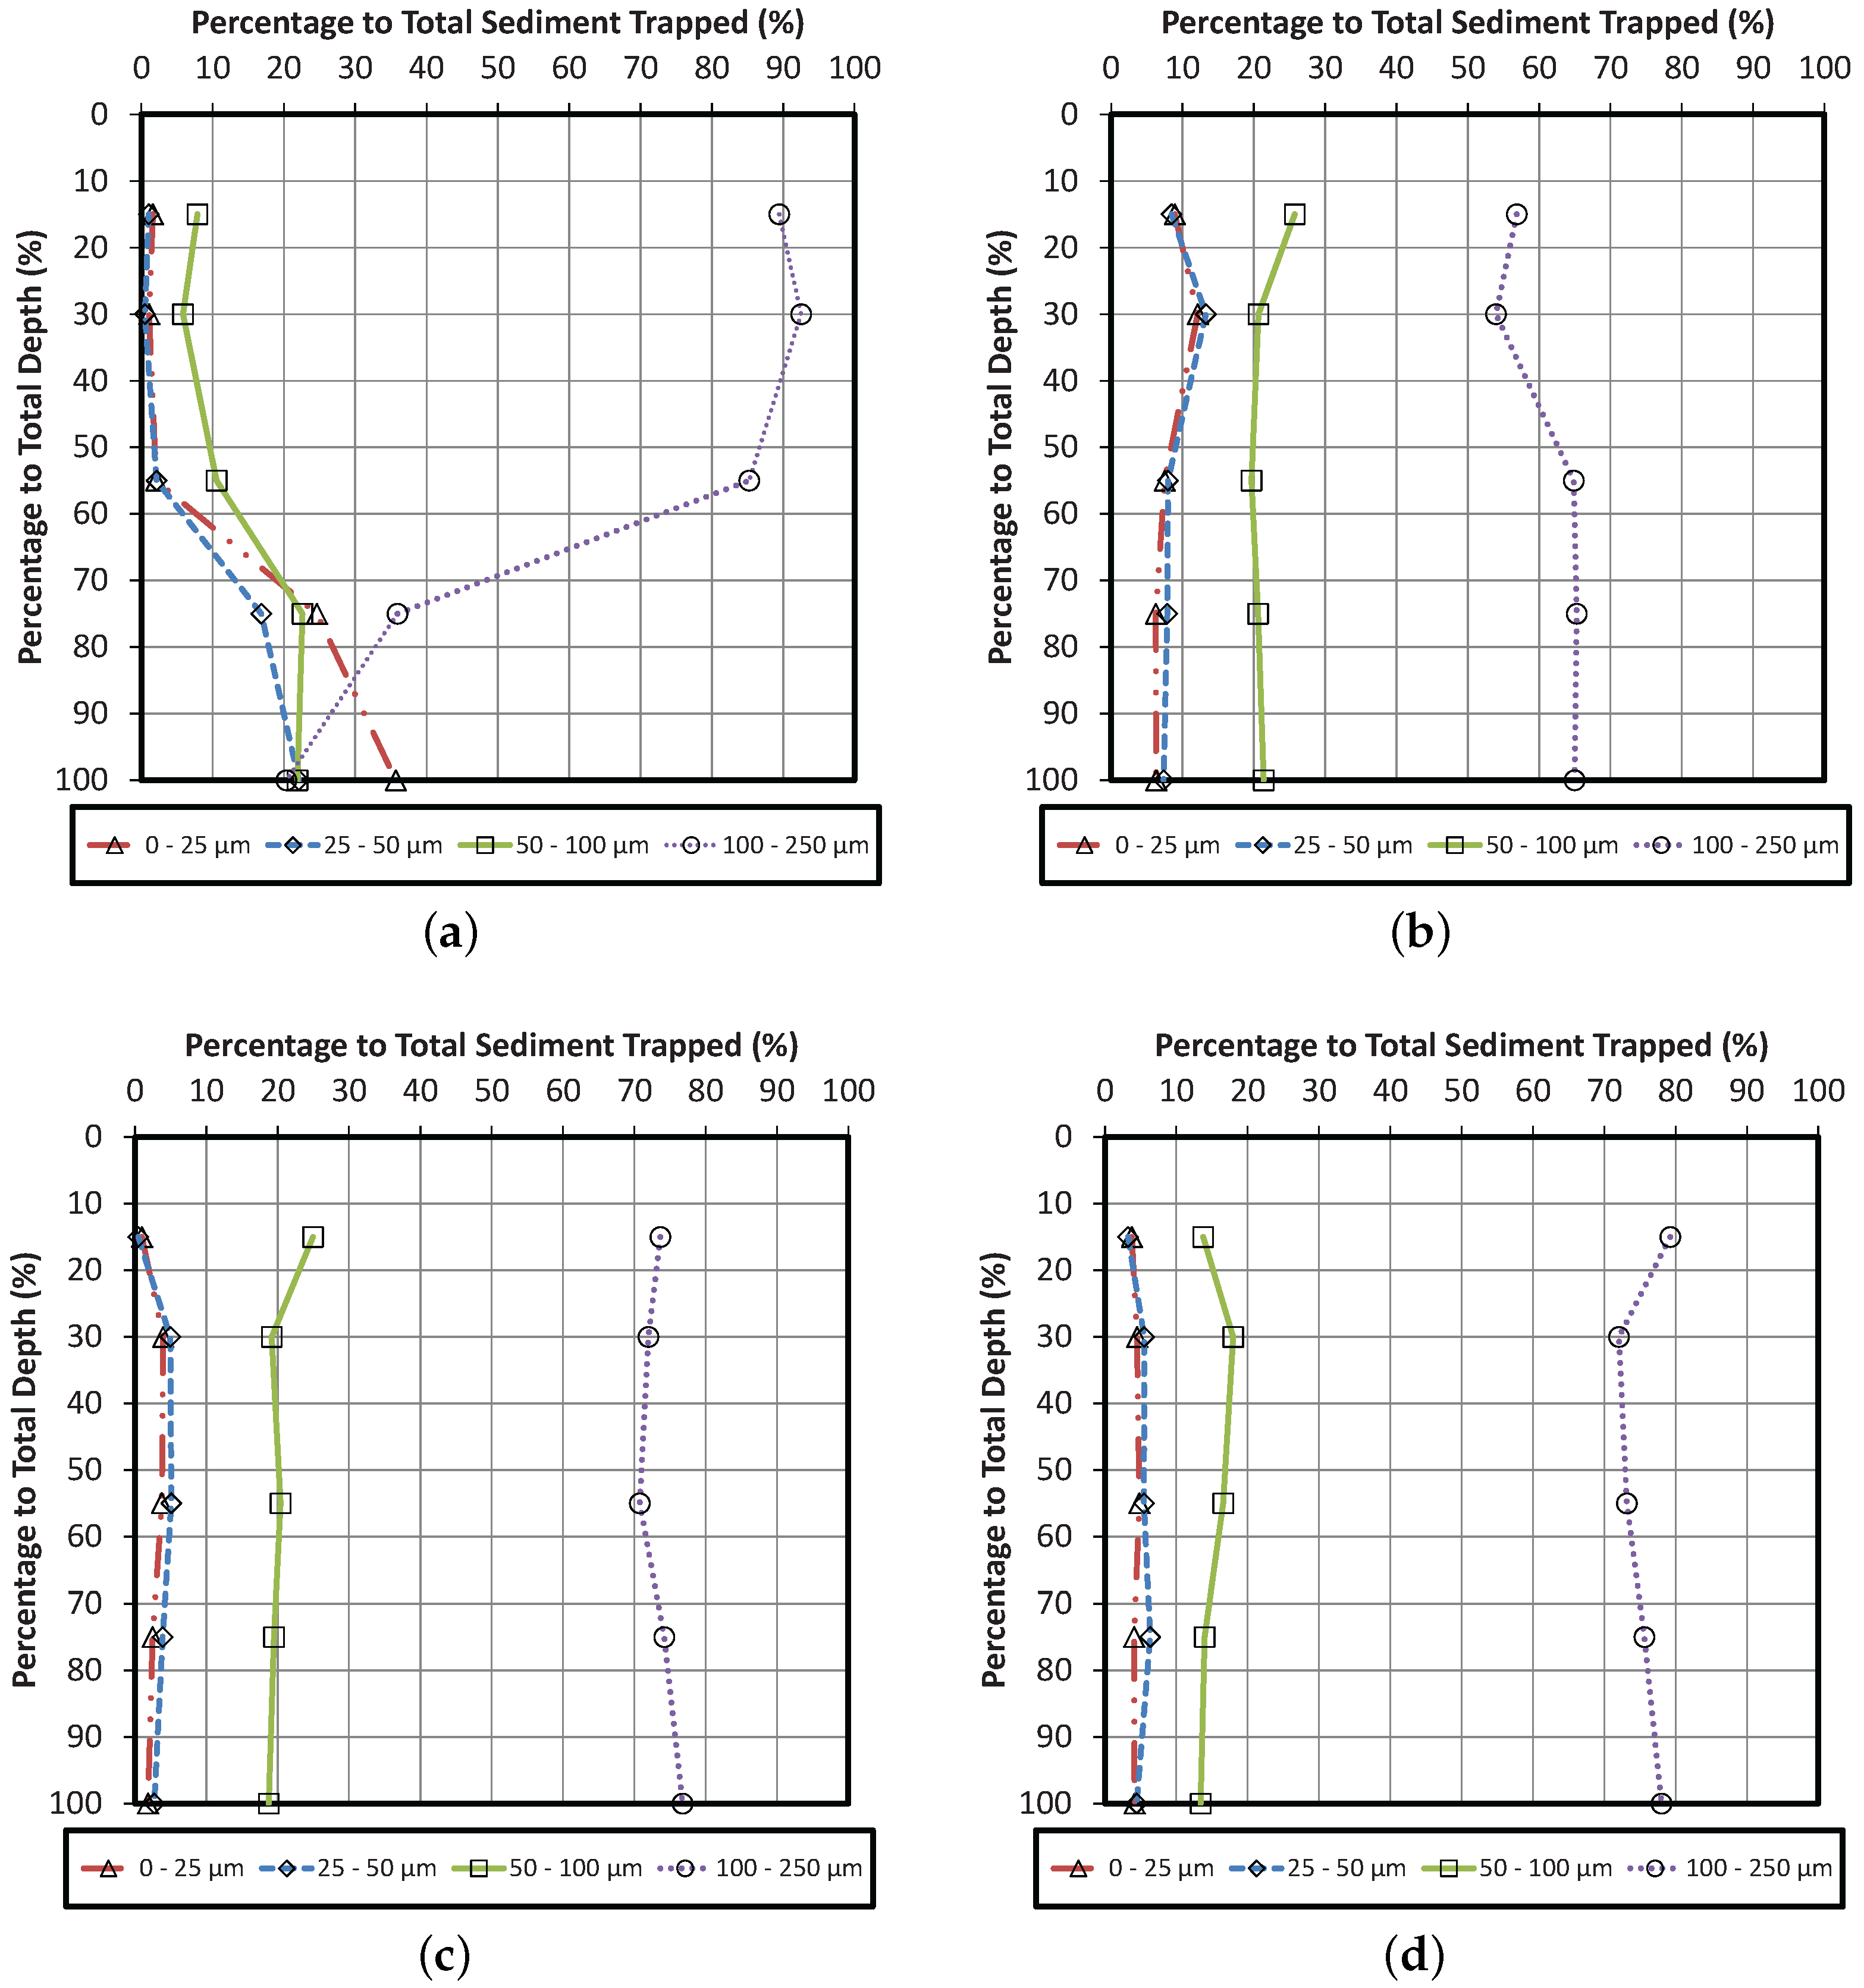
3.1.3. Influence of Sediment Particle Size on Clogging

Wang et al. [39] stated that the degree and location of clogging in a filter system is greatly influenced by the size of the suspended solids. In response, the particle size distribution of the accumulated sediments along the depth of the filter column was analyzed. The results are plotted in Figure 8 representing the variation of the weighted portion occupied by sediments with a certain size range at each depth. As presented in Figure 8, the clogging layers, which were previously identified to form at the upper part of the filter media, are mostly made up of 100–250 μ m sediment particle size regardless of media configuration. For the base case shown in Figure 8a, a decrease of the amount of 100–250 μ m with depth is noticed which subsequently results in an increase in fraction of smaller sizes (0–25 μ m) found at deeper depths. Acquired result agrees with Hua et al. [40] wherein he identified that the accumulation of fine particles (0–38.5 μ m particle diameter) increases with depth. Moreover, obtained results explain that the probability of a particle to go deeper into the filter column increases with the decrease on its particle size. On the contrary, Figure 8b–d show that the presence of bottom ash in the filter media has resulted to a lesser reduction in the amount of 100–250 μ m sediment particle size with respect to media depth. It is noted that an increase in the fraction of bottom ash has resulted in an increase in the amount of 100–250 μ m particle size presents along the filter media depth. Results are relevant with the previous hypothesis which stressed the relationship between the amount of bottom ash used as filter media and the 250 μ m sediment fraction found at filter column layers. It is revealed that the breakage of bottom ash tends to produce a large amount of sediments having particle size larger than 100 μ m.

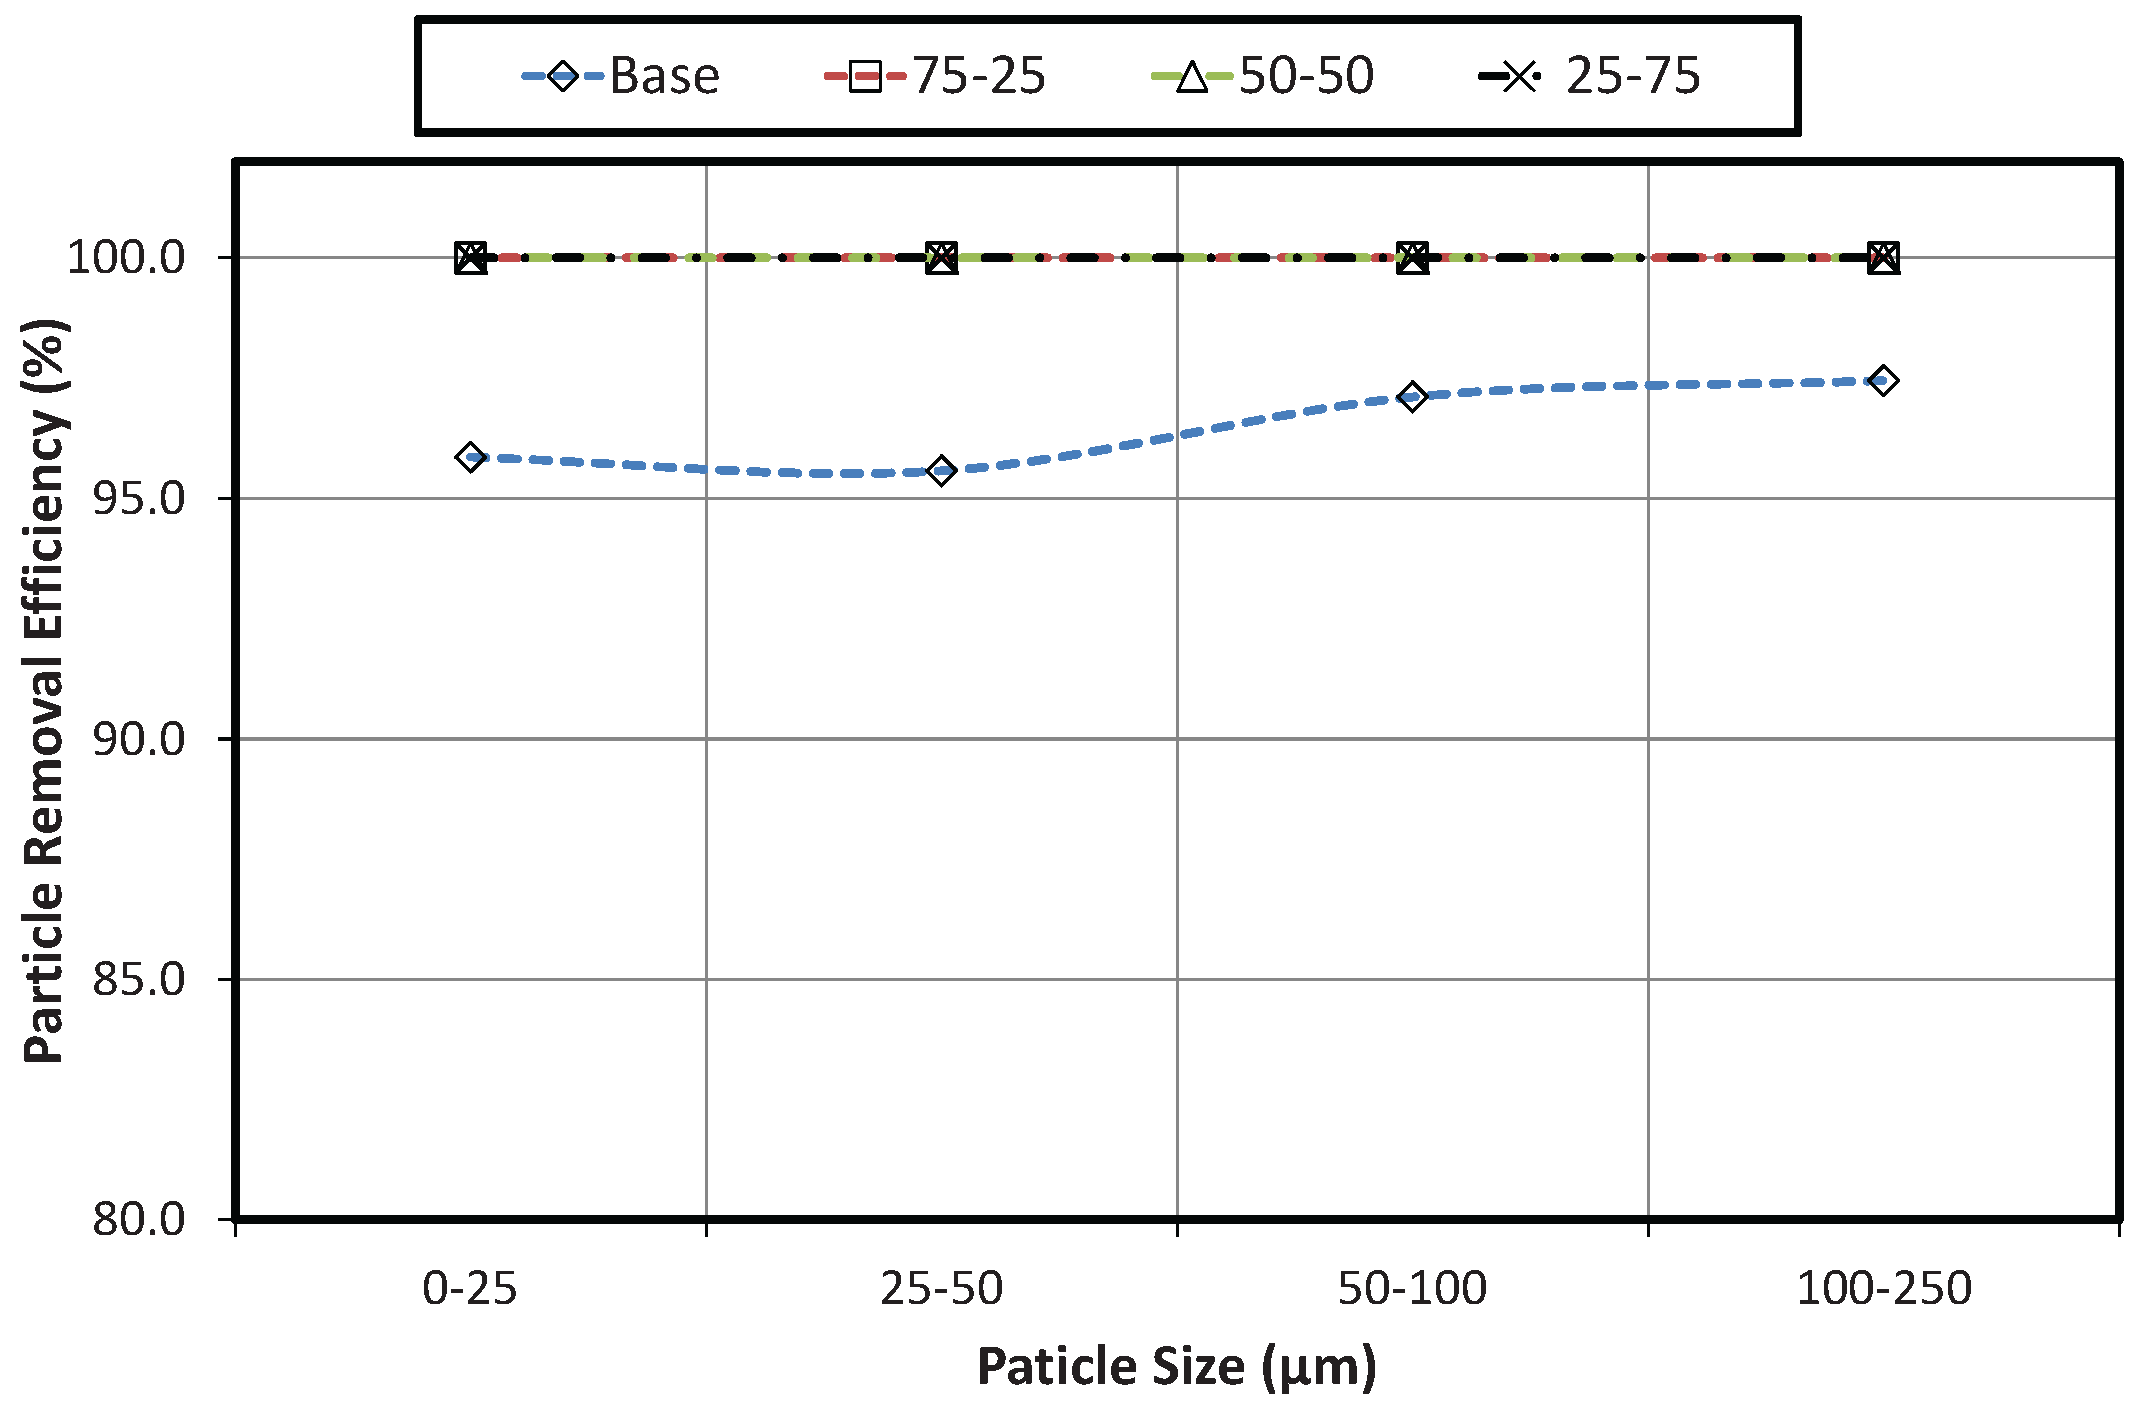
3.1.4. Sediment Removal Efficiency

Sediment removal efficiency of the filter columns is quantified by comparing the sediments present in the inflow water with the water sample obtained from the final outflow. The particle removal efficiencies of the base case and the sand-bottom ash mixtures for each distinct sediment particle size ranges are shown in Figure 9. All of tested cases are found to exhibit high positive removal efficiency in all sediment particle size. It is apparent that all sand-bottom ash cases attain 100% sediment removal efficiency. The perfect sediment removal of sand-bottom ash cases are attributed to the improved capture and entrainment of inflow sediments brought by presence of finer bottom ash particles. As for the base case, the highest particle removal efficiency that corresponds to a value of 92.61% is observed for 25–50 μ m sediment particle size whereas the lowest is 87.54% for 0–25 μ m. The presence of any sediment particle size in the effluent water is found to be unfavorable due to its ability to carry any harmful water contaminants [41,42,43]. In general, the sediment removal efficiency of each distinct sediment particle size is still high, and is believed to increase as clogging develops.

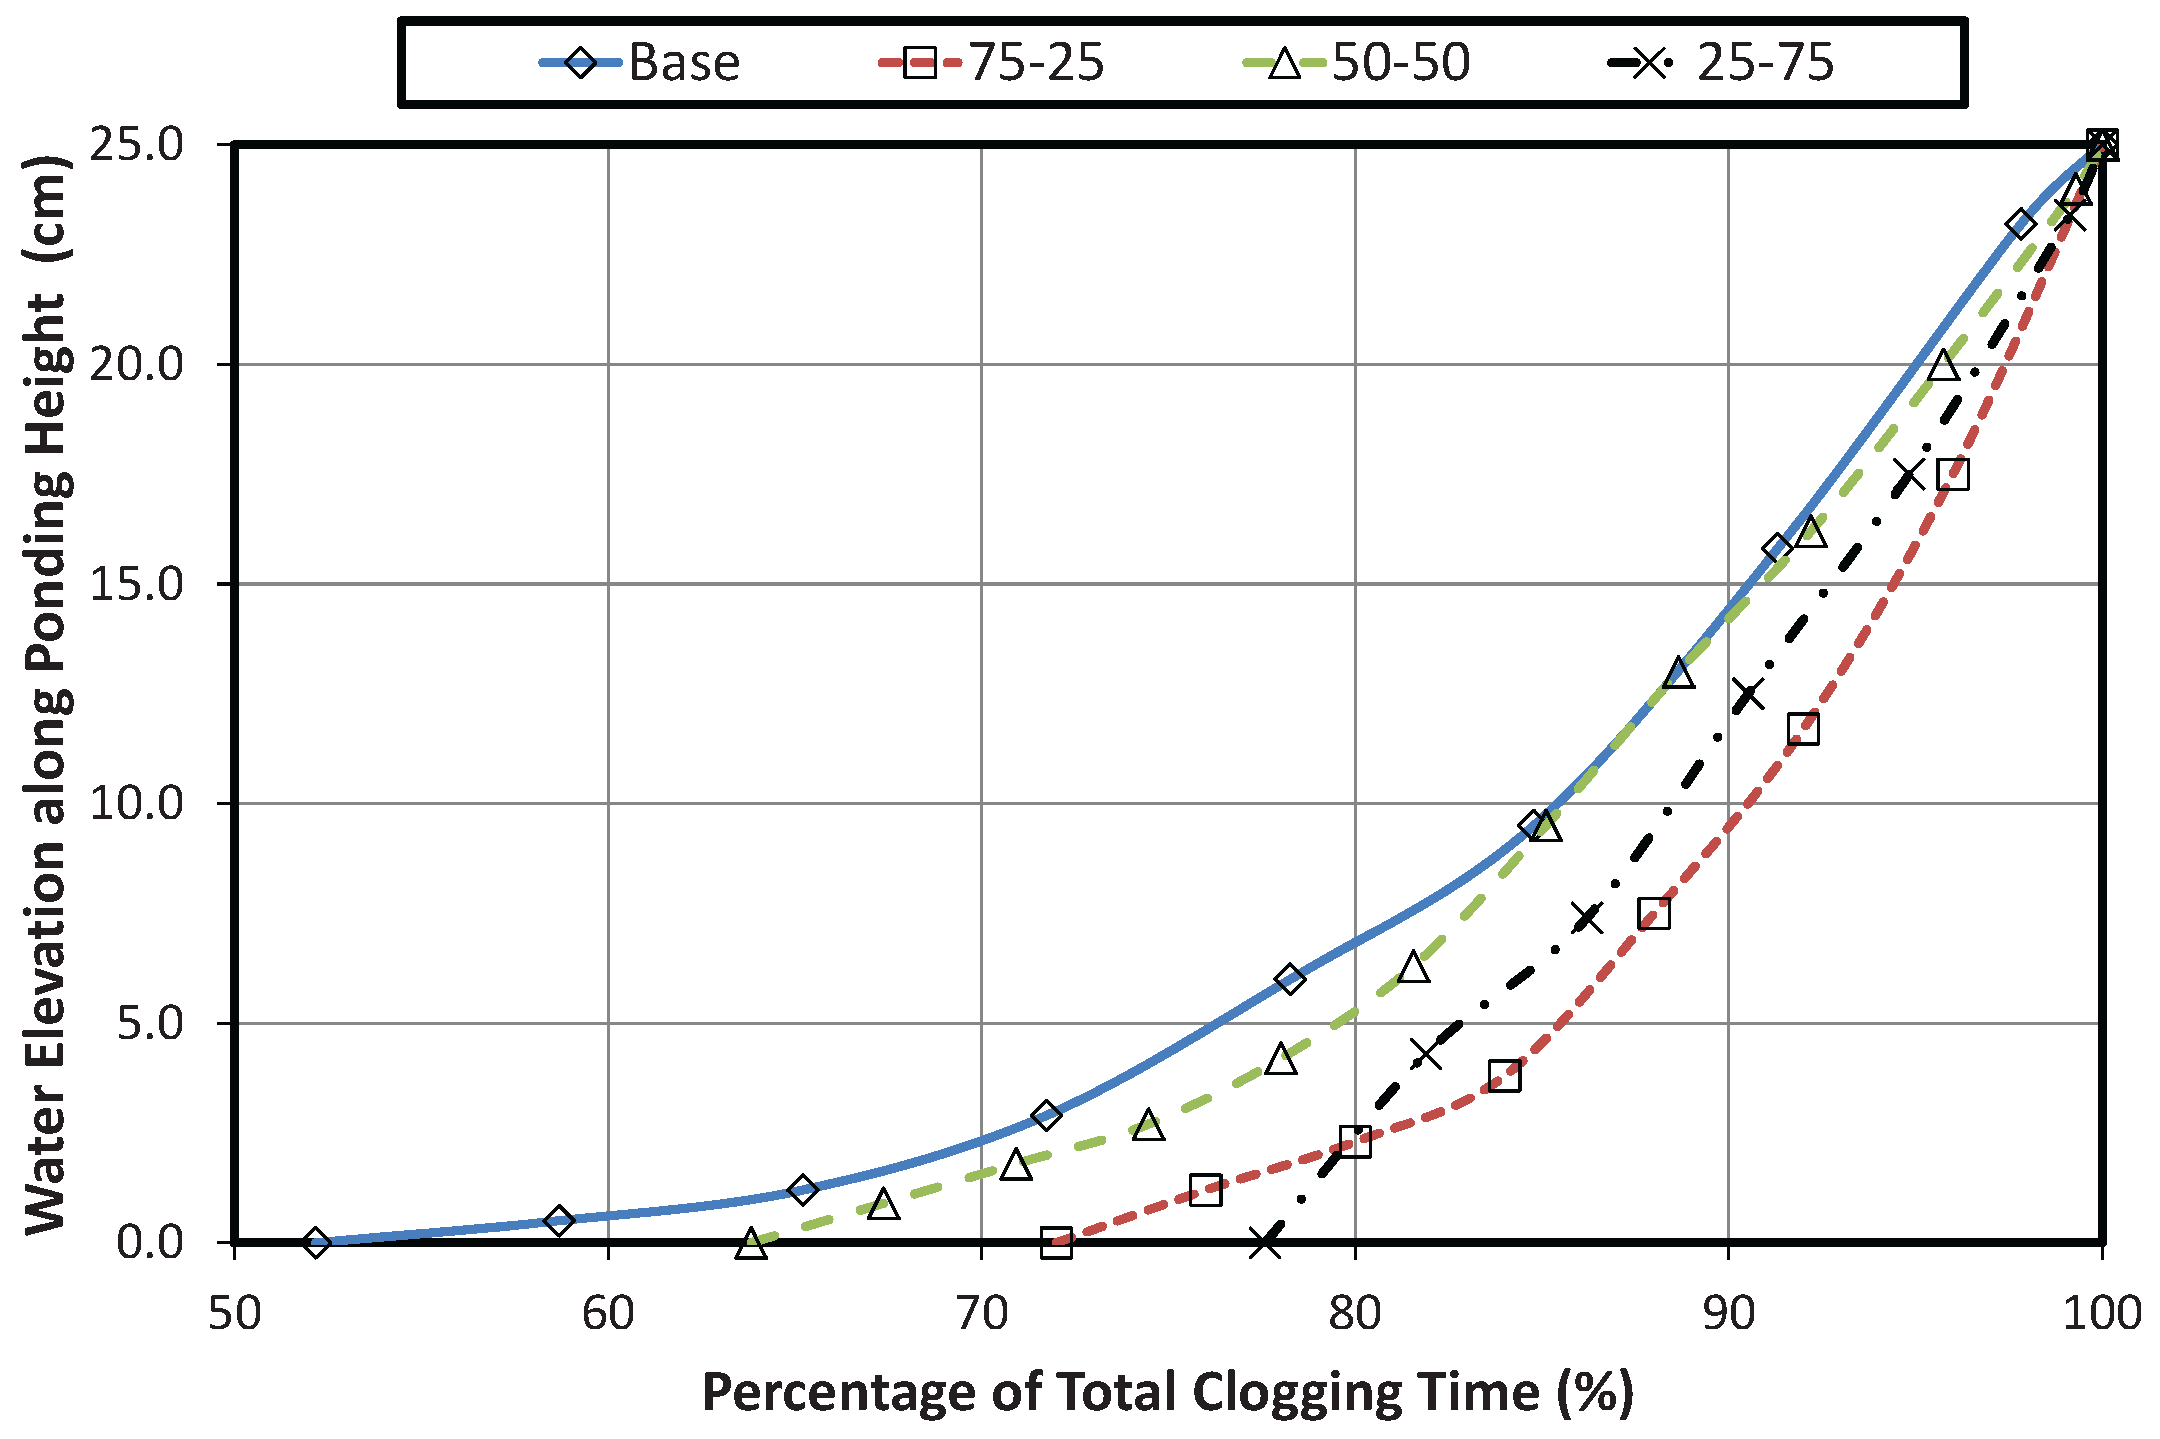
3.1.5. Increase in Water Elevation at the Column Ponding Section

The increase of water head elevation in the ponding section of column was monitored and recorded at designated time intervals. The elevation increments with respect to the percentage of the total clogging time for each case are plotted in Figure 10. A parabolic increase of water elevation is observed in the base case, and the 75-25 and 50-50 cases. The ponding phenomena starts at 52.2%, 63.8%, and 72% of the total clogging time for the base case, and the 50-50 and 75-25 cases, respectively. On the other hand, an almost linear increase that begins at 77.6% of the total clogging time is observed for the 25-75 case. The parabolic increase in water head elevation signifies a slow initial rate of clogging occurrence in the filter media that suddenly increases upon reaching the final state of clogging; whereas, a linear increase implies a constant rate of clogging.

3.2. Constant Head Flow Condition

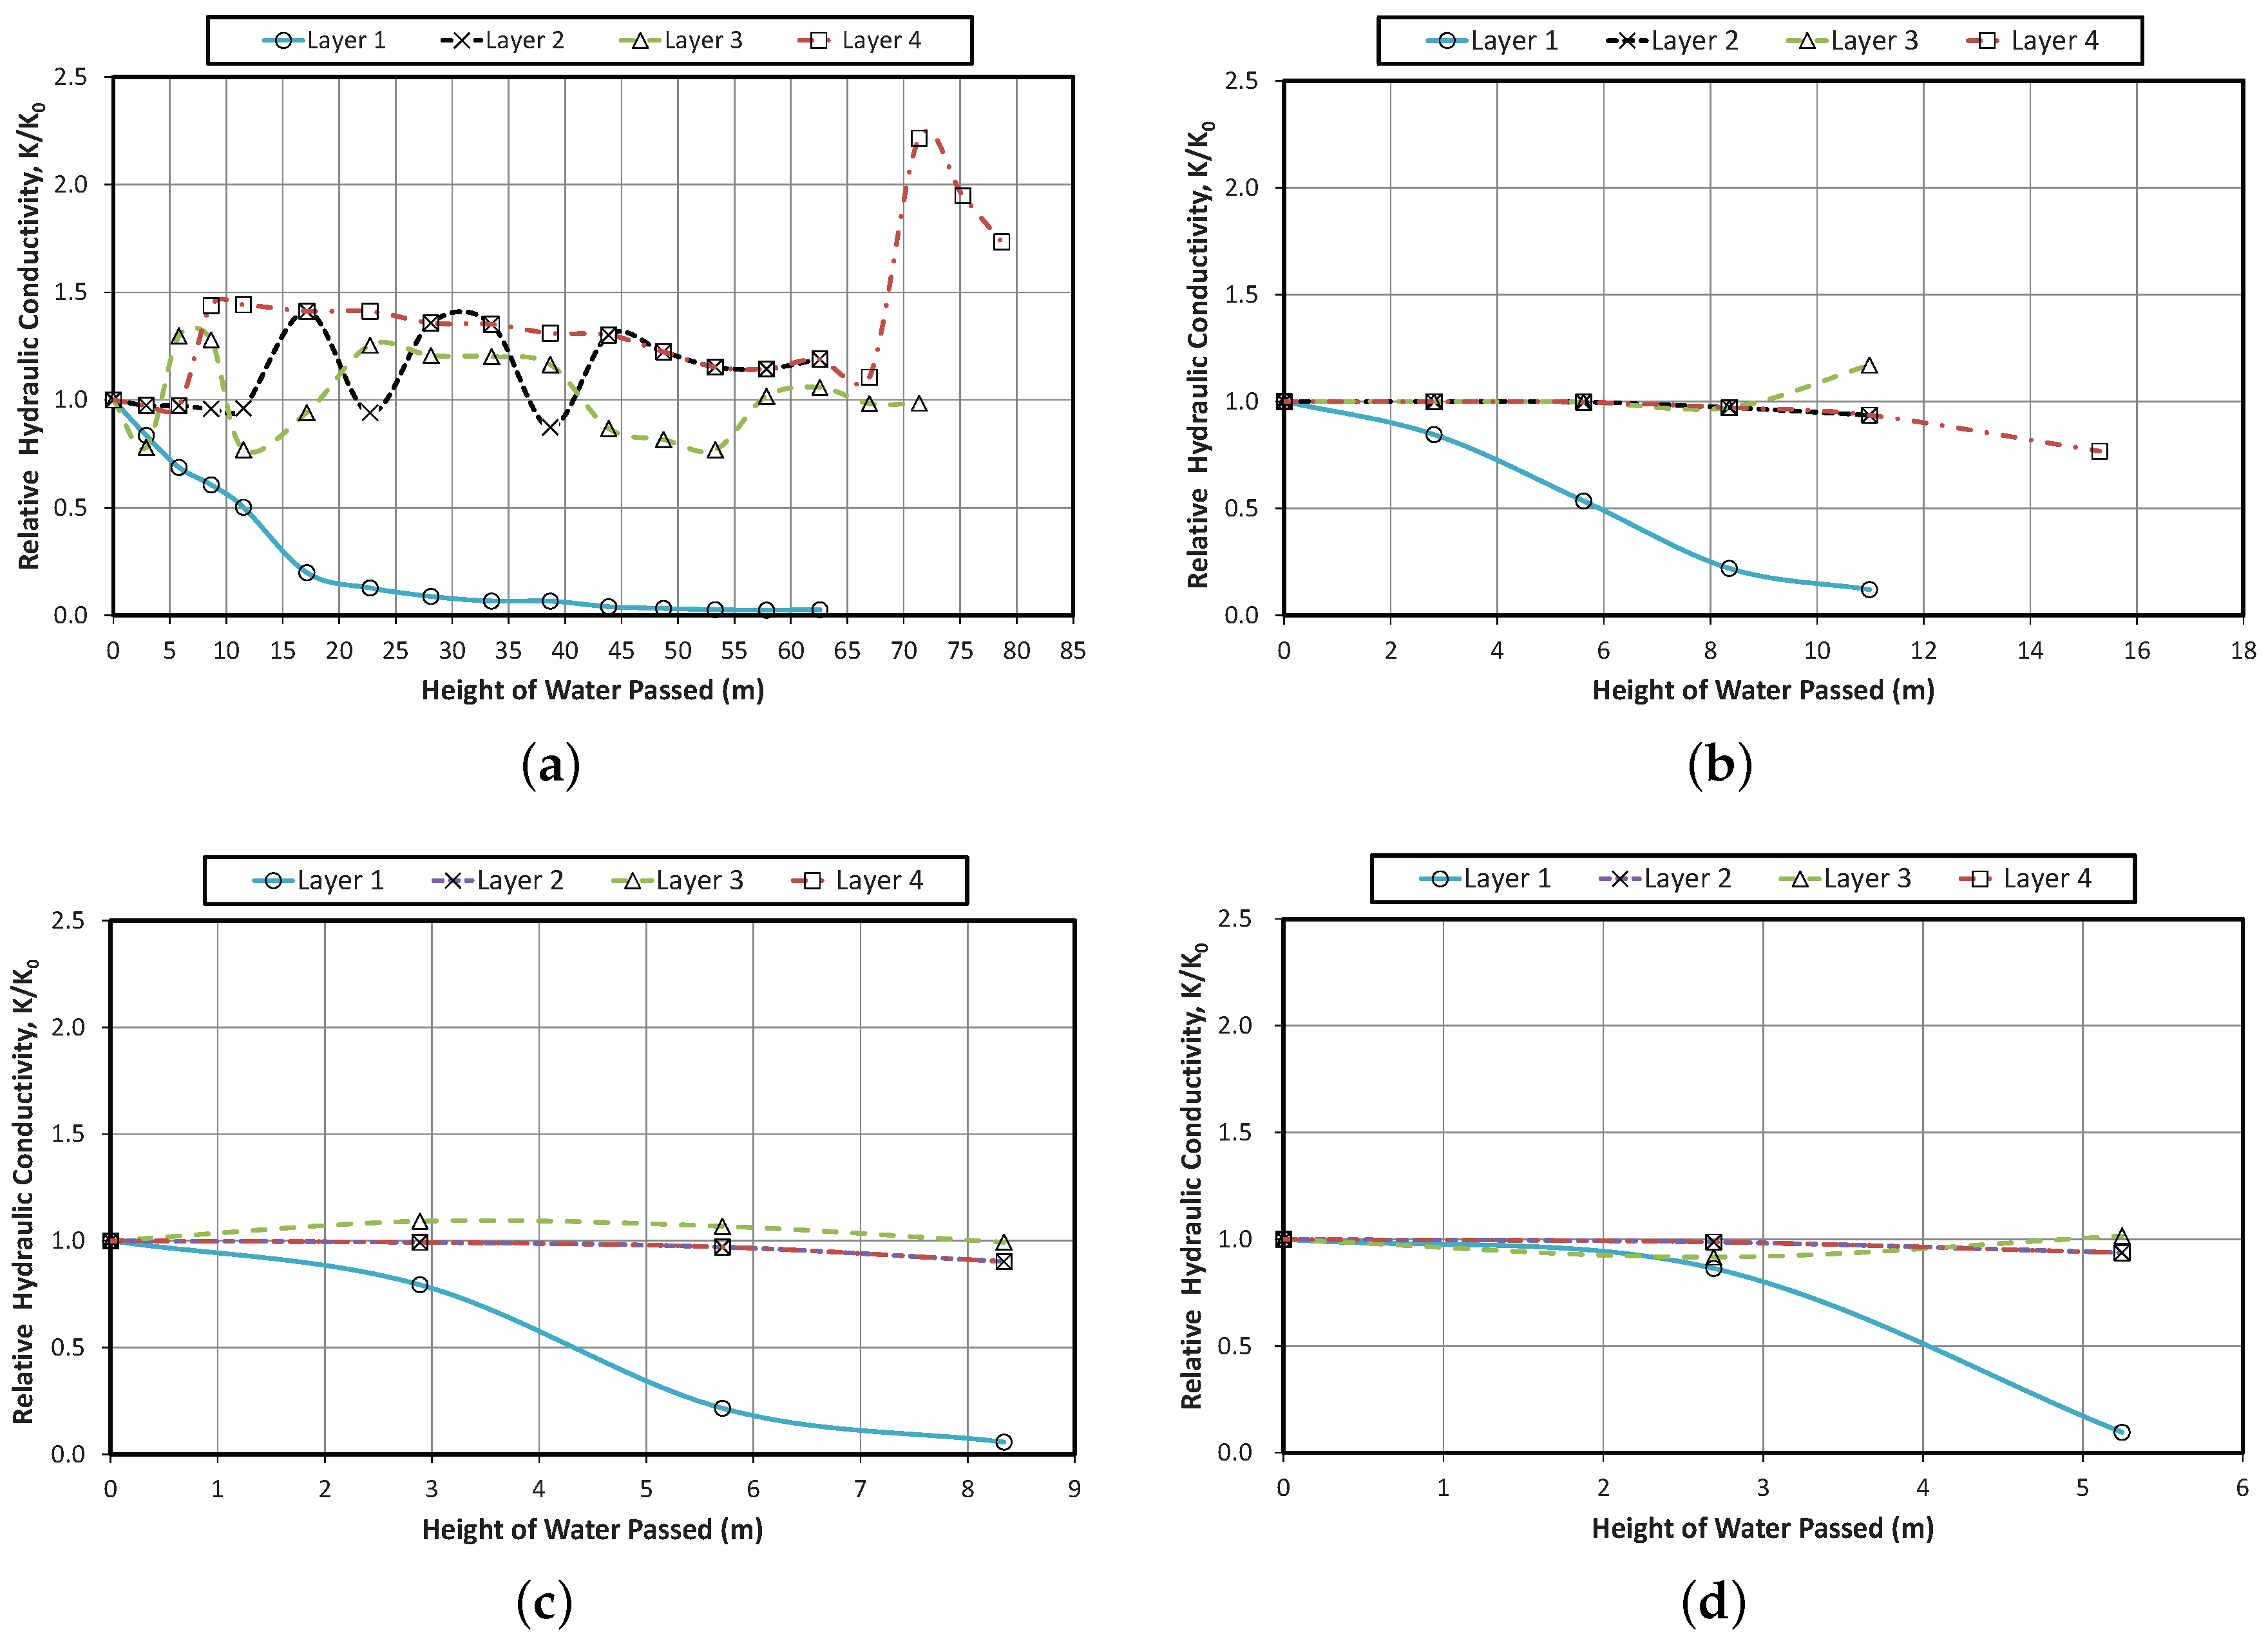
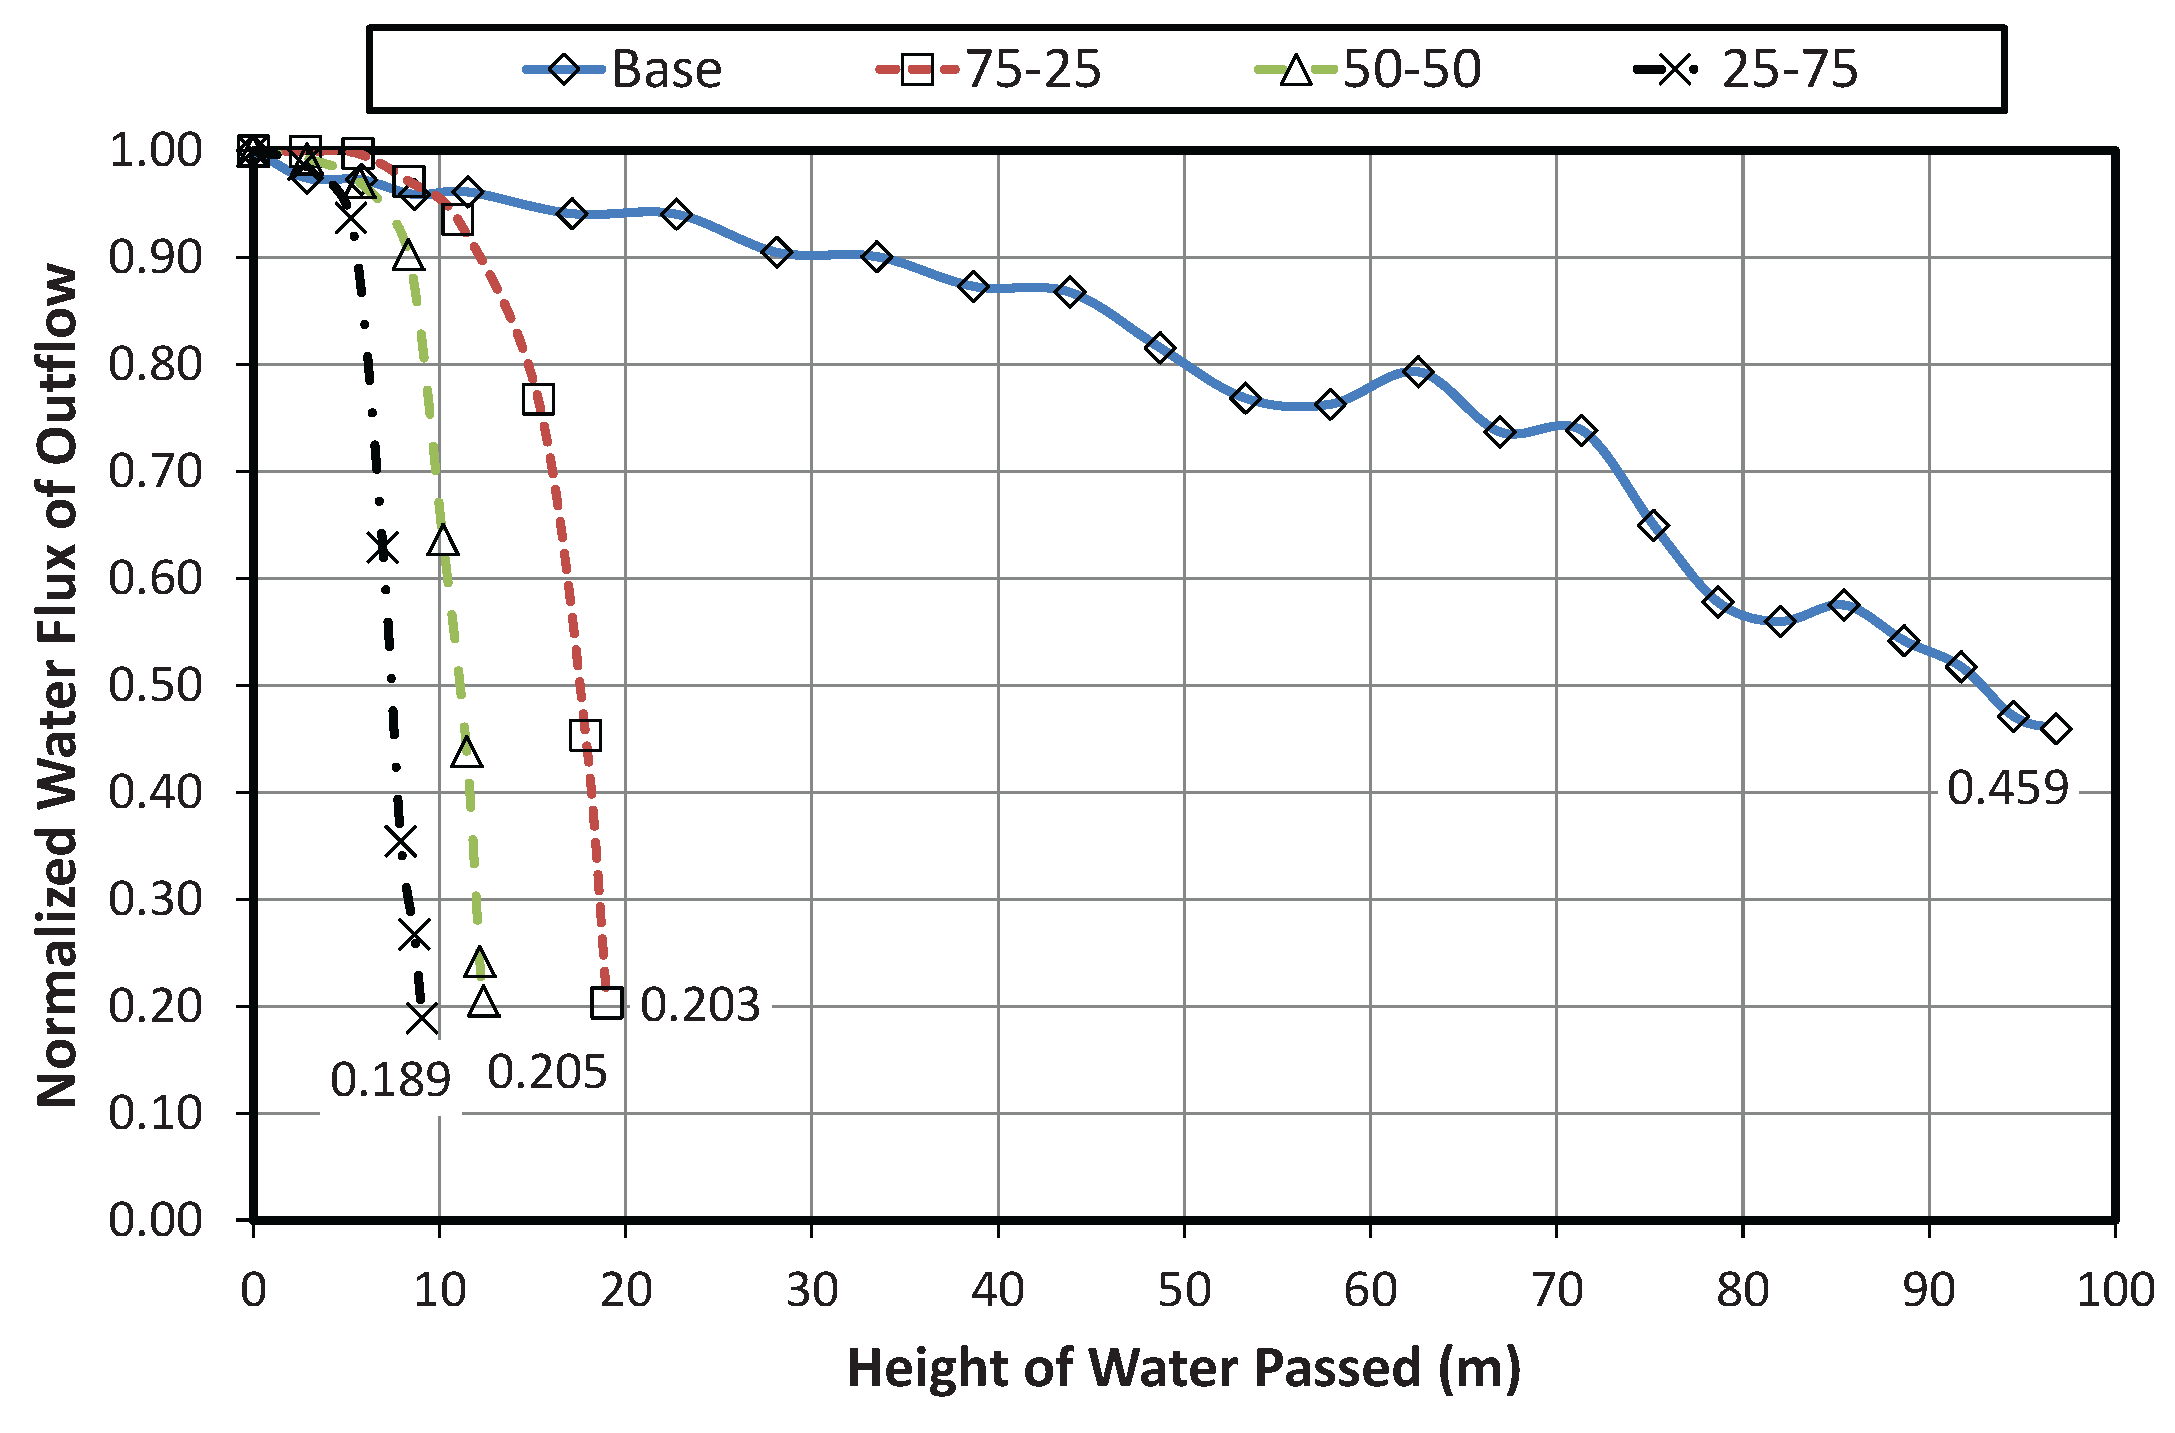
3.2.1. Clogging Characteristics and Hydraulic Conductivity Reduction

For all filter column cases under constant head flow condition, the normalized variations of the outlet water flux with the duration of infiltration are shown in Figure 11. Results identify that all sand-bottom ash mixture cases experienced clogging state before reaching the target height of 80 m water passed to end experiments; whereas, the base case reached the target height of water passed without achieving the clogging state. The outlet water flux of the base case is reduced by 54.1% upon reaching the 100 m height of water passed at a recorded time of 10.92 h. On the other hand, 75-25, 50-50, and 25-75 cases reach clogging state after passing 19.00, 12.37, and 9.06 m of water heights at a time of 2.50, 1.58, and 1.45 h respectively. Results prove that base case has a higher clogging resistance as compared to sand-bottom ash cases when subjected to constant head flow. Also, it concludes that the presence of bottom ash in the filter media significantly affects clogging wherein the amount of bottom ash is directly proportional to the rate and chance of clogging.
To give a better view of the changes in hydraulic conductivity occurring within the filter column, the variations in hydraulic conductivity of designated filter column layers (Figure 3b) were monitored. The variations are normalized to the initial value, and plotted with respect to the corresponding height of water passed in Figure 12. All the hydraulic conductivity readings were terminated at the instance where the filter media layers undergo a change of state from saturated to unsaturated soil condition. Unsaturated condition was defined in this study as the state where the recorded manometer pressure head readings reached a value that was less than the elevation of the point where the head reading was recorded.
As shown in Figure 12, the hydraulic conductivity of top layer (Layer 1 in Figure 3b) in filter cases is reduced by almost 90%–95%, which is the largest among the layers along the filter column, due to the formed clogged layer. The formation of a clogging layer enhances particle capture and limits the passage of water down into the filter column thus creating a matric suction potential in the unsaturated zone of filter media. Theoretically, as stated in Poiseuille’s and Darcy’s laws, the rate of water flowing through a pore is proportional to the fourth power of the radius of the pore. Thus, as pore size decreases due to sediment accumulation, an exponential decrement in water flow occurs. Moreover, layers 2, 3 and 4 of the base case shown in Figure 12a exhibit hydraulic conductivity fluctuations which are caused by the suspended solids entrapment, and filter media particle re-arrangement and re-entrainment. In the sand-bottom ash cases shown in Figure 12b–d, it is noticed that the hydraulic conductivity at the lower layers do not fluctuate; as well as the degree of changes in hydraulic conductivity decreases with an increase in the amount of bottom-ash present in the filter media. Results imply that particle re-arrangement of filter media for the sand-bottom ash cases are not as evident as in the base case media due to its finer filter media content that enables better sediment capture. Therefore, reductions in the infiltration rates or hydraulic conductivity of sand-bottom ash media configurations are brought mainly by the formation of clogging layer.

3.2.2. Trapped Sediments in Filter Column

As illustrated in Figure 13, the amount of sediment accumulated is highest at the upper 15% of depth that suddenly decreases as it reaches the bottom for all filter cases. The decrease in the percentage of total sediment trapped with respect to depth of the filter column is more obvious in the base case, whereas, a seemingly uniform amount of sediment trapped with depth is found on all sand-bottom ash cases. At the surface of all filter columns cases, a cake layer was found to form with time time which was similar on the observation in previous study [21]. This cake layer was speculated to be brought by particle sedimentation and filter media filtration that further assisted in removing the influent suspended solids prior to its transport or release in the filter system. For the base case, 74.77% of total sediment trapped is found at the upper 15% of the filter media depth. As for the sand-bottom ash cases, the total percentage of sediment trapped at the upper 15% filter depth is 87.36, 91.15, and 89.90% for 75-25, 50-50, and 25-75 cases, respectively. The presence of bottom ash material in the filter media has resulted in a higher and almost the same amount of particle capture trapped at the upper 15% of the filter column depth. The increase in the amount of bottom ash present in the filter media is anticipated to induce a lesser amount of sediment that can be transported deeper into the filter column due to its enhanced particle entrapment efficiency; however, Figure 13 shows that the sand-bottom ash cases exhibit a uniform values of percentage of total sediment trapped at the bottom 70% of the filter column depth. Even though it is difficult to quantify the amount of particle breakage experienced by the filter media during the clogging experiment, it is contemplated that the acquired findings are attributed to the combined effect of the amount of sediment trapped and the amount of particle breakage experienced by the bottom-ash; by which, the produced amount of sediment due to filter media breakage is somehow proportional or related to the amount of bottom-ash present and used as a filter media.

3.2.3. Influence of Sediment Particle Size on Clogging

The clogging layer, which was previously identified to form at the upper part of the filter media, is mostly made up of 100–250 μ m sediment particle size for all media configuration as presented in Figure 14. For the base case shown in Figure 14a, it is identified that the amount of 100–250 μ m particle size dominates the upper 55% of filter media depth that decrease suddenly upon reaching the bottom of filter column. The decrease in the fraction of 100–250 μ m particle size results in an increase in fraction of smaller sediment sizes, specifically particle size range of 0–25 μ m, found at filter column depth. The constant head water flow of the system seems able to assist in the transportation or entrapment of fine sediment particles sized less than 100 μm along theat the deeper depths of filter column.
As compared to the base case, Figure 14b–d reveal that the presence of bottom ash in the filter media gives a lesser reduction in sediment fraction having particle size of 100–250 μ m found at media depths. All sand-bottom ash cases exhibit the same behavior of having an almost constant percentage of sediment trapped along the depths regardless of sediment particle size. Similar with the experimental results performed under varying head condition, it is observed that an increase in bottom ash fraction results in an increase in the amount of 100–250 μ m particle size present along the filter media depth; however, the increase is lesser when the filter media is subjected to constant water head condition. It is reasonable to hypothesize that the breakage of bottom ash was able to produce a large amount of sediments having a particle size greater than 100 μ m. These particle breakage residues are generally mistaken as the filtered sediment particles present in the influent water that was captured or trapped along the filter column.

3.2.4. Sediment Removal Efficiency

The particle removal efficiencies of all filter column cases for each distinct sediment particle size ranges under the constant head flow are shown in Figure 15. It is identified that all the sand-bottom ash cases reach a perfect sediment removal efficiency on all sediment particle sizes; whereas, an improved particle removal efficiency on all particle sizes is observed in the base case as compared to its performance during the varying head flow condition as shown in Figure 9. The high sediment removal percentage of all filter columns, especially for the base case, is caused by the improved sediment capture brought by the constant head water flow. The constant head water along the ponding height of the filter column greatly assists in influent particles sedimentation by which heavier and larger particles are the ones to settle first along the filter media due to its high settling velocity. The settlement and stacking of larger particles, specifically at the top layer of the column, enable a quicker clogging layer formation. The formed clogging layer enhances the particle removal efficiency of smaller sediments by limiting its entrance to the filter column and reducing its concentration in the water outflow discharge.

4. Conclusions

It was noted that one of the goals of this study was to compare and determine the physical clogging potential of infiltration filters with different un-compacted filter media configurations (sand, and the sand-bottom ash mixtures) under two water flow conditions: varying head and constant head. This study was performed for filter media comparison rather than predicting its actual field behavior. Obtained results are expected to assist on identifying the clogging formation rate and its possible effect on the behavior and performance of the whole filter column system. The findings of the infiltration clogging experiment performed at different flow conditions are as follows:

Varying head condition

  • Premature clogging prevailed in all performed column experiments wherein the base case experienced the least amount of reduction in hydraulic conductivity.
  • The fraction amount of bottom ash used as filter media greatly affects the possibility of clogging. The sand-bottom ash mixing ratio of 50-50, 75-25, and 25-75 were the sequence order that induces a more clogged and shorter filter life span.
  • Similar with previous study [21], a “cake-like” layer, which was mostly made up of 100–250 μ m sediment particle size, was found to form at the upper 15% of the filter media depth regardless of media configuration being used.
  • Seepage forces under varying head flow induced particle breakage, most likely on bottom ash filter media, which increased the amount of sediment particles of size less than 250 μ m present along the filter media depth. An increase in bottom ash fraction used as filter media had resulted in an increase in amount of accumulated sediments found at the deeper depths of the filter column.
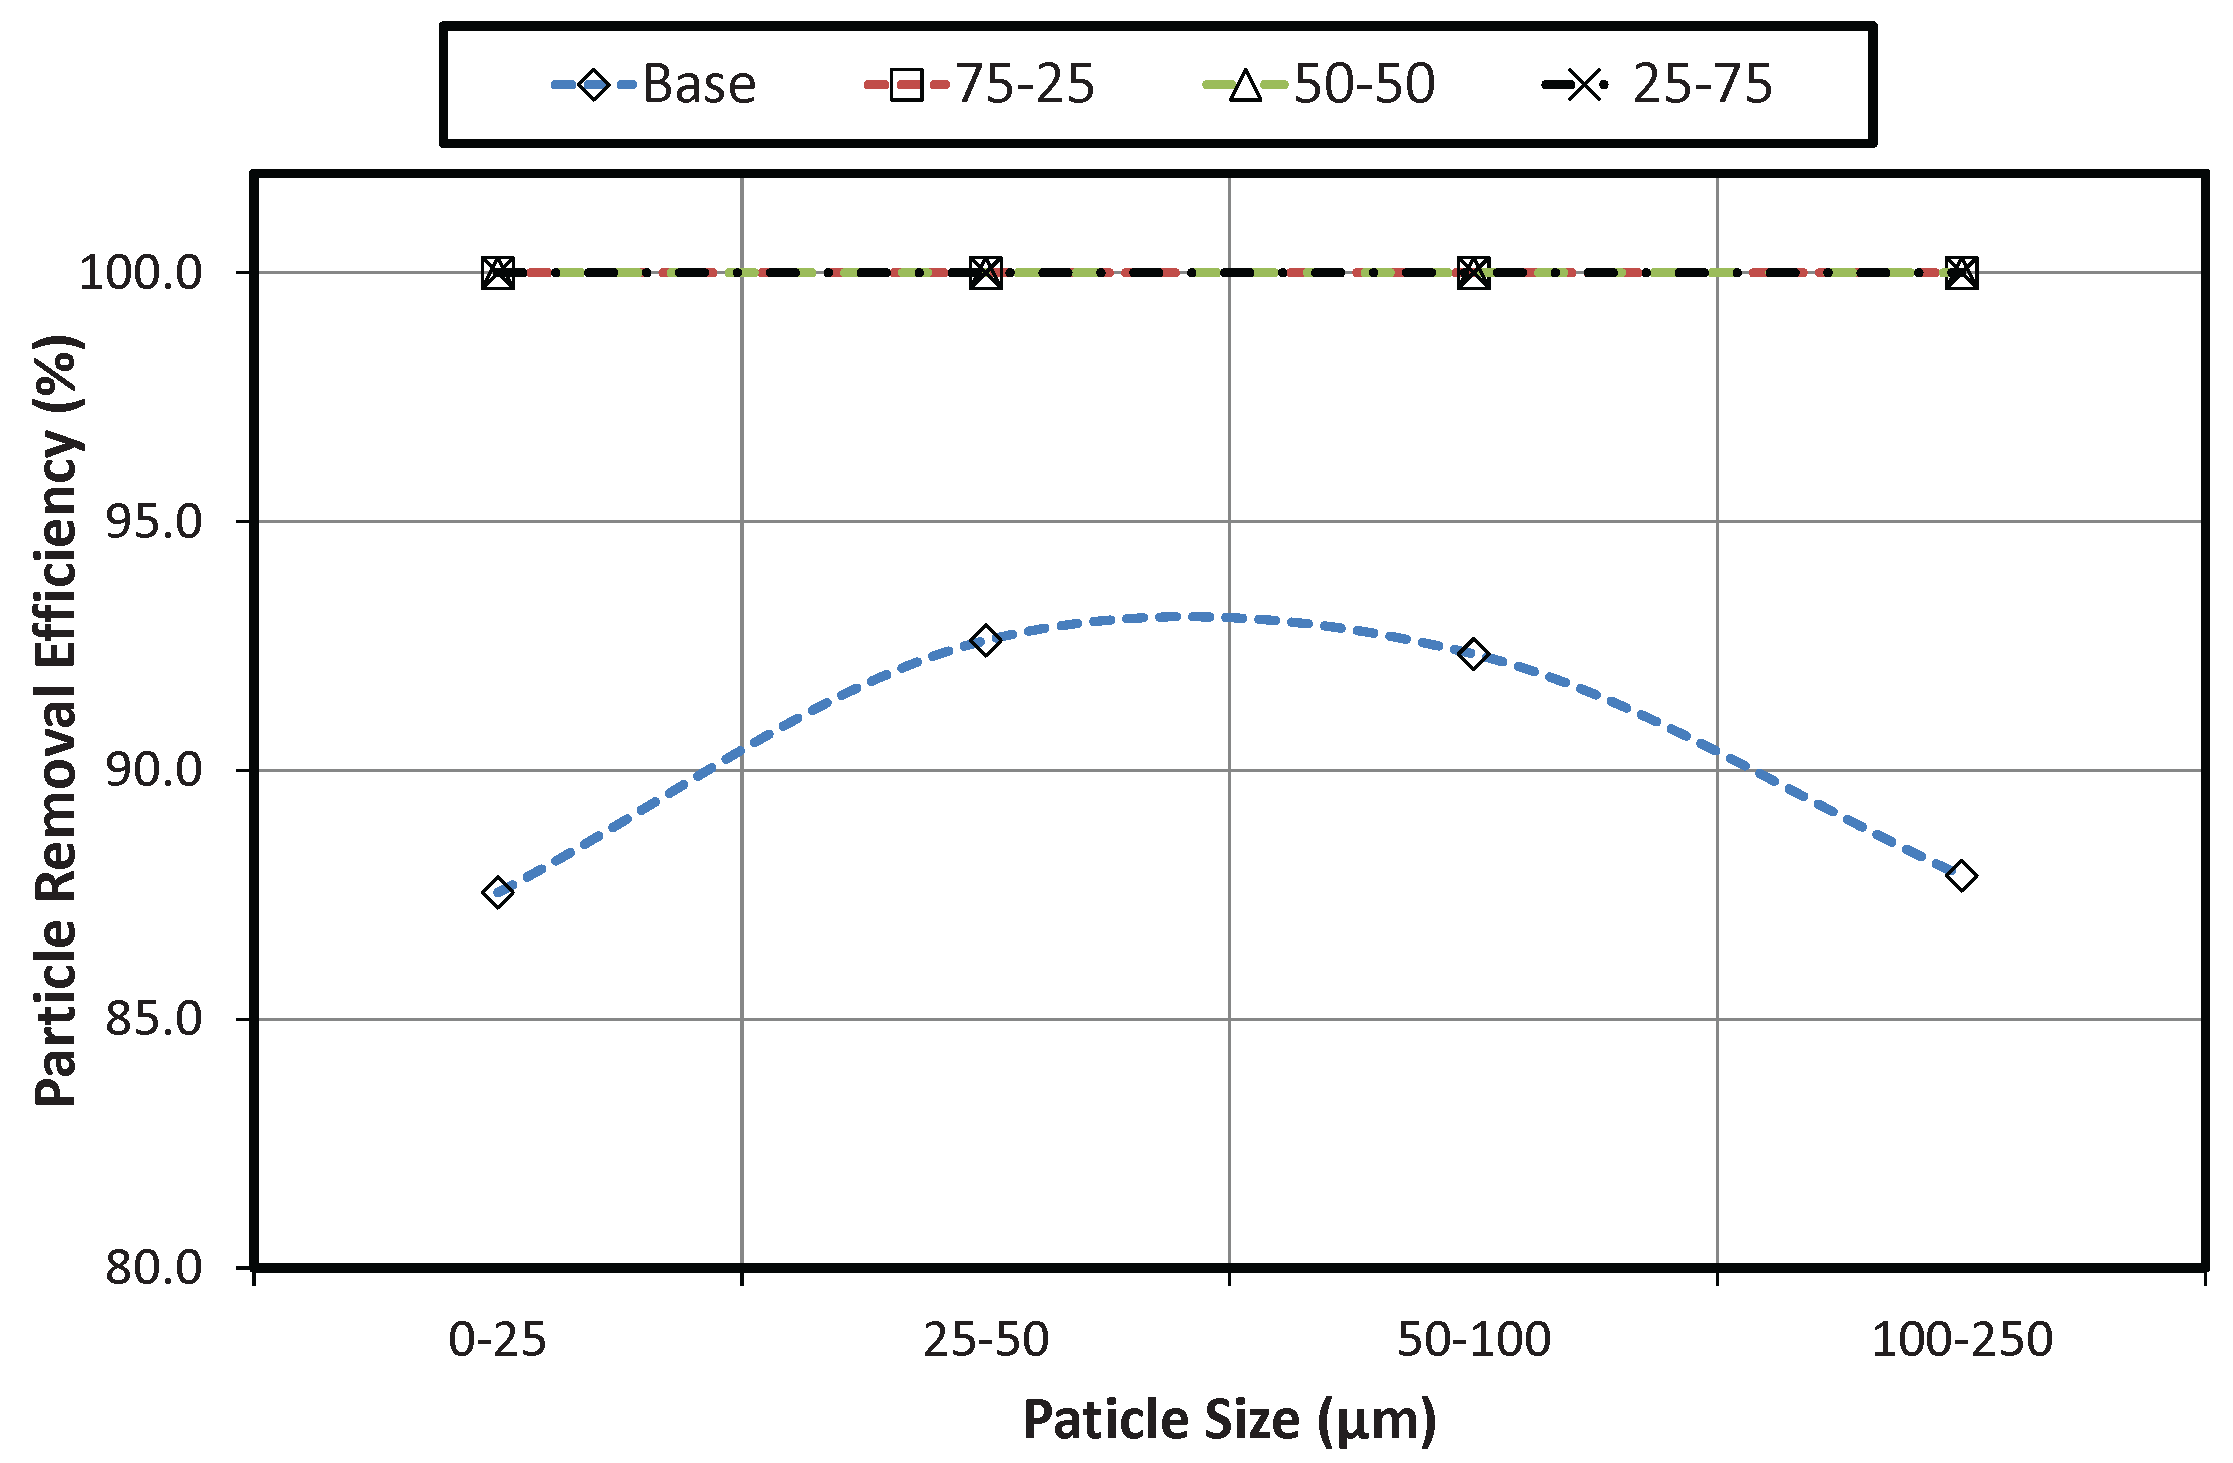
  • All sand-bottom ash filter media gave 100 % particle removal efficiency in all sediment particle size range; whereas, single sand layer exhibited a particle removal efficiency range values of 87%–93%.

Constant head condition

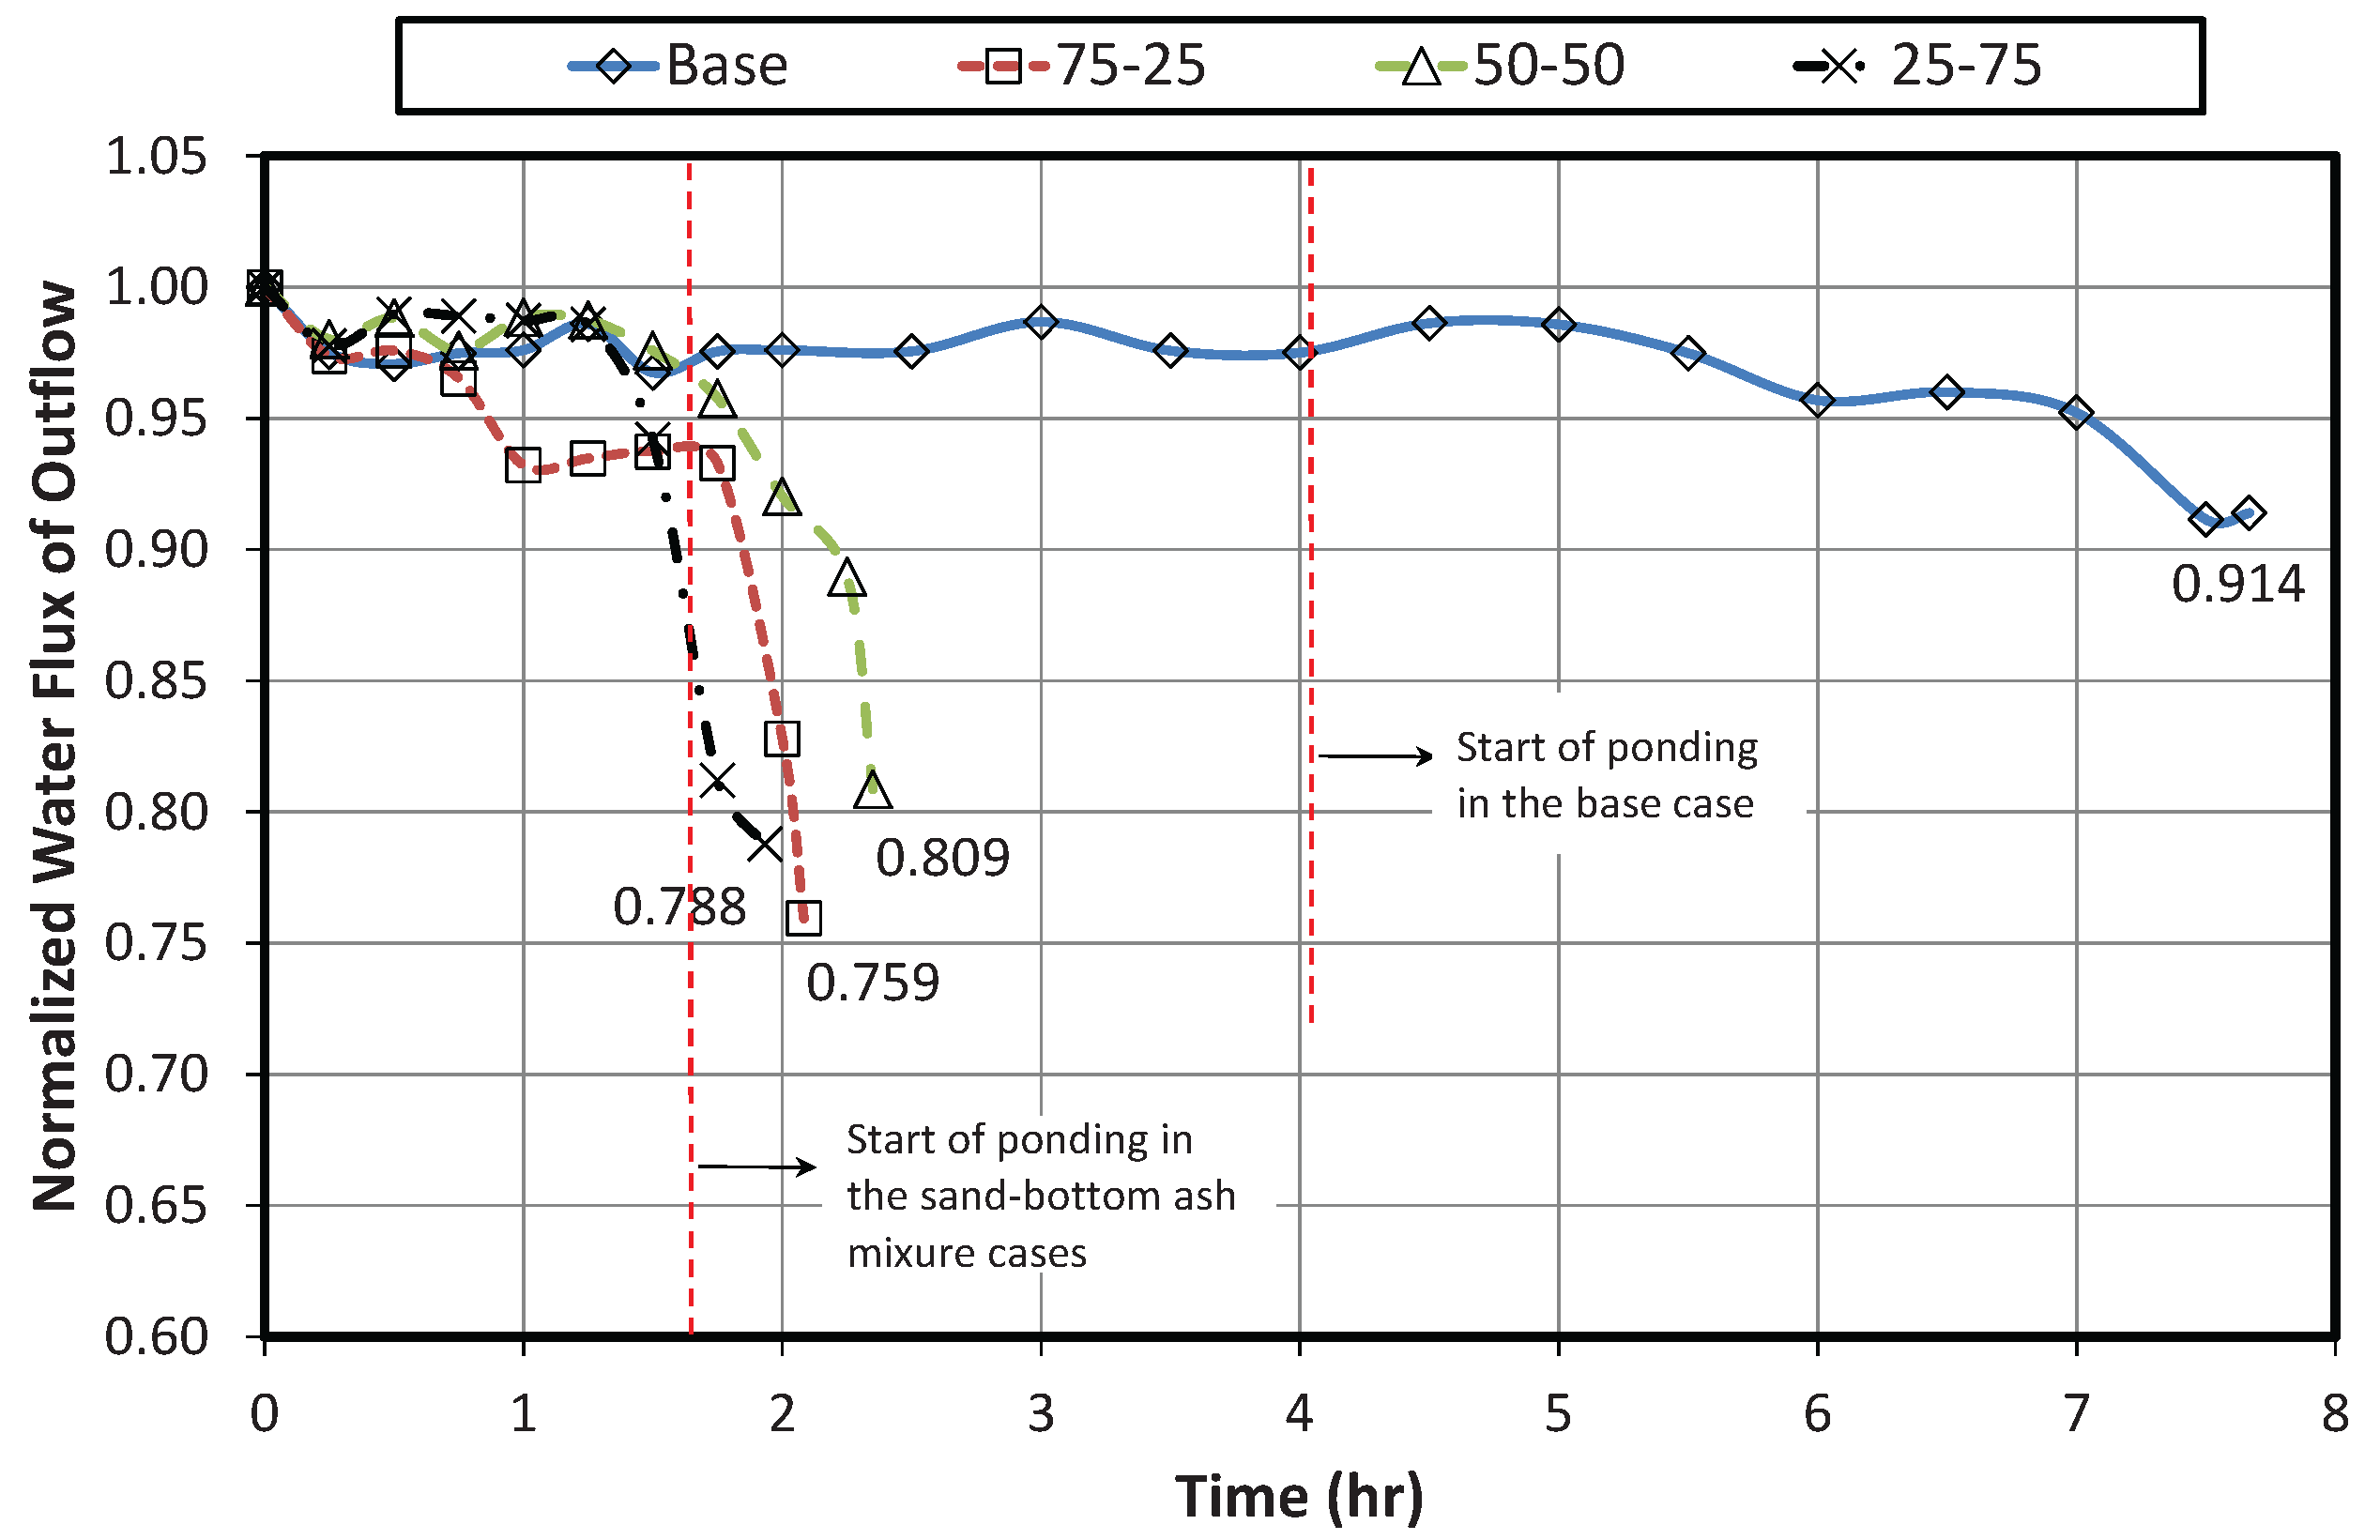
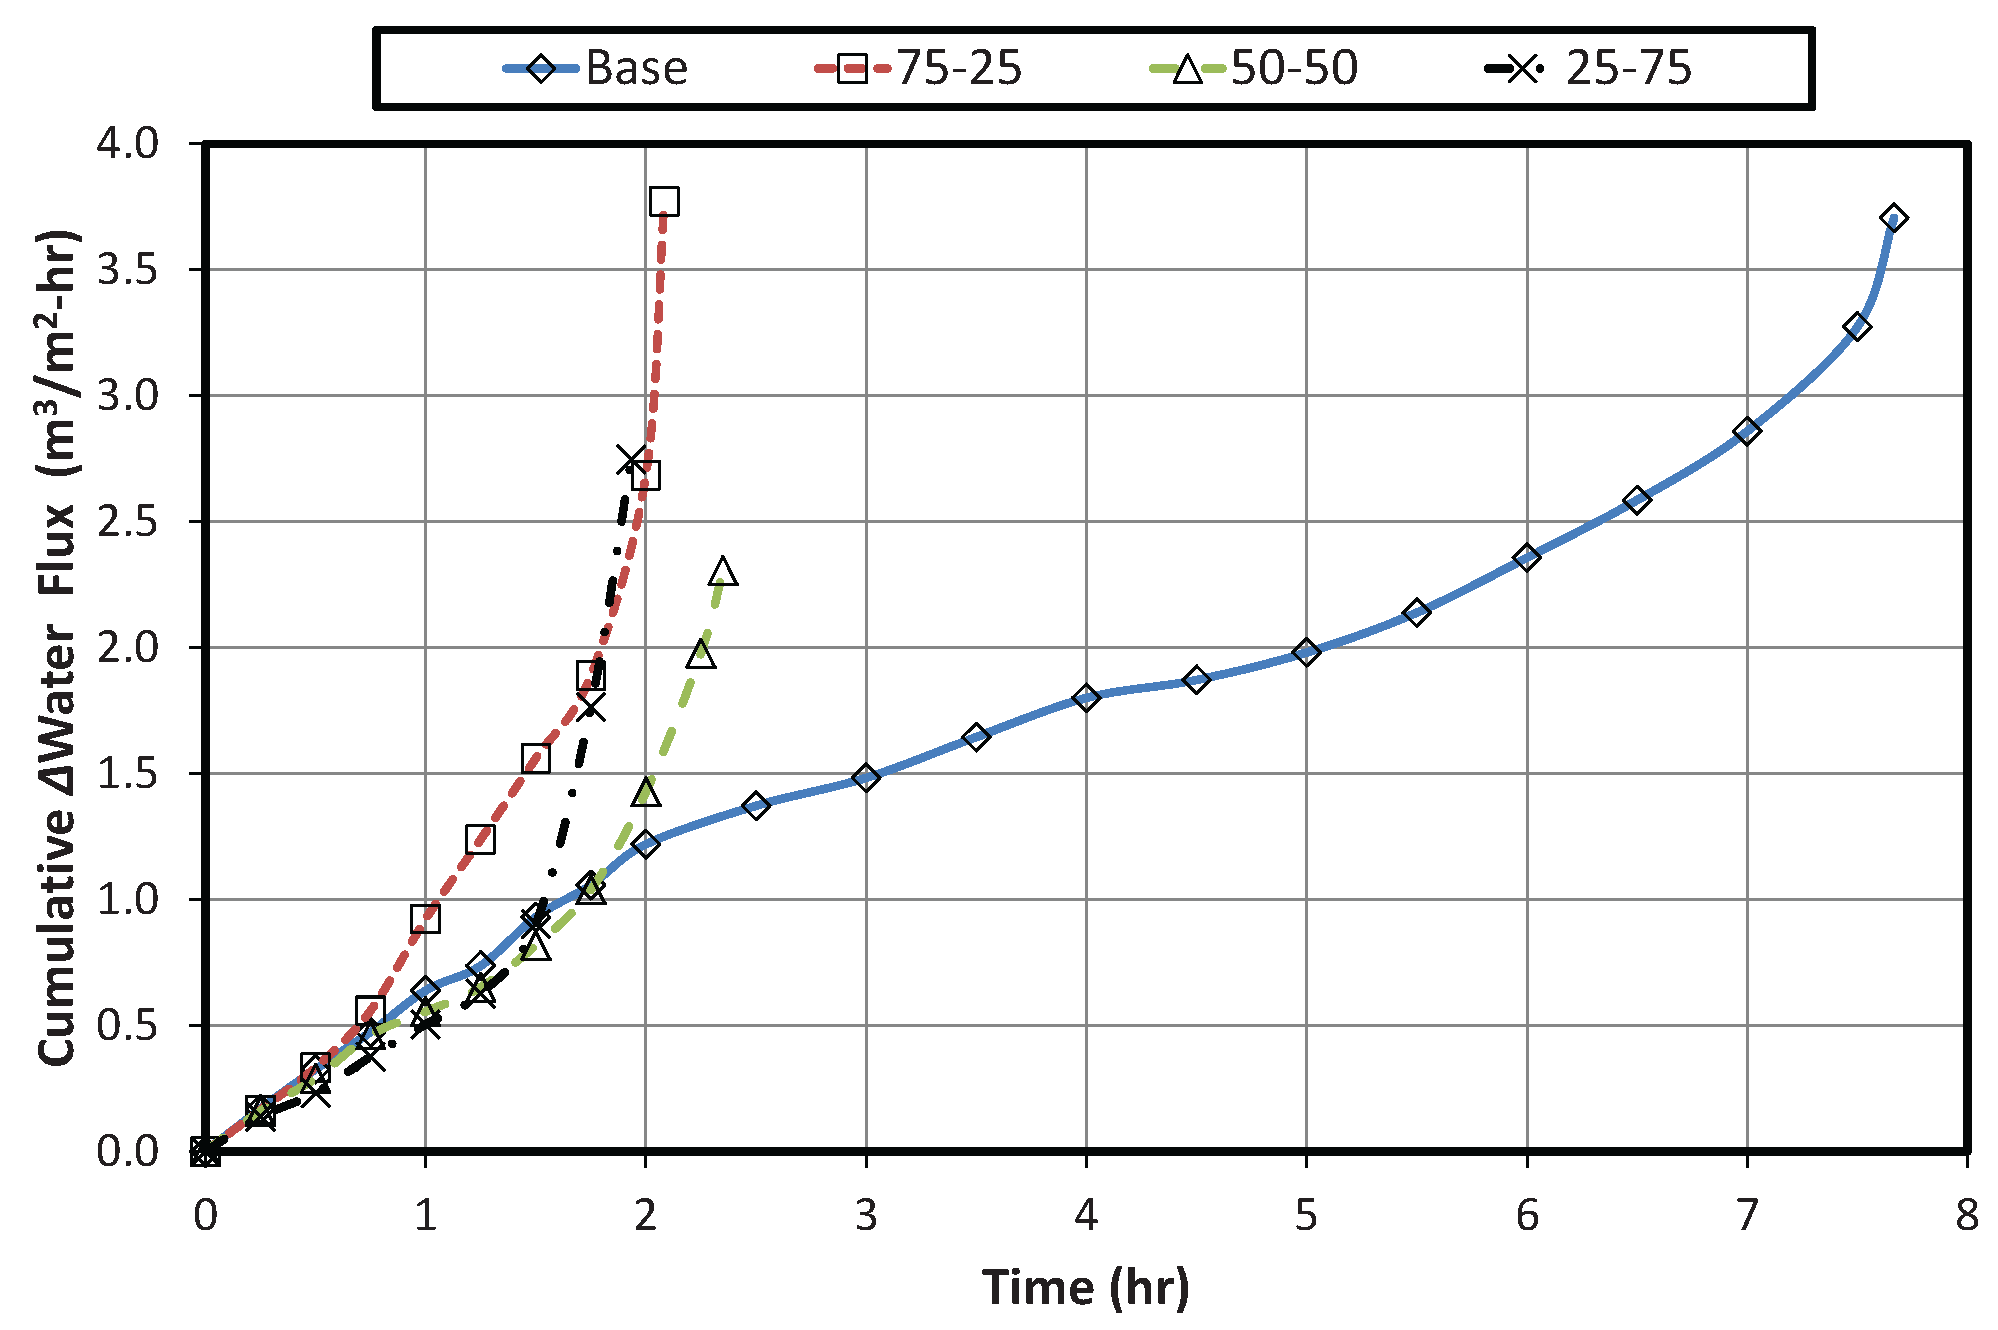
  • The clogging state prevailed in all the sand-bottom ash cases wherein it was identified that the clogging time experienced by the system was inversely proportional to the fraction of bottom ash present as filter media. The base case was the only configuration that reached the target amount of water to be treated.
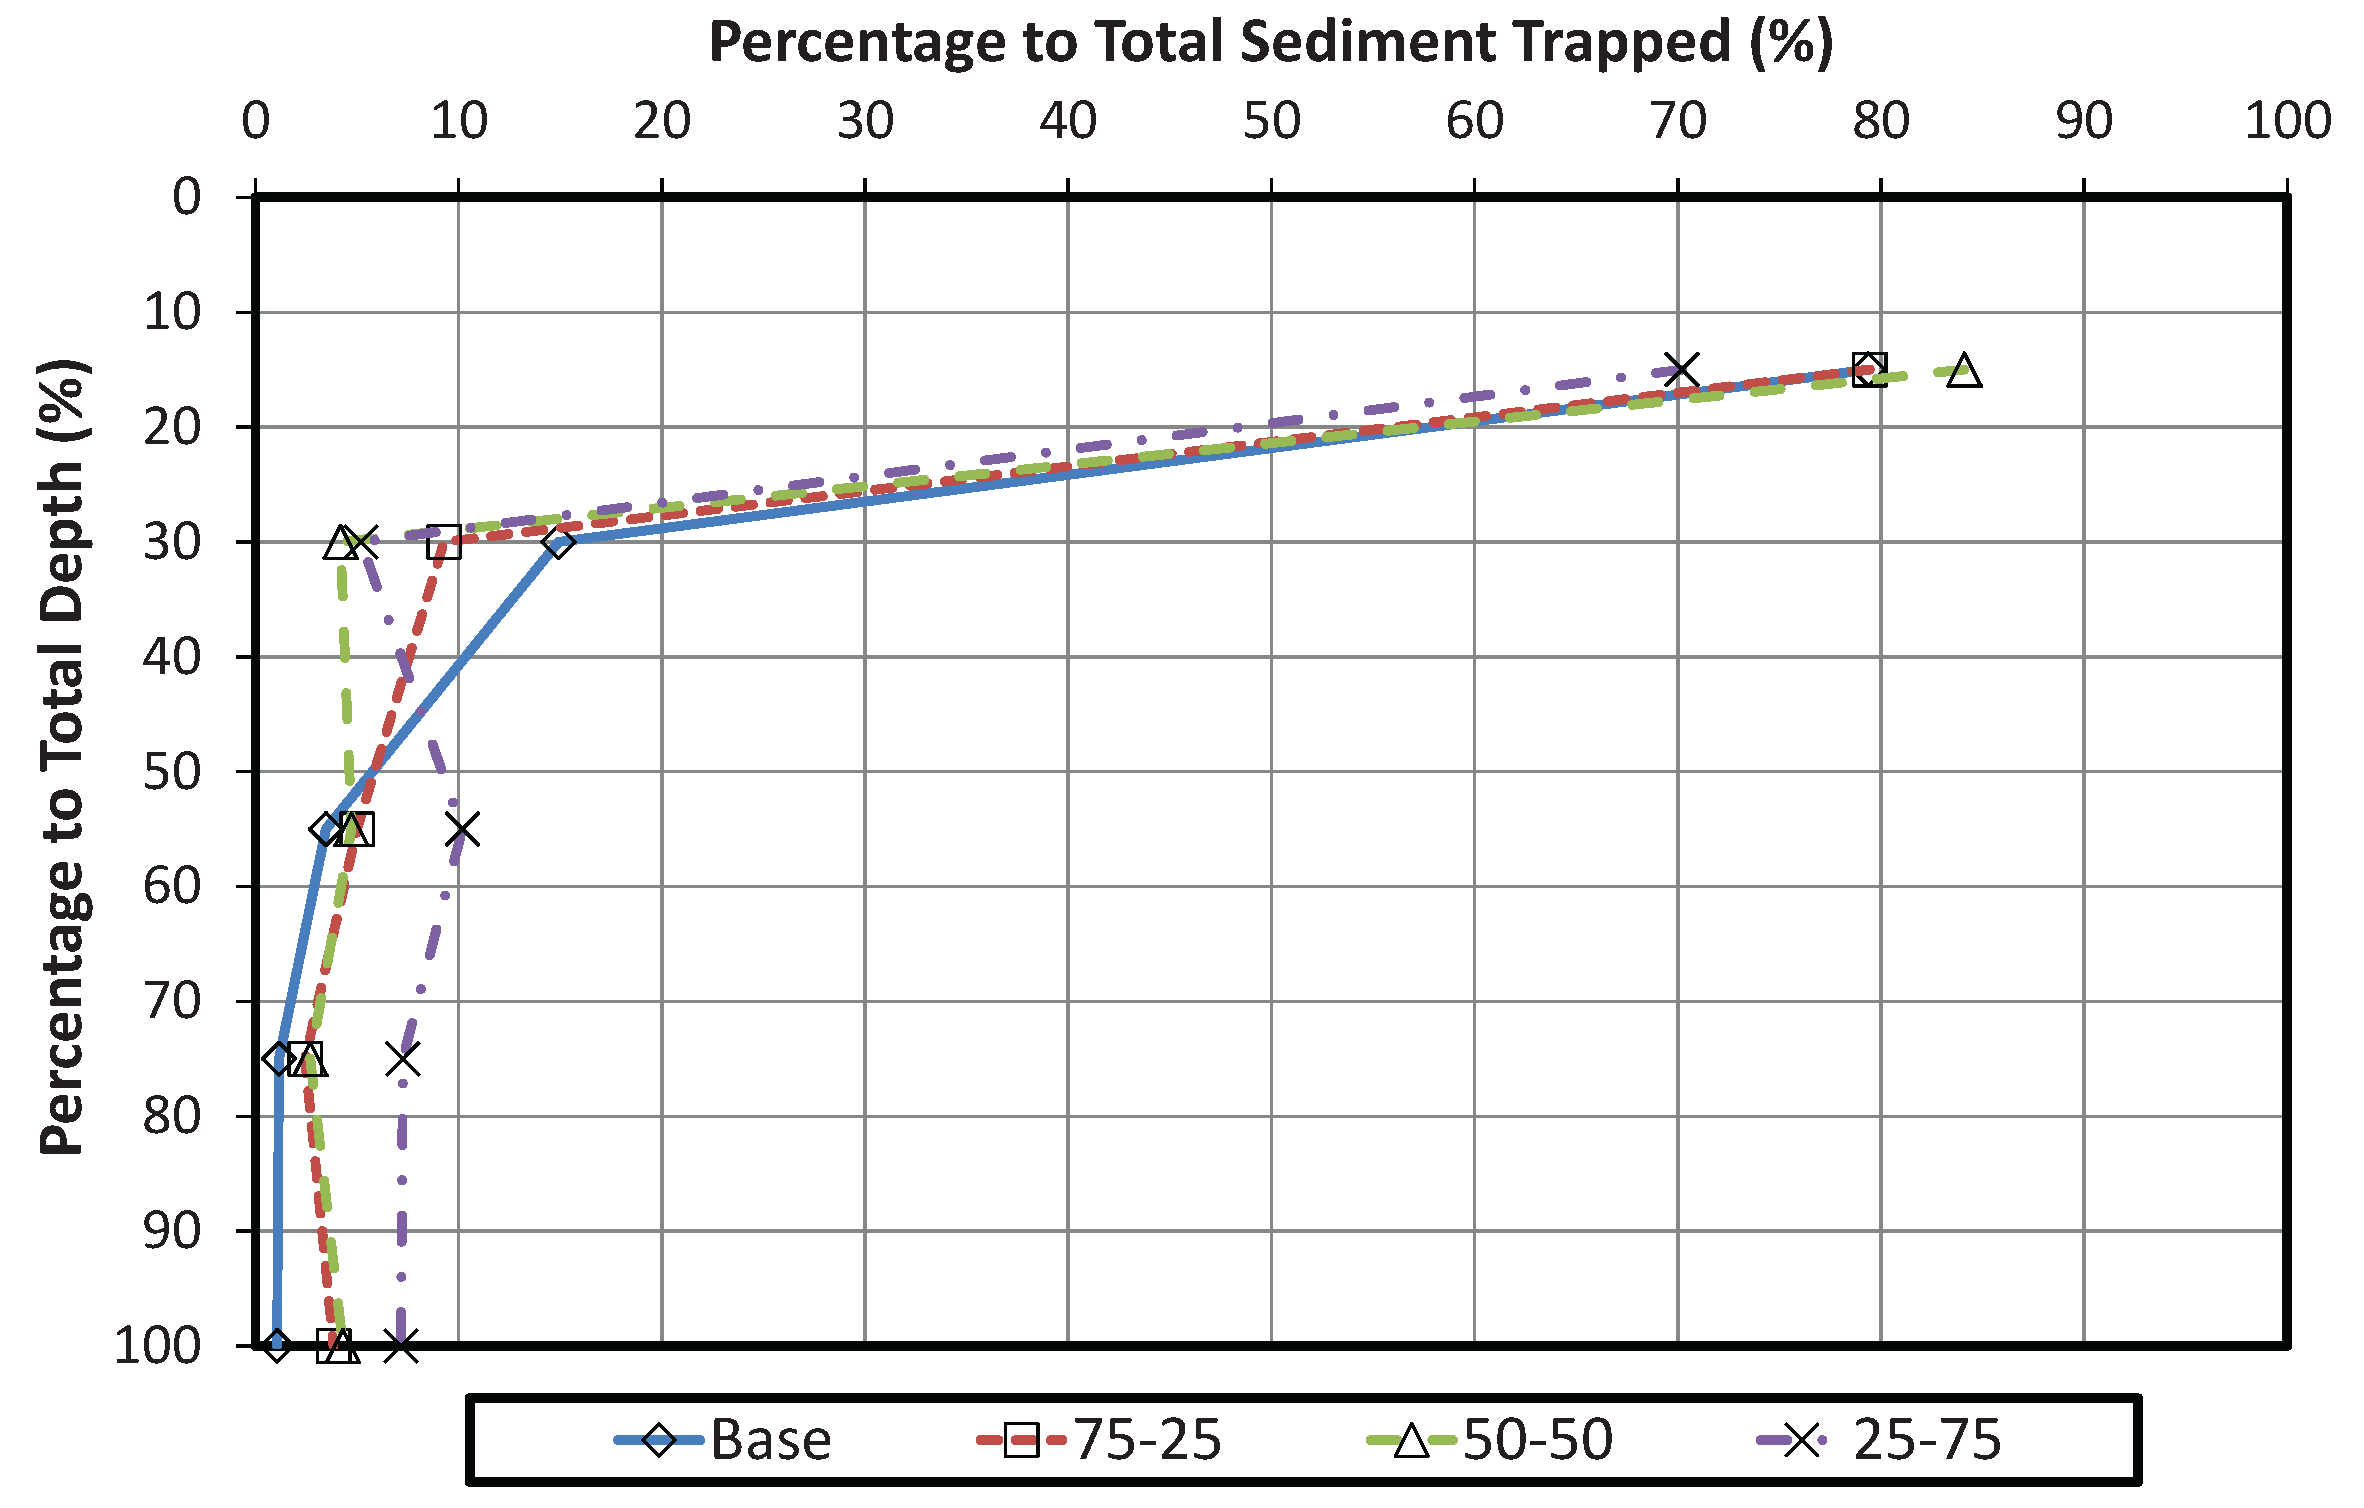
  • The accumulation of sediments created a “cake-like” layer that was found to form at the upper 15% of filter depth regardless of filter media mix. The said formed layer was found to be responsible for the overall reduction in hydraulic conductivity.
  • Hydraulic conductivity reduction and fluctuation of all cases were mainly directed to the formation of clogging layer, and the rearrangement and re-entrainment of filter media.
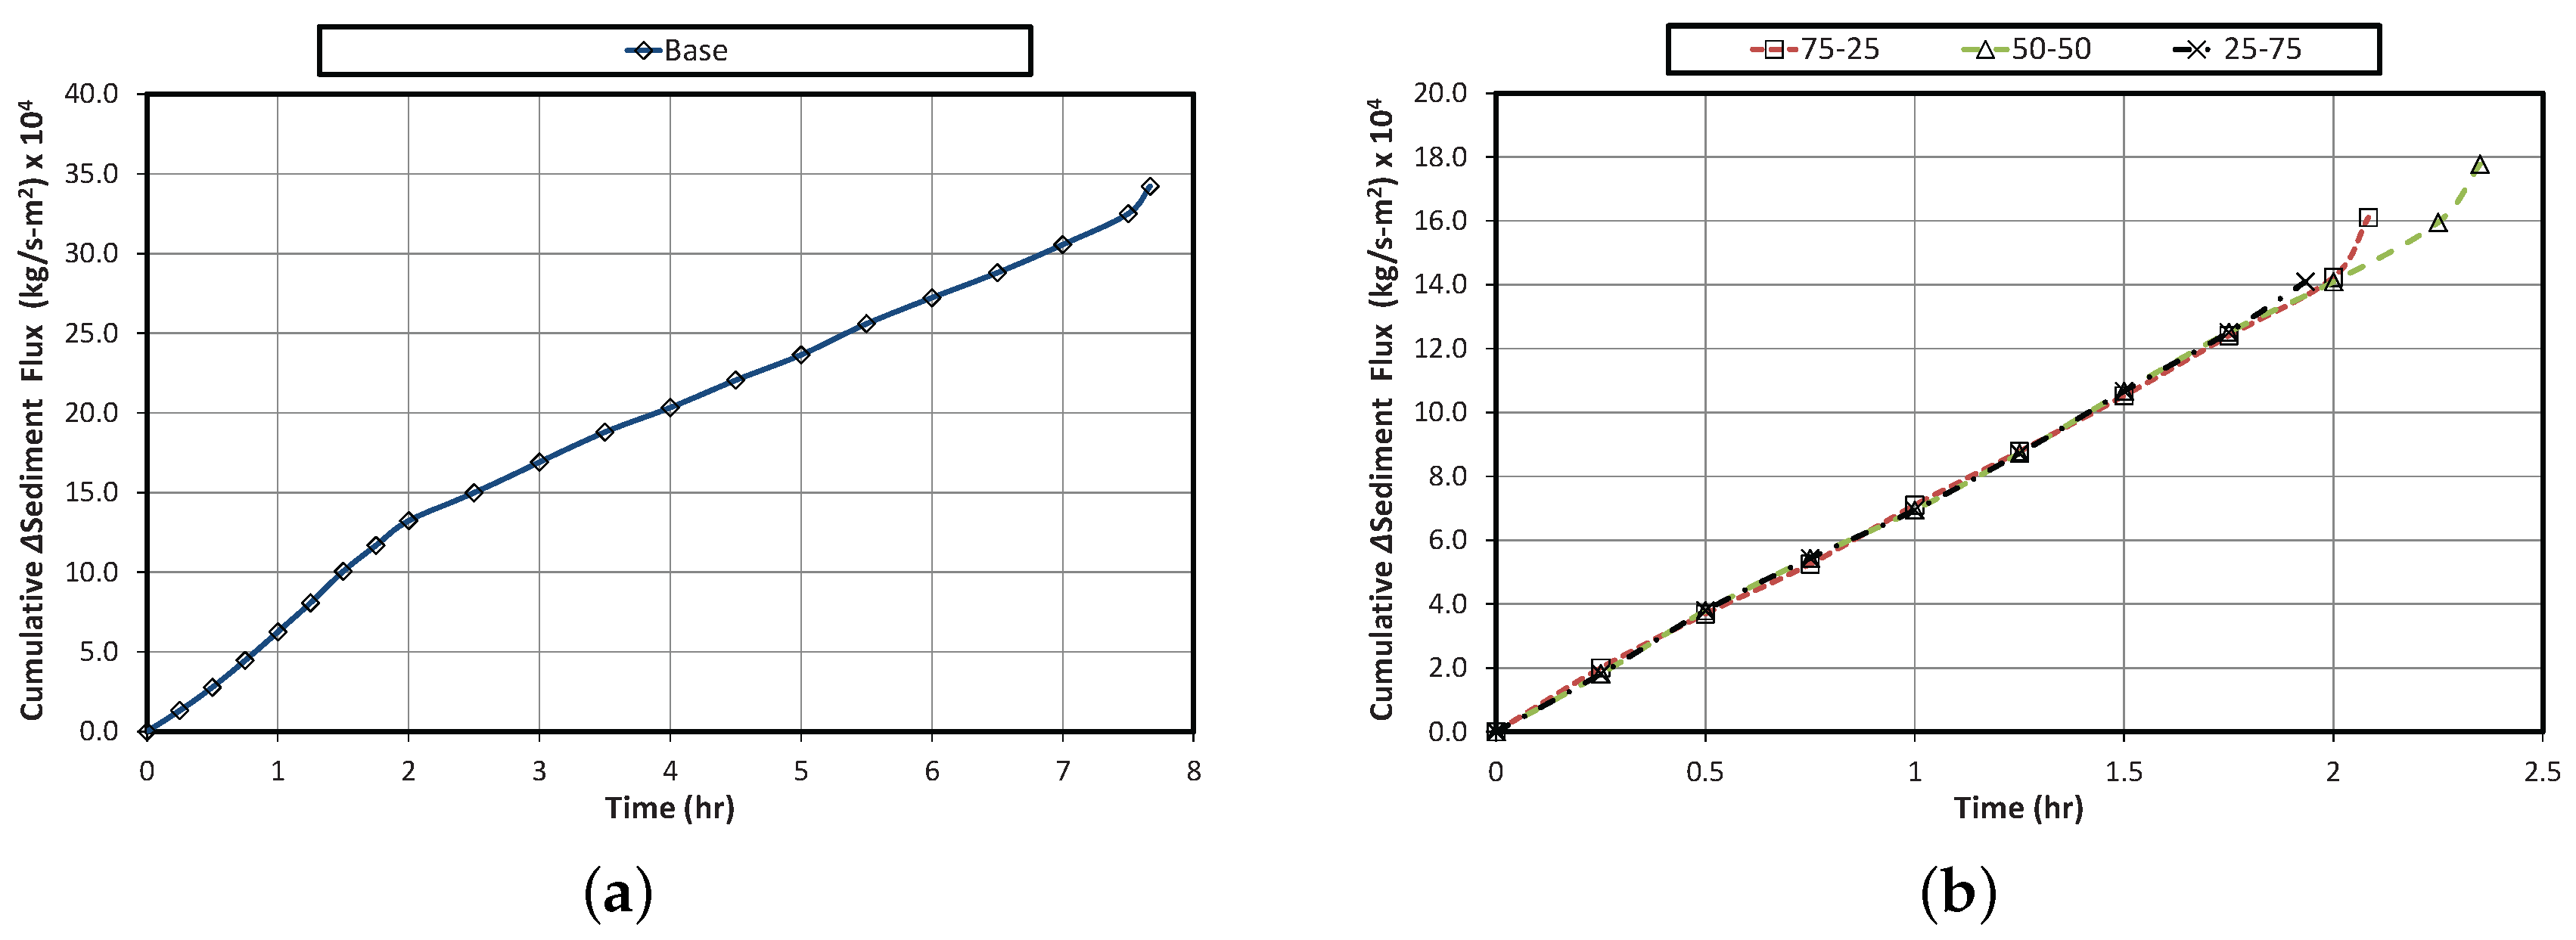
  • Seepage forces brought by constant head flow induced a noticeable amount of particle breakage on bottom ash filter media that resulted in an increase in amount of 100–250 μ m sediment present along its filter media depth. The increase in amount of accumulated sediments found at the deeper depth of the filter column was directly proportional to the amount of bottom ash presented as filter media; however the observed increase in accumulated sediments was less as compared with the obtained results from varying head flow clogging experiment.
  • Sediment removal efficiency in all particle sizes improved with reference to its performance during varying head flow test.
All experiment cases exhibited a high capacity on treating suspended solids, however, good treatment capacity could also indicate a shorter lifespan system. The selection of filter media to be used in any stormwater filter system is a matter of choice between longevity, and pollutant removal efficiency. Utilization of sand-bottom ash mix as filter media would perform better when applied in a system where flow is controlled at constant head level. A potential mode of maintenance of scrapping the upper 15% of the filter media, which is similar to previous study [21], is suggested regardless of flow condition and filter media being used. Obtained results from the clogging experiments give an insights on how sand and sand-bottom ash filter media configurations would behave at different flow conditions as clogging develops.

Acknowledgments

This work was supported by the research grant of the Kongju National University in 2015.

Author Contributions

Ezequiel Q. Segismundo conceived and conducted the experimental works under the supervision of Byung-Sik Lee. The data analysis and the manuscript were made by Ezequiel Q. Segismundo and Byung-Sik Lee. Lee-Hyung Kim and Sang-Man Jeong provided critical revision of the manuscript. All authors read and approved the submitted manuscript.

Conflicts of Interest

The authors declare no conflict of interest.

References

  1. Corbett, C.W.; Wahl, M.; Porter, D.E.; Edwards, D.; Moise, C. Nonpoint source runoff modeling. A comparison of a forested watershed and an urban watershed on the South Carolina coast. J. Exp. Mar. Biol. Ecol. 1997, 213, 133–149. [Google Scholar] [CrossRef]
  2. Paul, M.J.; Meyer, J.L. Streams in the urban landscape. Ann. Rev. Ecol. Syst. 2001, 32, 333–365. [Google Scholar] [CrossRef]
  3. US Environmental Protection Agency. National Water Quality Inventory: Report to Congress; Technical Report; US Environmental Protection Agency: Washington, DC, USA, 2002.
  4. Yong, C.; McCarthy, D.; Deletic, A. Predicting physical clogging of porous and permeable pavements. J. Hydrol. 2013, 481, 48–55. [Google Scholar] [CrossRef]
  5. Li, H.; Davis, A.P. Urban particle capture in bioretention media. II: Theory and model development. J. Environ. Eng. 2008, 134, 419–432. [Google Scholar] [CrossRef]
  6. Langergraber, G.; Haberl, R.; Laber, J.; Pressl, A. Evaluation of substrate clogging processes in vertical flow constructed wetlands. Water Sci. Technol. 2003, 48, 25–34. [Google Scholar] [PubMed]
  7. Bouwer, H. Artificial recharge of groundwater: Hydrogeology and engineering. Hydrogeol. J. 2002, 10, 121–142. [Google Scholar] [CrossRef]
  8. Dillon, P.; Hickinbotham, M.; Pavelic, P. Review of Internation Experience in Injecting Water into Aquifers for Storage and Reuse; Water Down Under 94: Groundwater Papers; reprints of Papers; Institution of Engineers: Barton, Australia, 1994; pp. 13–19. [Google Scholar]
  9. Hatt, B.E.; Fletcher, T.D.; Deletic, A. Treatment performance of gravel filter media: Implications for design and application of stormwater infiltration systems. Water Res. 2007, 41, 2513–2524. [Google Scholar] [CrossRef] [PubMed]
  10. Rinck-Pfeiffer, S.; Ragusa, S.; Sztajnbok, P.; Vandevelde, T. Interrelationships between biological, chemical, and physical processes as an analog to clogging in aquifer storage and recovery (ASR) wells. Water Res. 2000, 34, 2110–2118. [Google Scholar] [CrossRef]
  11. Knowles, P.; Dotro, G.; Nivala, J.; García, J. Clogging in subsurface-flow treatment wetlands: Occurrence and contributing factors. Ecol. Eng. 2011, 37, 99–112. [Google Scholar] [CrossRef]
  12. Page, D.; Miotlinski, K.; Dillon, P.; Taylor, R.; Wakelin, S.; Levett, K.; Barry, K.; Pavelic, P. Water quality requirements for sustaining aquifer storage and recovery operations in a low permeability fractured rock aquifer. J. Environ. Manag. 2011, 92, 2410–2418. [Google Scholar] [CrossRef] [PubMed]
  13. Page, D.; Vanderzalm, J.; Miotlinski, K.; Barry, K.; Dillon, P.; Lawrie, K.; Brodie, R.S. Determining treatment requirements for turbid river water to avoid clogging of aquifer storage and recovery wells in siliceous alluvium. Water Res. 2014, 66, 99–110. [Google Scholar] [CrossRef] [PubMed]
  14. Blazejewski, R.; Murat-Blazejewska, S. Soil clogging phenomena in constructed wetlands with subsurface flow. Water Sci. Technol. 1997, 35, 183–188. [Google Scholar] [CrossRef]
  15. Winter, K.J.; Goetz, D. The impact of sewage composition on the soil clogging phenomena of vertical flow constructued wetlands. Water Sci. Technol. 2003, 48, 9–14. [Google Scholar] [PubMed]
  16. Larmet, H.; Delolme, C.; Bedell, J. Bacteria and heavy metals concomitant transfer in an infiltration basin: Columns study under realistic hydrodynamical conditions. In Proceedings of the NOVATECH 2007: 6th International Conference on Sustainable Techniques and Strategies in Urban Water Management, Lyon, France, 25–28 June 2007; pp. 615–622.
  17. Le Coustumer, S.; Fletcher, T.D.; Deletic, A.; Barraud, S.; Poelsma, P. The influence of design parameters on clogging of stormwater biofilters: A large-scale column study. Water Res. 2012, 46, 6743–6752. [Google Scholar] [CrossRef] [PubMed]
  18. Kandra, H.S.; McCarthy, D.; Fletcher, T.D.; Deletic, A. Assessment of clogging phenomena in granular filter media used for stormwater treatment. J. Hydrol. 2014, 512, 518–527. [Google Scholar] [CrossRef]
  19. Treumann, S.; Torkzaban, S.; Bradford, S.A.; Visalakshan, R.M.; Page, D. An explanation for differences in the process of colloid adsorption in batch and column studies. J. Contam. Hydrol. 2014, 164, 219–229. [Google Scholar] [CrossRef] [PubMed]
  20. Kandra, H.S.; Deletic, A.; McCarthy, D. Assessment of Impact of Filter Design Variables on Clogging in Stormwater Filters. Water Resour. Manag. 2014, 28, 1873–1885. [Google Scholar] [CrossRef]
  21. Segismundo, E.Q.; Lee, B.S.; Kim, L.H.; Hong, K.B. Evaluation of the impact of filter media depth in filtration performance and clogging formation of a stormwater sand filter. J. Korean Soc. Water Environ. 2016, 32, 36–45. [Google Scholar] [CrossRef]
  22. Reddi, L.N.; Ming, X.; Hajra, M.G.; Lee, I.M. Permeability reduction of soil filters due to physical clogging. J. Geotech. Geoenviron. Eng. 2000, 126, 236–246. [Google Scholar] [CrossRef]
  23. Siriwardene, N.R.; Deletic, A.; Fletcher, T.D. Clogging of stormwater gravel infiltration systems and filters: Insights from a laboratory study. Water Res. 2007, 41, 1433–1440. [Google Scholar] [CrossRef] [PubMed]
  24. Kandra, H.S.; Callaghan, J.; Deletic, A.; Mccarthy, D.T. Biological clogging in storm water filters. J. Environ. Eng. 2014, 141. [Google Scholar] [CrossRef]
  25. Mercado, J.M.R.; Maniquiz-Redillas, M.C.; Kim, L.H. Laboratory study on the clogging potential of a hybrid best management practice. Desalin. Water Treat. 2015, 53, 3126–3133. [Google Scholar] [CrossRef]
  26. U.S. Environmental Protection Agency. Wastewater Technology Fact Sheet: Intermittent Sand Filters; Technical Report; U.S. Environmental Protection Agency: Washington, DC, USA, 1999.
  27. Clark, S.; Pitt, R. Stormwater Treatment at Critical Areas: Evaluation of Filtration Media; Technical Report; U.S. Environmental Protection Agency: Cincinnati, OH, USA, 1999.
  28. Gorme, J.B.; Maniquiz-Redillas, M.C.; Kim, L.H. Development of a stormwater treatment system using bottom ash as filter media. Desalin. Water Treat. 2015, 53, 3118–3125. [Google Scholar] [CrossRef]
  29. Shim, Y.S.; Kim, Y.K.; Kong, S.H.; Rhee, S.W.; Lee, W.K. The adsorption characteristics of heavy metals by various particle sizes of MSWI bottom ash. Waste Manag. 2003, 23, 851–857. [Google Scholar] [CrossRef]
  30. ASTM D2487-06—Standard Practice for Classification of Soils for Engineering Purposes (Unified Soil Classification System); ASTM International: West Conshohocken, PA, USA, 2006.
  31. ASTM D422-63—Standard Test Method for Particle-Size Analysis of Soils; ASTM International: West Conshohocken, PA, USA, 2007.
  32. ASTM D854-14—Standard Test Methods for Specific Gravity of Soil Solids by Water Pycnometer; ASTM International: West Conshohocken, PA, USA, 2014.
  33. Huisman, L.; Wood, W. Slow Sand Filtration; World Health Organization: Geneva, Switzerland, 1974; p. 122. [Google Scholar]
  34. Duncan, H.P. Urban Stormwater Quality: A Statistical Overview (Report 99/3); Technical Report; Cooperative Research Centre for Catchment Hydrology: Melbourne, Australia, 1999. [Google Scholar]
  35. Morganti, L. Sodium Hypochlorite Generation for Household Water Disinfection: A Case Study in Nepal. Master’s Thesis, MIT Department of Civil and Environmental Engineering, Boston, MA, USA, 2002. [Google Scholar]
  36. Maniquiz, M.C.; Lee, S.; Kim, L.H. Multiple linear regression models of urban runoff pollutant load and event mean concentration considering rainfall variables. J. Environ. Sci. 2010, 22, 946–952. [Google Scholar] [CrossRef]
  37. Greenberg, A.; Clesceri, L.; Eaton, A. Standard Methods for the Examination of Water and Wastewater, 18th ed.; American Public Health Association (APHA): Washington, DC, USA, 1992. [Google Scholar]
  38. Weber-Shirk, M.; Dick, R. Physical-chemical mechanisms in slow sand filters. J. Am. Water Works Assoc. 1997, 89, 87–100. [Google Scholar]
  39. Wang, Z.; Du, X.; Yang, Y.; Ye, X. Surface clogging process modeling of suspended solids during urban stormwater aquifer recharge. J. Environ. Sci. (China) 2012, 24, 1418–1424. [Google Scholar] [CrossRef]
  40. Hua, G.F.; Zhu, W.; Zhao, L.F.; Huang, J.Y. Clogging pattern in vertical-flow constructed wetlands: Insight from a laboratory study. J. Hazard. Mater. 2010, 180, 668–674. [Google Scholar] [CrossRef] [PubMed]
  41. Roger, S.; Montrejaud-Vignoles, M.; Andral, M.C.; Herremans, L.; Fortune, J.P. Mineral, physical and chemical analysis of the solid matter carried by motorway runoff water. Water Res. 1998, 32, 1119–1125. [Google Scholar] [CrossRef]
  42. Vaze, J.; Chiew, F.H.S. Nutrient loads associated with different sediment sizes in urban stormwater and surface pollutants. J. Environ. Eng. 2004, 130, 391–396. [Google Scholar] [CrossRef]
  43. Bian, B.; Zhu, W. Particle size distribution and pollutants in road-deposited sediments in different areas of Zhenjiang, China. Environ. Geochem. Health 2009, 31, 511–520. [Google Scholar] [CrossRef] [PubMed]
Figure 1. Column infiltration testing apparatus: (a) Column dimensions; (b) Picture of actual setting.
Water 09 00032 g001
Figure 2. Schematic diagram of column infiltration testing set-up.
Water 09 00032 g002
Figure 3. The filter column setup: (a) Detailed measurement in height; (b) Layering used for monitoring hydraulic conductivity and measuring entrapped suspended solids.
Water 09 00032 g003
Figure 4. Normalized outlet water flow reduction with time for all filter column cases.
Water 09 00032 g004
Figure 5. Cumulative Δ W a t e r F l u x for all filter column cases.
Water 09 00032 g005
Figure 6. Variation of the cumulative Δ S e d i m e n t F l u x with respect time: (a) Base case; (b) Sand-bottom ash cases.
Water 09 00032 g006
Figure 7. Percentage of total sediment trapped along the filter column depth of the base and the sand-bottom ash cases under the varying head flow condition.
Water 09 00032 g007
Figure 8. Fraction of trapped sediment per particle size along the depth of filter column under the varying head flow condition: (a) Base case; (b) 75-25 case; (c) 50-50 case; (d) 25-75 case.
Water 09 00032 g008
Figure 9. Particle removal efficiency of the base case and the sand-bottom ash cases for each distinct sediment particle sizes under the varying head flow condition.
Water 09 00032 g009
Figure 10. Increase in water elevation at the ponding section of column with respect to the percentage of the total clogging time.
Water 09 00032 g010
Figure 11. Normalized outlet water flow reduction with respect to height of water pass for all filter column cases under the constant head flow condition.
Water 09 00032 g011
Figure 12. Relative hydraulic conductivity of different layers with respect to the height of water passed: (a) Base case; (b) 75-25 case; (c) 50-50 case; (d) 25-75 case.
Water 09 00032 g012
Figure 13. Percentage of total sediment trapped along the filter column depth of base case and sand-bottom ash mix under the constant head flow condition.
Water 09 00032 g013
Figure 14. Fraction of trapped sediments per particle size along the depth of filter column under constant head flow condition: (a) Base case; (b) 75-25 case; (c) 50-50 case; (d) 25-75 case.
Water 09 00032 g014
Figure 15. Particle removal efficiency of the base case and the sand-bottom ash cases for each distinct sediment particle sizes under constant head flow condition.
Water 09 00032 g015
Table 1. Classification of filter columns and physical properties of filter media.
Filter MediaClassification of Filter ColumnMix Ratio (Sand:Bottom Ash)Particle Size Range (mm)G s 1 C u 2 C c 3 Porosity
Sand aBase-2.00–4.752.641.600.960.509
Bottom Ash b--0.85–2.002.141.290.97-
Sand-25:75 Mix25:750.85–4.75-1.581.120.676
Bottom Ash50:50 Mix50:500.85–4.75-1.371.050.632
Mix75:25 Mix75:250.85–4.75-1.390.890.577
Notes: a Sphericity, S = 0.9, Roundness, R = 0.3, Particle Regularity, p = 0.6, Classification = Spherical-Angular, USCS = SP; b Sphericity, S = 0.3, Roundness, R = 0.1, Particle Regularity, p = 0.2, Classification = Flat-Angular, USCS = SP. 1 Specific Gravity; 2 Uniformity Coefficient; 3 Coefficient of Curvature.

