A Hybrid Water Distribution Networks Design Optimization Method Based on a Search Space Reduction Approach and a Genetic Algorithm


1
Department of Engineering, Universidad de Almería, Ctra. Sacramento S.N., La Cañada de S. Urbano, 04120 Almería, Spain
2
Department of Applied Physics, Universidad de Córdoba, Campus Universitario de Rabanales, 14071 Córdoba, Spain
*
Author to whom correspondence should be addressed.
Water 2017, 9(11), 845; https://doi.org/10.3390/w9110845
Submission received: 30 September 2017
/
Revised: 27 October 2017
/
Accepted: 29 October 2017
/
Published: 2 November 2017
(This article belongs to the Special Issue Advanced Hydroinformatic Techniques for the Simulation and Analysis of Water Supply and Distribution Systems)
Abstract
:This work presents a new approach to increase the efficiency of the heuristics methods applied to the optimal design of water distribution systems. The approach is based on reducing the search space by bounding the diameters that can be used for every network pipe. To reduce the search space, two opposite extreme flow distribution scenarios are analyzed and velocity restrictions to the pipe flow are then applied. The first scenario produces the most uniform flow distribution in the network. The opposite scenario is represented by the network with the maximum flow accumulation. Both extreme flow distributions are calculated by solving a quadratic programming problem, which is a very robust and efficient procedure. This approach has been coupled to a Genetic Algorithm (GA). The GA has an integer coding scheme and variable number of alleles depending on the number of diameters comprised within the velocity restrictions. The methodology has been applied to several benchmark networks and its performance has been compared to a classic GA formulation with a non-bounded search space. It considerably reduced the search space and provided a much faster and more accurate convergence than the GA formulation. This approach can also be coupled to other metaheuristics.
1. Introduction
The optimal design of looped water distribution networks (WDN) can be regarded as a type of complex combinatorial problem known as NP-hard (Non-deterministic Polynomial-time hard), as it is a nonlinear, constrained, non-smooth, non-convex, and, hence, multi-modal problem [1,2]. Although mathematical programming methods such as linear and nonlinear programming techniques [3,4] have been applied to solve this problem, metaheuristics methods have been preferred due to their ability to cope with global optimization problems. Genetic Algorithms (GA) and other Evolutionary Algorithms [2], Simulated Annealing (SA) [5], Shuffle Frog Leaping Algorithm [6], Iterated Local Search [7] and Particle Swarm Optimization [8] are among the most extended metaheuristic approaches applied to water distribution networks design. Genetic algorithms have been extensively applied to solve the problem of designing the optimal water distribution network ([2,9]). GAs are based on the rules of evolution and natural selection. Multi-objective heuristic approaches have also been formulated not only to minimize the network cost but to take into consideration other conflicting objectives as well, such as the reliability of the system [10,11,12,13,14].
Although heuristics approaches can handle global optimization problems, they do not guarantee to find the optimal solution [15]. In addition to the lack of accuracy of the solution provided, another shortcoming of these procedures is the time they take to converge. In recent years, a great deal of research work has been carried out to improve their performance; however, in spite of these efforts, heuristics methods are still relatively inefficient and time-consuming when dealing with very large water distribution networks. This inefficiency is due to the wide search space that these algorithms must explore. Since the search space is very large, general purpose heuristic algorithms waste a considerably long time evaluating unfeasible solutions. Consequently, the probability of finding the optimal solution decreases and the convergence speed increases as the size of the search space increases. Strategies for reducing the search space are thus greatly needed.
The aim of this paper is to present a new approach to increase the efficiency of the heuristics methods applied to the optimal design of water distribution networks. The proposed approach is based on bounding the search space by analyzing two opposite extreme flow distribution scenarios and then applying velocity restrictions to the flow in the network’s links. The proposed methodology has been applied to minimize the cost of a well-known benchmark network. The performance of the approach presented in this paper has been compared to a classic GA formulation with a non-bounded search space.
2. Materials and Methods
2.1. Bounding Strategy
Flow distribution can be calculated in branched networks by applying flow conservation equations in the nodes of the network. From a practical standpoint, a common procedure for this type of network is to impose velocity restrictions on the flow in the pipes. Velocity limits of piping systems can vary depending on the material and diameter and other considerations. High velocities may cause pipe erosion, loud noise, and excessive head losses. Low velocities, on the contrary, may produce sedimentation and oversizing of the system. When velocity restrictions are applied, the range of possible diameters that can be selected for a specific pipe is considerably reduced, thus simplifying the complexity of the network design. However, unlike the case of branched networks, the flow distribution in looped networks is not known a priori, and, as a consequence, this procedure cannot be used.
The methodology proposed in this work is based on reducing the search space by bounding the range of possible diameters that can be selected for a specific network link. The procedure consists of generating two opposite extreme flow distribution scenarios that satisfy the nodal flow conservation equations and nodal demands. The first scenario produces the most uniform flow distribution in the network while satisfying nodal demands and flow conservation constraints. The resulting design would provide a network with high entropy and resilience. The opposite scenario features the highest flow accumulation within certain main pipes. This scenario provides a flow distribution fairly similar to the one obtained for a spanning tree of the network.
The methodology proposed in this work to calculate both extreme flow distributions is to solve a quadratic programming problem (QPP) for each of them. A quadratic programming problem involves minimizing or maximizing a quadratic function subject to linear constraints. Quadratic programming is a particular type of nonlinear programming. Although general nonlinear algorithms can be applied to solve this type of problem, there are others that are more robust, specific and efficient [16].
The objective function of the proposed QPP for the most uniform flow distribution is to minimize the sum of the square link flows of the network. These link flows have to satisfy the flow conservation equations in the nodes of the network. This set of restrictions is linear. The problem is formulated in Equation (1):
where: n is the number of links in the network, Qi is the flow of the link i, A is an (m × n) array, and m is the number of nodes, and q is a vector of nodal demands.
The entry aij of array A is 1 if the flow of link j goes into node i, −1 if it leaves the node, and 0 if link j is not connected to node i.
One drawback of this procedure is that the direction of the flows has to be previously defined in order to perform the calculation. For complex networks, the number of possible flow direction combinations can be very high and finding the right one is a cumbersome procedure. To overcome this limitation, we have duplicated the number of links by adding a fictitious pipe for each link of the network in such a way that two pipes with opposed flows are considered for each link of the network. Using this procedure, the number of variables is 2n and array A is a (m × 2n) array. The solution of the minimization QPP problem provides the right flow directions and values that minimize the sum of network flows. The so called Maximum Dispersion (MD) flow distribution is obtained in this way.
The second scenario, with a maximum flow accumulation, also termed a Maximum Concentration scenario (MC), is obtained by maximizing the objective function and solving the equivalent QPP maximization problem.
The solution of these two problems provides two vectors flows (QMC and QMD), which bounds the range of possible flows within each network link. By imposing velocity restrictions, a pair of vectors defining the range of possible diameters between the minimum (Dm,i) and the maximum (DM,i) for each link i can be calculated in the following way:
2.2. Bounded Genetic Algorithm Formulation
The bounding approach developed herein can be coupled to different types of metaheuristics methods. In this work, a GA has been used to test the performance of the proposed methodology. GAs are stochastic search procedures based on the evolutionary mechanisms of natural selection and genetics [17]. GAs mimic the highly effective optimization model that has naturally evolved for dealing with large, highly complex systems.
The GA is based on the GENOME model developed by Reca and Martínez [2]. However, some modifications in the code described below have been made to implement the proposed strategy. A new software program called B-GENOME (B-GA) has been developed to implement this new approach. The program has been developed using the VBA (Visual Basic for Applications) programming language in the Excel© (Microsoft, Redmond, Washington, DC, USA) spreadsheet environment.
GENOME used an integer-coding scheme. Each solution (individual) was coded by a vector of n discrete variables (diameter sizes assigned to each link of the network). The variable was coded by an integer value ranging from one (first possible diameter for that particular link) to nd,i (last possible diameter). This methodology has many advantages since there are no limitations on the number of possible diameter sizes that can be assigned to a specific pipe. In the classic formulation of GENOME, the number of possible diameter sizes was equal for each link and this value was equal to the total number of diameters in the pipe database. The same coding scheme has been adopted in B-GENOME, although some modifications have been made to allow for a variable number of possible diameters for each link. The new B-GENOME algorithm used in this work has an integer coding scheme and a variable number of alleles. The number of alleles depends on the number of possible diameters comprised within the velocity restrictions of each link.
In order to test and compare the new approach to the classic GA formulation, the initial population has been obtained randomly. This initial population evolves from one generation to another by undergoing an iterative reproductive cycle. This cycle comprises three subsequent operators: selection, crossover and mutation. For the selection operator to be applied the fitness of each individual is evaluated as the sum of the cost of the pipes making up the network plus a penalty function applied to take into account nodal pressure deficits (see Equation (3)):
where: ci is the pipe cost (€ m−1), which is a function of the diameter Di, Li is the length of the link i, p is a penalty multiplier, N is the number of nodes in the network, hrj is the required pressure head in the node j and hj is the actual pressure head computed by the hydraulic solver EPANET for the node j.
The value of the penalty multiplier may affect the accuracy of the solution, so it should be properly calibrated. To cope with this problem, some researchers recommend different constraint-handling techniques, such as the use of variable values or self-adaptive penalty functions [18]. However, in this work, for the sake of simplicity, and in order to compare both approaches under the same conditions, a constant penalty multiplier has been applied. A high value has been assigned to this penalty multiplier (109 €/m) to avoid finding solutions that violate the pressure restrictions. In order to compute the pressure deficits, the nodal pressures for each individual in the population have been computed by using a network solver. The hydraulic solver EPANET has been used for this purpose [19]. The EPANET engine is used when needed by calling on the EPANET toolkit from the VBA software code developed in this work. B-GENOME implements all the different options to perform the three basic operations that were available in GENOME [2].
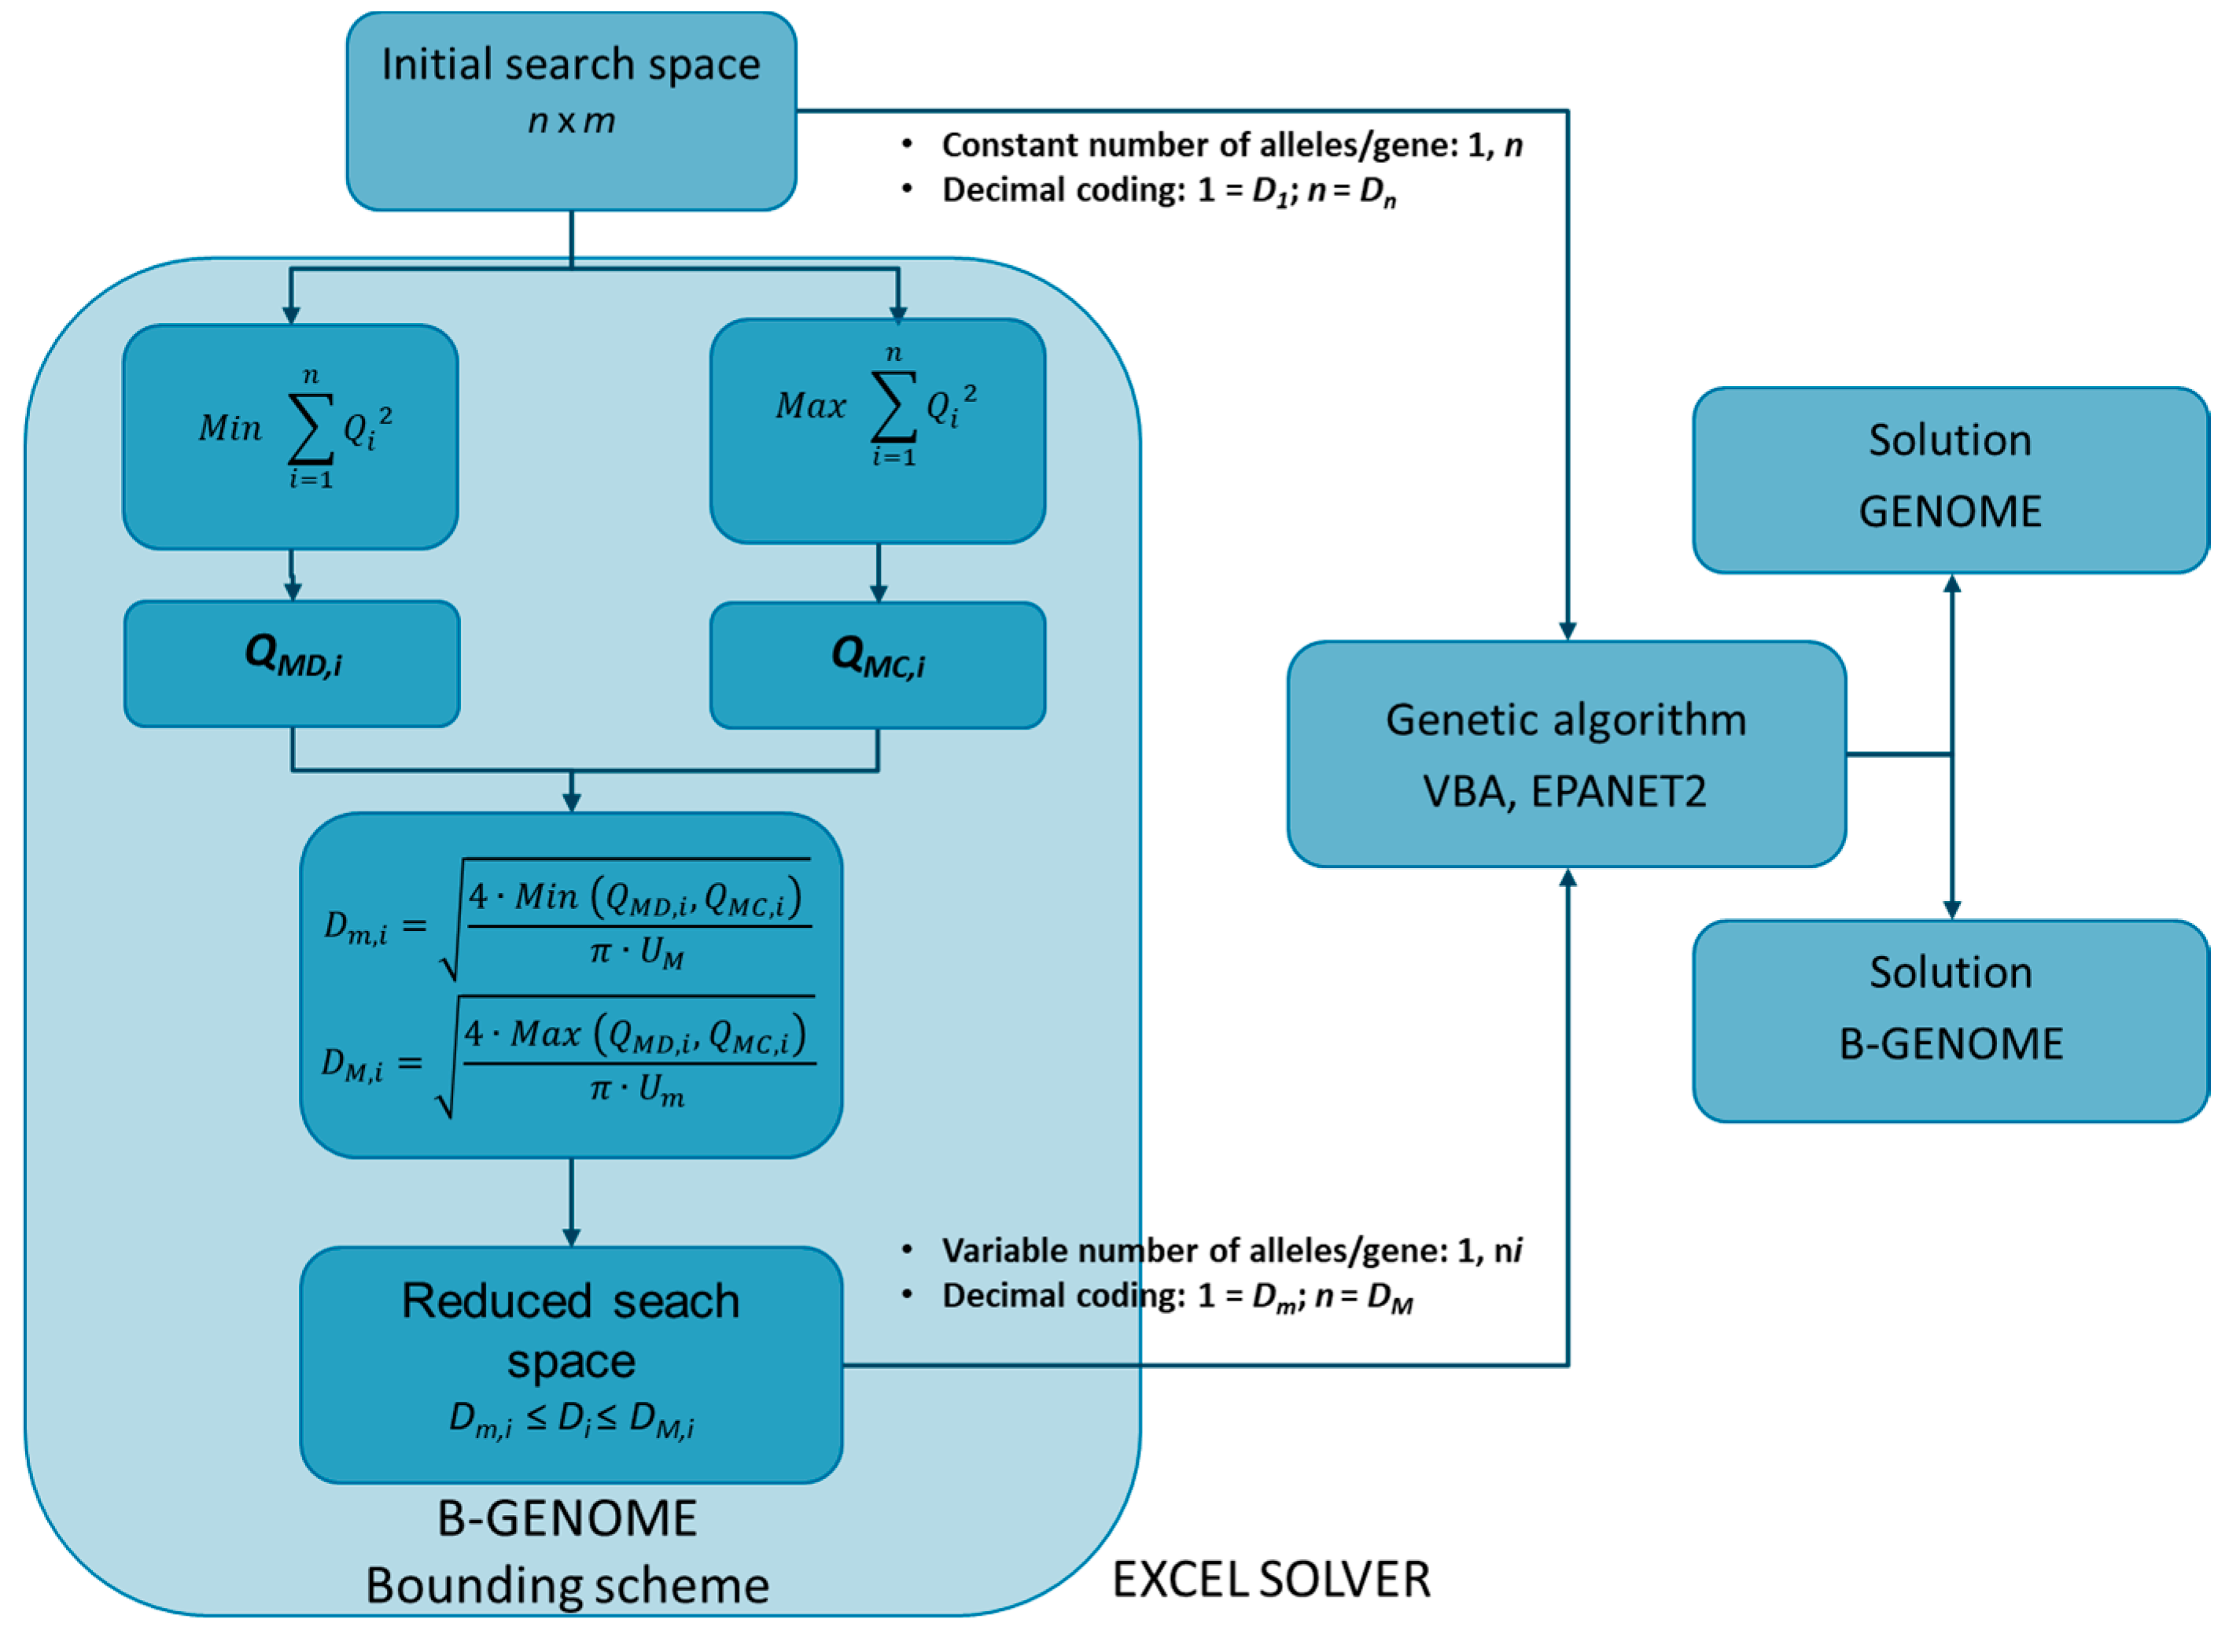
2.3. Structure of B-GENOME
In addition to the GA module, B-GENOME implements a module to solve the QPPs. This module makes use of the EXCEL optimization add-on SOLVER (frontline systems). Both data input and results output modules complete the structure of the B-GENOME software model. The input module reads both the network information and the available pipe diameters database. The network information is imported from an EPANET input file (*.inp file). The pipe database is stored in a table within an Excel sheet. The output module writes the final solution found by the model (optimal vector of pipe diameters and cost of the network) and the best fitness function value for every generation in a spreadsheet.
The flowchart of the B-GENOME model is depicted in Figure 1.
2.4. Testing of the B-GENOME Model
The proposed methodology has been applied to 2 well-known benchmark networks in order to compare the performance of the classic GA formulation with the new bounded GA. The selected networks are the Alperovits and Shamir [3] network (A&S, also known as a two-loop network) and the Hanoi water distribution network. Both have been extensively used to test different water distribution design optimization algorithms, but they feature different size characteristics. While the first is a small network with seven nodes and eight pipes arranged in two loops, the latter can be considered as medium-sized, with 32 nodes and 34 pipes and 3 loops.
The A&S network layout is shown in Figure 2. The system is fed by gravity from a reservoir of 210 m fixed head. The pipes are all 1000 m long. The minimum pressure limitation is 30 m above ground level for each node. There are 14 commercial diameters to be selected. The nodal head and demands, the cost per meter for each pipe size and other data are reported by Alperovits and Shamir and other works [3].
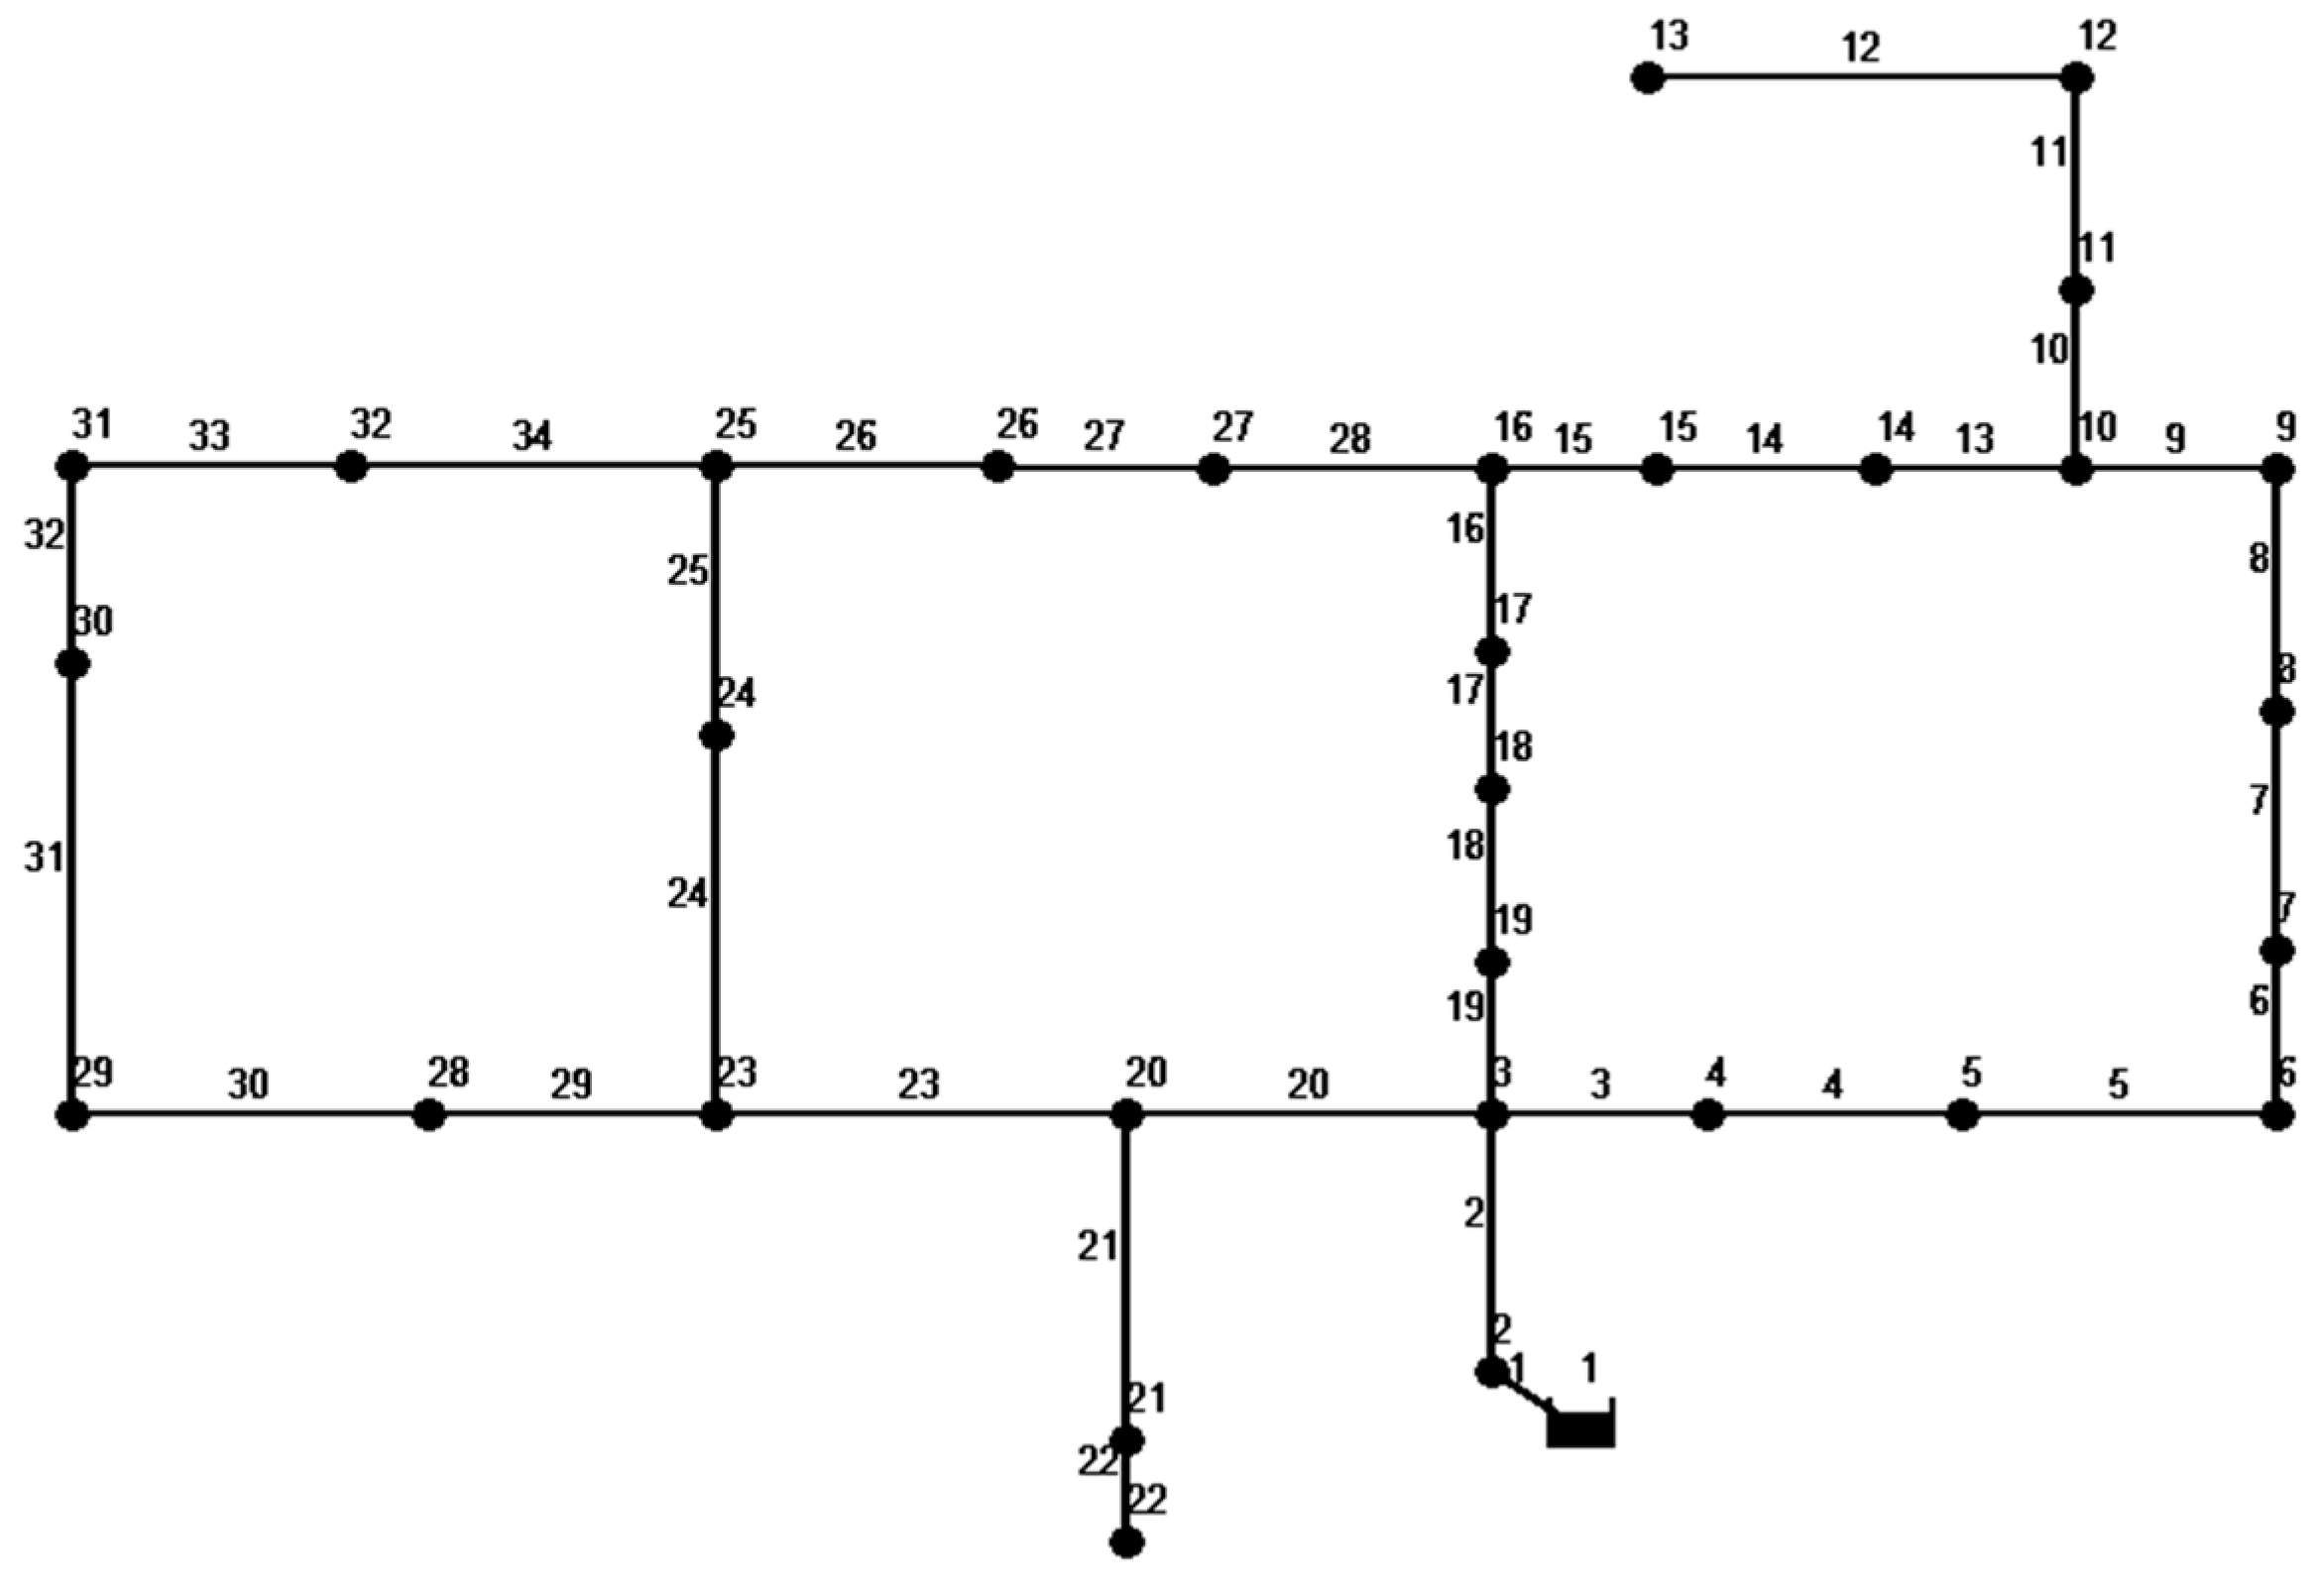
The Hanoi water distribution network (see Figure 3) features 32 nodes and 34 pipes organized in 3 loops. No pumping facilities are considered since only a single fixed head source at elevation of 100 m is available. The minimum head requirement at all nodes is fixed at 30 m. In this case, there is a set of 6 commercially available diameters. The cost function is nonlinear. The pipe head losses were calculated using the Hazen–Williams equation with a Hazen–Williams roughness coefficient, C = 130.
To evaluate the effect of the search space reduction on the convergence speed and accuracy of the solution, both algorithms (GENOME and B-GENOME) have been applied to solve the WDN design problem of both the two-loop and Hanoi networks. To be consistent and enable comparison, the same input data and parameters and analysis options have been chosen.
The pipe head losses were calculated using the Hazen–Williams equation with a Hazen–Williams roughness coefficient, C = 130. The values of the other parameters of the Hazen–Williams equation were set to the defaults of the EPANET 2.0 network analysis software (USEPA, Cincinnati, OH, USA). The population size was limited to 100 individuals in the case of A&S and 200 for Hanoi. The number of generations was 200 and 300, respectively. The remaining input parameters and options for the GA algorithm are summarized in Table 1.
The steady-state-delete-worst plan inserts individuals as they are bred whenever its fitness exceeds that of the least fit member of the parent population. The least fit member of the parent population is removed and replaced by the offspring. The crossover operator implies that a pair of parent chromosomes exchanges information in order to produce a pair of offspring chromosomes that inherit their characteristics. The probability of crossing two chromosomes is defined by the input parameter pcross. In the uniform crossover, the parents’ chromosomes exchange their genetic information gene to gene. The probability of exchanging genes is defined by the gene crossing rate (rcross). Ten simulations were performed both for the new bounded algorithm and the classic GA algorithm.
3. Results
The first step in the calculation procedure is to solve the QPPs stated in Equation (1). The results of these problems provide both vectors of flows for each link of the network. Both flow values represent the limits to the flow in each link of the network and thus reduce the search space. The results provided are given for both the A&S (Table 2) and the Hanoi networks (Table 3). Table 2 (A&S) and Table 3 (Hanoi) show the flow range, the minimum and maximum diameters, and the number of possible diameters compatible with the velocity restrictions provided by the QPP problems.
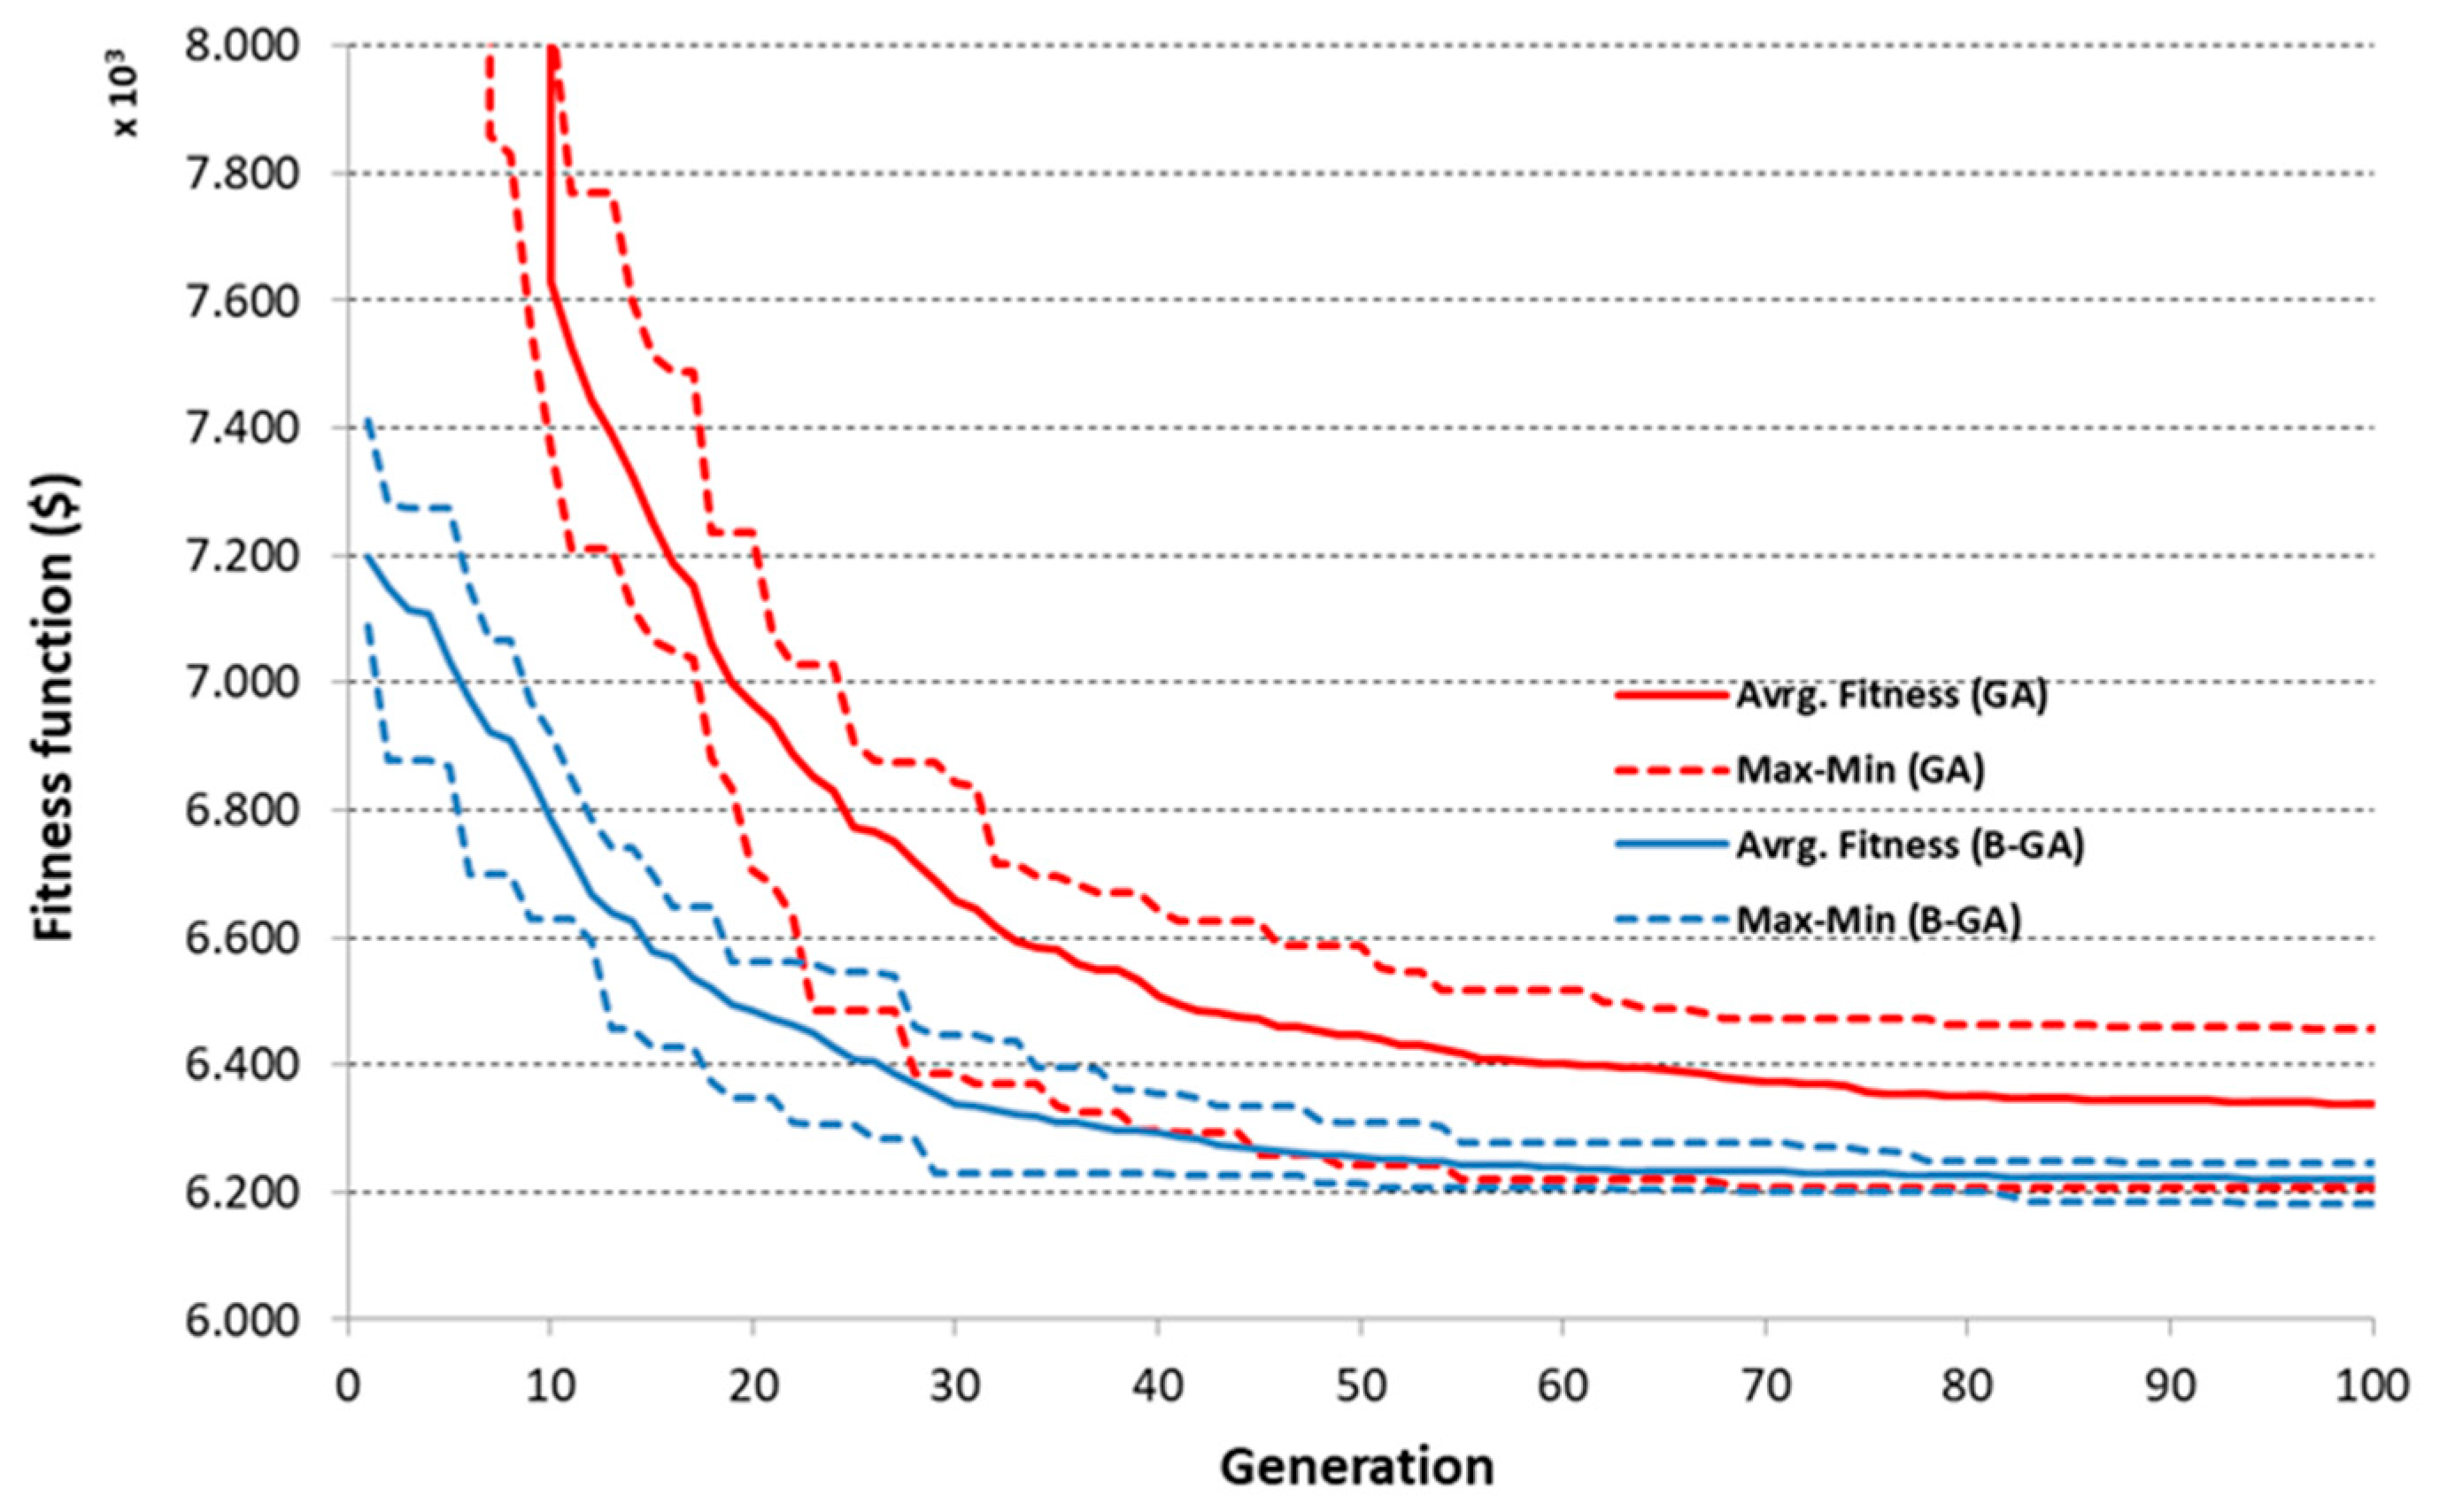
With the aim of evaluating the accuracy of the solution and the convergence speed of the new bounded algorithm and the classic GA algorithm, ten runs were performed for each algorithm with the same input parameters, data, and analysis options. Results of these simulations are shown in Figure 4 for the A&S network and in Figure 5 for the Hanoi network.
4. Discussion
A significant reduction of the search space was achieved with the proposed methodology. Regarding the Alperovits and Shamir network, as its pipe database is composed of 14 different diameter values and the network has eight links, the total search space in the unbounded problem is equal to 148 = 1.48 × 10⁹ possible network designs. The search space for the bounded problem is reduced to 4.61 × 10⁷, which means that the search space becomes approximately 3% of the total search space of the problem (see Table 2). In the case of the Hanoi network, the reduction is even higher. There are six possible diameters in the database and the number of links is equal to 34. The resulting number of alternative designs is 2.87 × 1026, whereas the size of the search space in the bounded problem is 4.35 × 10¹⁶ (see Table 3). The reduction of the search space is expected to be higher for a larger number of links and the number of pipe diameters in a given problem. The velocity limits also play an important role as the search space reduction increases as the velocity limits range becomes narrower.
Another advantage of the search space reduction approach presented herein is that it is able to detect branched links in the network by comparing the flow value for these links in both flow distributions and checking if it is the same. For instance, this is the case of link 1 in the A&S network (Table 2) and links 1, 2, 10, 11, 12, 21 and 22 in the Hanoi network (Table 3). Since the flow is established in these branched links, the range of possible diameters compatible with the flow velocity restrictions is considerably reduced and so the complexity of the problem. In addition, a special treatment applying other optimization methods best suited for branched networks can be performed in these branched sub-networks.
Regarding the speed of convergence, both algorithms performed well, although the new proposed algorithm B-GA outperformed the GA for both networks. It is worth highlighting that convergence was reached rather quickly in both cases. There were no substantial differences in the convergence speed for the A&S network (both algorithms converged approximately after the 20th generation). Convergence was found later for the Hanoi network due to the larger size of the problem, and, in this case, B-GA clearly converged faster than GA (130th for the B-GA and 293th in the case of GA). In the A&S network, only 2000 function evaluations were needed to converge (100 individuals and 20 generations). In the case of the Hanoi network, 26,000 evaluations were needed in the B-GA algorithm and 58,600 in the GA algorithm. This entails a very small fraction of the total search space (see Figure 4 and Figure 5).
The proposed B-GA algorithm not only considerably reduced the search space, but also provided a much faster and more accurate convergence than the classic GA formulation In the case of the A&S network, the best solution found by the B-GA algorithm was 419,000, which is the global optimum as reported in previous works. This minimum cost was obtained in three out of the 10 runs performed. A quasi-optimal solution (420,000) was found in another five out of 10 iterations. The average cost in the 10 simulations was close to the optimum (424,000). The GA performed slightly worse; this algorithm did not reach the minimum cost in any simulation, although the solution found came very close (420,000). The average cost was also higher (430,900) than the one obtained by B-GA (see Table 4 and Table 5).
Both algorithms found solutions relatively close to the global optimum. For the Hanoi network, the best solution found by the B-GA algorithm was 6,182,006. The average cost in the 10 simulations was close to the optimum (6,219,390). Again, the GA clearly performed worse. The minimum solution found was 6,208,937 (0.44% higher). The average cost was also higher (6,296,366) than the one obtained by B-GA (1.24%). The solution found by the proposed B-GA is comparable to the optimal solution found in the literature. The lowest cost solution reported is 6,056,000 [5,20]. However, these results were not obtained using the EPANET 2.0 network solver and the coefficients of the Hazen–Williams head loss equation were slightly different. The best solution found when using the EPANET 2.0 network solver was that reported by Lansey and Eusuff [6] (6,073,000) using the Shuffled Frog Leaping Algorithm (SFLA). This solution is slightly better than the one found in this work with B-GA. Nevertheless, it should be noted that, in our study, the number of evaluations was low because the aim was not to achieve the minimum cost but to test and compare the algorithm with a classic GA algorithm under the same conditions.
As a consequence, the proposed B-GA algorithm considerably reduced the search space and provided a much faster and more accurate convergence than the classic GA formulation. It is expected that, for more complex networks (networks with a higher number of links or higher number of pipe diameters), the advantages provided by the new B-GA approach could be even greater.
Another major advantage of the proposed search space reduction is that it can be coupled to other metaheuristics. The performance of this strategy when applied to other types of metaheuristics is an issue still to be investigated.
5. Conclusions
The following conclusions can be drawn from this research work:
- A new approach based on bounding and reducing the total search space in a water distribution network design problem has been developed. This new approach reduces the search space by analyzing two opposite extreme flow distribution scenarios and then applying velocity restrictions to the pipes.
- This new approach has been coupled to a GA in order to improve its performance.
- The proposed B-GA algorithm considerably reduced the search space and provided a much faster and more accurate convergence than the classic GA formulation for a small and a medium benchmark network. It is expected that, for more complex networks, the advantages provided by the new B-GA approach could be even greater.
- This new approach could also be implemented in other types of heuristic methods. The improvements on the performance of these heuristics provided by the new approach are still to be investigated.
Acknowledgments
The authors acknowledge the support of the Spanish Ministry of Economy, Industry and Competitiveness under the contract CGL2010-21865.
Author Contributions
J. Reca and R. López conceived and developed the model, J. Reca and J. Martínez performed the simulations and analyzed the results, J. Reca wrote the paper, R. López and J. Martínez revised and corrected the final document.
Conflicts of Interest
The authors declare no conflict of interest.
References
- Yates, D.; Templeman, A.; Boffey, T. The computational complexity of the problem of determining least capital cost designs for water supply networks. Eng. Optim. 1984, 7, 143–155. [Google Scholar] [CrossRef]
- Reca, J.; Martínez, J. Genetic algorithms for the design of looped irrigation water distribution networks. Water Resour. Res. 2006, 42, W05416. [Google Scholar] [CrossRef]
- Alperovits, E.; Shamir, U. Design of optimal water distribution systems. Water Resour. Res. 1977, 13, 885–900. [Google Scholar] [CrossRef]
- Varma, K.; Narasimhan, S.; Bhallamudi, S.M. Optimal design of water distribution systems using NLP method. J. Environ. Eng. 1997, 123, 381–388. [Google Scholar] [CrossRef]
- Cunha, M.D.; Sousa, J. Water distribution network design optimization: Simulated annealing approach. J. Water Resour. Plan. Manag. 1999, 125, 215–221. [Google Scholar] [CrossRef]
- Lansey, K.E.; Eusuff, M.M. Optimization of water distribution network design using the Shuffled Frog Leaping Algorithm”. J. Water Resour. Plan. Manag. 2003, 129, 10–25. [Google Scholar] [CrossRef]
- De Corte, A.; Sörensen, K. An Iterated Local Search Algorithm for multi-period water distribution network design optimization. Water 2016, 8, 359. [Google Scholar] [CrossRef]
- Montalvo, I.; Izquierdo, J.; Pérez, R.; Tung, M.M. Particle Swarm Optimization applied to the design of water supply systems. Comput. Math. Appl. 2008, 56, 769–776. [Google Scholar] [CrossRef]
- Montesinos, P.; Garcia-Guzman, A.; Ayuso, J.L. Water distribution network optimisation using modified genetic algorithm. Water Resour. Res. 1999, 35, 3467–3473. [Google Scholar] [CrossRef]
- Farmani, R.; Walters, G.A.; Savic, D.A. Trade-off between total cost and reliability for anytown water distribution network. J. Water Resour. Plan. Manag. 2005, 131, 161–171. [Google Scholar] [CrossRef]
- Reca, J.; Martinez, J.; Baños, R.; Gil, C. Optimal design of gravity-fed looped water distribution networks considering the resilience index. J. Water Resour. Plan. Manag. 2008, 134, 234–238. [Google Scholar] [CrossRef]
- Reca, J.; Martinez, J.; Gil, C.; Baños, R. Application of several meta-heuristic techniques to the optimization of real looped water distribution networks. Water Resour. Manag. 2008, 22, 1367–1379. [Google Scholar] [CrossRef]
- Baños, R.; Gil, C.; Reca, J.; Martinez, J. Implementation of scatter search for multi-objective optimization: A comparative study. Comput. Optim. Appl. J. 2009, 42, 421–441. [Google Scholar] [CrossRef]
- Baños, R.; Reca, J.; Martinez, J.; Gil, C.; Márquez, A.L. Resilience indexes for water distribution network design: A performance analysis under demand uncertainty. Water Resour. Manag. 2011, 25, 2351–2366. [Google Scholar] [CrossRef]
- Glover, F.; Laguna, M.; Dowsland, K.A. Modern Heuristic Techniques for Combinatorial Problems; Blackwell: London, UK, 1993. [Google Scholar]
- Vavasis, S.A. Nonlinear Optimization: Complexity Issues; Oxford University Press: Oxford, UK, 1991; p. 165. [Google Scholar]
- Holland, J.H. Adaptation in Natural and Artificial Systems; MIT Press: Cambridge, MA, USA, 1975. [Google Scholar]
- Wu, Z.Y.; Walski, T. Self-Adaptive Penalty Approach compared with other Constraint-Handling techniques for pipeline optimization. J. Water Resour. Plan. Manag. 2005, 131, 181–192. [Google Scholar] [CrossRef]
- Rossman, L.A. EPANET 2 Users Manual; Rep. EPA/600/R-00/057; United States Environmental Protection Agency: Cincinnati, OH, USA, 2000.
- Geem, Z.W.; Kim, J.H.; Loganathan, G.V. A new heuristic optimisation algorithm: Harmony search. Simulation 2001, 76, 60–68. [Google Scholar] [CrossRef]
Figure 1.
Flowchart of the proposed model.

Figure 2.
Layout of the Alperovits and Shamir network [3].
Figure 2.
Layout of the Alperovits and Shamir network [3].

Figure 3.
Layout of the Hanoi network.

Figure 4.
Evolution of the best fitness value for B-GENOME and GENOME algorithms (Alperovits and Shamir Network).
Figure 4.
Evolution of the best fitness value for B-GENOME and GENOME algorithms (Alperovits and Shamir Network).
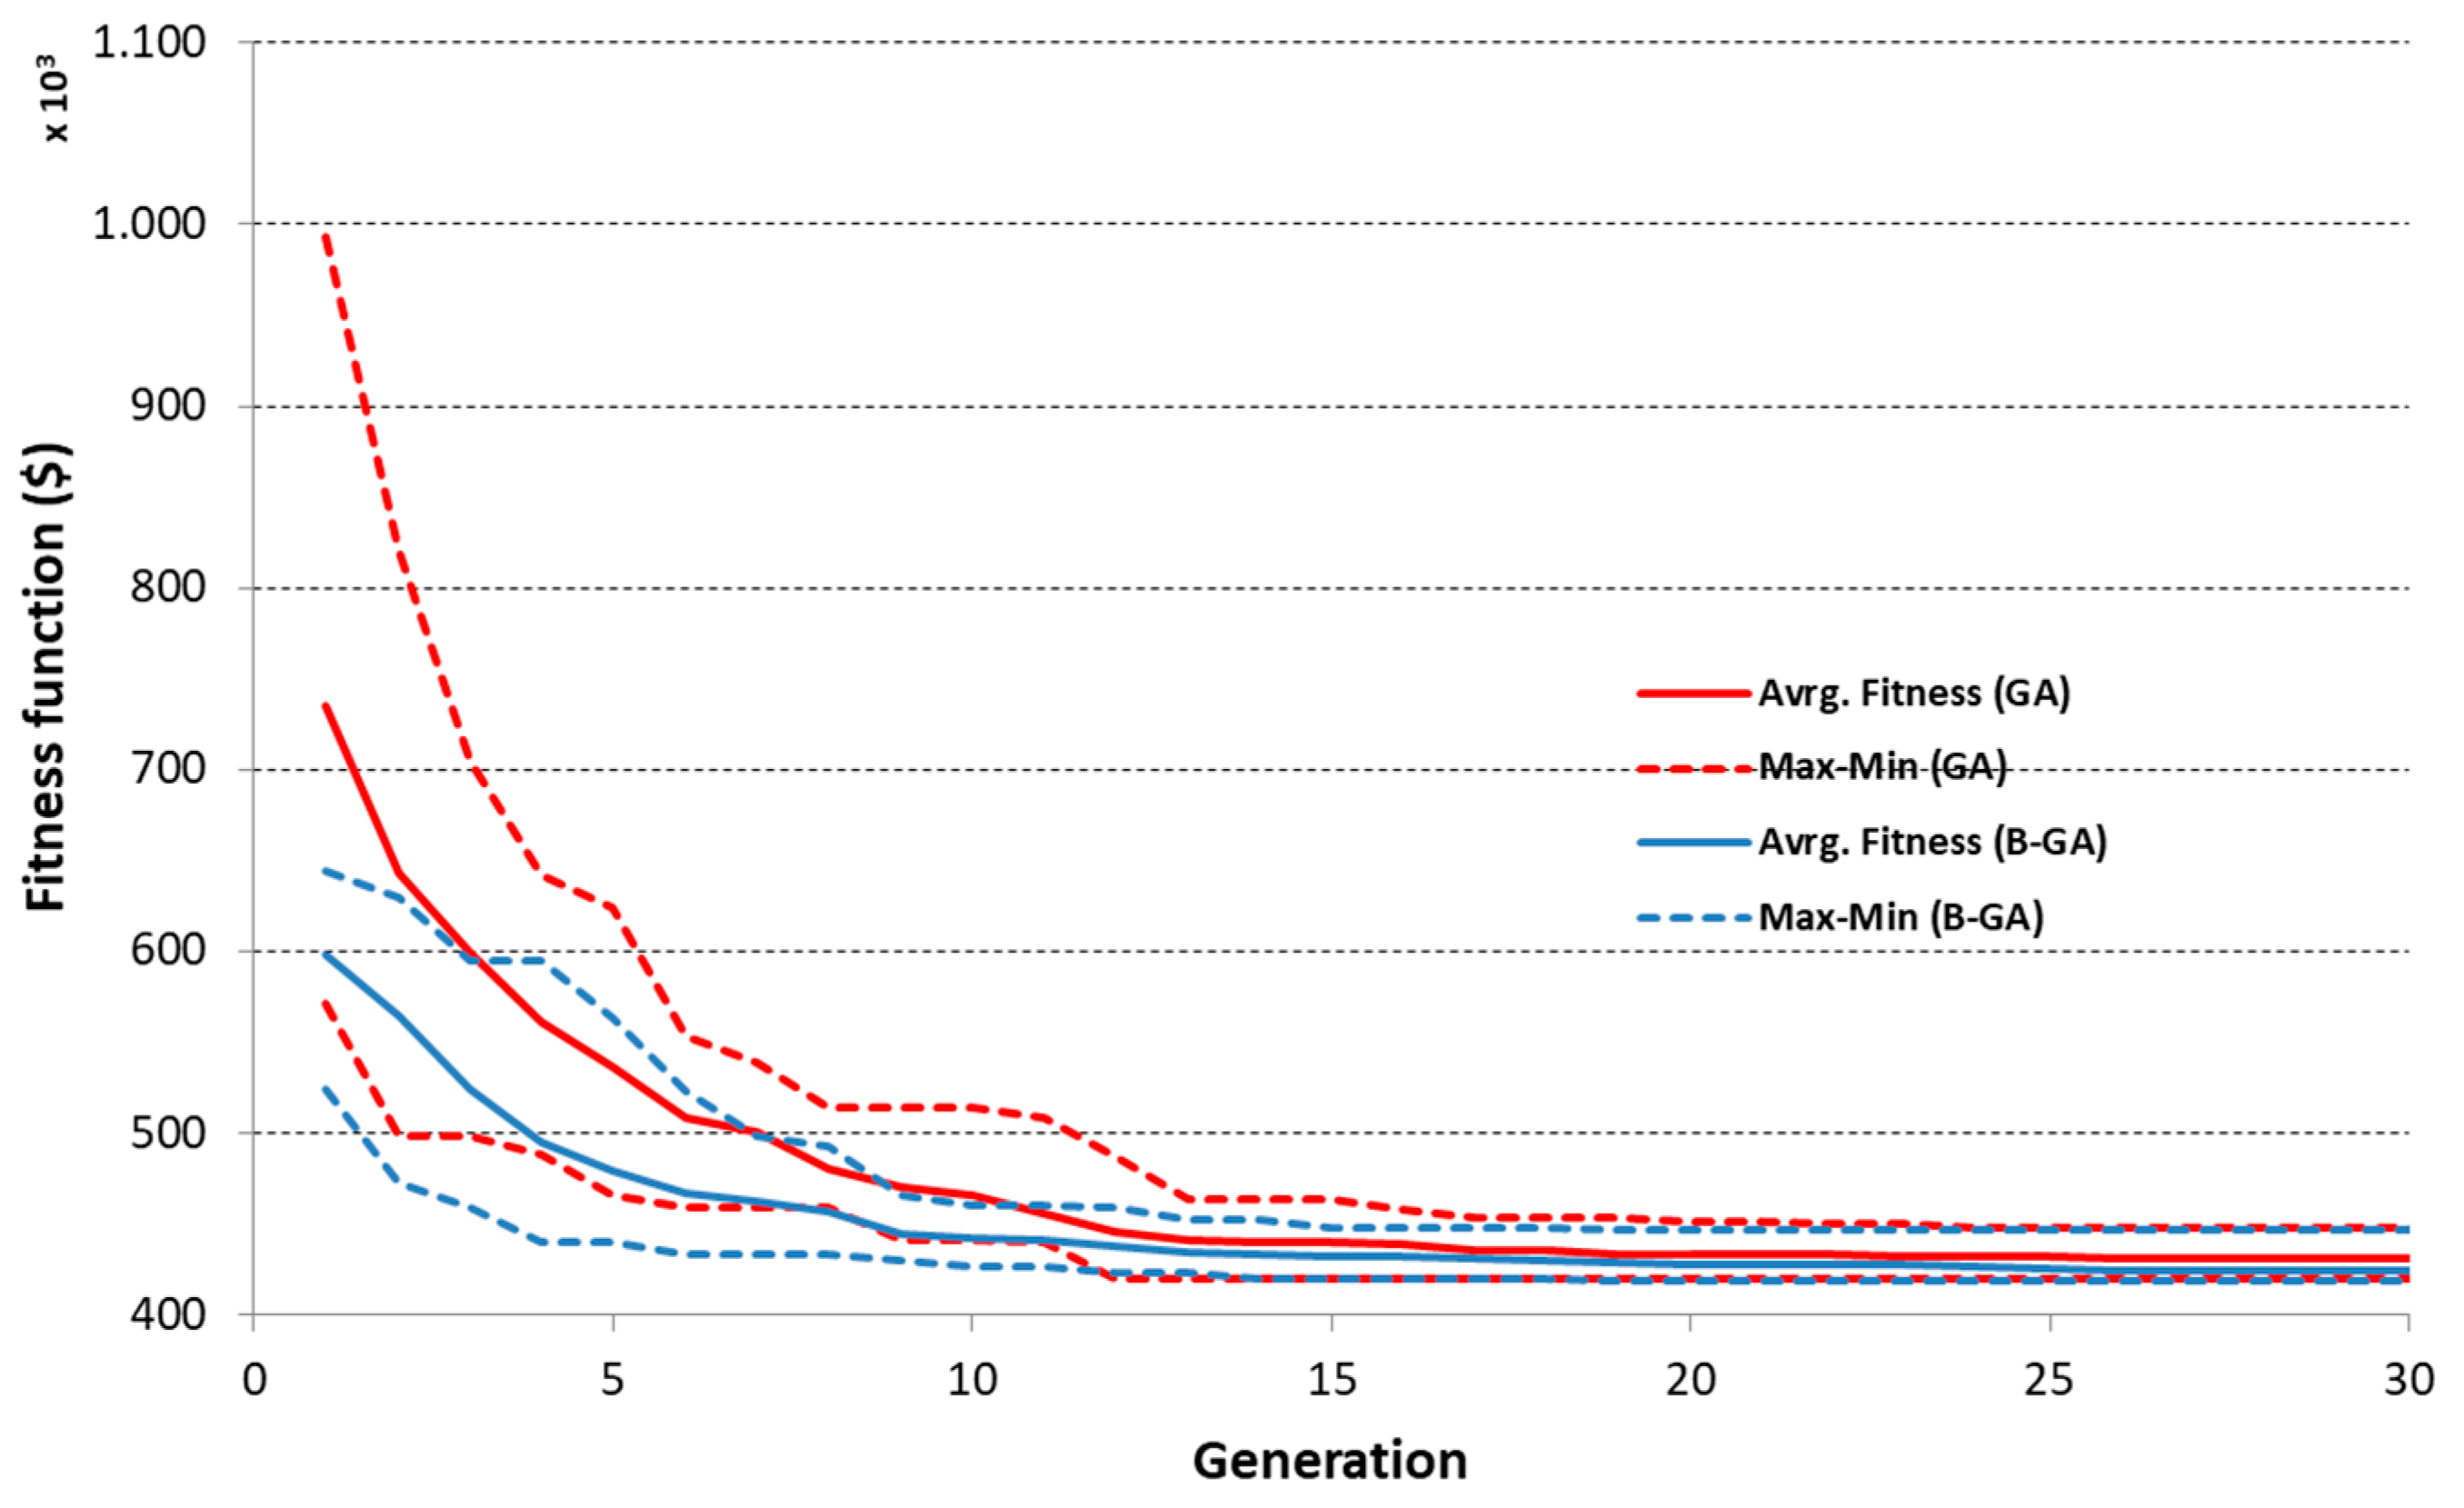
Figure 5.
Evolution of the best fitness value for B-GENOME and GENOME algorithms (Hanoi Network).


Table 1.
Input parameters for the Genetic Algorithm.
| Parameter | A&S | Hanoi |
|---|---|---|
| Population (np) | 100 | 200 |
| Generations (ng) | 200 | 300 |
| Crossover prob. (pcross) | 0.9 | 0.9 |
| Mutation prob. (Pmut) | 0.05 | 0.05 |
| Prob. of gene crossing (rcross) | 0.5 | 0.5 |
| Reproduction plan | steady-state-delete-worst plan | steady-state-delete-worst plan |
| Crossover operator | uniform crossover | uniform crossover |
Table 2.
Flow range, maximum and minimum diameters and number of possible diameters for each link obtained from the Quadratic Programming Problems QPPs for the Alperovits and Shamir network.
Table 2.
Flow range, maximum and minimum diameters and number of possible diameters for each link obtained from the Quadratic Programming Problems QPPs for the Alperovits and Shamir network.
| Link | QMD (L/h) | QMC (L/h) | Dm (mm) | DM (mm) | N°D |
|---|---|---|---|---|---|
| 1 | 311.1 | 311.1 | 356 | 610 | 6 |
| 2 | 117.0 | 27.8 | 102 | 559 | 10 |
| 3 | 166.3 | 255.6 | 254 | 559 | 8 |
| 4 | 40.0 | 75.0 | 102 | 457 | 8 |
| 5 | 93.0 | 147.2 | 152 | 610 | 10 |
| 6 | 1.3 | 55.6 | 25.4 | 406 | 10 |
| 7 | 89.3 | 0.0 | 25.4 | 508 | 12 |
| 8 | 54.3 | 0.0 | 25.4 | 406 | 10 |
Table 3.
Flow range, maximum and minimum diameters and number of possible diameters for each link obtained from the QPPs for the Hanoi network.
Table 3.
Flow range, maximum and minimum diameters and number of possible diameters for each link obtained from the QPPs for the Hanoi network.
| Link | QMD (L/h) | QMC (L/h) | Dm (mm) | DM (mm) | N°D |
|---|---|---|---|---|---|
| 1 | 19,940 | 19,940 | 1016 | 1016 | 1 |
| 2 | 19,050 | 19,050 | 1016 | 1016 | 1 |
| 3 | 5326 | 6810 | 1016 | 1016 | 1 |
| 4 | 5196 | 6680 | 1016 | 1016 | 1 |
| 5 | 4471 | 5955 | 1016 | 1016 | 1 |
| 6 | 3466 | 4950 | 762 | 1016 | 2 |
| 7 | 2116 | 3600 | 609.6 | 1016 | 3 |
| 8 | 1566 | 3050 | 508 | 1016 | 4 |
| 9 | 1041 | 2525 | 406.4 | 1016 | 4 |
| 10 | 2000 | 2000 | 609.6 | 1016 | 3 |
| 11 | 1500 | 1500 | 508 | 1016 | 4 |
| 12 | 940 | 940 | 406.4 | 1016 | 5 |
| 13 | 1484 | 0 | 304.8 | 1016 | 6 |
| 14 | 2099 | 615 | 304.8 | 1016 | 6 |
| 15 | 2379 | 895 | 304.8 | 1016 | 5 |
| 16 | 2968 | 1205 | 508 | 1016 | 4 |
| 17 | 3833 | 2070 | 609.6 | 1016 | 3 |
| 18 | 5178 | 3415 | 762 | 1016 | 2 |
| 19 | 5238 | 3475 | 762 | 1016 | 2 |
| 20 | 7637 | 7915 | 1016 | 1016 | 1 |
| 21 | 1415 | 1415 | 508 | 1016 | 4 |
| 22 | 485 | 485 | 304.8 | 1016 | 6 |
| 23 | 4947 | 5225 | 1016 | 1016 | 1 |
| 24 | 2890 | 3065 | 609.6 | 1016 | 3 |
| 25 | 2070 | 2245 | 609.6 | 1016 | 3 |
| 26 | 992 | 1270 | 406.4 | 1016 | 5 |
| 27 | 92 | 370 | 304.8 | 762 | 5 |
| 28 | 278 | 0 | 304.8 | 762 | 5 |
| 29 | 1011 | 1115 | 406.4 | 1016 | 5 |
| 30 | 721 | 825 | 406.4 | 1016 | 5 |
| 31 | 361 | 465 | 304.8 | 1016 | 6 |
| 32 | 1 | 105 | 304.8 | 1016 | 6 |
| 33 | 104 | 0 | 304.8 | 1016 | 6 |
| 34 | 909 | 805 | 304.8 | 1016 | 6 |
Table 4.
Solutions found by both algorithms for the Alperovits and Shamir network.
| Algorithm | Min Cost ($) | Max Cost ($) | Avrg. Cost ($) | Std. Dev. ($) | C. Var (%) |
|---|---|---|---|---|---|
| B-GA | 419,000 | 447,000 | 424,000 | 9099 | 2.15 |
| GA | 420,000 | 448,000 | 430,900 | 11,344 | 2.63 |
Table 5.
Solutions found by both algorithms for the Hanoi network.
| Algorithm | Min Cost ($) | Max Cost ($) | Avrg. Cost ($) | Std. Dev. ($) | C. Var (%) |
|---|---|---|---|---|---|
| B-GA | 6,182,006 | 6,242,051 | 6,219,390 | 19,831 | 0.32 |
| GA | 6,208,937 | 6,373,131 | 6,296,366 | 57,791 | 0.92 |
© 2017 by the authors. Licensee MDPI, Basel, Switzerland. This article is an open access article distributed under the terms and conditions of the Creative Commons Attribution (CC BY) license (http://creativecommons.org/licenses/by/4.0/).
Share and Cite
MDPI and ACS Style
Reca, J.; Martínez, J.; López, R. A Hybrid Water Distribution Networks Design Optimization Method Based on a Search Space Reduction Approach and a Genetic Algorithm. Water 2017, 9, 845. https://doi.org/10.3390/w9110845
AMA Style
Reca J, Martínez J, López R. A Hybrid Water Distribution Networks Design Optimization Method Based on a Search Space Reduction Approach and a Genetic Algorithm. Water. 2017; 9(11):845. https://doi.org/10.3390/w9110845
Chicago/Turabian StyleReca, Juan, Juan Martínez, and Rafael López. 2017. "A Hybrid Water Distribution Networks Design Optimization Method Based on a Search Space Reduction Approach and a Genetic Algorithm" Water 9, no. 11: 845. https://doi.org/10.3390/w9110845
Note that from the first issue of 2016, this journal uses article numbers instead of page numbers. See further details here.