Quantifying Effectiveness of Streambank Stabilization Practices on Cedar River, Nebraska

1
Environmental Engineering, University of Nebraska-Lincoln, Lincoln, NE 68535, USA
2
Biological Systems Engineering, University of Nebraska-Lincoln, Lincoln, NE 68535, USA
*
Author to whom correspondence should be addressed.
Water 2017, 9(12), 930; https://doi.org/10.3390/w9120930
Submission received: 15 September 2017
/
Revised: 20 November 2017
/
Accepted: 26 November 2017
/
Published: 29 November 2017
(This article belongs to the Special Issue Streambank Erosion: Monitoring, Modeling and Management)
Abstract
:Excessive sediment is a major pollutant to surface waters worldwide. In some watersheds, streambanks are a significant source of this sediment, leading to the expenditure of billions of dollars in stabilization projects. Although costly streambank stabilization projects have been implemented worldwide, long-term monitoring to quantify their success is lacking. There is a critical need to document the long-term success of streambank restoration projects. The objectives of this research were to (1) quantify streambank retreat before and after the stabilization of 18 streambanks on the Cedar River in North Central Nebraska, USA; (2) assess the impact of a large flood event; and (3) determine the most cost-efficient stabilization practice. The stabilized streambanks included jetties (10), rock-toe protection (1), slope reduction/gravel bank (1), a retaining wall (1), rock vanes (2), and tree revetments (3). Streambank retreat and accumulation were quantified using aerial images from 1993 to 2016. Though streambank retreat has been significant throughout the study period, a breached dam in 2010 caused major flooding and streambank erosion on the Cedar River. This large-scale flood enabled us to quantify the effect of one extreme event and evaluate the effectiveness of the stabilized streambanks. With a 70% success rate, jetties were the most cost-efficient practice and yielded the most deposition. If minimal risk is unacceptable, a more costly yet immobile practice such as a gravel bank or retaining wall is recommended.
1. Introduction
Sediment is a primary pollutant to surface water and a leading cause of water quality impairment [1]. Though erosion is a natural and even necessary process [2], the rate of erosion has been accelerated due to human activities such as farming and urbanization. In some watersheds, streambank erosion is the main source of sediment to rivers and streams [3]. The excess sediment affects the water chemistry, aquatic organisms, and the water clarity in our streams and reservoirs. Excess sediment is aesthetically displeasing, increases the cost of treating drinking water, decreases water clarity, and has an overall negative impact on the aquatic ecosystem [4,5,6,7,8]. The increased turbidity not only affects the water aesthetics but also reduces photosynthesis and organisms’ visibility. Siltation alters flow in streams and decreases the storage volume in our reservoirs, which in turn affects flooding, drinking water, and recreation.
Alluvial channels continue to adjust, change, and sometimes shift their location [9]. In some eroding stream reaches, the streambanks are stabilized using conventional or modified stabilization techniques. Such stabilization structures are typically implemented in an effort to lock the stream channel into a relatively fixed location and condition [9]. The channel bank infrastructure then alters the geomorphic processes and can lead to more erosion at the stabilized site as well as at locations upstream and downstream [10,11]. When these channel migration processes are ignored, the erosion-control structures may become ineffective over time, causing failure during large flow events [2,9,10]. Rosgen [12] has restored and monitored over 48 km of rivers and has monitored various structures’ performance following major floods. The results contradicted the expected pattern, as many structures caused river instability.
The cost of stream restoration continues to increase, yet few resources are being allocated to evaluate and monitor the restoration practices [13]. Annually, the USA spends $1 billion on stream restoration, the efforts of which are intended to improve the environmental health of a stream or river, generally by restoring a dynamically stable dimension, pattern, and profile [14,15]. One component of stream restoration is streambank stabilization, which is generally intended to maintain a stable channel dimension at the stabilization site. Although post-installation monitoring yields important information on the effectiveness of a stabilization practice, less than 10% of the projects include any assessment of outcomes [13]. Possible reasons include lack of funds (project ended) and poor project documentation. Even when monitoring occurs, inconsistencies in collection methods and limited reporting are common [16]. There is an urgent need to use evaluation data to update design and implementation methods to improve restoration approaches and increase the likelihood of success of the thousands of projects currently being planned and implemented [17].
Though several research papers have been written about monitoring stabilized streambanks, scant long-term monitoring of stabilized streambanks is relayed in the literature. In general, most previous research discusses the effectiveness of stabilization practices based on qualitative analysis or prediction-based models. Daly et al. [18] used BSTEM to estimate the streambank retreat rate over a seven-year (2003–2010) study period at 10 sites on Barren Fork Creek, Oklahoma. Protected sites had less streambank retreat, ranging from 4.1 to 74.8 m per year, while unprotected sites had an estimated average streambank retreat of 49.2 m per year. Simon et al. [19] also used a BSTEM model to analyze reduction in streambank sediment loads and bank failures at the Big Sioux River, Lower Tombigbee River and Lake Tahoe Basin. The average annual streambank erosion in the Big Sioux River was reduced by 51% (503,000 m3 to 243,000 m3) after toe protection was added, while overall volume of eroded bank material was reduced by 87–100% [19]. Similarly, in the Lake Tahoe Basin, total streambank erosion was reduced by about 89%. In the lower Tombigbee River, the amount of lateral retreat and volume of failed material reduced by about 500% (from 55,000 m3 to 9500 m3) [14].
Some project reports exist for stream assessment, but they consider general health of streams and measure sediment loads or fish habitat. Most techniques involve research on riparian vegetation or stream stabilization conducted using bioengineering techniques. No previous study has specifically focused on quantification of streambank erosion for monitoring of stabilization practices. This study evaluated 17 sites stabilized from 2000 to 2005 and one stabilized in 1950 on the Cedar River in Nebraska. These sites were stabilized to reduce surface-water degradation and sedimentation loading of the river system, improve the aquatic habitat through riparian buffers and increased vegetation, and reverse the loss of prime cropland and rangeland. No post-construction monitoring has been conducted for these sites to evaluate the effectiveness or the stability of the practices in mitigating the effects of erosion. For the 18 stabilized streambanks and 40 identified control streambanks, the objectives of this study were to (1) quantify streambank erosion from 1993–2016; (2) evaluate the impact of an extreme flood in 2010; and (3) determine the most cost-efficient technique.
2. Materials and Methods
2.1. Site Description
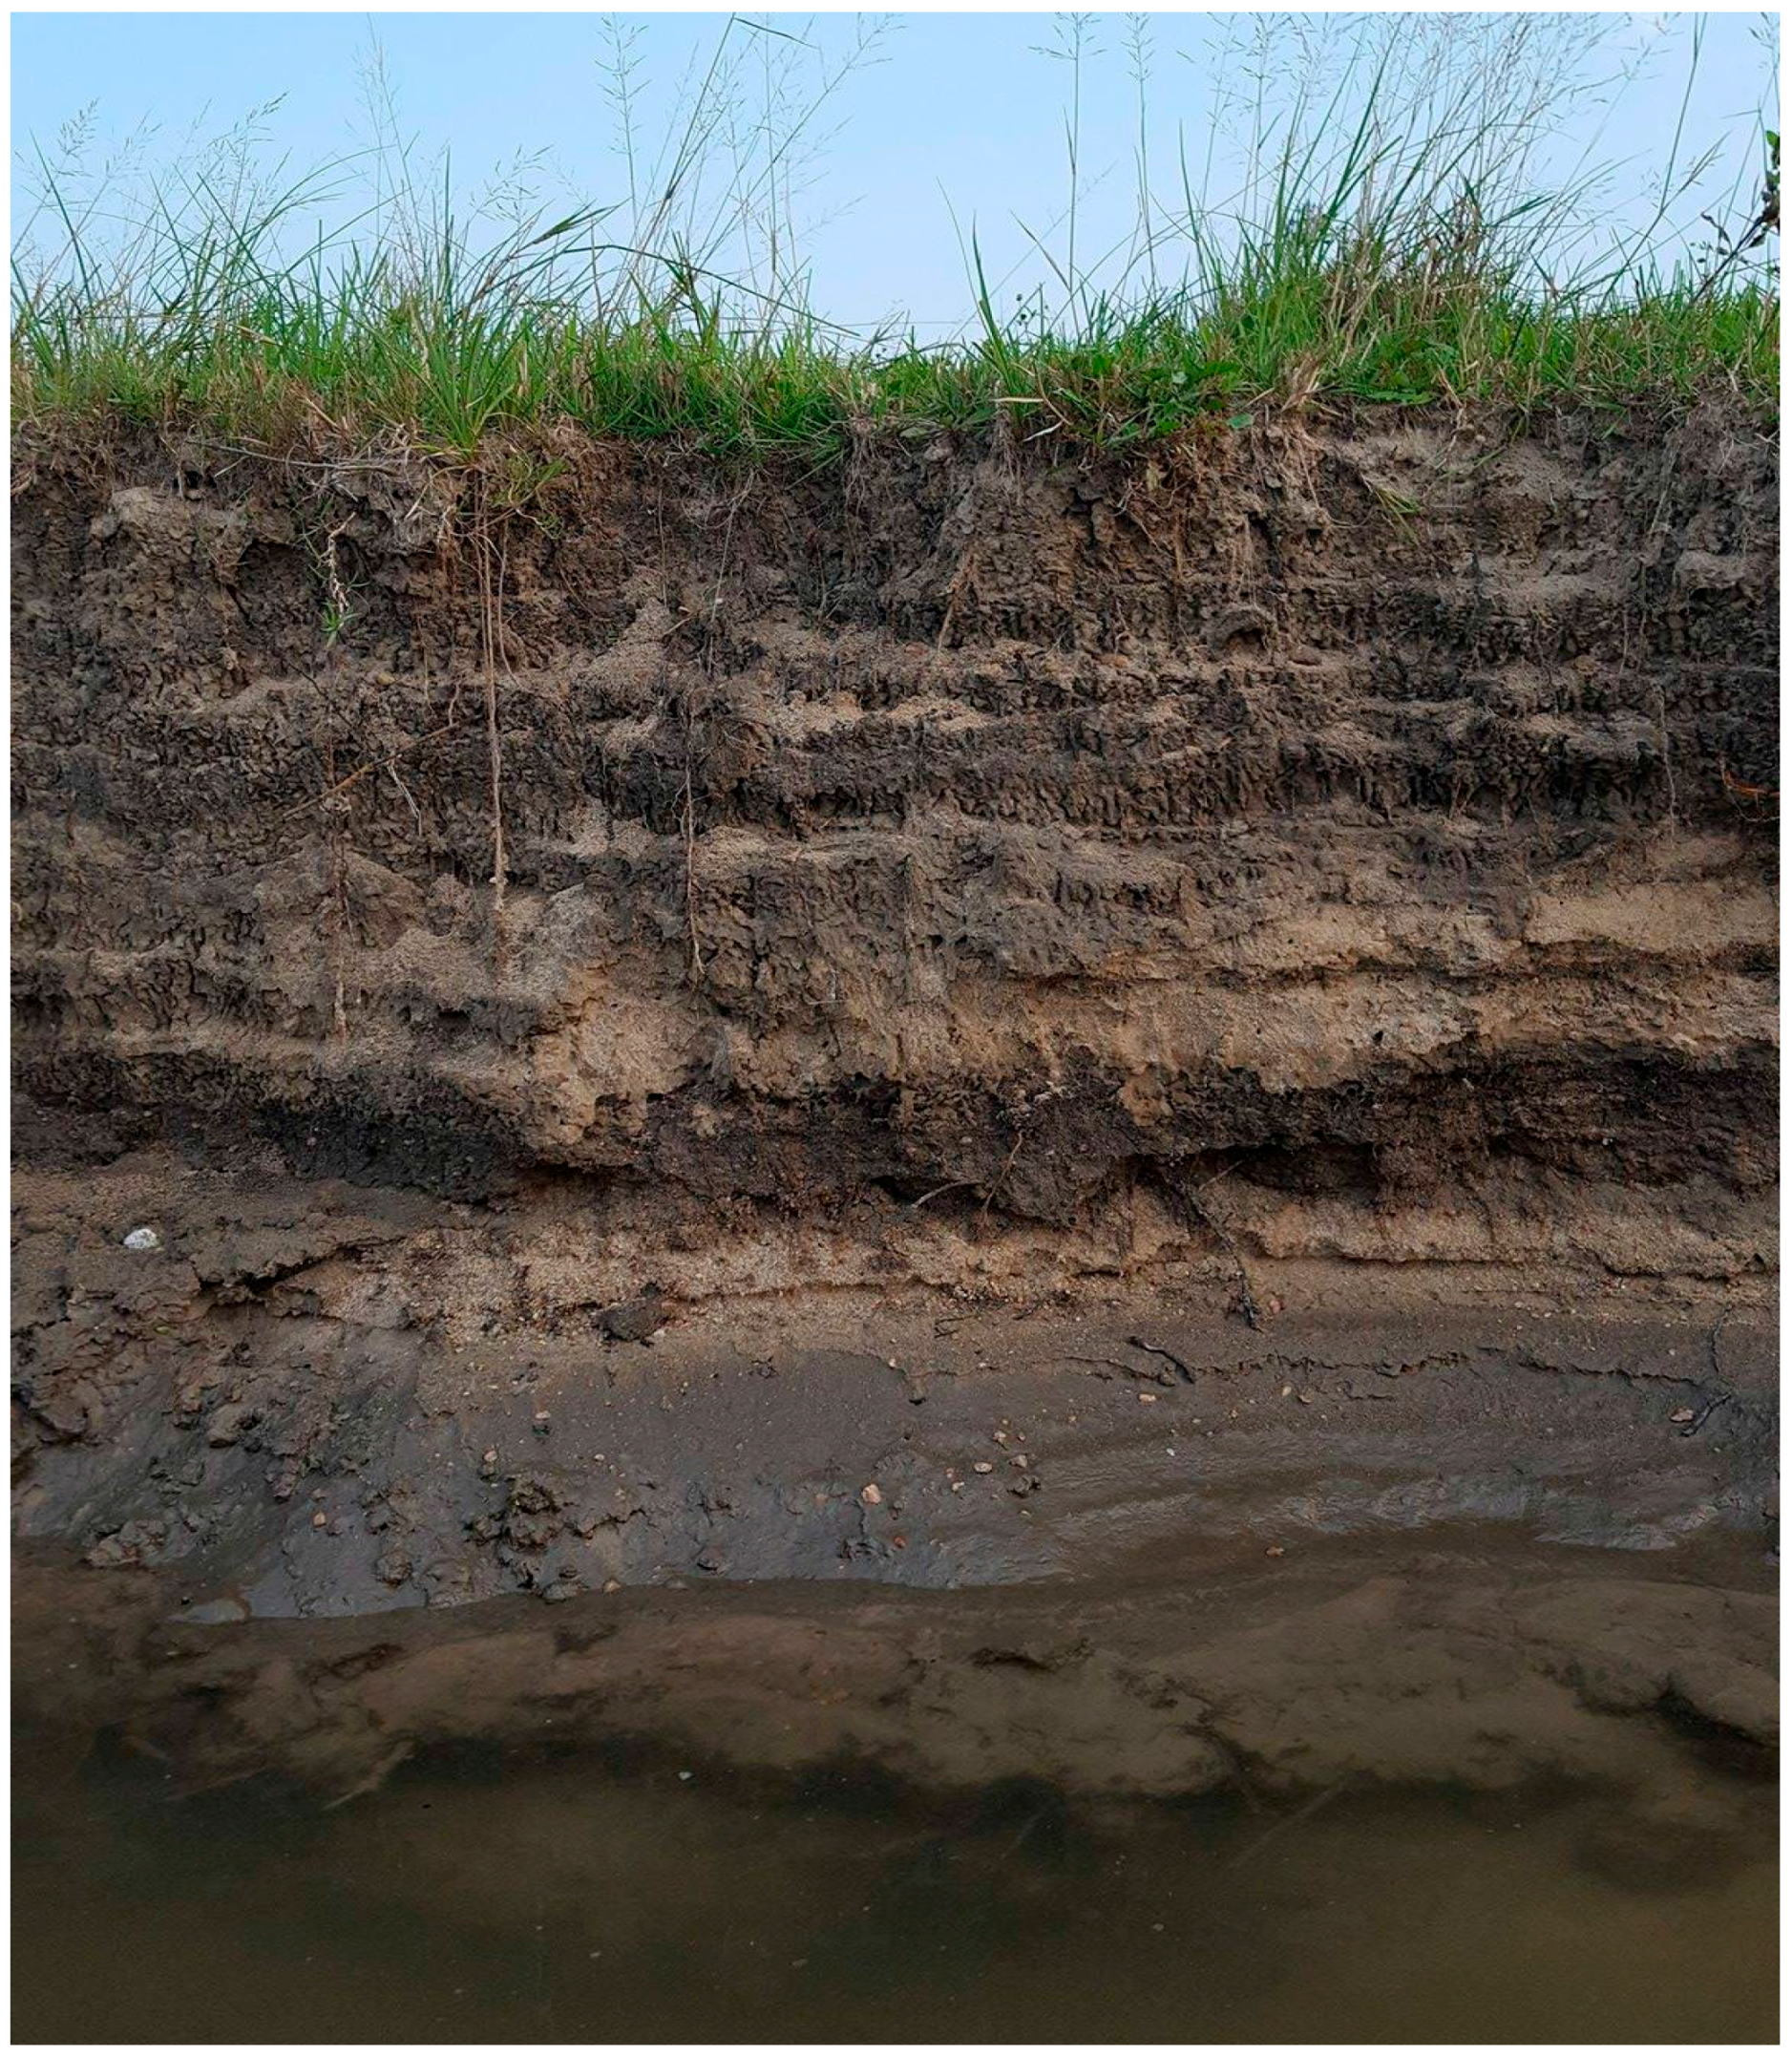
The Cedar River watershed is located in North Central Nebraska (Figure 1). The western half of the 3200 km2 watershed is mainly grassland and sand dunes in the Sand Hills, whereas the eastern half is predominantly cropland. Streambank height on the Cedar River averages 2.1 m and ranges from 0.4 to 4.0 m [20]. Streambanks are typified by silty, vegetated low-lying banks or higher banks with a combination of sandy and silty soil (Figure 2).
Two reservoirs on the Cedar River, Ericson Lake, and Spalding Lake, are used primarily to generate electricity but also provide recreational benefits, as does the Cedar River. The 200 km long Cedar River begins at the confluence of the Big and Little Cedar Creeks in Eastern Garfield County [20]. Dams are located near Ericson Lake and Spalding Lake (Figure 1). There are two gage stations on the Cedar River, located near Spalding Lake and Fullerton, Nebraska. From 2006 to 2016, the average flow was 5.6 m3 s−1 and 8.4 m3 s−1 [21] at the Spalding and Fullerton gage stations, respectively. Heavy rains starting on 8 June 2010 led to a breach in the Ericson Dam. On the night of 13 June 2010, the spillway breached, causing major flooding downstream [22]. The flow peaked at 148.6 m3 s−1 on 14 June 2010 at Spalding, an increase of 263% over the previous peak flow. On 15 June 2010, the flow peaked at 159.6 m3 s−1 at Fullerton, an increase of 31% over the previous peak flow. The peak flow was not as dramatic at Fullerton since much of the flow was captured in Spalding Lake, which reached its capacity on 14 June. Excluding the flood event in 2010, average daily streamflow ranged from 2.3 to 40.9 m3 s−1 at Spalding and 0.9 to 122.4 m3 s−1 at Fullerton.
In the early 2000s, the Lower Loup Resource Conservation and Development, working with more than 100 landowners, received two grants to address streambank erosion and water quality on the Cedar River [23]. Using a Topcon HiPer V GPS [24], we visited and documented 17 of the 20 streambanks stabilized. During our tour of the sites, we identified an additional streambank stabilized in 1950. Six different stabilization techniques were implemented on the Cedar River: jetties, tree revetments, rock vanes, a rock toe, a retaining wall, and a gravel bank (Figure 1). These can be aggregated into two categories: bank protection and flow deflection. Tree revetments, the rock toe, the gravel bank, and the retaining wall were installed to protect the bank. The jetties and rock vanes were installed to deflect the flow. Two of the sites were located upstream of Ericson Dam, four of them between the Ericson and Spalding Dams and 12 downstream of Spalding Dam. These 18 sites were grouped based on the type of stabilization practice. Ten sites were stabilized with three to nine jetties, spaced approximately 30 m apart (Figure 3). Three sites were stabilized with tree revetments, which are cedar trees anchored along the streambanks to capture sediment in the leaves and roots and to stop further loss of sediment from the bank. Two sites were stabilized with rock vanes, which are linear structures that extend out in the stream channel from the streambank in an upstream direction. One streambank was stabilized with rock toe with reduced slope, one with a retaining wall and one with a gravel bank with reduced slope (Table 1). Cutting and filling of land is required to achieve a reduced slope to help stabilize the initially higher and non-uniformly sloped streambank. Though final costs are unknown, the proposed average costs per meter of streambank stabilized, obtained from original grants, were as follows: jetties: $26; cedar tree revetment: $72; rock vane: $205; rock toe: $179; retaining wall: $625; and gravel bank: $600.
2.2. Lateral Streambank Erosion
The most common methods used to measure streambank erosion are erosion pins, aerial photography analysis, digital elevation models (DEMs), and repeat surveys [25]. Although aerial images are not as accurate as other methods, aerial photography is the only method that can be used to measure historical streambank retreat. Buchanan et al. [13], Pracheil [20], Mittelstet et al. [26], Heeren et al. [27], and Purvis and Fox [28] successfully analyzed aerial photography analysis to quantify the streambank erosion.
For this study, National Agricultural Imagery Program (NAIP) aerial photographs, acquired at 1 m spatial resolution, were used to measure the average lateral streambank retreat. High-resolution images were available for 1993, 1999, 2003, 2006, 2009, 2010, 2012, 2014, and 2016. Using ArcGIS 10.3 (Esri, Redlands, CA, USA), we measured the lateral streambank retreat for multiple time periods: pre-stabilization (1993–1999/2003), post-stabilization (1999/2003–2009), flood (2009–2010), and post-flood (2010–2016) (Figure 4). The lateral streambank erosion rate was calculated by dividing the measured eroded area by the length of the streambank. For example, for Site 11 (Figure 4), considering the calculation for the flood period (2009–2010), the length of the streambank in 2009 was 66.8 m. The streambank erosion was measured to be 152.9 m2 over a period of one year; hence, the total annual lateral streambank erosion rate was 152.9 m2/(66.8 m × 1 year) = 2.3 m2 m−1 year−1. The streambank erosion rate was calculated as the eroded area per meter of streambank, while deposition was measured as the gain or addition of sediment on the streambank, both in m2 m−1 year−1. Deposition was measured for several of the stabilized streambanks, often occurring just upstream of the jetty (Figure 3). The net streambank erosion for each reach was calculated for each time period by subtracting total accumulation from total erosion. To determine the success of each stabilized practice, we compared lateral streambank retreat for the pre-stabilization and post-stabilization time periods and to control sites. We used the Mann–Whitney test, a non-parametric test that could indicate whether the population medians of the two groups differed. Statistics were calculated using Minitab 17 Statistical Software (TIBCO Software Inc., Palo Alto, CA, USA), [29].
2.3. Identification of Control Sites
Since flow characteristics during the pre-stabilization and post-stabilization periods varied, control sites were used to compare streambank erosion for similar streamflow. Control sites were identified based on the following criteria: no dam located between the stabilized streambank and control site since the dams alter streamflow and sediment transport; the sites had a similar radius of curvature; and the sites had similar riparian vegetation. Vegetation was labeled as sparse grassland, dense grassland, or cropland. The radius of curvature was measured by drawing a circle that would coincide with the shape of curvature of the stabilized bank. Since the streambanks were uneven and it was difficult to measure the precise radius of curvature, the inflection point at the beginning of the site was used to measure the radius from the center of the circle. Figure 5 illustrates the radius of curvature for Site 4 and the control site in 2016. Values for radius of curvature in Table 1 were calculated using the 1993 aerial images.
One to three control sites were identified for each stabilized streambank. The 40 identified control sites were selected in the near vicinity of the actual stabilized bank to ensure similar streamflow. Streambank retreat, deposition, and net streambank erosion were calculated for each of the control sites using the same methodology as that for the stabilized streambanks. Total erosion, total accumulation, and total retreat during all four periods (pre-stabilization, post-stabilization, flood, and post-flood) on the control sites represent the natural conditions of the streambank.
3. Results and Discussion
To determine the success of the implemented practices, the streambank erosion was calculated for 18 stabilized banks and 40 control streambanks. The objectives of this study were to (1) quantify streambank erosion rates from 1993 to 2016; (2) evaluate the impact of the flood in 2010; and (3) determine the most cost-efficient practice.
3.1. Prestabilization and Poststabilization
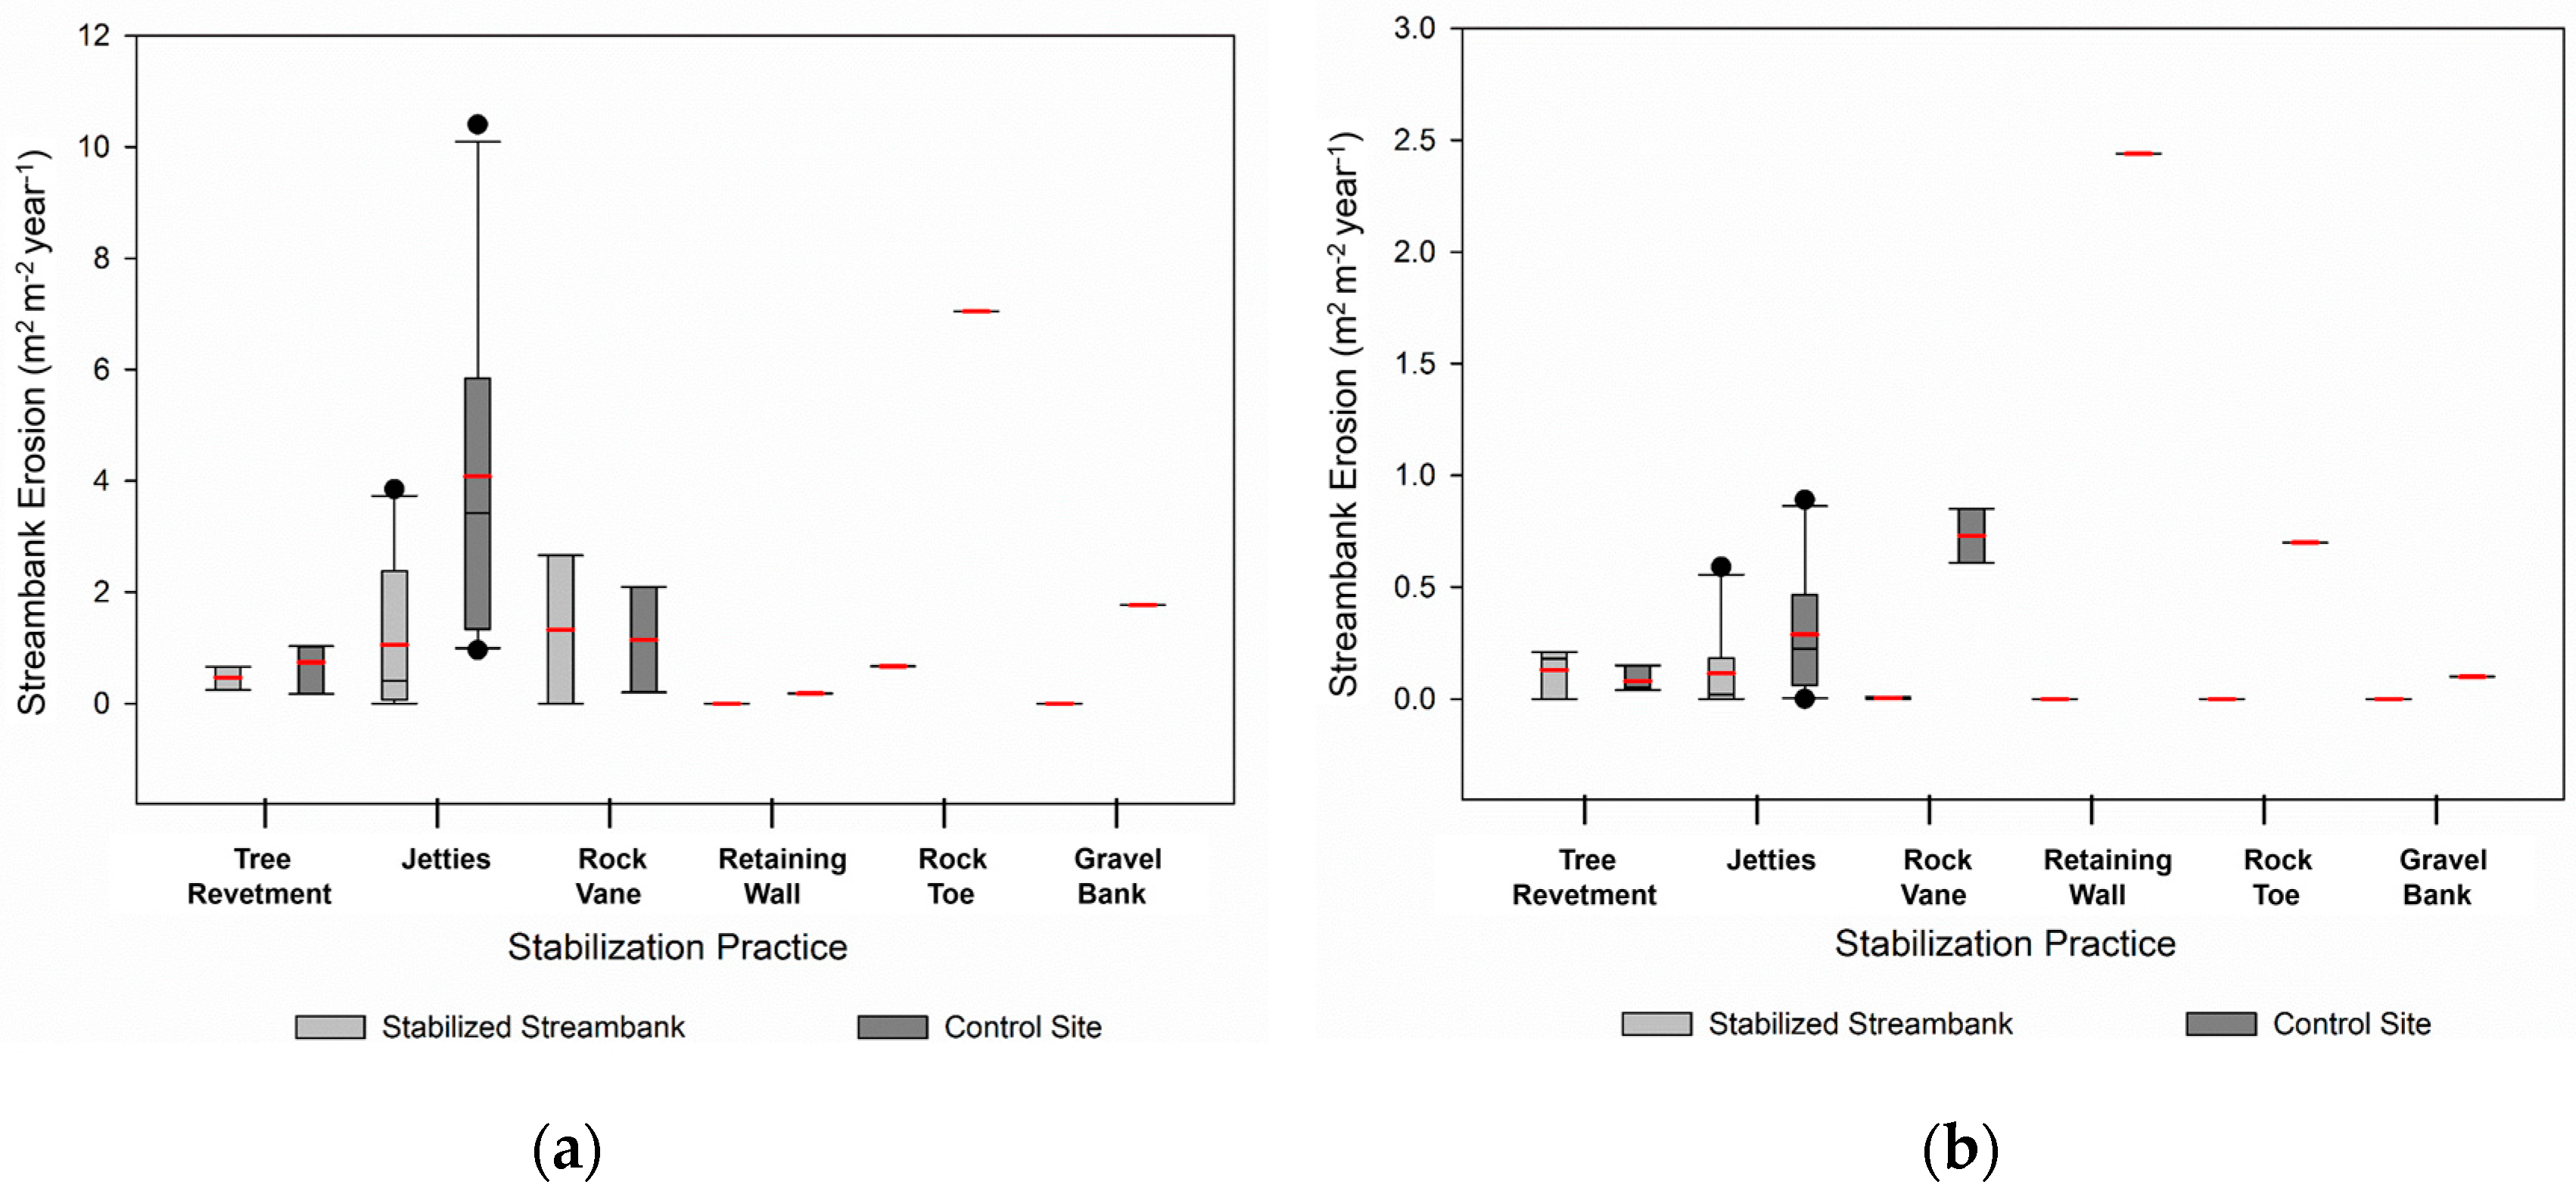
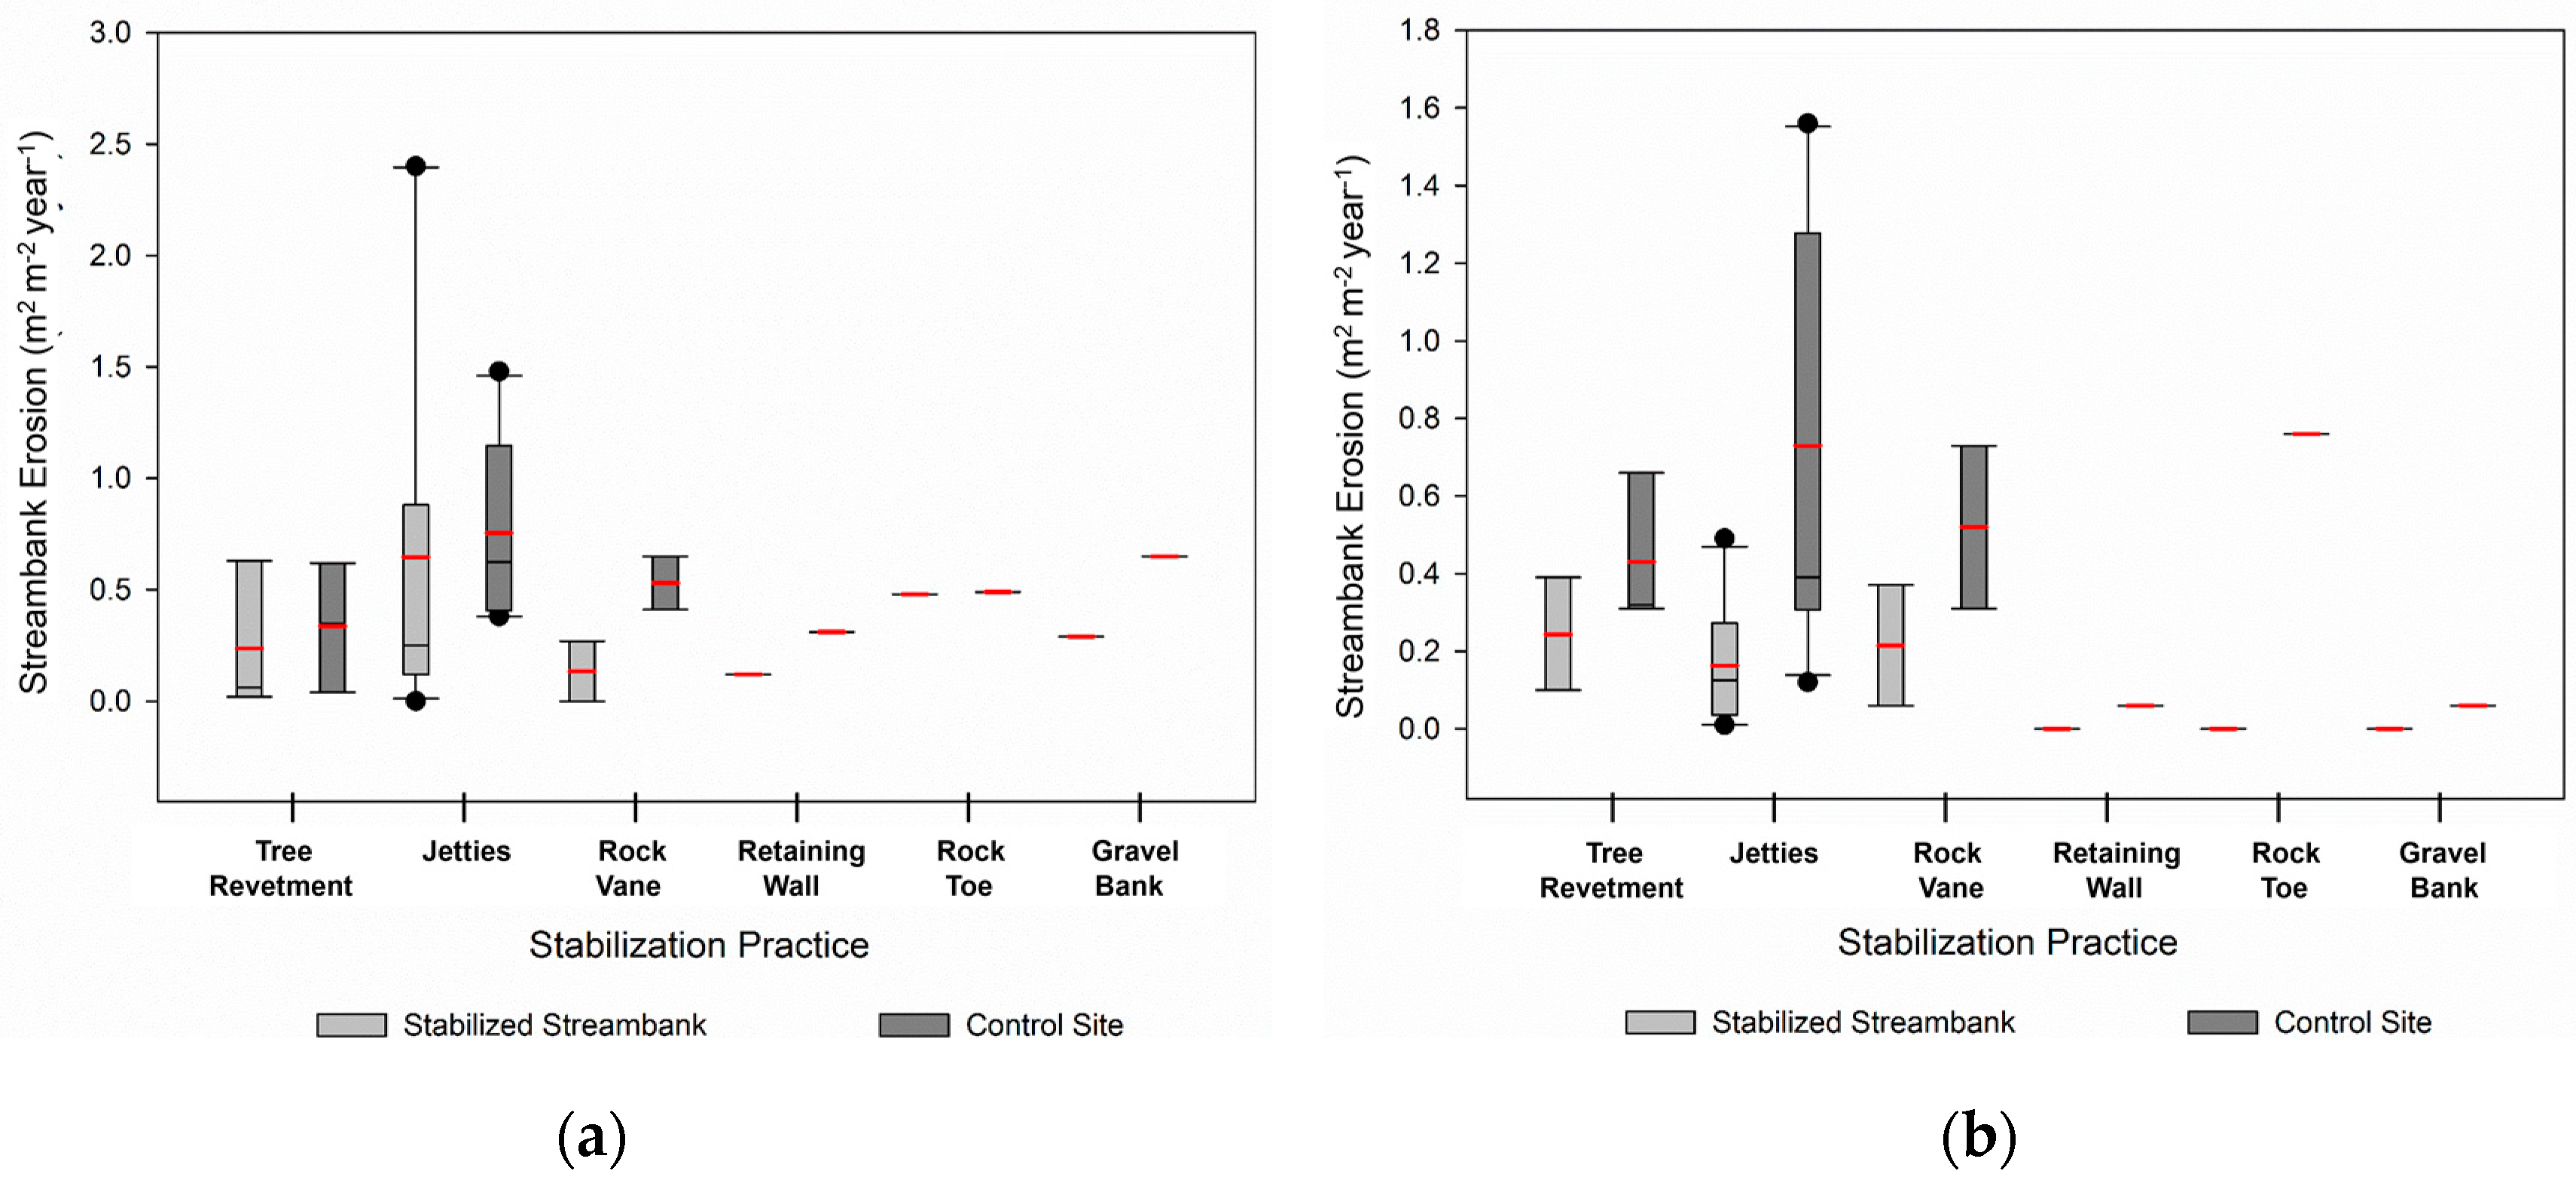
The average streambank erosion rate for the 18 stabilized streambanks before (1993–1999/2003) and after stabilization (1999/2003–2009) was 0.45 m2 m−1 year−1 and 0.16 m2 m−1 year−1, respectively. Assuming an average bank height of 2.1 m, the average total volume is 0.95 m3 m−1 year−1 and 0.34 m3 m−1 year−1. Since the data were not normally distributed, a nonparametric test was used to determine if the pre-stabilization and post-stabilization medians were significantly different. With a p-value of 0.34, the medians (0.22 m2 m−1 year−1 and 0.13 m2 m−1 year−1) were not significantly different. This may be attributed to the difference in streamflow between the two time periods; however, this supposition could not be tested since streamflow data prior to 2006 was not available from either gage station.
The average streambank erosion rate for the jetties was 0.65 m2 m−1 year−1 pre-stabilization and was significantly different from post-stabilization (0.16 m2 m−1 year−1). The streambank erosion rate for the retaining wall, rock toe, and gravel bank was zero following streambank stabilization (Figure 6). The tree revetments and rock vanes were less successful, with a small amount of erosion occurring. Similar to what we discovered, Brown [30] found that 27% of the banks protected with rootwad revetment (similar to cedar tree revetment) partially or fully failed to protect the streambank and that outflanking occurred at 25% of the rock vanes assessed. He also found that riprap (similar to the rock toe and gravel bank) fully protected the streambanks. Two years after installation, Buchanan et al. [13] found that 28% of the bank vanes (which are vanes that do not go across the entire river width but protect only the bank at the desired location) failed and that 36% were impaired. One limitation to comparing differences in streambank erosion rates among the practices observed within the present study is the limited number of observations for several of the practices.
To distinguish the impact of varied streamflow between the pre-stabilization and post-stabilization periods, the streambank erosion rate was compared with the 40 control sites (Table 2). Although we intended to identify control sites that mimicked our study sites, the median streambank erosion was significantly greater for the control sites (0.55 m2 m−1 year−1) than the stabilized streambanks (0.22 m2 m−1 year−1) during the pre-stabilization period with a p-value of 0.0042. The average streambank erosion rate pre-stabilization for the stabilized streambanks was 0.45 m2 m−1 year−1 with a range of 0–2.4 m2 m−1 year−1 compared with 0.63 m2 m−1 year−1 and a range of 0.04–1.5 m2 m−1 year−1 for the control sites. The median streambank erosion rate during the post-stabilization period between the stabilized and control streambanks were significantly different (a p-value of 0.0002) with median streambank erosion rates of 0.13 m2 m−1 year−1 and 0.38 m2 m−1 year−1 for the stabilized and control sites, respectively. The jetties were successful with the median erosion for the stabilized streambanks and controls sites, being 0.13 m2 m−1 year−1 and 0.39 m2 m−1 year−1, respectively. The erosion was significantly different with a p-value of 0.0036. The more expensive practices (rock toe, retaining wall, and gravel bank) were all successful and completely stabilized the streambanks.
3.2. Flood Impact
The flood in 2010 caused a significant quantity of erosion, especially at the control sites (Figure 7). The average erosion rate during the flood was 0.74 m2 m−1 and 3.1 m2 m−1 for the stabilized streambanks and control sites, respectively. The medians, 0.40 m2 m−1 and 1.93 m2 m−1, were significantly different with a p-value of 0.0013. Four sites downstream of Spalding failed because their structure lost functionality during the flood: Sites 10, 16, and 18, which have jetties, and Site 12, which has a rock vane. Even with some of the jetties failing at Sites 10, 16, and 18 (Figure 3), the average streambank erosion rates for jetties for the stabilized streambanks and the control sites were significantly different (0.007) with a median erosion of 0.41 m2 m−1 and 3.42 m2 m−1, respectively. Minimal erosion occurred at the top of the streambank at Site 9 (rock toe). No erosion occurred on the streambanks stabilized with the retaining wall and gravel bank. For comparison, Miller and Kochel [31] conducted an assessment of 26 stream restoration projects across North Carolina and almost 30% of the structures underwent partial or total damage and lost their functionality. Though these were stream restoration projects, calculated results mainly represented the erosion control practices. Spatially, the damage was done at 10 out 16 sites and amongst those sites, cross vanes and double wings exhibited the greatest damage out of six different types of practices: cross vanes, rock vanes, j-hook, double wings, log vanes, and rootwads [31].
Previously, Dragićević et al. [32] evaluated flood erosion rates using aerial photography on the Kolubara River, which experienced a flood wave in May 2014, and found that the land loss in 2014 was three times larger than in 2013. Comparable to that study, the average erosion rate for the control sites was five times larger during the flood in 2010 (3.05 m2 m−1 year−1) compared to the time period 2001–2009 (0.57 m2 m−1 year−1).
We also compared the erosion upstream of Ericson Dam (2 sites) to the 4 sites downstream of the breached dam and to the 10 sites downstream of Spalding Dam. For the stabilized streambanks, the medians were not significantly different from the upstream sites (0.45 m2 m−1 year−1), those downstream of the Ericson Dam (0.55 m2 m−1 year−1), or those downstream of Lake Spalding (0.21 m2 m−1 year−1). Since the lack of a significant difference may be attributed to the types of practices installed at the three locations, we evaluated the erosion at the control sites. The median streambank erosion rate was 0.60 m2 m−1 year−1, 1.56 m2 m−1 year−1, and 3.42 m2 m−1 year−1 upstream of Lake Ericson, downstream of Lake Ericson, and downstream of Lake Spalding, respectively. The erosion immediately downstream of the breached dam at the control sites was surprisingly less than the erosion below Spalding Dam. This may be a function of a larger number of control sites or possibly the differences in streambank and channel characteristics. Comparing the stabilized streambanks and the control sites, the median streambank erosion downstream of Lake Ericson was not significantly different, with a p-value of 0.19, but was significantly different downstream of Spalding Dam (a p-value of 0.0029).
3.3. Post-Flood Impact
The flood influenced the stabilized streambanks in an unexpected manner. We expected more erosion during the post-flood period than the pre-flood period (post-stabilization) due to the disturbance caused by the extreme flow event. For this project, however, excluding Sites 10, 14, and 15 (all jetties), the post-flood erosion was much lower than the pre-flood erosion. The median post-flood streambank erosion rate was 0.0 m2 m−1 year−1 for the stabilized streambanks and 0.17 m2 m−1 year−1 for the control sites, significantly different with a p-value of 0.001. The average erosion rate was 0.08 m2 m−1 year−1 and 0.41 m2 m−1 year−1, respectively. The median pre-flood (0.13 m2 m−1 year−1) and post-flood (0.0 m2 m−1 year−1) streambank erosion rate was significantly different for the stabilized streambanks, with a p-value of 0.03. The same was true for the control sites with median pre-flood and post-flood erosion of 0.38 m2 m−1 year−1 and 0.18 m2 m−1 year−1 (a p-value of 0.026). Part of this may be explained by the difference in flow. At the Spalding gage station, the average flow pre-flood (2006–2010) and post-flood (2010–2016) were both 5.5 m3 s−1, although the standard deviation and maximum flow were higher in the pre-flood period (2.97 m3 s−1 and 40.9 m3 s−1) than the post-flood period (2.11 m3 s−1 and 26.0 m3 s−1).
3.4. Deposition
The average deposition for the stabilized streambanks and control sites for the pre-stabilization period was 0.15 m2 m−1 year−1 and 0.14 m2 m−1 year−1, respectively. During the post-stabilization period, the average deposition was 0.24 m2 m−1 year−1 and 0.09 m2 m−1 year−1 for the stabilized streambanks and control sites, respectively. Based on a Mann–Whitney test, the medians (0.14 m2 m−1 year−1 and 0.05 m2 m−1 year−1) were not significantly different, with a p-value of 0.07. For post-stabilization, the deposition for the jetties was significantly different (a p-value of 0.007) with a median deposition of 0.19 m2 m−1 year−1 and 0.03 m2 m−1 year−1 for the stabilized and control sites, respectively. This is not surprising since a function of jetties is to increase the sediment deposition upstream of each jetty.
The control site for jetties had less accumulation (0.51 m2 m−1 year−1) than the stabilized banks (0.99 m2 m−1 year−1) during the flood, which shows a very efficient sediment capture. However, it is believed that excessive sediment deposition causes failure of some structures because it leads to a loss of channel capacity and subsequent change in the stable dimension, pattern and profile of the river [7].
Not surprisingly, during the flood, the high deposition rates were upstream of the breached dam and downstream of Lake Spalding. Between Lake Ericson and Lake Spalding, there was very little deposition. The average deposition at Sites 3 to 6 downstream of Lake Ericson was 0.23 m2 m−1 year−1 and 0.34 m2 m−1 year−1 for the stabilized and control sites, respectively. Downstream of Lake Spalding, the deposition was much higher, 0.83 m2 m−1 year−1 and 1.23 m2 m−1 year−1 for the stabilized and control sites, respectively.
3.5. Cost-Effectiveness
Although a limitation of the cost-efficiency analysis is the number of sites for some of the practices, the analysis still provides insight into the efficiency of the various practices. Though the exact installation cost per site is unknown, the approximate cost per meter of installation are as follows: jetties: $26; cedar tree revetments: $72; rock vanes: $205; rock toe: $179; retaining wall: $625; and gravel bank: $600 (Table 3). Cost efficiency is calculated as the reduction in streambank erosion per dollar spent; hence, the larger reduction per dollar spent, the higher the efficiency. To calculate the efficiency, we compared the streambank erosion rate for the post-stabilization period from 1999/2003 to 2009 and 1999/2003 to 2016 for jetties, rock vanes, tree revetments, rock toe, and the retaining wall/gravel bank to the control sites using the following equation:
where CS is the average streambank erosion at the control sites, and SB is the average streambank erosion at the stabilized streambanks.
cost effectiveness = ([(CS − SB)/CS] × 100)/cost of installation
This comparison assumes that the streambank erosion rate would have been the same at the study sites as the control sites if the streambanks were not stabilized. The number of sites stabilized by each practice is not the same, and some practices, like rock vanes, have very few sites. Hence, to overcome the limitations of our data set, calculations were conducted using the average reduction in erosion per meter per dollar spent. The calculations showed jetties to be the most cost-efficient technique, with reductions of 2.99% and 2.86% per dollar spent per meter for the periods of 1999/2003 to 2009 and 1999/2003 to 2016, respectively. Other than the two expensive stabilization practices, rock vanes were the least cost-efficient, with reductions of 0.23% and 0.32% for the two periods. Rock toe and tree revetments were similar in cost-efficiency, averaging 0.50% (tree revetments) and 0.55% (rock toe) for the two periods. Reductions per dollar spent for the retaining wall/gravel bank were 0.16% and 0.17% for the two periods. With the retaining wall/gravel bank costing around $600 per meter of stabilized streambank, one needs to ask if the cost is justified. The jetties, at a cost of only $26 per foot, reduced the streambank erosion rates significantly compared with the control sites, though 3 of the 10 failed. Based on these results, jetties are successful at stabilizing the streambank at minimal cost, though at some risk, and thus should be installed if some risk can be taken. If it is imperative that the streambank not fail (to protect infrastructure, for example), a retaining wall or gravel bank should be used since their likeliness to fail is minimal.
4. Conclusions
Streambank erosion has increased due to land use change and urbanization. Multiple practices are used to stabilize streambanks, but there is a need to find the most efficient. In 1950 and from 2000 to 2004, 18 streambanks were stabilized on the Cedar River using six techniques: jetties (10), rock-toe protection (1), slope reduction/gravel bank (1), retaining wall (1), rock vanes (2) and tree revetment (3). Using historical aerial images, we documented the streambank erosion and deposition for 18 stabilized streambanks and 40 control points for four periods of time: pre-stabilization, post-stabilization, flood, and post-flood. We found that stabilized banks were more efficient than similar control sites at controlling erosion. Comparing the six erosion-control practices to one another allowed us to identify which was the most efficient and cost-effective. We found that the structurally designed stabilization practices, such as the retaining wall and gravel bank, demonstrated immovability even during the flood in 2010 but required a large investment ($600 per meter). Other practices such as jetties, rock toe, and tree revetments require negligible capital investments but have higher rates of failure. We also found that rock vanes were the least effective, failing during the flood. Although rock vanes were the least effective, our study had a small sample size (two) with which to compare. As mentioned previously, the limitation of this study was the small number of sites for several of the stabilization practices.
For this project, 3 out of 10 sites stabilized with jetties failed during the flood; however, that equates to a 70% success rate at a minimal cost ($26 per meter). In terms of cost efficiency, jetties should be preferred since their cost is much lower, materials are easily available, and they are most efficient at capturing sediment. In conclusion, jetties were the most cost-efficient technique on the Cedar River and should be used if minimal failure of risk is acceptable. The jetty installed in 1950 demonstrates that jetties can endure and be successful for extended periods of time. Our study indicated that structurally designed practices such as retaining walls might be worth the investment only if failure cannot be risked. Because of the ease of installation, affordability, and stability, agricultural producers and others may prefer using jetties.
Acknowledgments
The authors acknowledge Janet Evans of the Lower Loup RC&D and Ed Hovet, construction engineer on the Cedar River.
Author Contributions
Data was collected and analyzed by Naisargi Dave under the supervision of Aaron R. Mittelstet. Both authors contributed to the writing and editing of the manuscript.
Conflicts of Interest
The authors declare no conflict of interest.
References
- U.S. Environmental Protection Agency. National Summary of Impaired Waters and TMDL Information. Available online: https://iaspub.epa.gov/waters10/attains_nation_cy.control?p_report_type=T (accessed on 9 May 2017).
- Florsheim, J.L.; Mount, J.F.; Chin, A. Bank erosion as a desirable attribute of rivers. AIBS Bull. 2008, 58, 519–529. [Google Scholar] [CrossRef]
- Wilson, C.; Kuhnle, R.; Bosch, D.; Steiner, J.; Starks, P.; Tomer, M.; Wilson, G. Quantifying relative contributions from sediment sources in conservation effects assessment project watersheds. J. Soil Water Conserv. 2008, 63, 523–532. [Google Scholar] [CrossRef]
- Mittelstet, A.R. Quantifying Phosphorus Loads and Streambank Erosion in the Ozark Highland Ecoregion Using the SWAT Model. Ph.D. Thesis, Oklahoma State University, Stillwater, Oklahoma, 2015. [Google Scholar]
- Pfluger, Y.; Rackham, A.; Larned, S. The aesthetic value of river flows: An assessment of flow preferences for large and small rivers. Lands. Urban Plan. 2010, 95, 68–78. [Google Scholar] [CrossRef]
- Dearmont, D.; McCarl, B.A.; Tolman, D.A. Costs of water quality treatment due to diminished water quality: A case study in Texas. Water Resour. Res. 1998, 34, 849–853. [Google Scholar] [CrossRef]
- Neupane, S.; Vogel, J.R.; Storm, D.E.; Barfield, B.J.; Mittelstet, A.R. Development of a turbidity prediction methodolgoy for runoff-erosion models. Water Air Soil Pollut. 2015, 226, 415. [Google Scholar] [CrossRef]
- Lloyd, D.S. Turbidity as a water quality standard for salmonidhabitats in Alaska. N. Am. J. Fish Manag. 1987, 7, 34–45. [Google Scholar] [CrossRef]
- Elmore, W.; Beschta, R.L. The fallacy of Structures and the Fortitude Of Vegetation. In Proceedings of the California Riparian Systems Conference, Davis, CA, USA, 22–24 September 1988. [Google Scholar]
- Enlow, H.K.; Fox, G.A.; Boyer, T.A.; Stoecker, A.; Storm, D.E.; Starks, P.; Guertault, L. A Modeling Framework for Evaluating Streambank Stabilization Practices for Reach-Scale Sediment Reduction. In Proceedings of the 2017 ASABE Annual International Meeting, Spokane, DC, USA, 16–19 July 2017; American Society of Agricultural and Biological Engineers: St. Joseph, MI, USA, 2017. [Google Scholar]
- Gilvear, D.J. Fluvial geomorphology and river engineering: Future roles utilizing a fluvial hydrosystems framework. Geomorphology 1999, 31, 229–245. [Google Scholar] [CrossRef]
- Rosgen, D.L. The Cross-Vane, W-Weir and J-Hook Vane Structures… Their Description, Design and Application for Stream Stabilization and River Restoration. In Proceedings of the Wetlands Engineering & River Restoration 2001, Reno, Nevada, 27–31 August 2001; pp. 1–22. [Google Scholar]
- Buchanan, B.; Walter, M.; Nagle, G.; Schneider, R. Monitoring and assessment of a river restoration project in central New York. River Res. Appl. 2012, 28, 216–233. [Google Scholar] [CrossRef]
- Lavendel, B. The business of ecological restoration. Ecol. Res. 2002, 20, 173–178. [Google Scholar] [CrossRef]
- Bernhardt, E.S.; Palmer, M.A.; Allan, J.D.; Alexander, G.; Barnas, K.; Brooks, S.; Carr, J.; Clayton, S.; Dahm, C.; Follstad-Shah, J.; et al. Synthesizing U.S. river restoration efforts. Science 2005, 308, 636–637. [Google Scholar] [CrossRef] [PubMed]
- Kondolf, G.M.; Anderson, S.; Lave, R.; Pagano, L.; Merenlender, A.; Bernhardt, E. Two decades of river restoration in california: What can we learn? Restor. Ecol. 2007, 15, 516–523. [Google Scholar] [CrossRef]
- Schiff, R.; Benoit, G.; MacBroom, J. Evaluating stream restoration: A case study from two partially developed 4th order connecticut, USA streams and evaluation monitoring strategies. River Res. Appl. 2011, 27, 431–460. [Google Scholar] [CrossRef]
- Daly, E.R.; Miller, R.B.; Fox, G.A. Modeling streambank erosion and failure along protected and unprotected composite streambanks. Adv. Water Resour. 2015, 81, 114–127. [Google Scholar] [CrossRef]
- Simon, A.; Pollen-Bankhead, N.; Thomas, R.E. Development and application of a deterministic bank stability and toe erosion model for stream restoration. Stream Restor. Dyn. Fluv. Syst. 2011, 453–474. [Google Scholar] [CrossRef]
- Pracheil, C.M. Ecological Impacts of Stream Bank Stabilization in a Great Plains River. Ph.D. Thesis, University of Nebraska, Lincoln, NE, USA, 2010. [Google Scholar]
- Resources, N.D.o.N. Nebraska Interactive Streamgage Map. Available online: http://nednr.nebraska.gov/RealTime (accessed on 20 December 2016).
- Office, W.F. Ericson Dam Failure Floods the Cedar River. Available online: https://www.weather.gov/gid/53617 (accessed on 13 June 2010).
- Loup Basin Rc & D. Cedar River Stabilization Project. Available online: http://loupbasinrcd.org/projects/cedar-river-stabilizaton-project/ (accessed on 13 June 2017).
- Topcon Position Systems, Inc. Hiper V Dual-Frequency GNSS Receiver. Available online: www.topcon.com (accessed on 25 August 2017).
- Kuehn, E. Stream Bank Erosion Trends and Sediment Contributions in a Southwestern Missouri River. Master’s Thesis, Missouri State University, Springfield, MO, USA, 2015. [Google Scholar]
- Mittelstet, A.R.; Storm, D.E.; Fox, G.A.; Allen, P.M. Modeling streambank erosion on composite streambanks on a watershed scale. Trans. ASABE 2017, 60, 753–767. [Google Scholar] [CrossRef]
- Heeren, D.M.; Mittelstet, A.R.; Fox, G.A.; Storm, D.E.; Al-Madhhachi, A.T.; Midgley, T.L.; Stringer, A.F.; Stunkel, K.B.; Tejral, R.D. Using rapid geomorphic assessments to assess streambank stability in Oklahoma Ozark streams. Trans. ASABE 2012, 55, 957–968. [Google Scholar] [CrossRef]
- Purvis, R.A.; Fox, G.A. Streambank sediment loading rates at the watershed scale and the benefit of riparian protection. Earth Surf. Process. Landf. 2016, 41, 1327–1336. [Google Scholar] [CrossRef]
- Minitab, Inc. Minitab 17 Statistical Software 2010; [Computer Software]. State College: Borough, PA, USA, 2010. Available online: http://www.minitab.com/en-us/ (accessed on 5 March 2017).
- Brown, K.B. Urban Stream Restoration Practices: An Initial Assessment; The Center: Hong Kong, China, 2000. [Google Scholar]
- Miller, J.R.; Kochel, R.C. Assessment of channel dynamics, in-stream structures and post-project channel adjustments in North Carolina and its implications to effective stream restoration. Environ. Earth Sci. 2010, 59, 1681–1692. [Google Scholar] [CrossRef]
- Dragićević, S.; Pripužić, M.; Živković, N.; Novković, I.; Kostadinov, S.; Langović, M.; Milojković, B.; Čvorović, Z. Spatial and temporal variability of bank erosion during the period 1930–2016: Case Study—Kolubara River Basin (Serbia). Water 2017, 9, 748. [Google Scholar] [CrossRef]
Figure 1.
Locations of the dams, gage stations, and stabilized streambanks on the Cedar River in North Central Nebraska.
Figure 1.
Locations of the dams, gage stations, and stabilized streambanks on the Cedar River in North Central Nebraska.
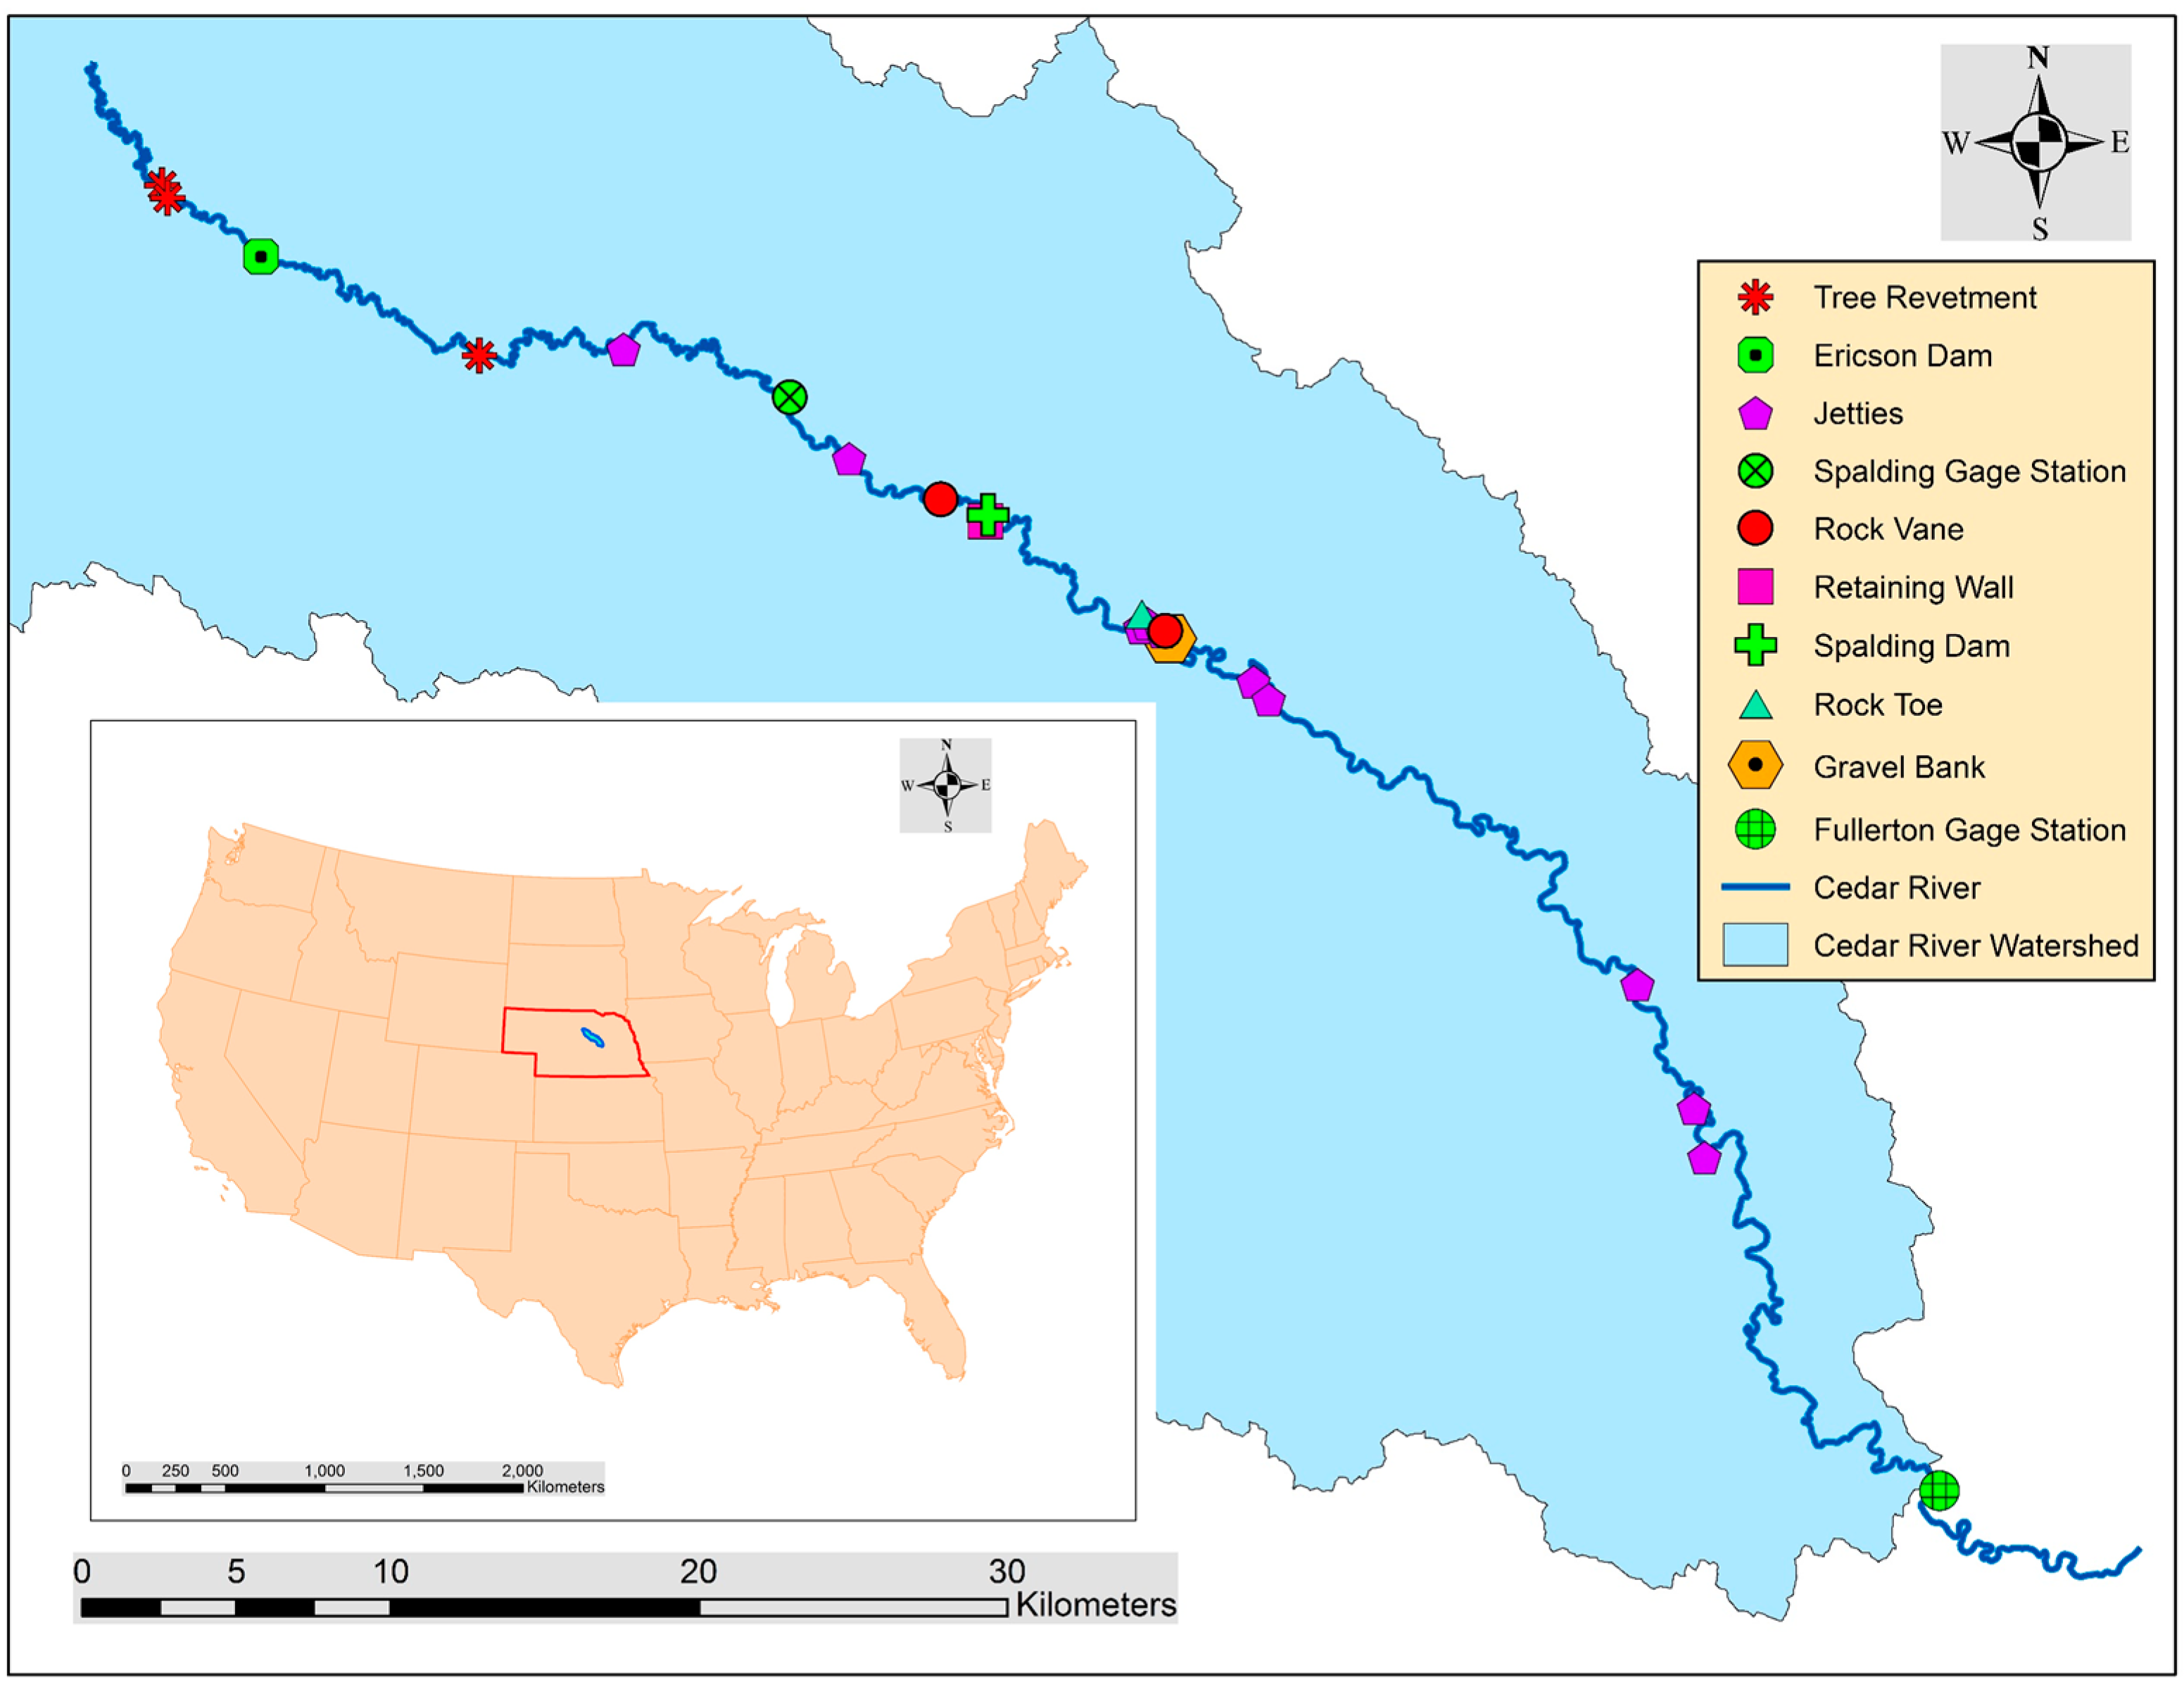
Figure 2.
Typical streambank on Cedar River. Note the transition from sandy soil at the top to silty loam in the bottom.
Figure 2.
Typical streambank on Cedar River. Note the transition from sandy soil at the top to silty loam in the bottom.

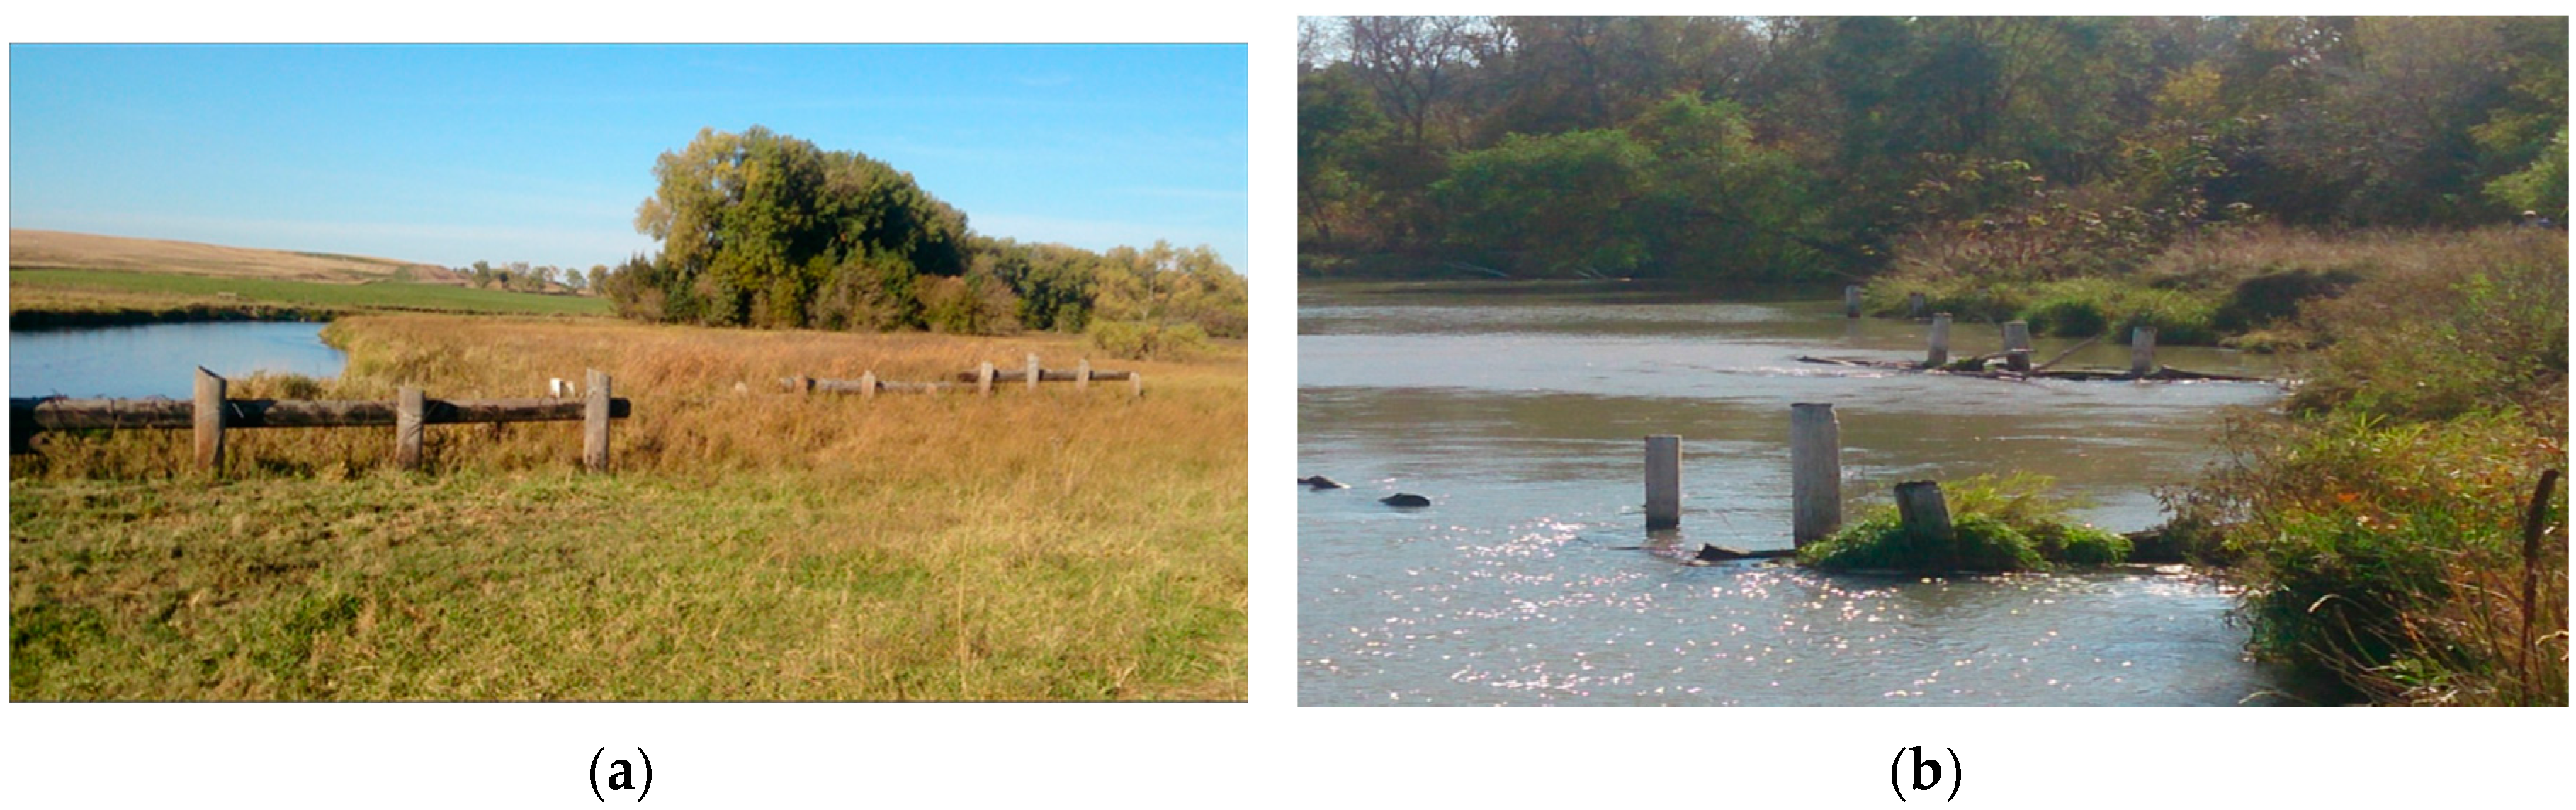
Figure 3.
Jetties installed in 1950 at Site 5 (a) and in 2000 at Site 4 (b). Note the sediment that has accumulated over time in front of the jetties installed in 1950.
Figure 3.
Jetties installed in 1950 at Site 5 (a) and in 2000 at Site 4 (b). Note the sediment that has accumulated over time in front of the jetties installed in 1950.

Figure 4.
Site 11 in 2016. This site had two jetties that failed (insert). The flow direction is from left to right. The streambank retreat was measured by drawing a polyline where the streambank was for each aerial image. The area between the polylines was then calculated for each period.
Figure 4.
Site 11 in 2016. This site had two jetties that failed (insert). The flow direction is from left to right. The streambank retreat was measured by drawing a polyline where the streambank was for each aerial image. The area between the polylines was then calculated for each period.
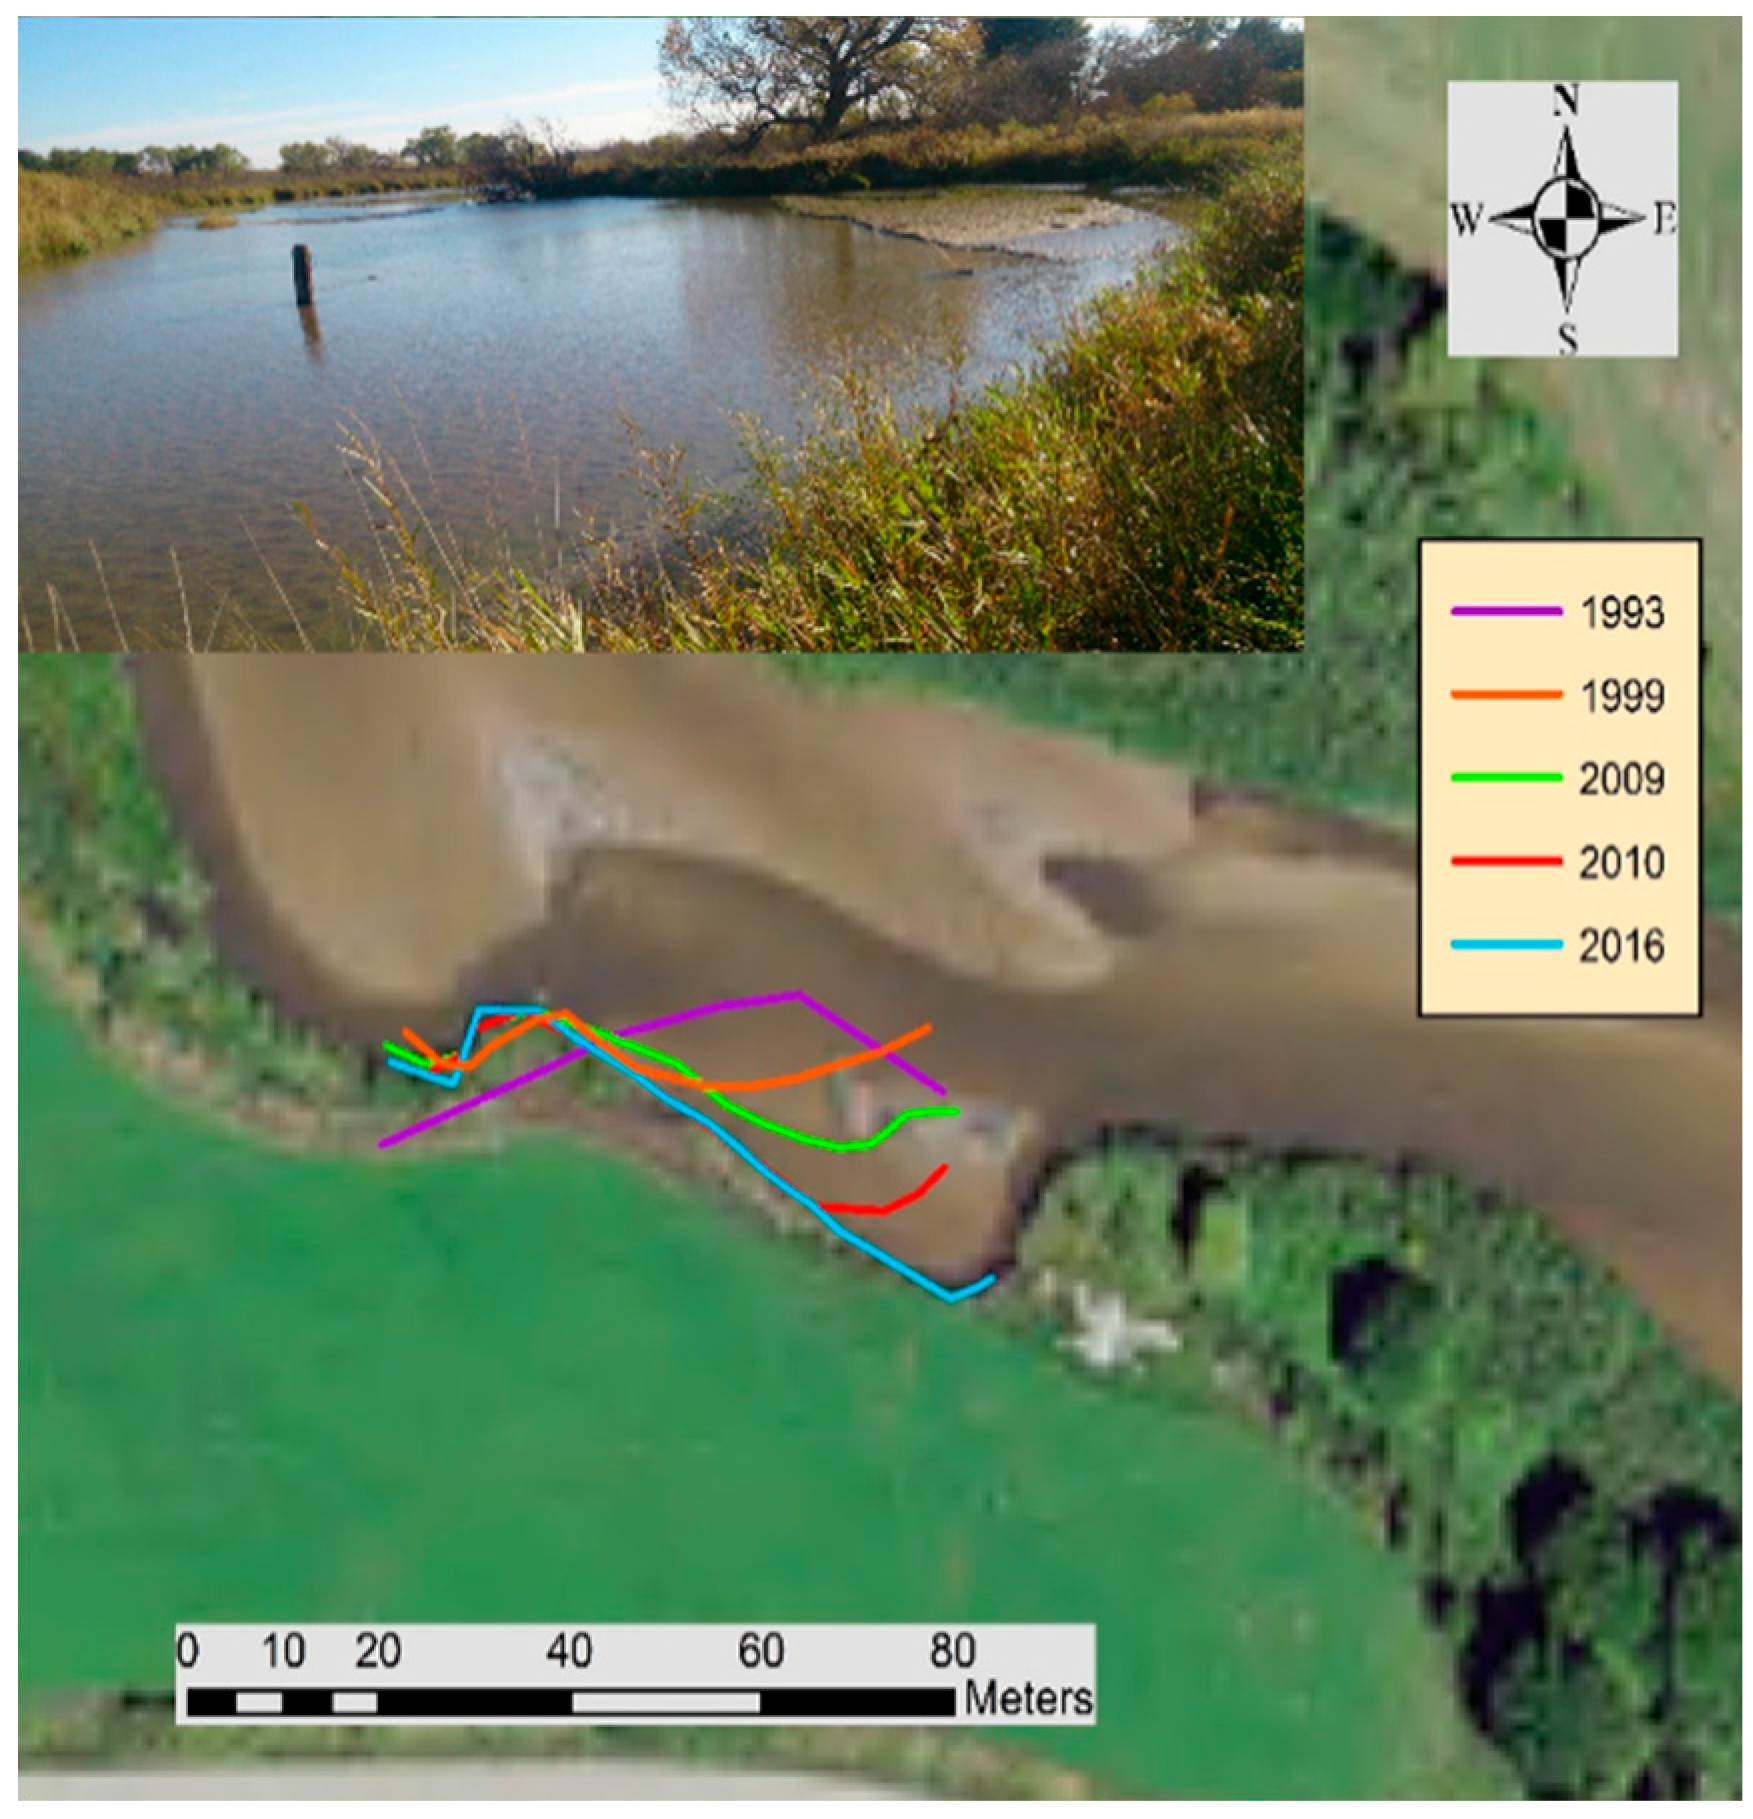
Figure 5.
The left image (a) shows the radius of curvature of the stabilized bank (Site 4) in 2016; the right image (b) shows the radius of curvature of one of the three control sites for Site 4 (The radius was 64 m in 1993). Note that both sites have cropland on the outer bank and dense trees on the inside bank. The flow direction is from left to right.
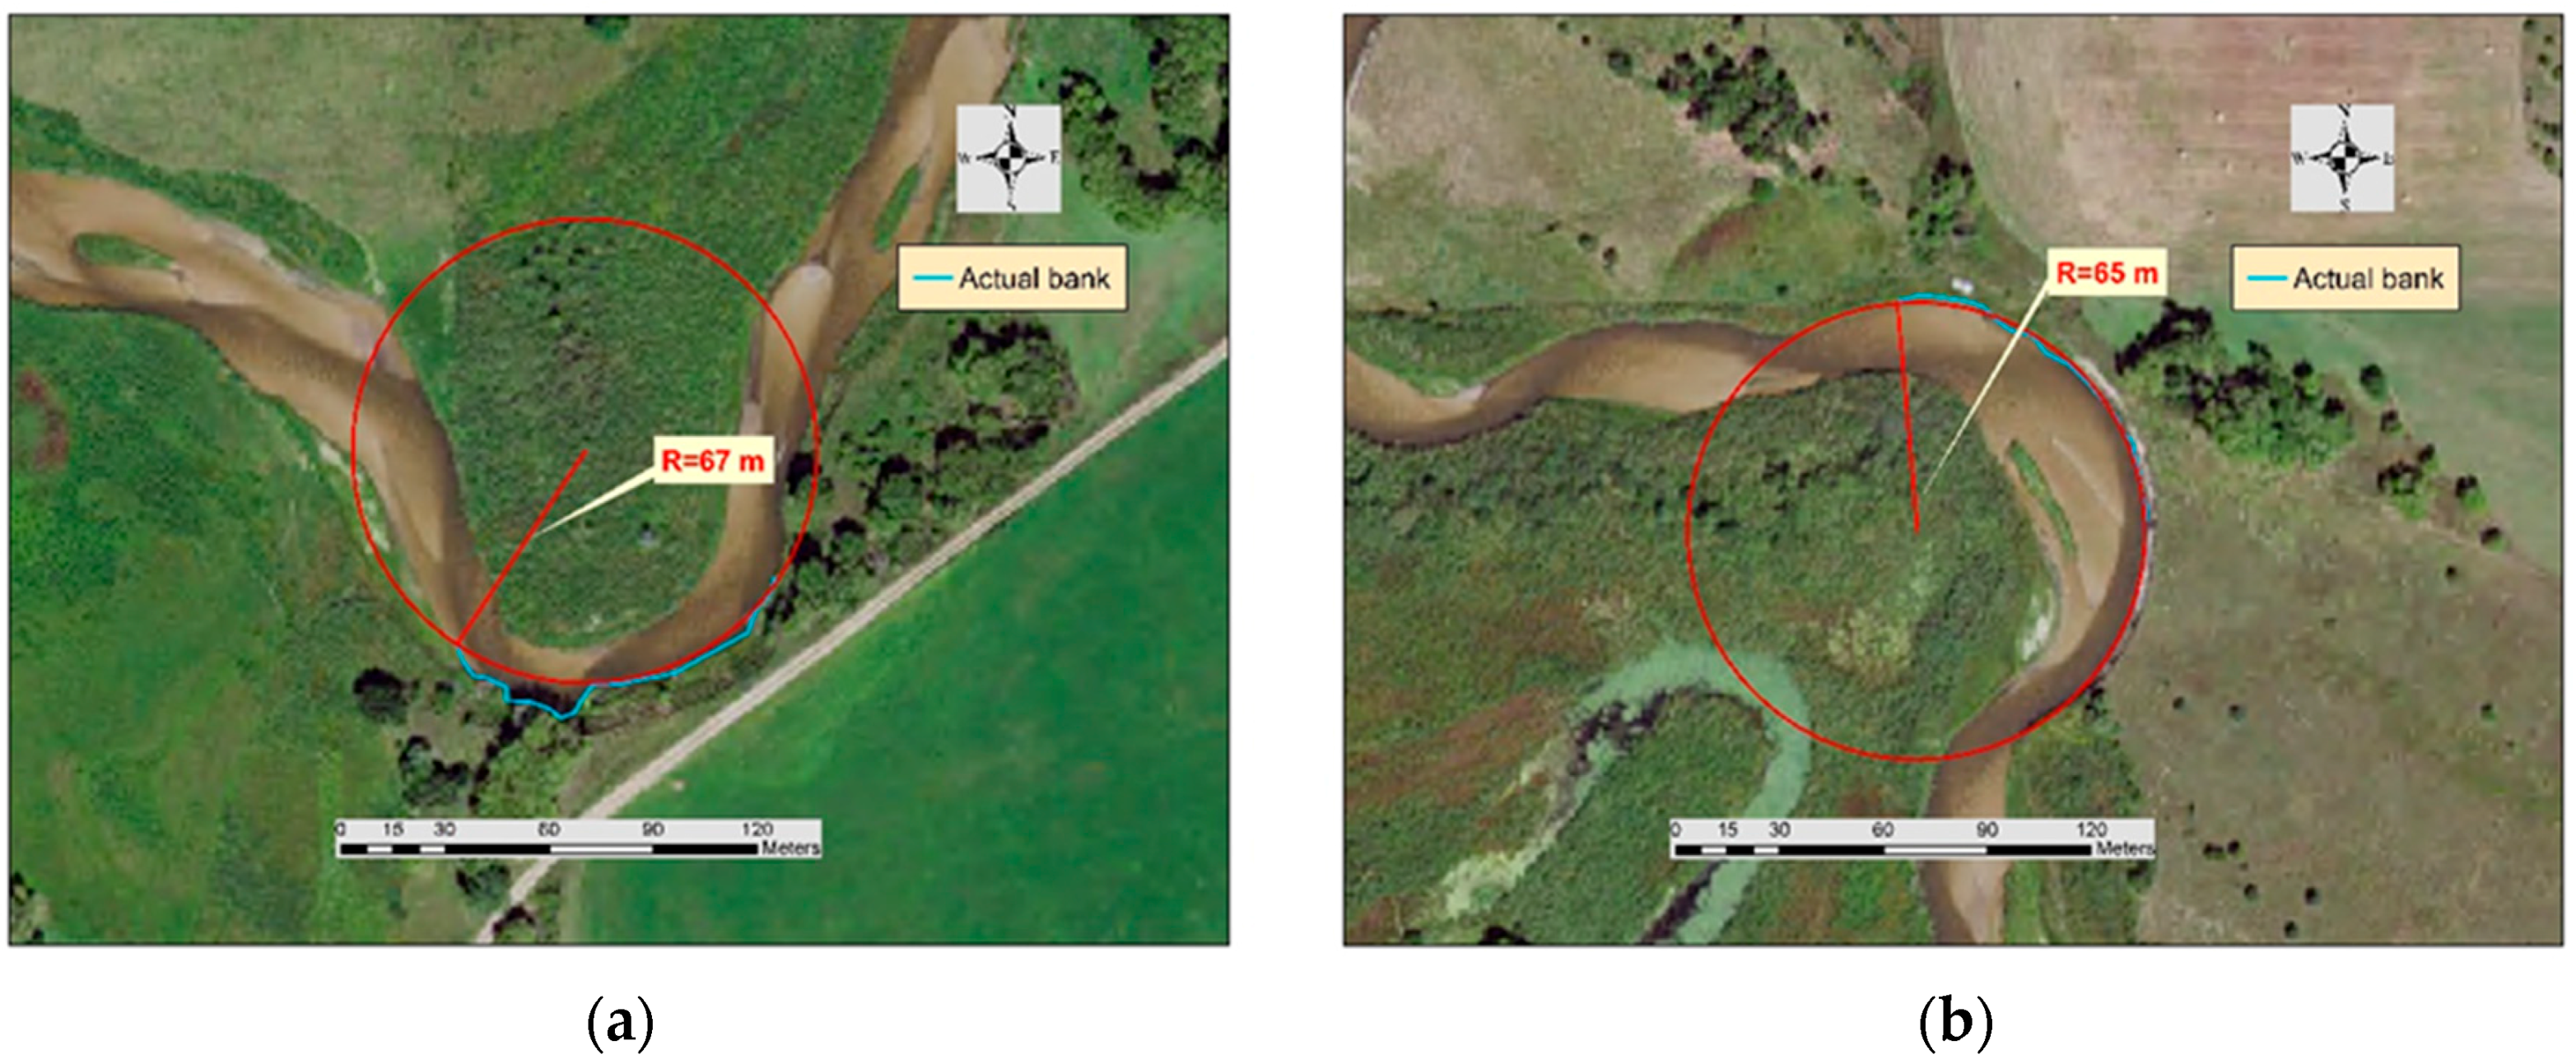
Figure 6.
Boxplots illustrating the streambank erosion rates for the pre-stabilization (a) and post-stabilization (b) periods for the stabilized streambanks and control sites. Red lines indicate the mean erosion rates.
Figure 6.
Boxplots illustrating the streambank erosion rates for the pre-stabilization (a) and post-stabilization (b) periods for the stabilized streambanks and control sites. Red lines indicate the mean erosion rates.

Figure 7.
Streambank erosion rate for the flood period (2009–2010) (a) and post-flood period (2010–2016) (b) for the stabilized streambanks and control sites.
Figure 7.
Streambank erosion rate for the flood period (2009–2010) (a) and post-flood period (2010–2016) (b) for the stabilized streambanks and control sites.

Table 1.
Detailed description of all sites.
| Site | Distance from Ericson Dam (km) | Technique (Number) | Length Stabilized (m) | Year Stabilized | Radius of Curvature (m) | Riparian Vegetation | Number of Control Sites |
|---|---|---|---|---|---|---|---|
| Upstream of Ericson Dam | |||||||
| 1 | 5.4 | Tree Revetment | 57 | 2004 | 68 | SG | 2 |
| 2 | 4.9 | Tree Revetment | 105 | 2004 | 77 | DG | 2 |
| Downstream of Ericson Dam | |||||||
| 3 | 12.5 | Tree Revetment | 88 | 2004 | 107 | DG | 2 |
| 4 | 22.5 | Jetties (4) | 106 | 2000 | 67 | C | 3 |
| 5 | 37.5 | Jetties (3) | 88 | 1950 | 87 | SG | 3 |
| 6 | 42.4 | Rock Vanes (4) | 98 | 2000 | 109 | SG | 2 |
| Downstream of Spalding Dam | |||||||
| 7 | 45.2 | Retaining Wall | 31 | 2004 | 154 | DG | 3 |
| 8 | 55.4 | Jetties (3) | 127 | 2004 | 151 | DG | 2 |
| 9 | 55.9 | Rock Toe | 118 | 2000 | 112 | DG | 2 |
| 10 | 56.3 | Jetties (4) | 251 | 2000 | 196 | C | 3 |
| 11 | 56.9 | Jetties (2) | 63 | 2000 | 52 | SG | 1 |
| 12 | 57.1 | Rock Vane | 16 | 2000 | 92 | SG | 3 |
| 13 | 57.4 | Gravel Bank | 34 | 2000 | 143 | SG | 3 |
| 14 | 63.0 | Jetties (3) | 122 | 2004 | 114 | SG | 2 |
| 15 | 65.5 | Jetties (4) | 552 | 2004 | 247 | SG | 2 |
| 16 | 89.1 | Jetties (3) | 54 | 2000 | 156 | C | 1 |
| 17 | 95.8 | Jetties (9) | 207 | 2000 | 183 | C | 2 |
| 18 | 98.7 | Jetties (8) | 419 | 2000 | 178 | C | 2 |
Note: The abbreviations for riparian vegetation are SG = Sparse Grassland; DG = Dense Grassland; C = Cropland.
Table 2.
Calculated streambank erosion rate for each site compared with the corresponding control site(s). Each control site value is an average of erosion of one to three identified control sites.
Table 2.
Calculated streambank erosion rate for each site compared with the corresponding control site(s). Each control site value is an average of erosion of one to three identified control sites.
| Site | Prestabilization | Poststabilization | Flood | Post-Flood | ||||
|---|---|---|---|---|---|---|---|---|
| Stabilized Banks | Control Site | Stabilized Banks | Control Site | Stabilized Bank | Control Site | Stabilized Bank | Control Site | |
| 1 | 0.06 | 0.62 | 0.24 | 0.66 | 0.24 | 0.17 | 0.18 | 0.05 |
| 2 | 0.02 | 0.04 | 0.1 | 0.32 | 0.66 | 1.03 | 0 | 0.04 |
| 3 | 0.63 | 0.35 | 0.39 | 0.31 | 0.49 | 1.02 | 0.21 | 0.15 |
| 4 | 0.27 | 0.65 | 0.06 | 0.31 | 2.66 | 2.09 | 0.01 | 0.61 |
| 5 | 0 | 0.39 | 0.04 | 0.33 | 0.29 | 0.96 | 0 | 0.15 |
| 6 | 0 | 0.85 | 0.24 | 0.43 | 0.61 | 2.71 | 0 | 0.08 |
| 7 | 0.12 | 0.31 | 0 | 0.32 | 0 | 0.18 | 0 | 2.44 |
| 8 | 0.12 | 1.29 | 0.28 | 0.45 | 0 | 10.4 | 0 | 0.42 |
| 9 | 0.48 | 0.49 | 0 | 0.76 | 0.67 | 7.05 | 0 | 0.7 |
| 10 | 0.23 | 0.38 | 0.12 | 1.21 | 0.57 | 5.18 | 0.16 | 0.07 |
| 11 | 0.39 | 0.77 | 0.27 | 1.56 | 2.29 | 7.32 | 0.25 | 0 |
| 12 | 0 | 0.41 | 0.37 | 0.73 | 0 | 0.2 | 0 | 0.85 |
| 13 | 0.29 | 0.65 | 0 | 0.06 | 0 | 1.77 | 0 | 0.1 |
| 14 | 0.21 | 1.48 | 0.01 | 1.21 | 0.09 | 5.35 | 0.03 | 0.03 |
| 15 | 0.12 | 0.41 | 0.02 | 0.33 | 3.85 | 1.34 | 0.59 | 0.89 |
| 16 | 2.4 | 1.1 | 0.13 | 0.12 | 0 | 1.31 | 0 | 0.2 |
| 17 | 2.35 | 0.47 | 0.49 | 0.3 | 0.5 | 3.23 | 0 | 0.25 |
| 18 | 0.38 | 0.6 | 0.13 | 0.92 | 0.32 | 3.61 | 0.01 | 0.27 |
Table 3.
Percent reduction in streambank erosion rate and cost efficiency for each stabilization practice for the post-stabilization period (1999/2003–2009) and the period from 1999/2003–2016, which included the flood and post-flood periods.
Table 3.
Percent reduction in streambank erosion rate and cost efficiency for each stabilization practice for the post-stabilization period (1999/2003–2009) and the period from 1999/2003–2016, which included the flood and post-flood periods.
| Stabilization Practice | Average Cost Per Meter | (1999/2003–2009) | (1999/2003–2016) | ||
|---|---|---|---|---|---|
| % Reduction in Erosion Rate | Cost Efficiency (%) | % Reduction in Erosion Rate | Cost Efficiency (%) | ||
| Jetties | 26 | 76.9 | 2.99 | 73.7 | 2.86 |
| Tree Revetments | 72 | 43.5 | 0.61 | 28.8 | 0.40 |
| Rock Vane | 205 | 47.2 | 0.23 | 66.1 | 0.32 |
| Rock toe | 179 | 100 | 0.56 | 96.7 | 0.54 |
| Retaining Wall | 625 | 100 | 0.16 | 100 | 0.16 |
| Gravel Bank | 600 | 100 | 0.17 | 100 | 0.17 |
© 2017 by the authors. Licensee MDPI, Basel, Switzerland. This article is an open access article distributed under the terms and conditions of the Creative Commons Attribution (CC BY) license (http://creativecommons.org/licenses/by/4.0/).
Share and Cite
MDPI and ACS Style
Dave, N.; Mittelstet, A.R. Quantifying Effectiveness of Streambank Stabilization Practices on Cedar River, Nebraska. Water 2017, 9, 930. https://doi.org/10.3390/w9120930
AMA Style
Dave N, Mittelstet AR. Quantifying Effectiveness of Streambank Stabilization Practices on Cedar River, Nebraska. Water. 2017; 9(12):930. https://doi.org/10.3390/w9120930
Chicago/Turabian StyleDave, Naisargi, and Aaron R. Mittelstet. 2017. "Quantifying Effectiveness of Streambank Stabilization Practices on Cedar River, Nebraska" Water 9, no. 12: 930. https://doi.org/10.3390/w9120930
Note that from the first issue of 2016, this journal uses article numbers instead of page numbers. See further details here.