Simulation of Pan Evaporation and Application to Estimate the Evaporation of Juyan Lake, Northwest China under a Hyper-Arid Climate

 , ,
, ,
Abstract
:1. Introduction
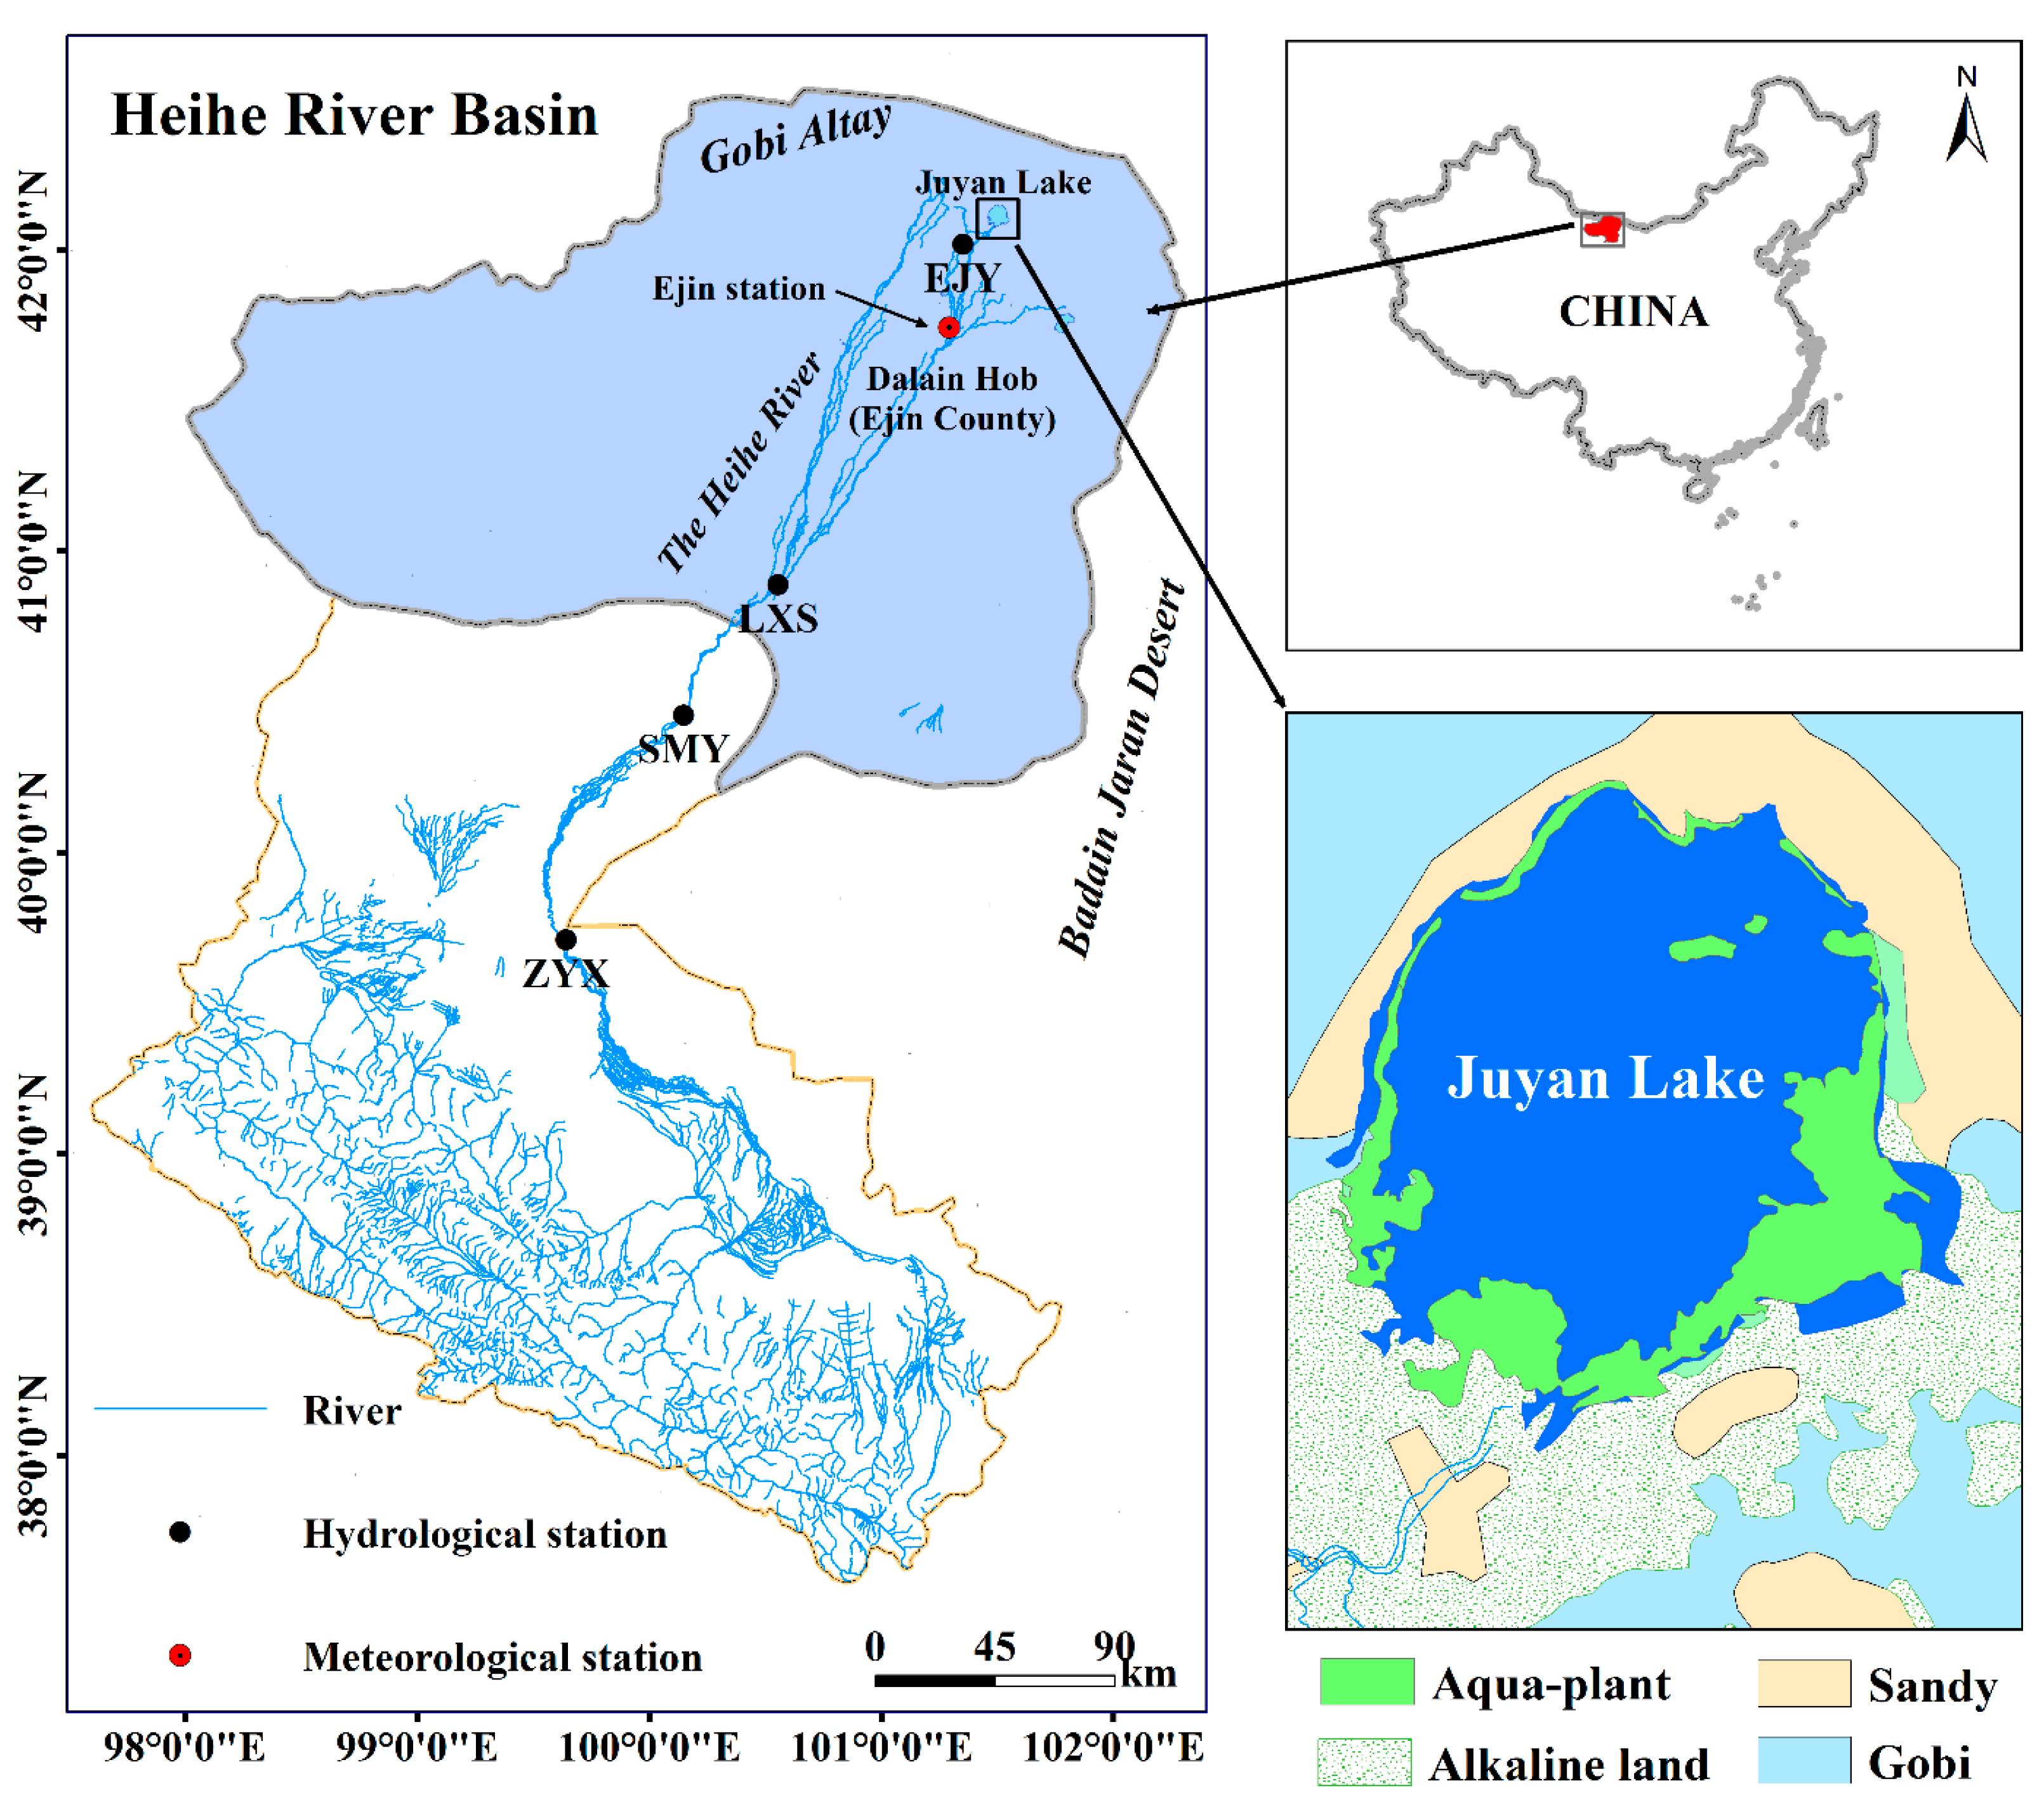
2. Study Area
3. Methods
3.1. Meteorological Data Collection
3.2. PenPan Model
3.3. FAO Penman–Monteith Model
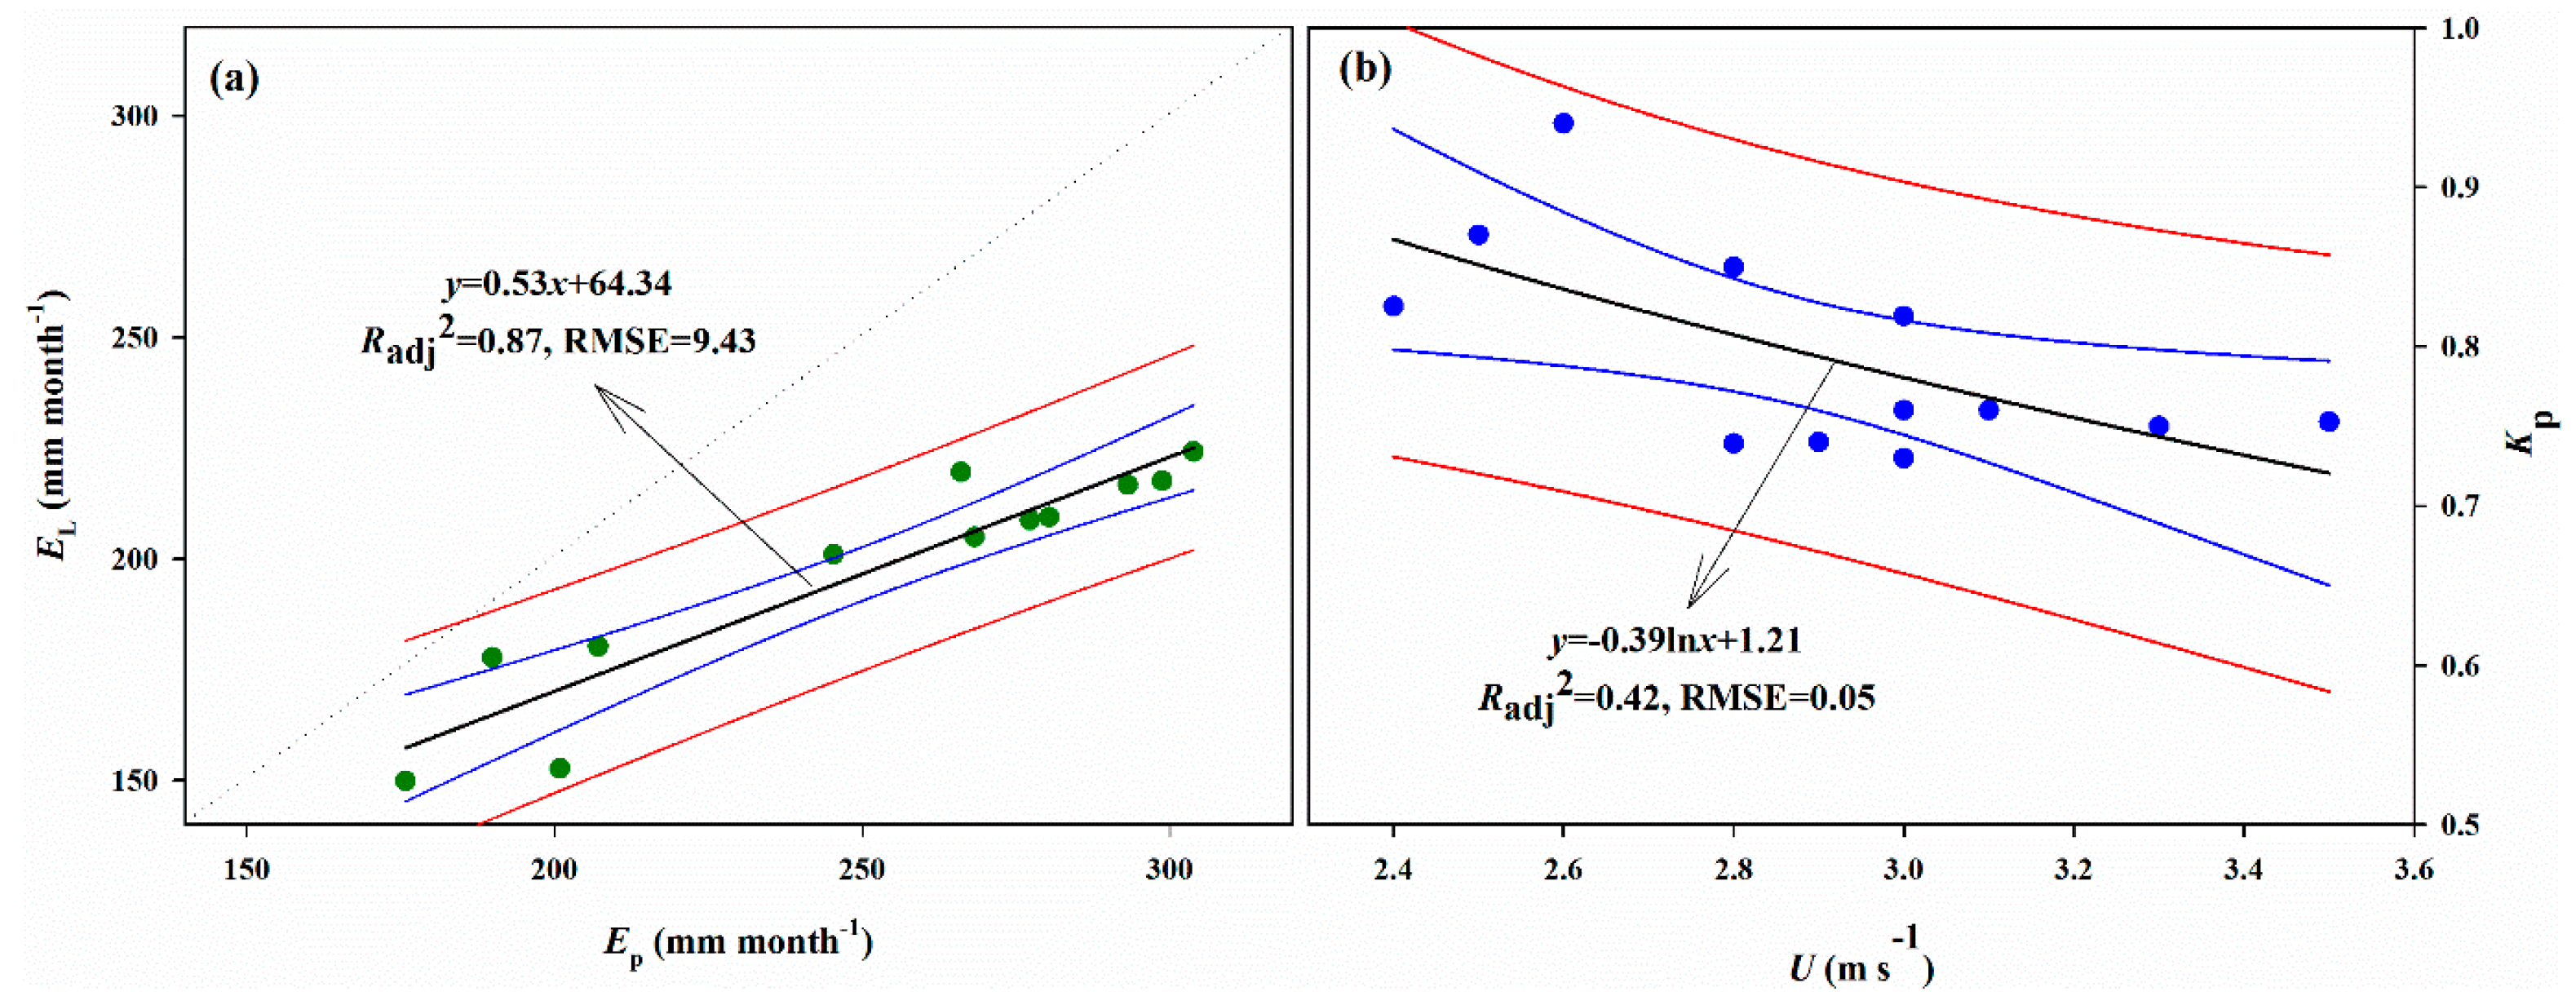
3.4. Pan Coefficient and Lake Evaporation
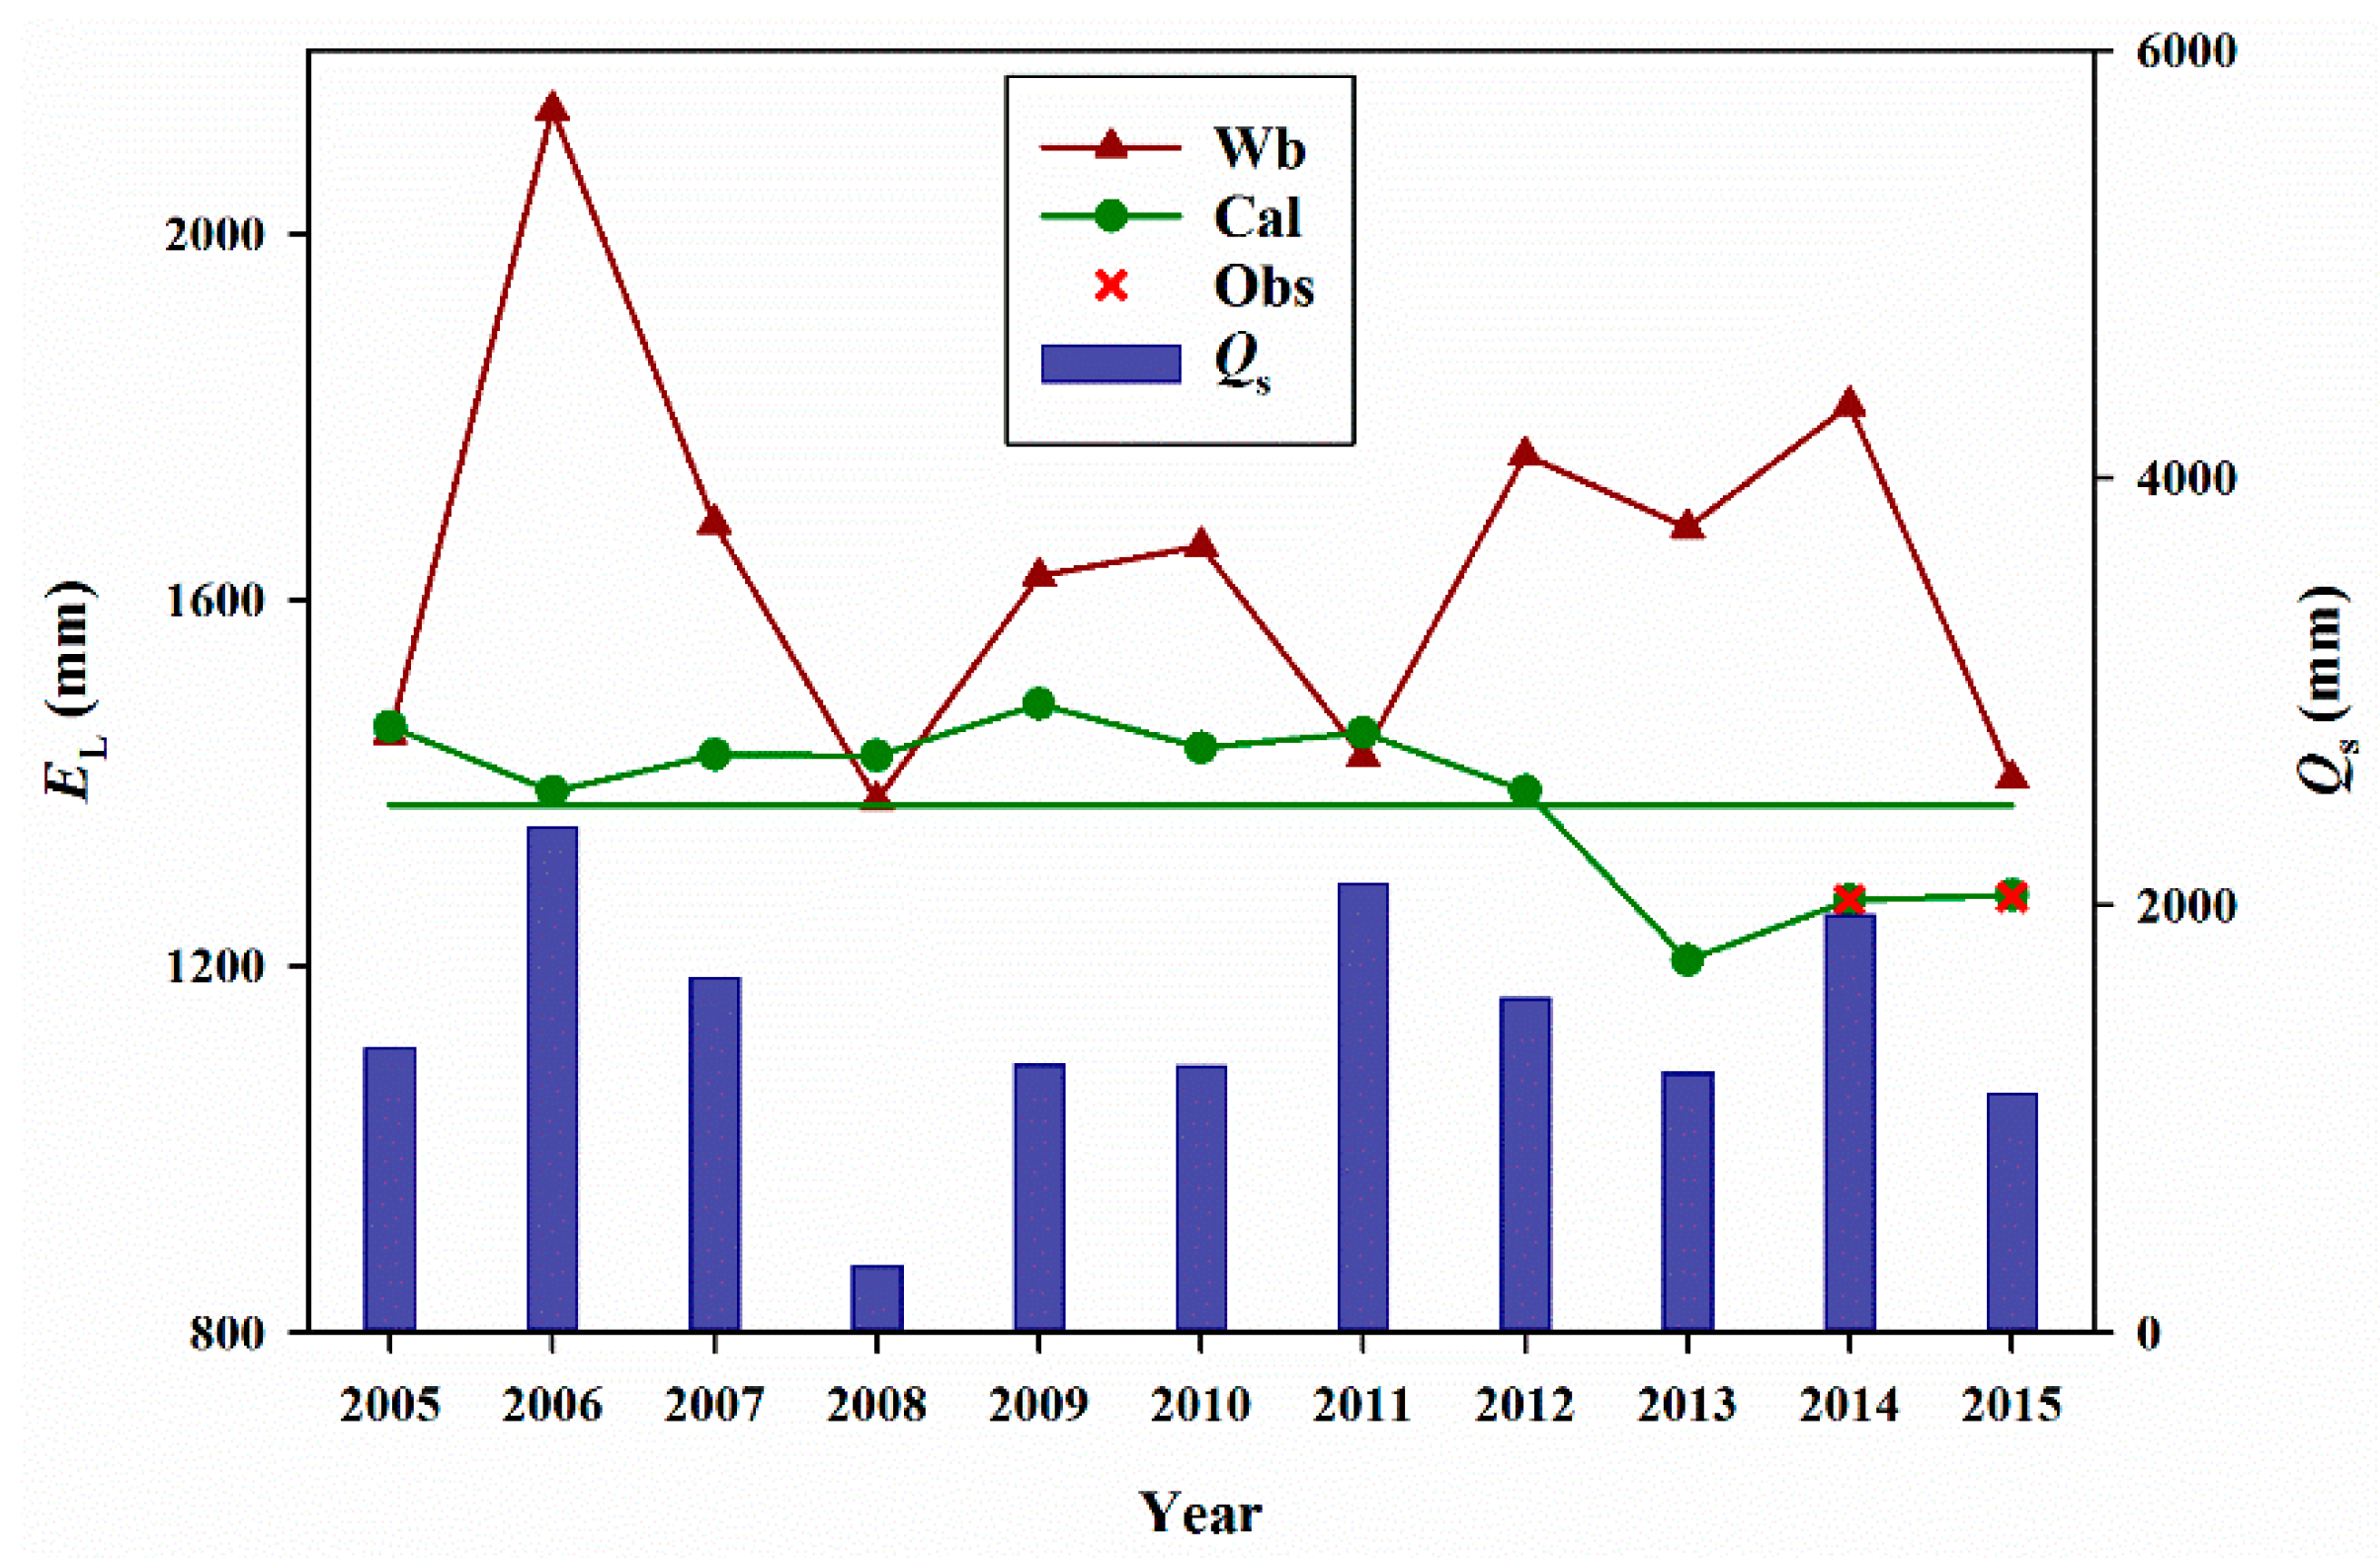
3.5. Water Budget of Lake
3.6. Assessments of Model Performance
4. Results
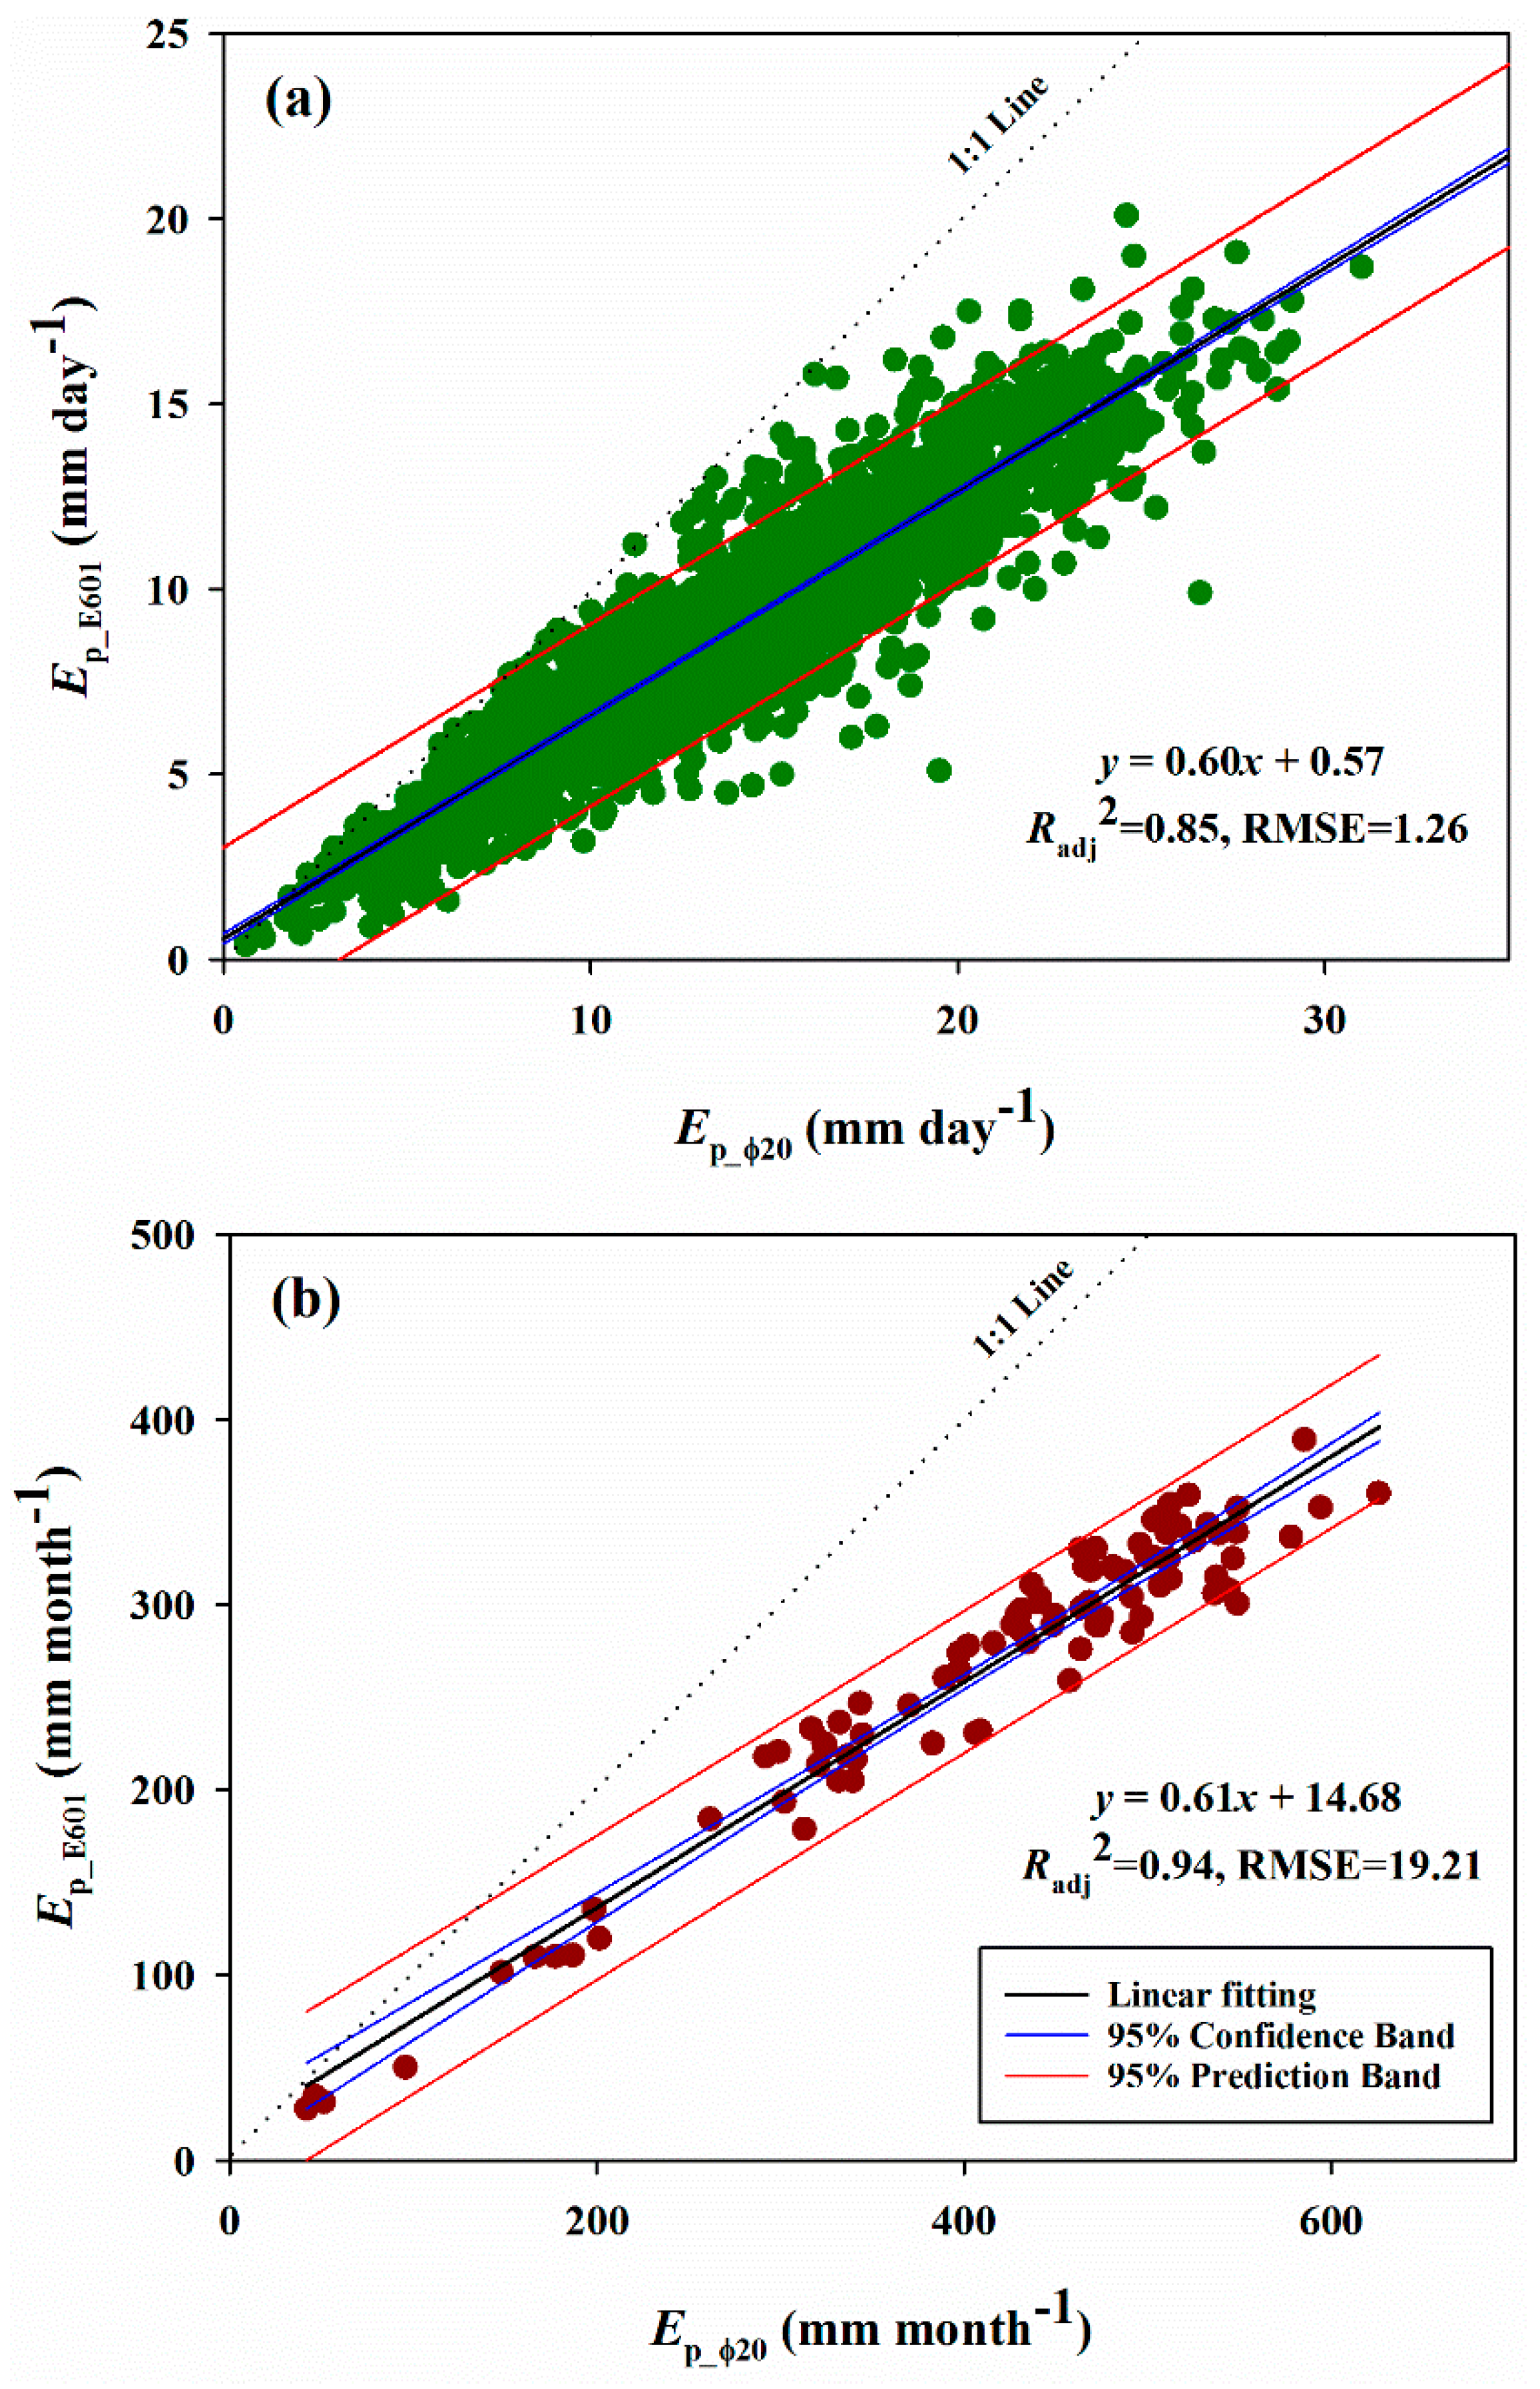
4.1. Pan Evaporation of Two Types of Evaporator
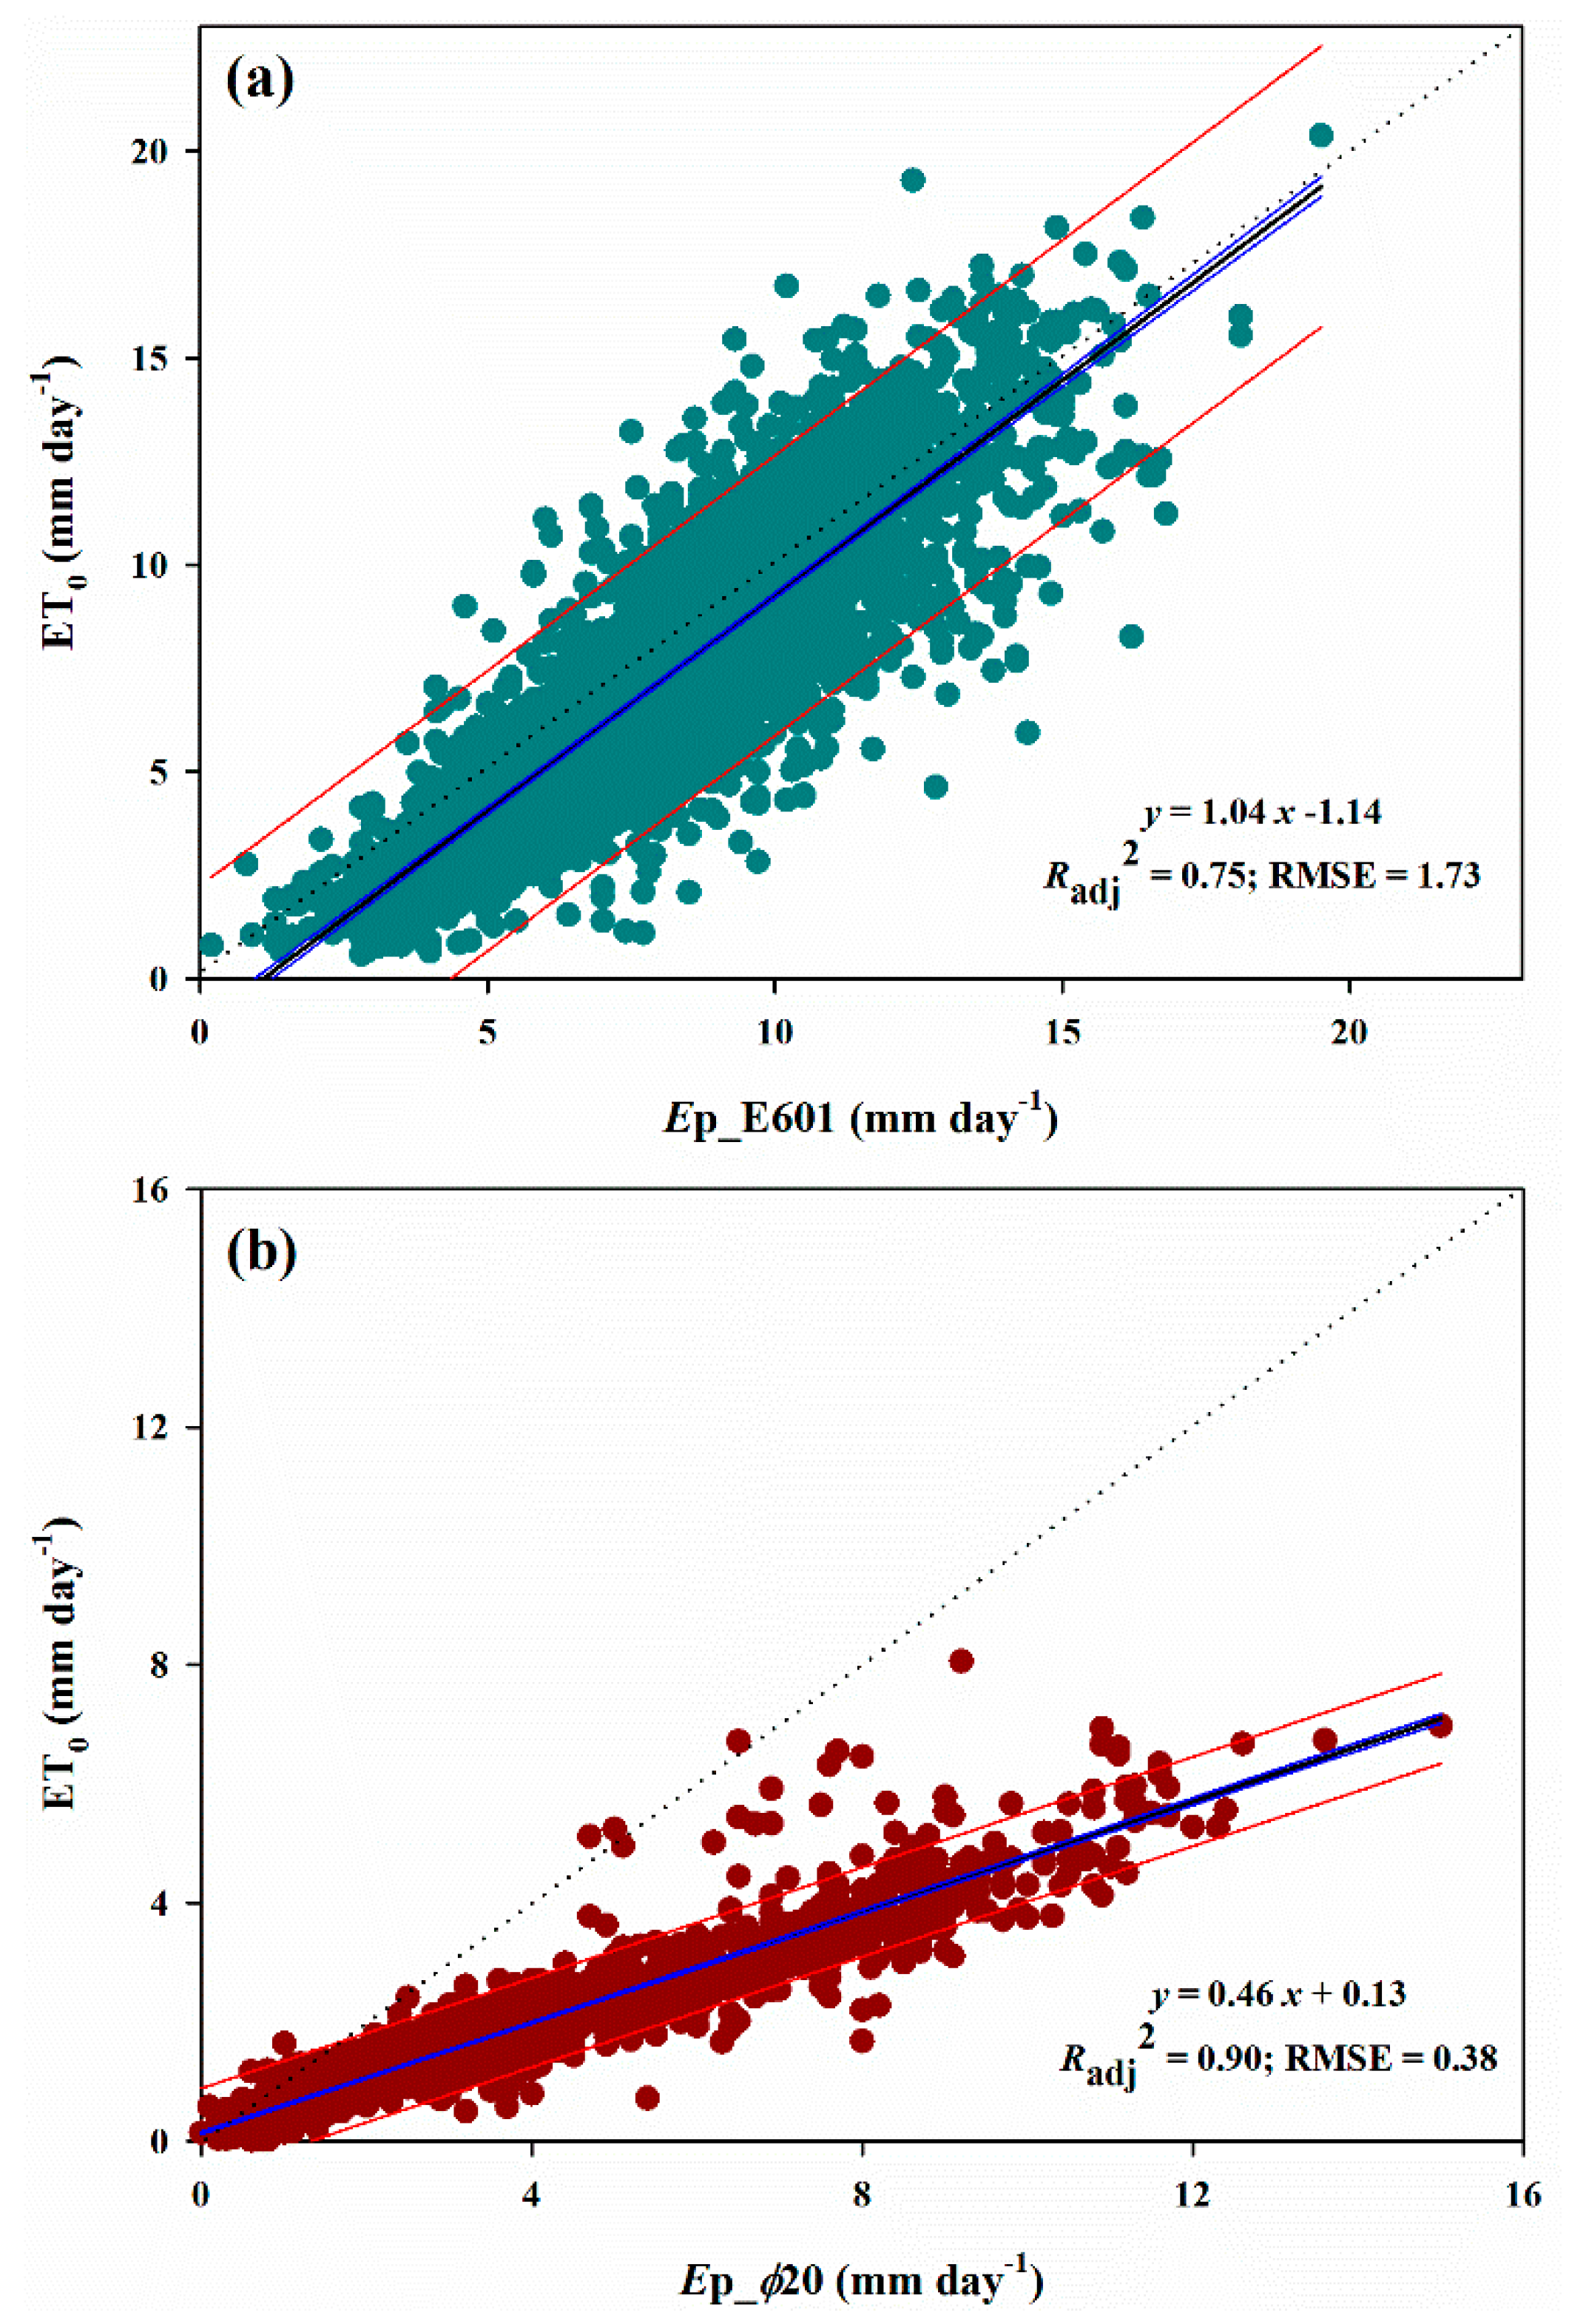
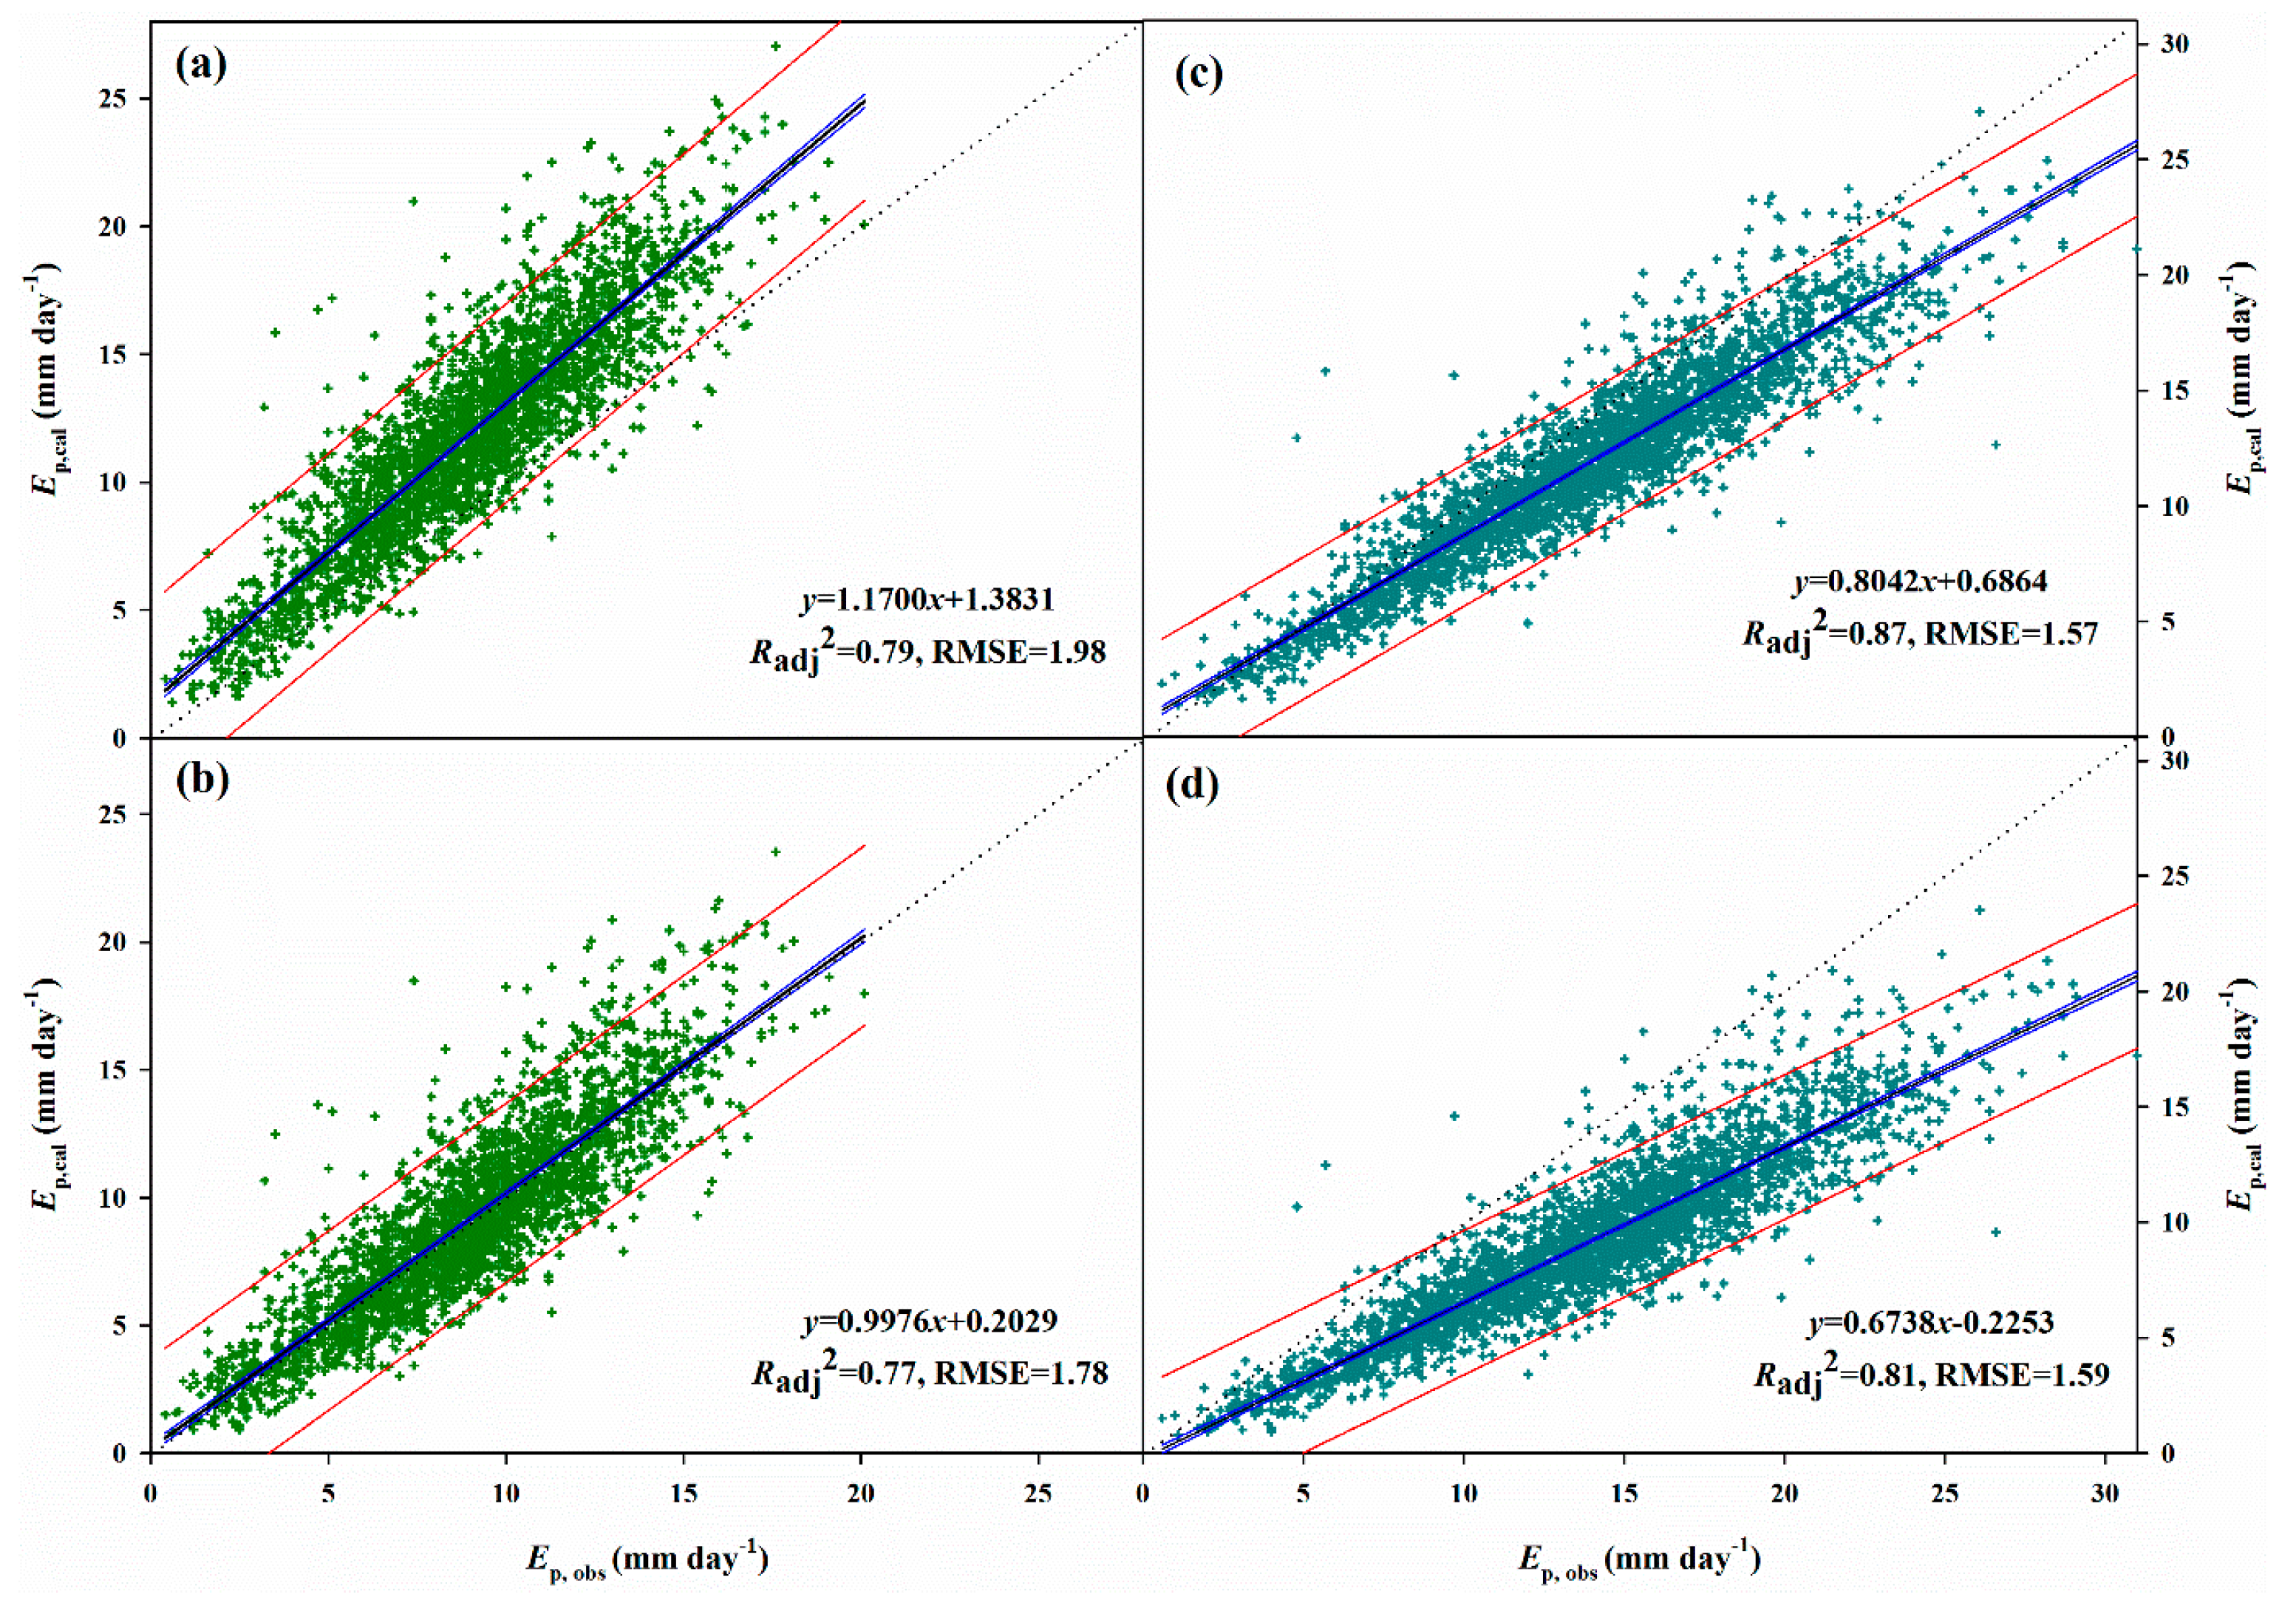
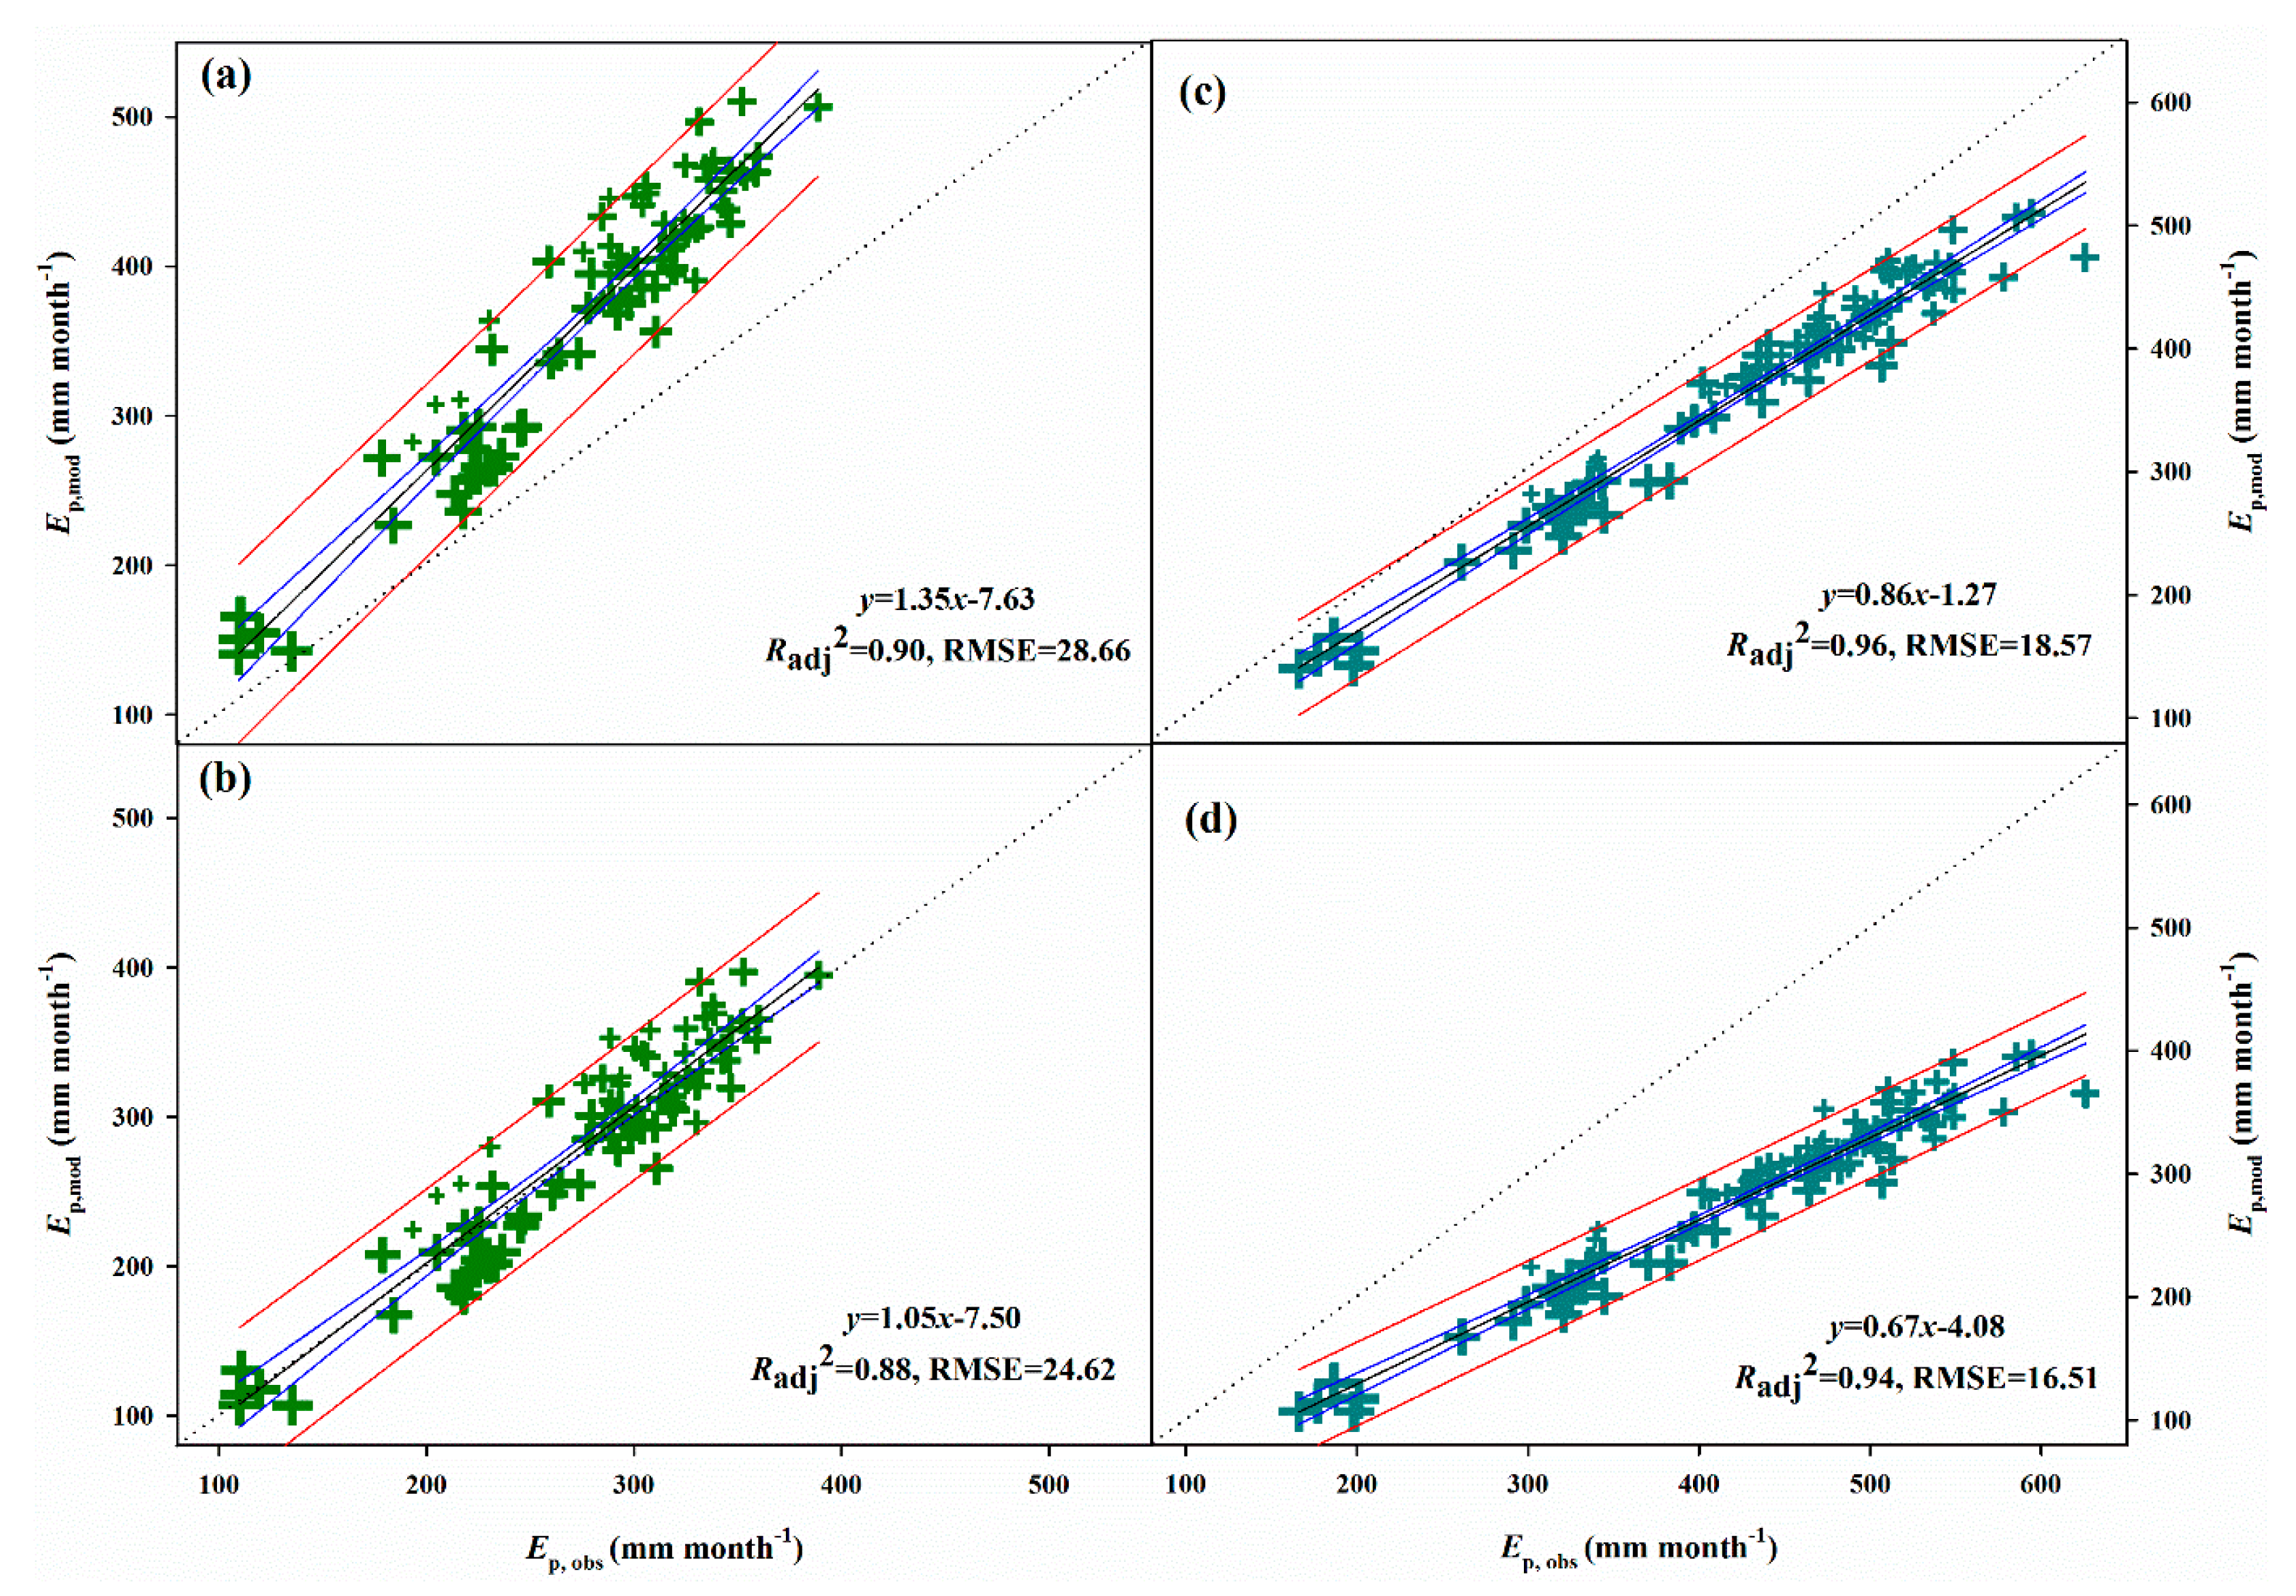
4.2. Pan Evaporation Calculated by the Two Models
4.3. Lake Water Budget and Evaporation
5. Discussion
5.1. Pan Evaporation
5.2. Lake Evaporation
6. Conclusions
Supplementary Materials
Acknowledgments
Author Contributions
Conflicts of Interest
References
- Adrian, R.; O’Reilly, C.M.; Zagarese, H.; Baines, S.B.; Hessen, D.O.; Keller, W.; Livingstone, D.M.; Sommaruga, R.; Straile, D.; Van Donk, E.; et al. Lakes as sentinels of climate change. Limnol. Oceanogr. 2009, 54, 2283–2297. [Google Scholar] [CrossRef] [PubMed] [Green Version]
- Ma, R.; Duan, H.; Hu, C.; Feng, X.; Li, A.; Ju, W.; Jiang, J.; Yang, G. A half-century of changes in China’s lakes: Global warming or human influence? Geophys. Res. Lett. 2010, 37, L24106. [Google Scholar] [CrossRef]
- Casadei, S.; Pierleoni, A.; Bellezza, M. Integrated Water Resources Management in a Lake System: A Case Study in Central Italy. Water 2016, 8. [Google Scholar] [CrossRef]
- Yang, X.K.; Lu, X.X. Drastic change in China’s lakes and reservoirs over the past decades. Sci. Rep. 2014, 4. [Google Scholar] [CrossRef] [PubMed]
- Chang, B.; He, K.N.; Li, R.J.; Sheng, Z.P.; Wang, H. Linkage of Climatic Factors and Human Activities with Water Level Fluctuations in Qinghai Lake in the Northeastern Tibetan Plateau, China. Water 2017, 9. [Google Scholar] [CrossRef]
- Wang, Y.-J.; Qin, D.-H. Influence of climate change and human activity on water resources in arid region of Northwest China: An overview. Adv. Clim. Chang. Res. 2017. [Google Scholar] [CrossRef]
- Guo, Q.L.; Feng, Q.; Li, J.L. Environmental changes after ecological water conveyance in the lower reaches of Heihe River, northwest China. Environ. Geol. 2009, 58. [Google Scholar] [CrossRef]
- Cheng, G.; Li, X.; Zhao, W.; Xu, Z.; Feng, Q.; Xiao, S.; Xiao, H. Integrated study of the water–ecosystem–economy in the Heihe River Basin. Natl. Sci. Rev. 2014, 1, 413–428. [Google Scholar] [CrossRef]
- Si, J.; Feng, Q.; Yu, T.; Zhao, C. Inland river terminal lake preservation: Determining basin scale and the ecological water requirement. Environ. Earth Sci. 2014, 73, 3327–3334. [Google Scholar] [CrossRef]
- Liu, X.; Yu, J.; Wang, P.; Zhang, Y.; Du, C. Lake Evaporation in a Hyper-Arid Environment, Northwest of China—Measurement and Estimation. Water 2016, 8. [Google Scholar] [CrossRef]
- Zhou, H.; Chen, Y.; Perry, L.; Li, W. Implications of climate change for water management of an arid inland lake in Northwest China. Lake Reserv. Manag. 2015, 31, 202–213. [Google Scholar] [CrossRef]
- World Meteorological Organization. Guide to Hydrological Practices Volume I Hydrology—From Measurement to Hydrological Information (WMO-No. 168); World Meteorological Organziation: Geneva, Switzerland, 2008. [Google Scholar]
- Xiong, A.Y.; Liao, J.; Xu, B. Reconstruction of a Daily Large-Pan Evaporation Dataset over China. J. Appl. Meteorol. Climatol. 2012, 51, 1265–1275. [Google Scholar] [CrossRef]
- Fu, G.; Liu, C.; Chen, S.; Hong, J. Investigating the conversion coefficients for free water surface evaporation of different evaporation pans. Hydrol. Process. 2004, 18, 2247–2262. [Google Scholar] [CrossRef]
- Li, Y.Z.; Liu, C.M.; Liang, K. Spatial Patterns and Influence Factors of Conversion Coefficients between Two Typical Pan Evaporimeters in China. Water 2016, 8. [Google Scholar] [CrossRef]
- Singh, V.P.; Xu, C.Y. Evaluation and generalization of 13 mass-transfer equations for determining free water evaporation. Hydrol. Process. 1997, 11, 311–323. [Google Scholar] [CrossRef]
- Altunkaynak, A. Predicting Water Level Fluctuations in Lake Michigan-Huron Using Wavelet-Expert System Methods. Water Resour. Manag. 2014, 28, 2293–2314. [Google Scholar] [CrossRef]
- Xu, C.Y.; Singh, V.P. Dependence of evaporation on meteorological variables at dierent time-scales and intercomparison of estimation methods. Hydrol. Process. 1998, 12, 429–442. [Google Scholar] [CrossRef]
- Rosenberry, D.O.; Winter, T.C.; Buso, D.C.; Likens, G.E. Comparison of 15 evaporation methods applied to a small mountain lake in the northeastern USA. J. Hydrol. 2007, 340, 149–166. [Google Scholar] [CrossRef]
- Ali, S.; Ghosh, N.C.; Singh, R. Evaluating best evaporation estimate model for water surface evaporation in semi-arid region, India. Hydrol. Process. 2008, 22, 1093–1106. [Google Scholar] [CrossRef]
- Winter, T.C.; Rosenberry, D.O.; Sturrock, A.M. Evaluation of 11 Equations for Determining Evaporation for a Small Lake in the North Central United States. Water Resour. Res. 1995, 31, 983–993. [Google Scholar] [CrossRef]
- Linacre, E. Estimating U.S. Class A Pan Evaporation from Few Climate Data. Water Int. 1994, 19, 5–14. [Google Scholar] [CrossRef]
- Rotstayn, L.D.; Roderick, M.L.; Farquhar, G.D. A simple pan-evaporation model for analysis of climate simulations: Evaluation over Australia. Geophys. Res. Lett. 2006, 33. [Google Scholar] [CrossRef]
- Thom, A.S.; Thony, J.L.; Vauclin, M. On the proper employment of evaporation pans and atmometers in estimating potential transpiration. Q. J. R. Meteorol. Soc. 1981, 107, 711–736. [Google Scholar] [CrossRef]
- Johnson, F.; Sharma, A. A comparison of Australian open water body evaporation trends for current and future climates estimated from Class A evaporation pans and general circulation models. J. Hydrometeorol. 2010, 11, 105–121. [Google Scholar] [CrossRef]
- Roderick, M.L.; Rotstayn, L.D.; Farquhar, G.D.; Hobbins, M.T. On the attribution of changing pan evaporation. Geophys. Res. Lett. 2007, 34. [Google Scholar] [CrossRef]
- McMahon, T.A.; Peel, M.C.; Lowe, L.; Srikanthan, R.; McVicar, T.R. Estimating actual, potential, reference crop and pan evaporation using standard meteorological data: A pragmatic synthesis. Hydrol. Earth Syst. Sci. 2013, 17, 1331–1363. [Google Scholar] [CrossRef]
- Hobbins, M.; Wood, A.; Streubel, D.; Werner, K. What Drives the Variability of Evaporative Demand across the Conterminous United States? J. Hydrometeorol. 2012, 13, 1195–1214. [Google Scholar] [CrossRef]
- Li, Z.; Chen, Y.; Shen, Y.; Liu, Y.; Zhang, S. Analysis of changing pan evaporation in the arid region of Northwest China. Water Resour. Res. 2013, 49, 2205–2212. [Google Scholar] [CrossRef]
- Yang, H.B.; Yang, D.W. Climatic factors influencing changing pan evaporation across China from 1961 to 2001. J. Hydrol. 2012, 414–415, 184–193. [Google Scholar] [CrossRef]
- Xie, H.; Zhu, X.; Yuan, D.-Y. Pan evaporation modelling and changing attribution analysis on the Tibetan Plateau (1970–2012). Hydrol. Process. 2015, 29, 2164–2177. [Google Scholar] [CrossRef]
- Allen, R.G.; Pereira, L.S.; Raes, D.; Smith, M. Crop Evapotranspiration-Guidelines for Computing Crop Requirements-FAO Irrigation and Drainage Paper 56; FAO: Rome, Italy, 1998. [Google Scholar]
- Nian, Y.Y.; Li, X.; Zhou, J. Landscape changes of the Ejin Delta in the Heihe River Basin in Northwest China from 1930 to 2010. Int. J. Remote Sens. 2016, 38, 537–557. [Google Scholar] [CrossRef]
- Xi, H.; Feng, Q.; Liu, W.; Si, J.; Chang, Z.; Su, Y. The research of groundwater flow model in Ejina Basin, Northwestern China. Environ. Earth Sci. 2010, 60, 953–963. [Google Scholar] [CrossRef]
- Si, J.H.; Feng, Q.; Zhang, X.Y.; Liu, W.; Su, Y.H.; Zhang, Y.W. Growing season evapotranspiration from Tamarix ramosissima stands under extreme arid conditions in northwest China. Environ. Geol. 2005, 48, 861–870. [Google Scholar] [CrossRef]
- Li, Z.; Pan, N.; He, Y.; Zhang, Q. Evaluating the best evaporation estimate model for free water surface evaporation in hyper-arid regions: A case study in the Ejina basin, northwest China. Environ. Earth Sci. 2016, 75. [Google Scholar] [CrossRef]
- Yu, T.F.; Feng, Q.; Si, J.H. Evapotranspiration of a Populus euphratica Olivier Forest and its controlling factors in the lower Heihe River Basin, Northwest China. Sci. Cold Arid Reg. 2017, 9, 175–182. [Google Scholar]
- Wang, P.; Pozdniakov, S.P. A statistical approach to estimating evapotranspiration from diurnal groundwater level fluctuations. Water Resour. Res. 2014, 50, 2276–2292. [Google Scholar] [CrossRef]
- Xi, H.; Zhang, L.; Feng, Q.; Si, J.; Chang, Z.; Yu, T.; Li, J. The spatial heterogeneity of riverbed saturated permeability coefficient in the lower reaches of the Heihe River Basin, Northwest China. Hydrol. Process. 2015, 29, 4891–4907. [Google Scholar] [CrossRef]
- Abtew, W. Evaporation estimation for Lake Okeechobee in South Florida. J. Irrig. Drain. Eng. 2001, 127, 140–147. [Google Scholar] [CrossRef]
- Jensen, M.E. Estimating evaporation from water surfaces. In Proceedings of the CSU/ARS Evapotranspiration Workshop, Fort Collins, CO, USA, 15 March 2010. [Google Scholar]
- Irmak, S.; Odhiambo, L.O.; Mutiibwa, D. Evaluating the impact of daily net radiation models on grass and alfalfa-reference evapotranspiration using the penman-monteith equation in a subhumid and semiarid climate. J. Irrig. Drain. Eng. 2011, 137, 59–72. [Google Scholar] [CrossRef]
- Zuo, H.; Chen, B.; Wang, S.; Guo, Y.; Zuo, B.; Wu, L.; Gao, X. Observational study on complementary relationship between pan evaporation and actual evapotranspiration and its variation with pan type. Agric. For. Meteorol. 2016, 222, 1–9. [Google Scholar] [CrossRef]
- Fu, G.B.; Charles, S.P.; Yu, J.J. A critical overview of pan evaporation trends over the last 50 years. Clim. Chang. 2009, 97, 193–214. [Google Scholar] [CrossRef]
- Liu, X.; Luo, Y.; Zhang, D.; Zhang, M.; Liu, C. Recent changes in pan-evaporation dynamics in China. Geophys. Res. Lett. 2011, 38, L13404. [Google Scholar] [CrossRef]
- Shi, P.J.; Zhang, G.F.; Kong, F.; Ye, Q. Wind speed change regionalization in China (1961–2012). Adv. Clim. Chang. Res. 2015, 6, 151–158. [Google Scholar] [CrossRef]
- Guo, H.; Xu, M.; Hu, Q. Changes in near-surface wind speed in China: 1969–2005. Int. J. Climatol. 2011, 31, 349–358. [Google Scholar] [CrossRef]
- Jones, F.E. Evaporation of Water: With Emphasis on Applications and Measurements; Lewis Publ., Inc.: Chelsea, MI, USA, 1992. [Google Scholar]
- Finch, J.; Calver, A. Methods for the quantification of evaporation from lakes. In Prepared for the World Meteorological Organization Commission of Hydrology; CEH Wallingford: Wallingford, UK, 2008. [Google Scholar]


| Month | Tmean | Tmax | Tmin | P | RH | Sd | U | Ep |
|---|---|---|---|---|---|---|---|---|
| 1 | −11.5 | −3.3 | −16.9 | 0.3 | 48.7 | 227 | 2.5 | 35.5 |
| 2 | −6.2 | 2.6 | −12.9 | 0.2 | 36.4 | 231 | 2.8 | 68.4 |
| 3 | 2.3 | 10.5 | −5.2 | 1.2 | 27.9 | 272 | 3.3 | 181.3 |
| 4 | 11.5 | 19.9 | 3.5 | 1.8 | 22.8 | 298 | 4.0 | 212.0 |
| 5 | 19.2 | 27.1 | 10.6 | 2.7 | 21.7 | 335 | 4.0 | 301.5 |
| 6 | 24.9 | 32.4 | 16.6 | 6.2 | 25.4 | 335 | 3.8 | 333.6 |
| 7 | 27.0 | 34.6 | 18.9 | 10.0 | 32.0 | 332 | 3.5 | 338.8 |
| 8 | 24.9 | 32.5 | 17.2 | 7.5 | 34.0 | 321 | 3.3 | 299.1 |
| 9 | 17.8 | 26.2 | 10.4 | 4.5 | 32.7 | 300 | 2.9 | 211.5 |
| 10 | 8.4 | 17.2 | 1.5 | 2.5 | 34.7 | 283 | 2.8 | 130.0 |
| 11 | −1.7 | 6.4 | −7.8 | 0.5 | 40.6 | 231 | 3.0 | 89.6 |
| 12 | −9.7 | −2.0 | −14.9 | 0.3 | 49.5 | 216 | 2.7 | 39.1 |
| Average/Sum | 8.9 | 17.0 | −9.5 | 37.5 | 33.9 | 3382 | 3.2 | 2240.5 |
| Year | Months | Qs | P | EL 1 | ΔS | Qg | AL | Ta | RH | U | Ep | Kp |
|---|---|---|---|---|---|---|---|---|---|---|---|---|
| 2014 | 4 | 0.0 | 0.0 | 152.7 | −43.2 | −109.5 | 39.5 | 13.9 | 20.5 | 3.0 | 200.9 | 0.76 |
| 5 | 13.1 | 0.0 | 208.7 | −62.6 | −133.1 | 39.2 | 19.9 | 18.0 | 3.5 | 277.3 | 0.75 | |
| 6 | 0.0 | 8.5 | 201.0 | −75.9 | −116.6 | 38.2 | 24.2 | 30.6 | 3.0 | 245.4 | 0.82 | |
| 7 | 519.3 | 2.4 | 216.7 | 124.5 | 180.5 | 39.8 | 28.1 | 29.7 | 2.8 | 293.2 | 0.74 | |
| 8 | 0.0 | 1.2 | 219.6 | −136.6 | −81.8 | 39.2 | 25.4 | 28.3 | 2.4 | 266.1 | 0.83 | |
| 9 | 866.7 | 0.0 | 180.2 | 345.5 | 341.0 | 38.2 | 18.9 | 30.6 | 2.5 | 207.1 | 0.87 | |
| Sum/Average | 1399.1 | 12.1 | 1178.9 | 151.7 | 80.6 | 39.0 | 21.7 | 26.3 | 2.9 | 1490.0 | 0.79 | |
| 2015 | 4 | 0.0 | 26.2 | 149.9 | −156.5 | 32.8 | 40.3 | 13.2 | 26.4 | 2.8 | 175.8 | 0.85 |
| 5 | 0.0 | 0.1 | 204.9 | −127.7 | −77.1 | 39.2 | 20.2 | 18.6 | 3.1 | 268.3 | 0.76 | |
| 6 | 0.0 | 3.8 | 209.4 | −109.9 | −95.7 | 38.2 | 24.4 | 27.6 | 3.3 | 280.4 | 0.75 | |
| 7 | 739.6 | 12.7 | 217.6 | 259.0 | 275.7 | 39.8 | 27.2 | 30.1 | 3.0 | 298.8 | 0.73 | |
| 8 | 0.0 | 0.0 | 224.2 | −166.0 | −58.2 | 39.2 | 25.9 | 25.2 | 2.9 | 303.9 | 0.74 | |
| 9 | 0.0 | 25.7 | 177.7 | −75.9 | −76.1 | 38.2 | 18.0 | 36.1 | 2.6 | 189.9 | 0.94 | |
| Sum/Average | 739.6 | 68.5 | 1183.7 | −376.9 | 1.3 | 39.2 | 21.5 | 27.3 | 2.9 | 1517.1 | 0.79 | |
| Year | Qs | P | ΔS | Eb | EP | KL | EL |
|---|---|---|---|---|---|---|---|
| 2005 | 1329.1 | 27.2 | −97.6 | 1453.9 | 2253.5 | 0.65 | 1462.1 |
| 2006 | 2364.6 | 27.9 | 256.8 | 2135.7 | 2258.7 | 0.95 | 1390.7 |
| 2007 | 1658.9 | 28.0 | 3.0 | 1683.9 | 2301.5 | 0.73 | 1431.3 |
| 2008 | 309.0 | 63.0 | −1008.5 | 1380.5 | 2346.6 | 0.59 | 1430.0 |
| 2009 | 1249.4 | 9.2 | −368.0 | 1626.6 | 2394.9 | 0.68 | 1486.4 |
| 2010 | 1243.2 | 25.4 | −390.7 | 1659.4 | 2348.9 | 0.71 | 1439.0 |
| 2011 | 2101.2 | 36.9 | 708.7 | 1429.4 | 2274.6 | 0.63 | 1455.3 |
| 2012 | 1558.9 | 32.1 | −167.4 | 1758.4 | 2211.1 | 0.80 | 1391.4 |
| 2013 | 1213.4 | 34.2 | −431.3 | 1678.9 | 1996.9 | 0.84 | 1206.5 |
| 2014 | 1949.3 | 16.2 | 152.6 | 1812.9 | 2061.8 | 0.88 | 1271.9 |
| 2015 | 1115.2 | 70.1 | −218.9 | 1404.2 | 2089.5 | 0.67 | 1277.5 |
| Mean | 1462.9 | 31.7 | −141.9 | 1638.5 | 2218.7 | 0.74 | 1385.6 |
© 2017 by the authors. Licensee MDPI, Basel, Switzerland. This article is an open access article distributed under the terms and conditions of the Creative Commons Attribution (CC BY) license (http://creativecommons.org/licenses/by/4.0/).
Share and Cite
Yu, T.-F.; Si, J.-H.; Feng, Q.; Xi, H.-Y.; Chu, Y.-W.; Li, K. Simulation of Pan Evaporation and Application to Estimate the Evaporation of Juyan Lake, Northwest China under a Hyper-Arid Climate. Water 2017, 9, 952. https://doi.org/10.3390/w9120952
Yu T-F, Si J-H, Feng Q, Xi H-Y, Chu Y-W, Li K. Simulation of Pan Evaporation and Application to Estimate the Evaporation of Juyan Lake, Northwest China under a Hyper-Arid Climate. Water. 2017; 9(12):952. https://doi.org/10.3390/w9120952
Chicago/Turabian StyleYu, Teng-Fei, Jian-Hua Si, Qi Feng, Hai-Yang Xi, Yong-Wei Chu, and Kai Li. 2017. "Simulation of Pan Evaporation and Application to Estimate the Evaporation of Juyan Lake, Northwest China under a Hyper-Arid Climate" Water 9, no. 12: 952. https://doi.org/10.3390/w9120952