
Comparison of Multi-Criteria Decision Support Methods for Integrated Rehabilitation Prioritization


Abstract
:1. Introduction
2. Selection of Multi-Criteria Decision-Making (MCDM) Methods Based on Literature Review
2.1. Review of Available Methods
- Value measurement models: A numerical score for each alternative is constructed. Furthermore, a weight w is assigned to each criterion, which represents the importance of the criterion (e.g., Weighted Sum Model, Analytic Hierarchy Process).
- Goal, aspiration and reference level models: These methods measure how good alternatives reach determined goals or aspirations (e.g., TOPSIS).
- Outranking models: These methods compare the alternatives pairwise for each criterion, finding the strength of preferring one over the other (e.g., ELECTRE, PROMETHEE).
2.2. Application of MCDM Techniques in Rehabilitation Planning
- Structure for approaching current and future complex problems;
- A rational view on the problems and rational ranking of the possible solutions;
- Consistency and objectivity in the decision making process;
- Documentation of all the assumptions used, criteria, and values used to make decisions for later review and for usage for future problems; and
- Every decision is repeatable, reviewable, revisable and easy to understand.
3. Materials and Methods
3.1. Definition of Criteria and Weights in Integrated Rehabilitation Management
3.1.1. Sewer Network
3.1.2. Water Distribution Network
3.1.3. Gas Distribution Network
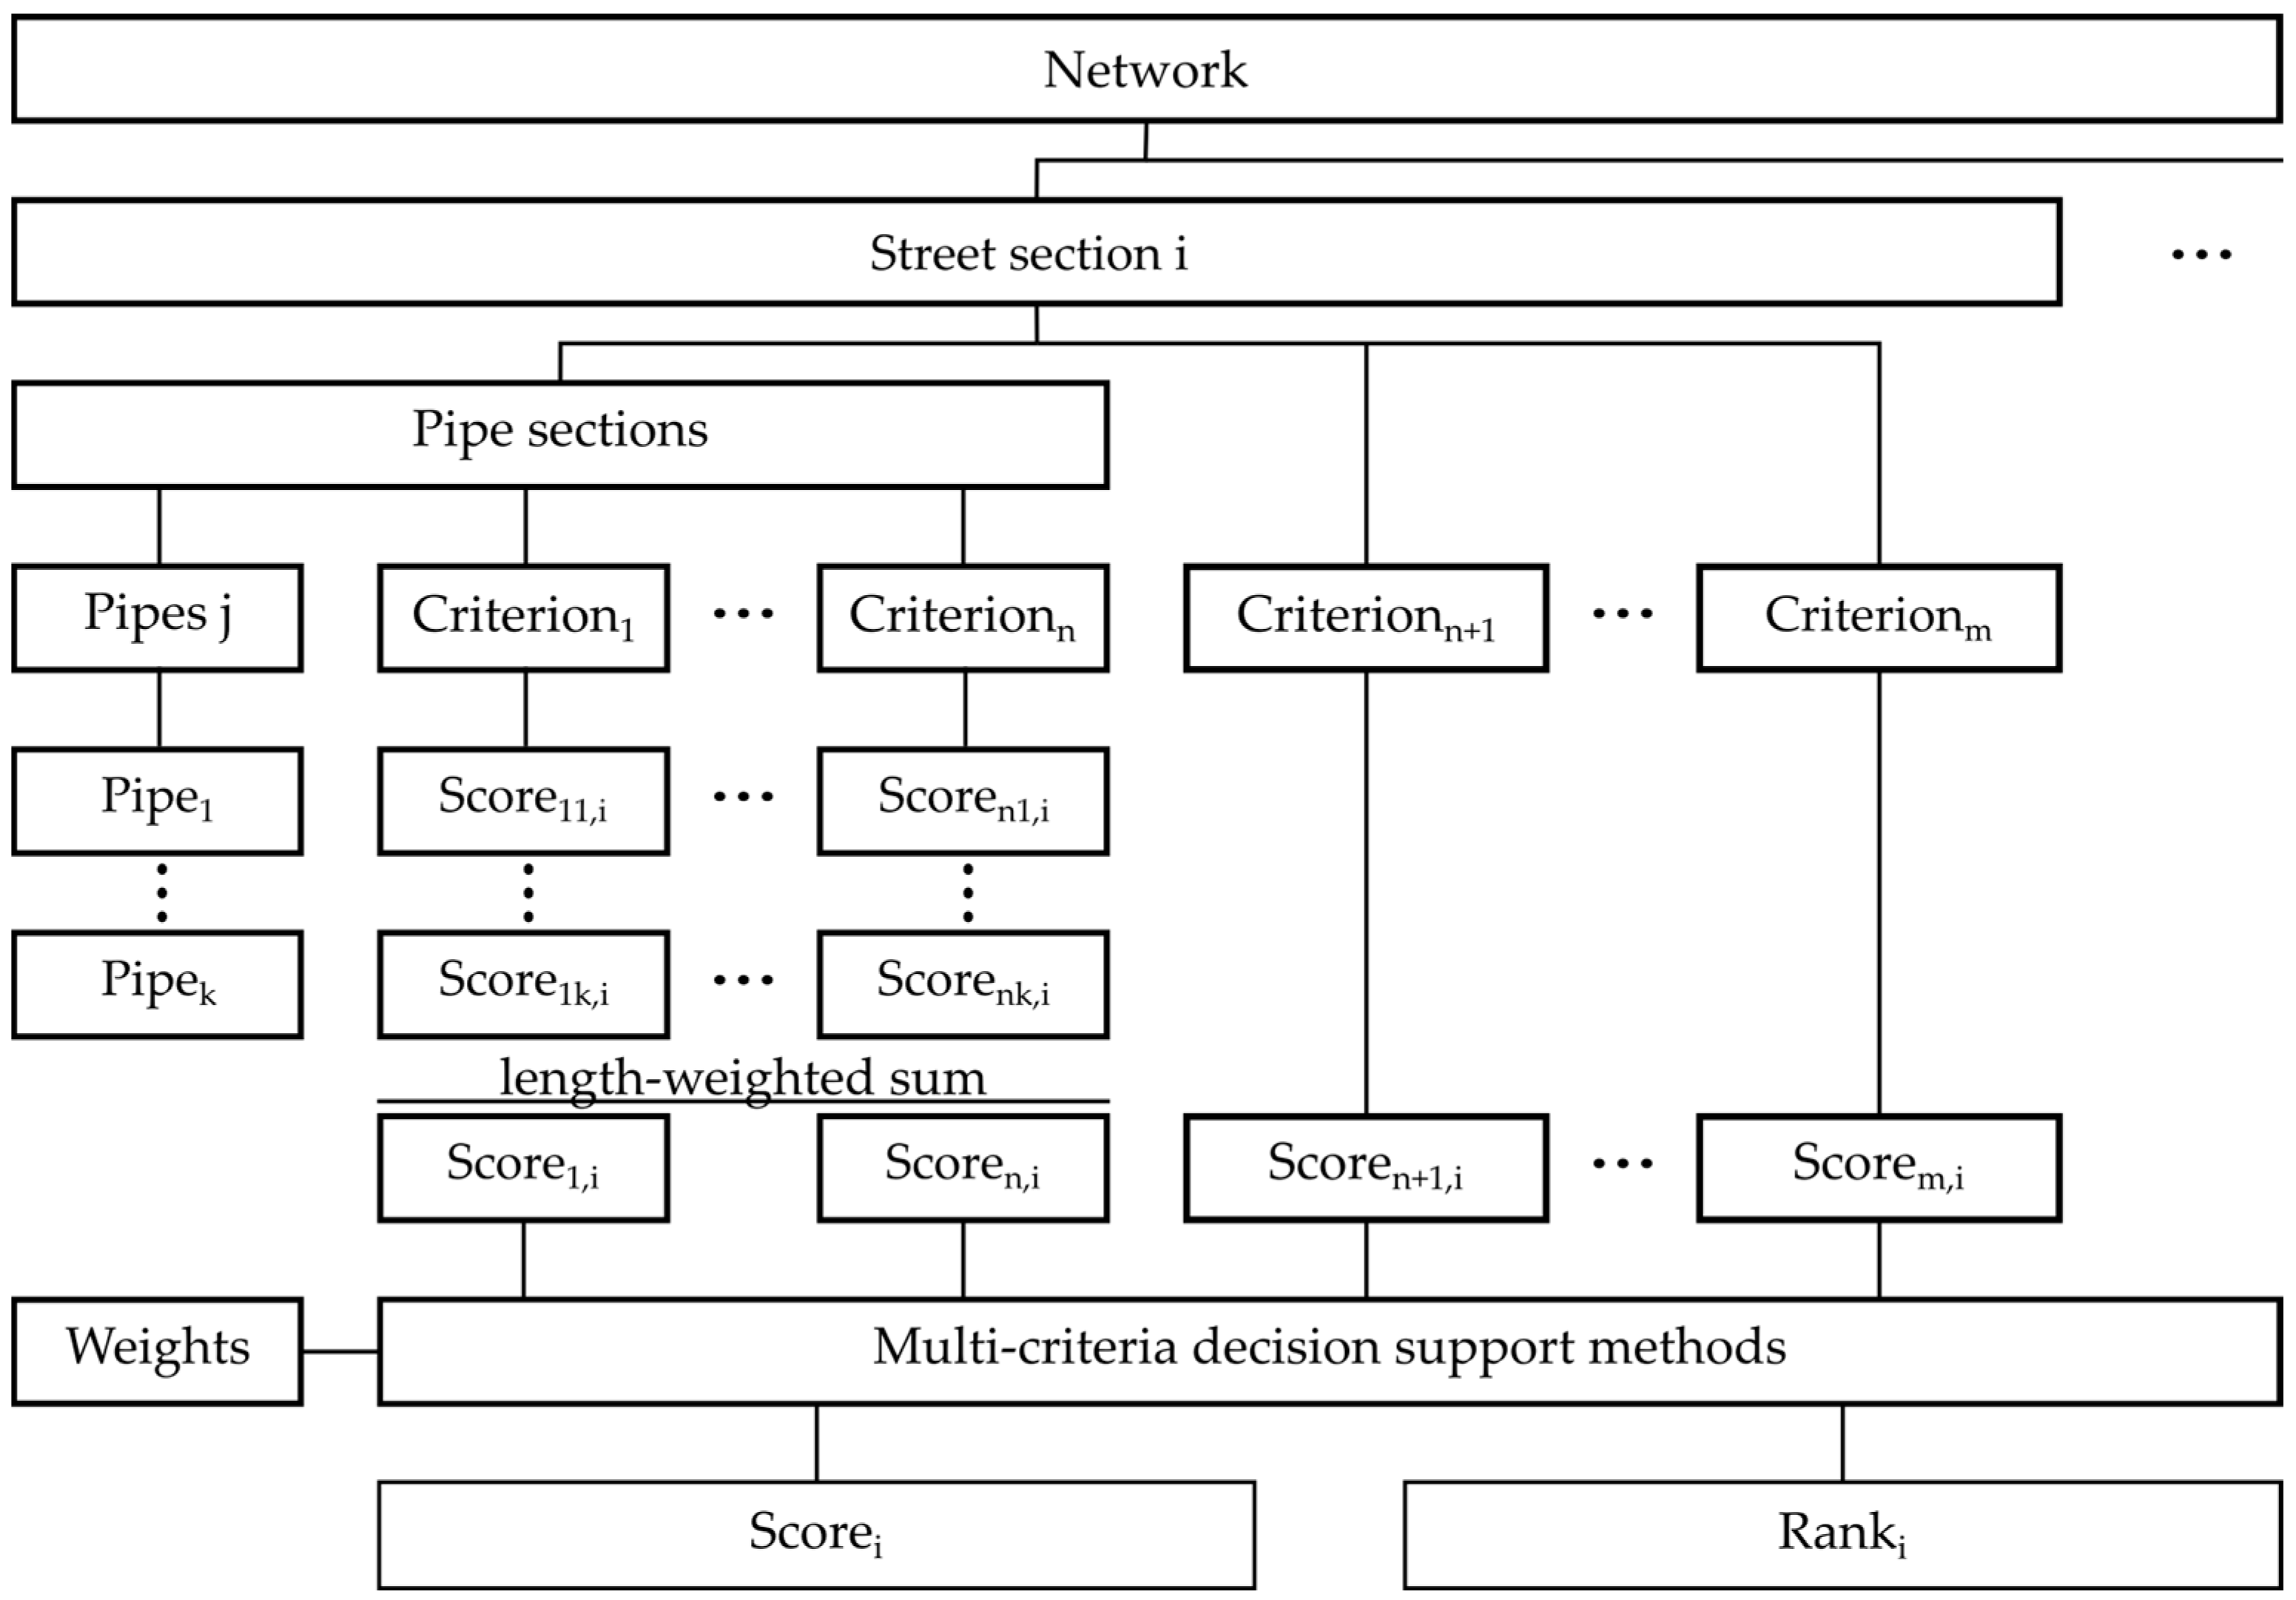
3.2. Weights and Indices
- wk considers the different influence of pipe and street level criteria.
- wl weights the three criteria on the pipe level. In our case study, this is the weighting of “condition” vs. “importance” vs. “economics”.
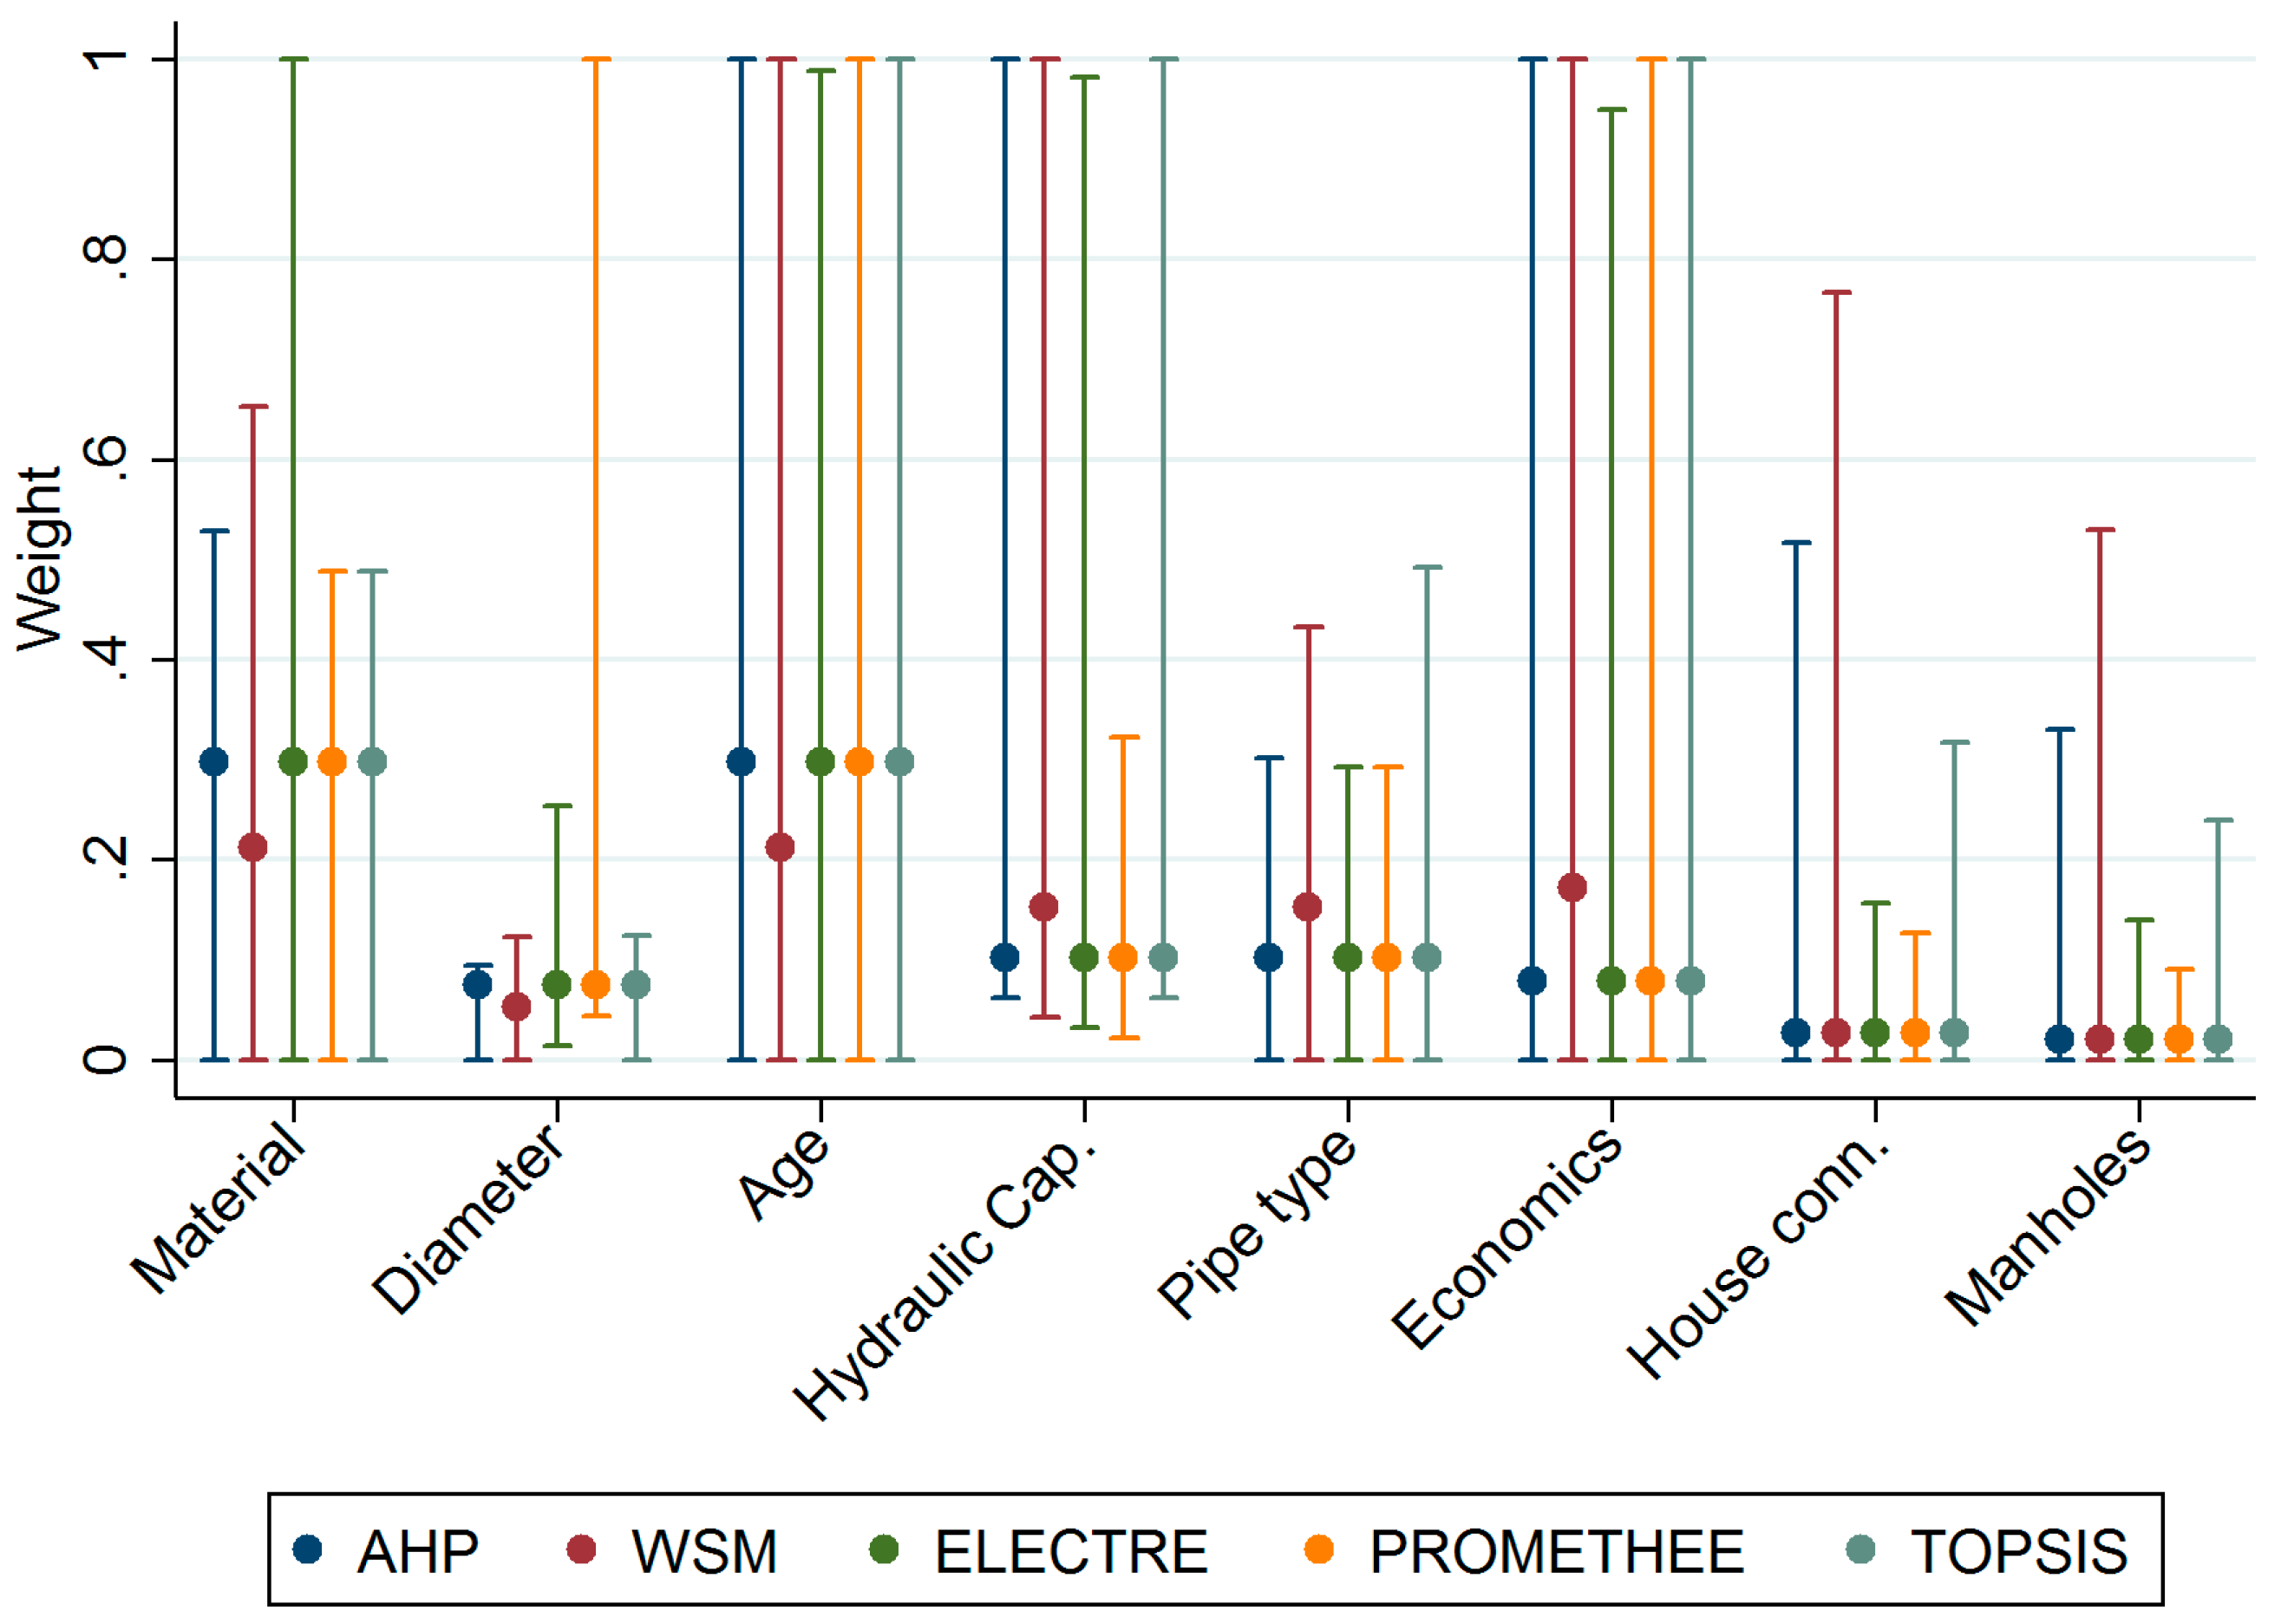
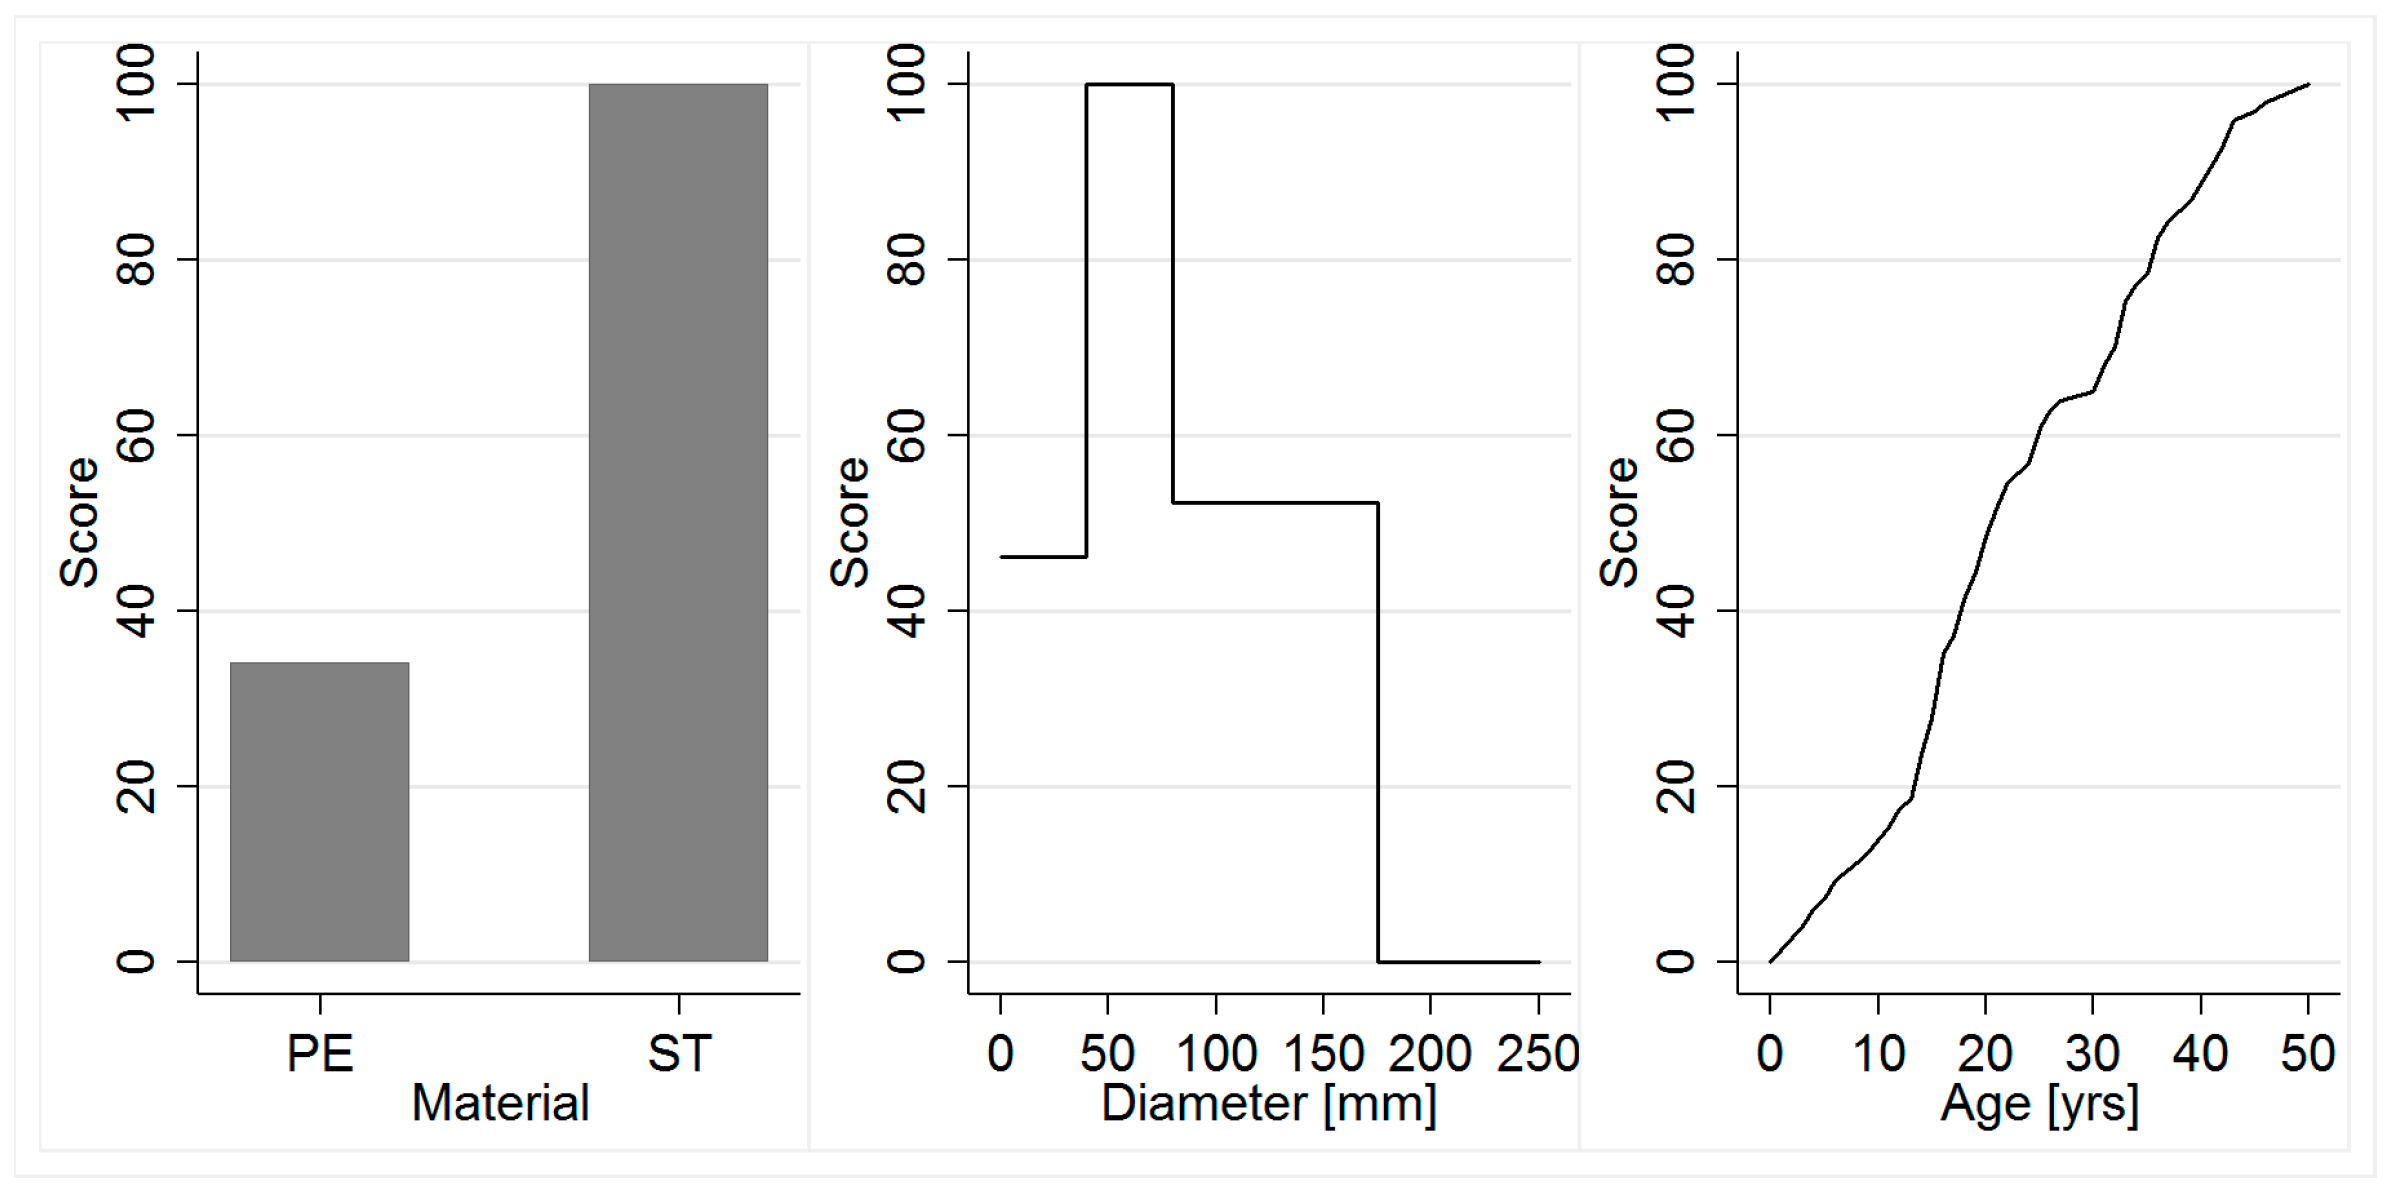
- wm represents the weighting of the influencing factor within the main categories. In our case study, for example the weighting of “material” vs. “diameter” vs. “age” for the “condition” criteria.
- Finally, wj is the product of these three weights.
4. Results and Discussion
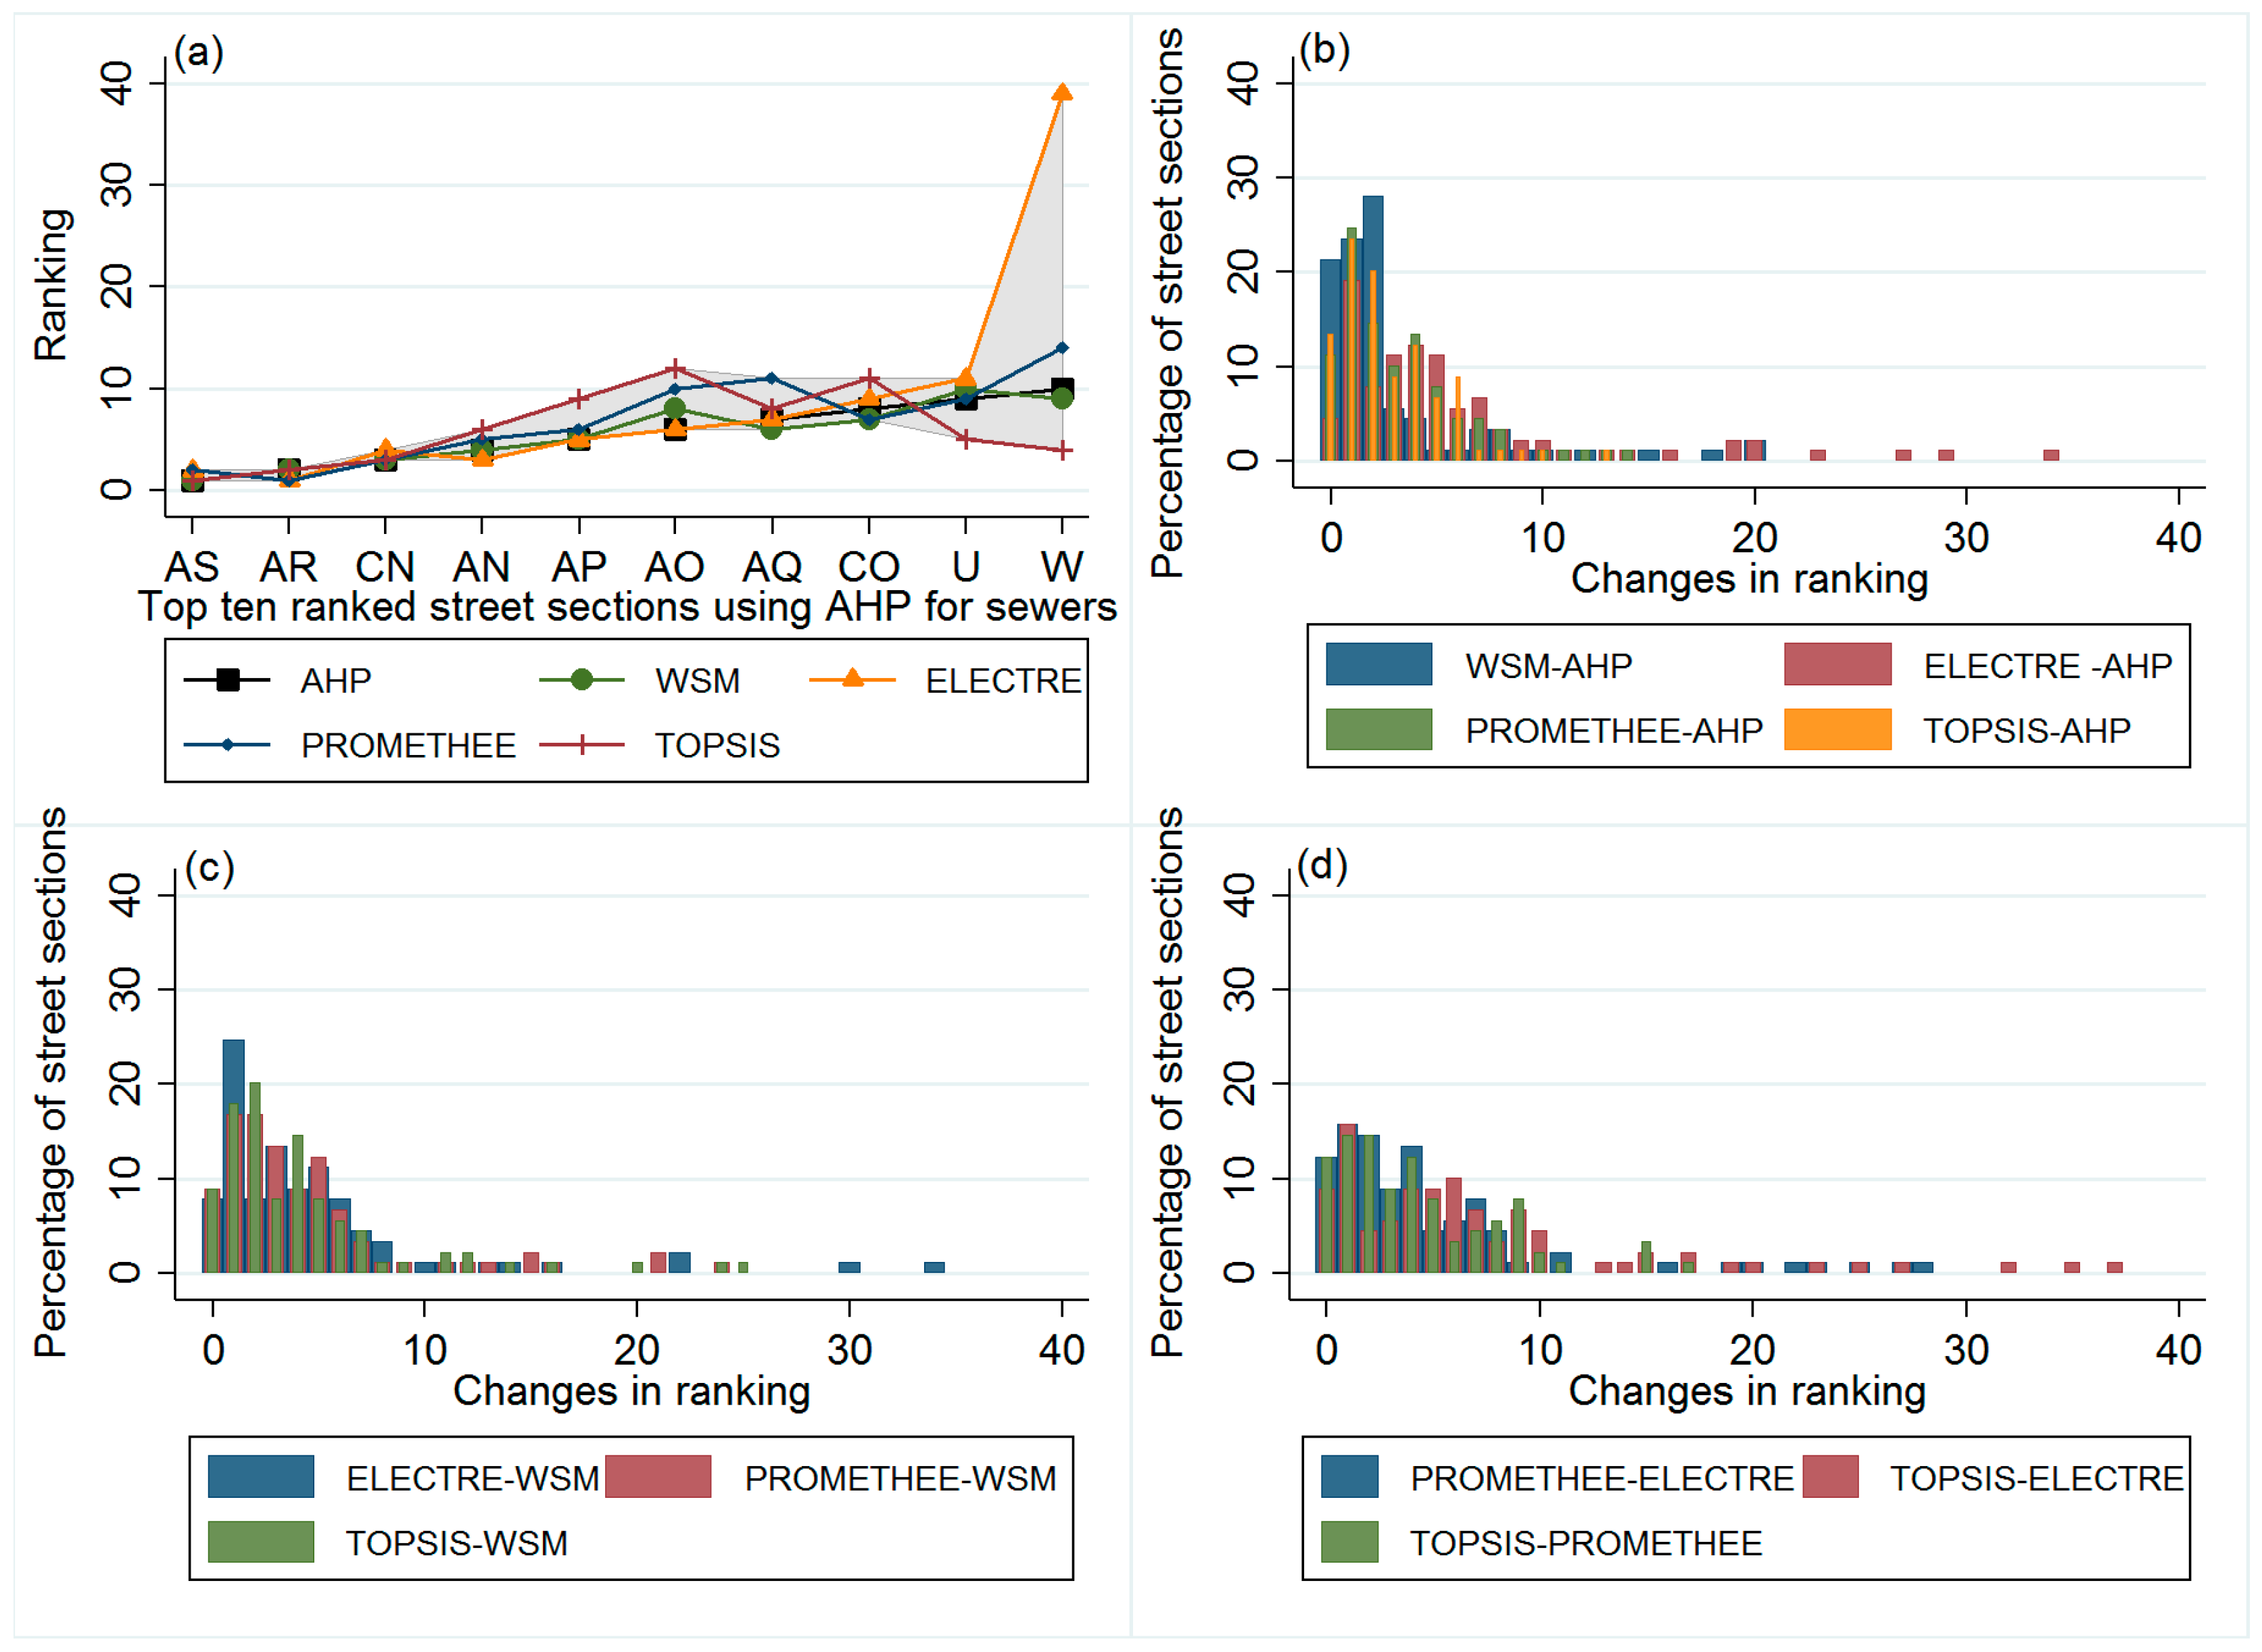
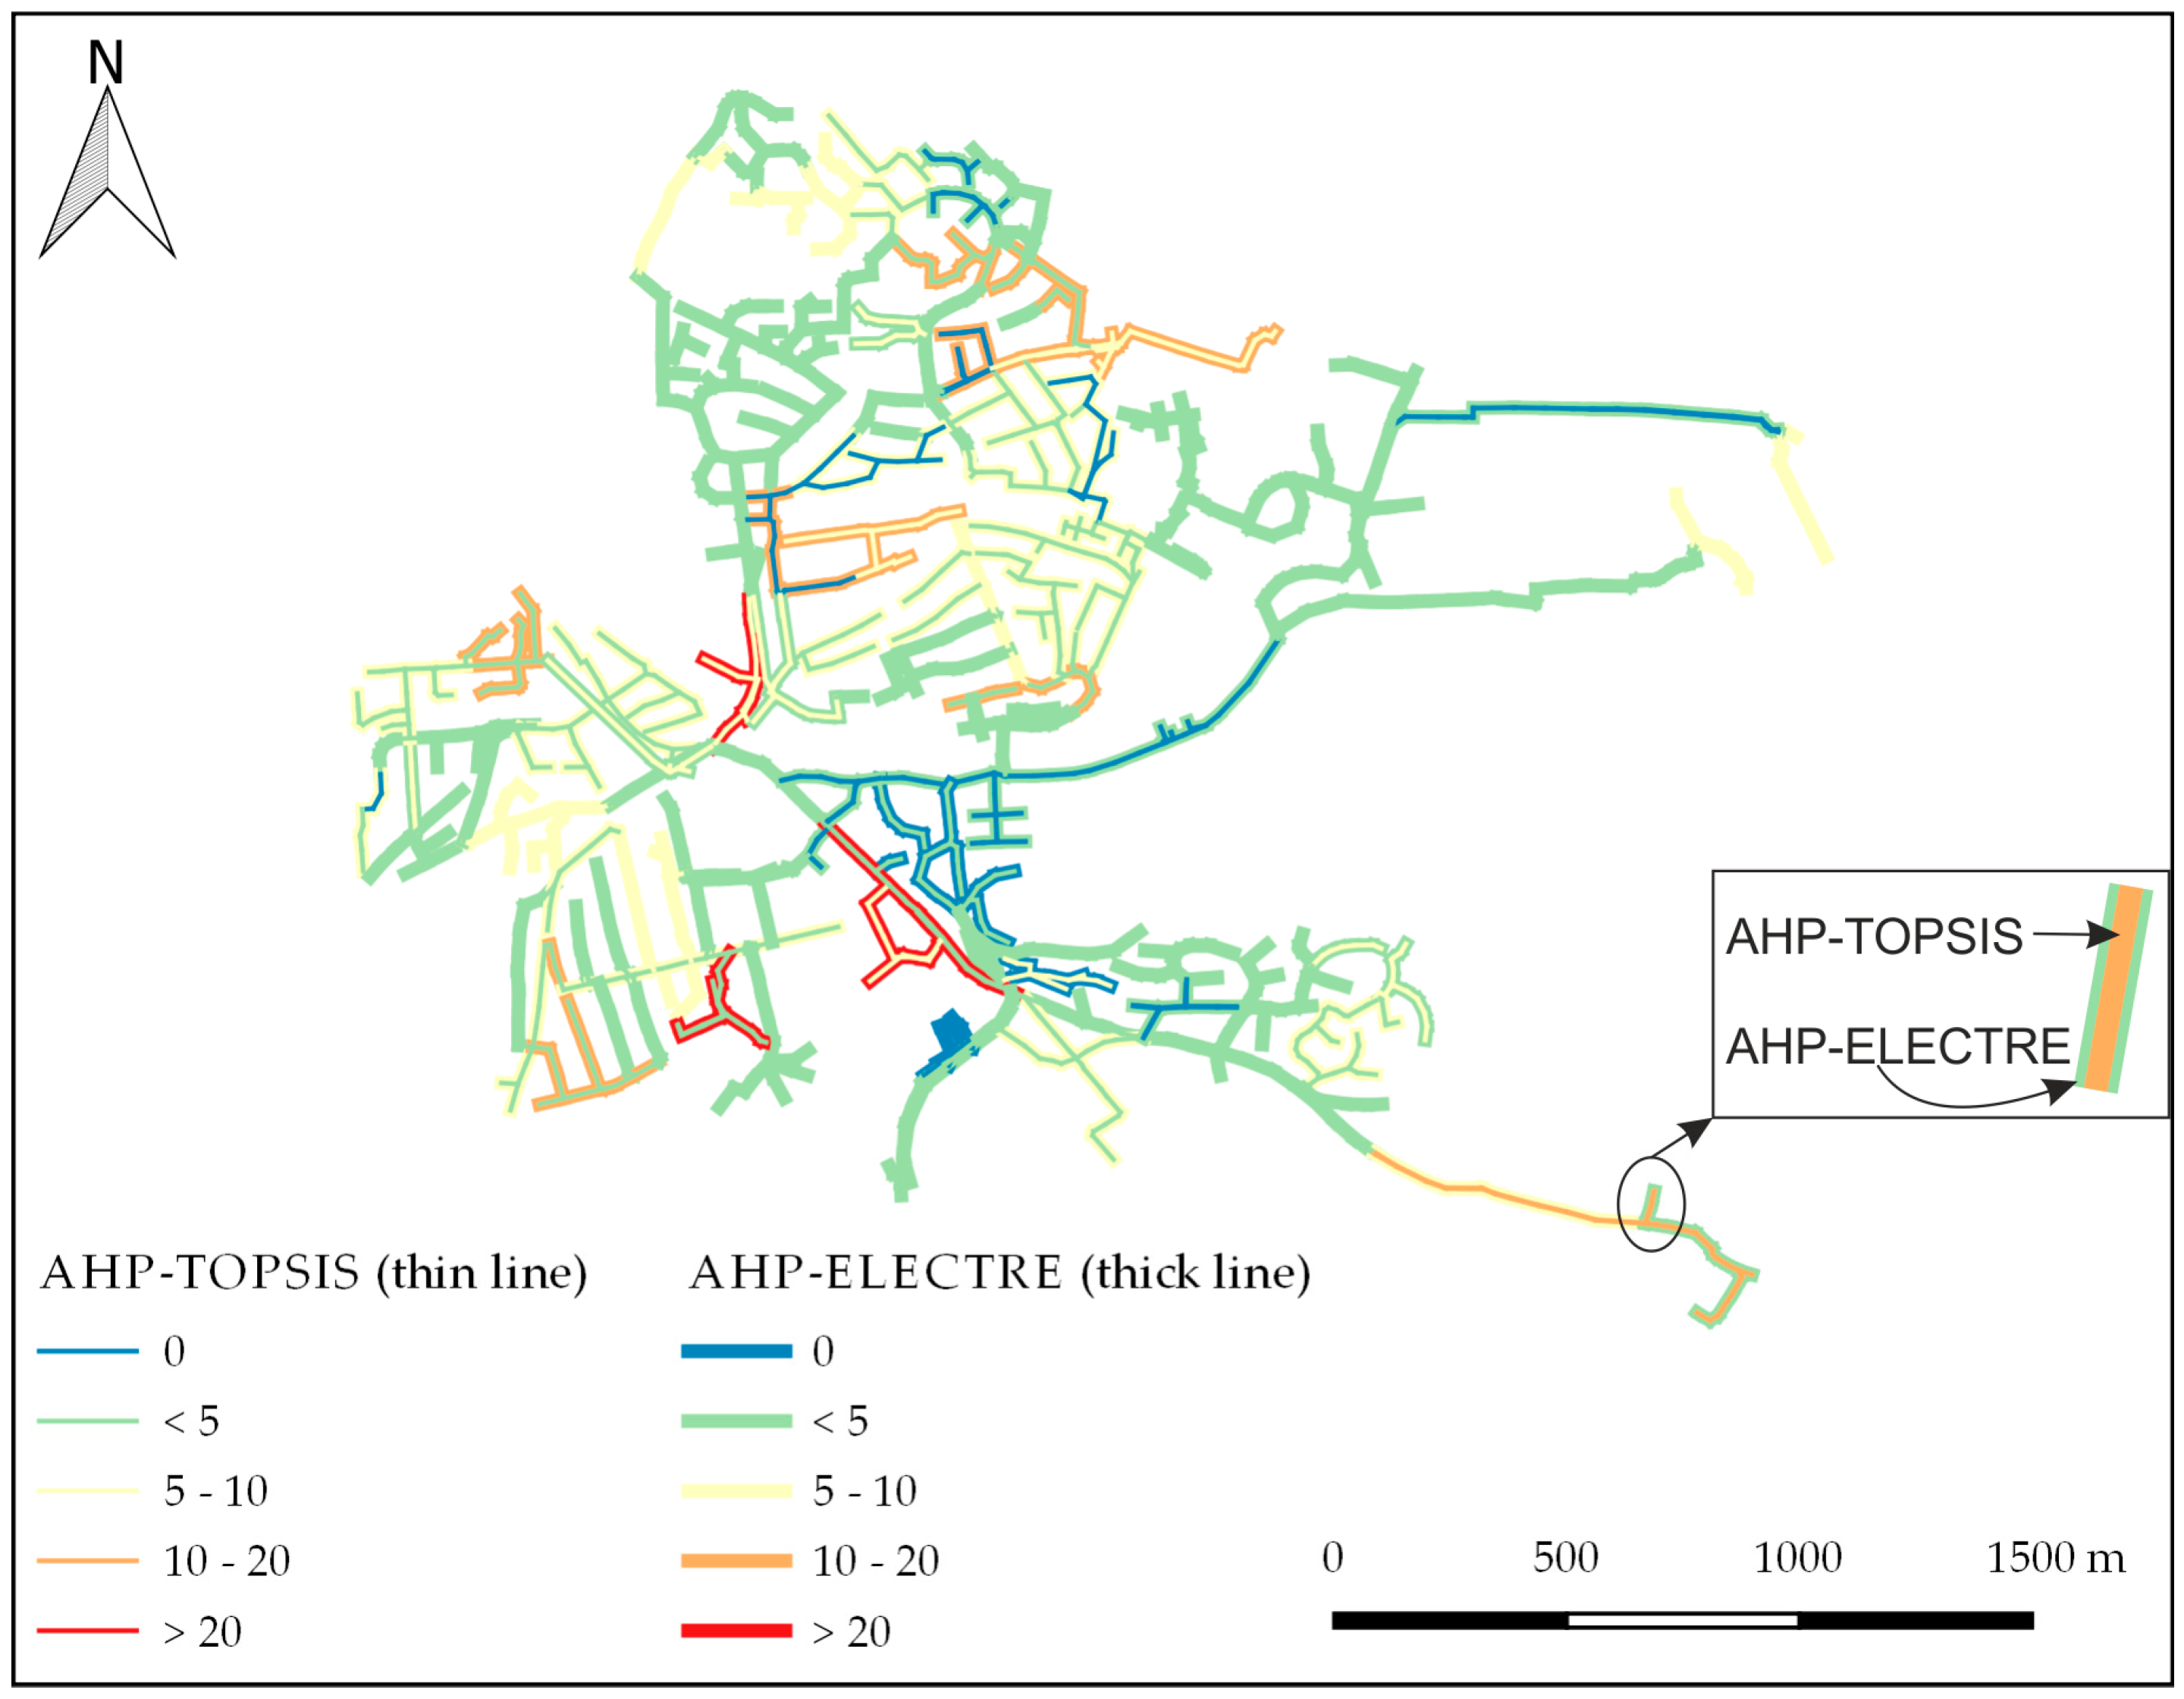
4.1. Sewer
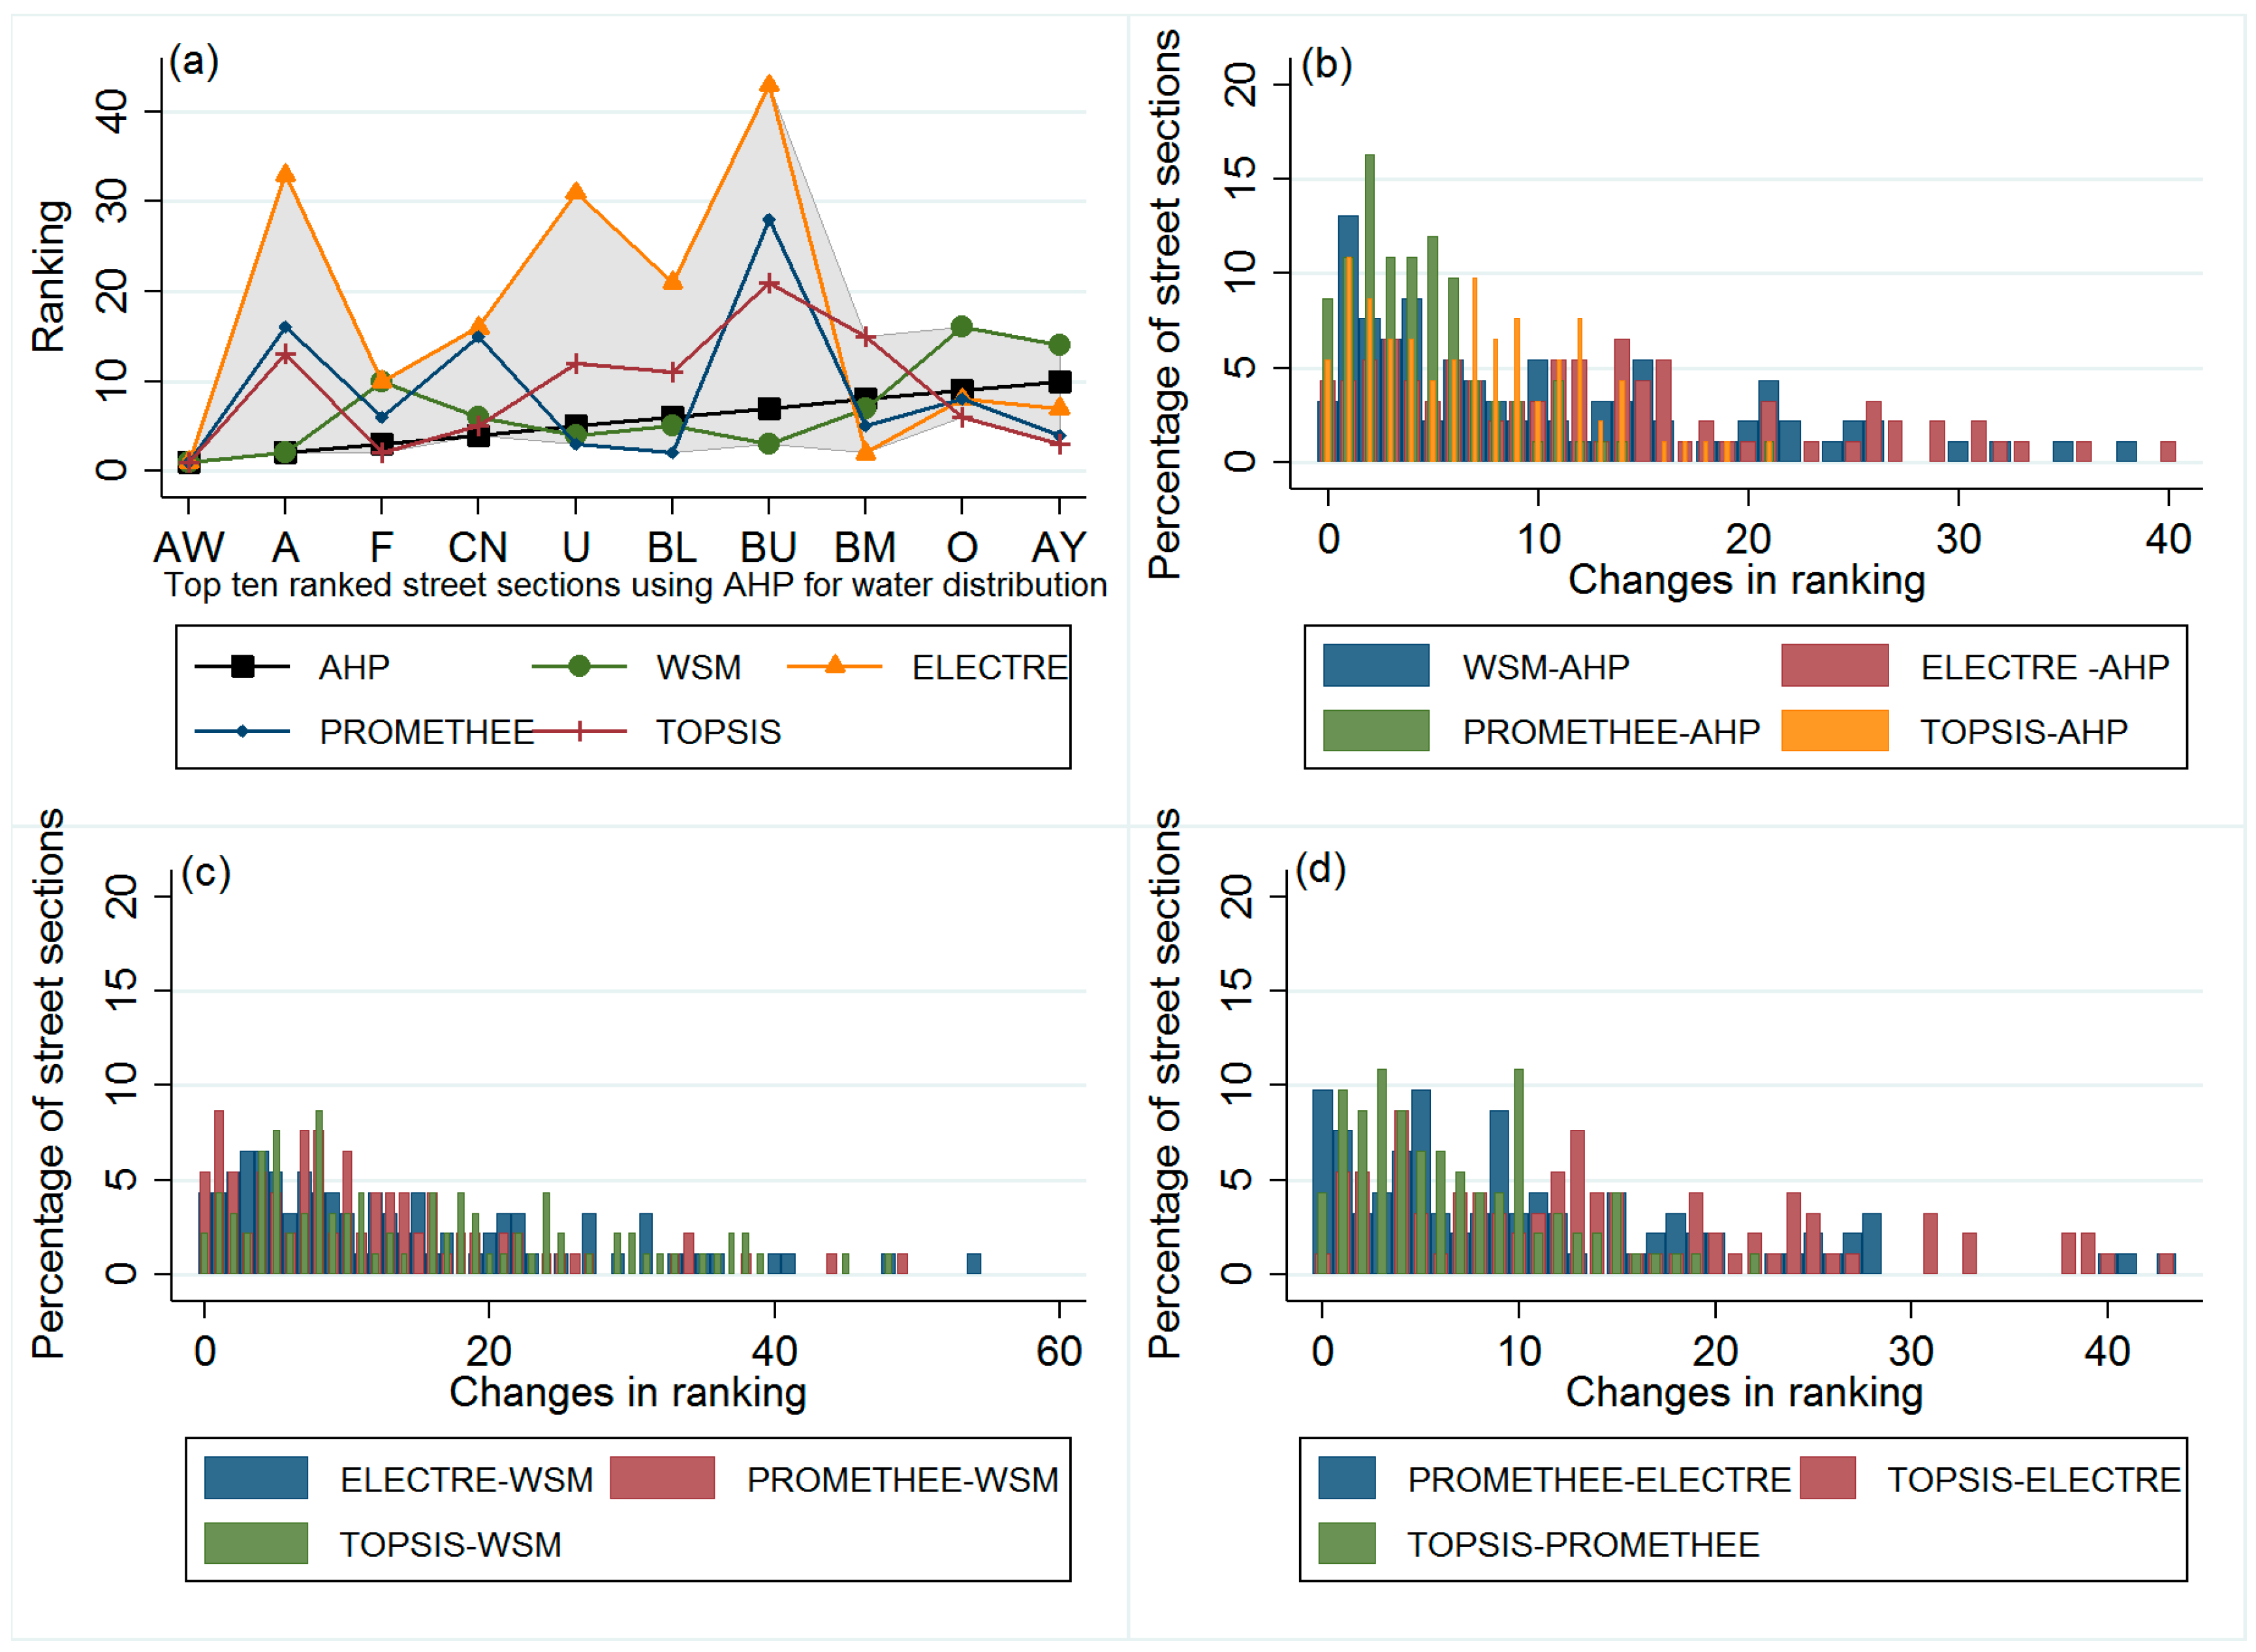
4.2. Water Distribution Network
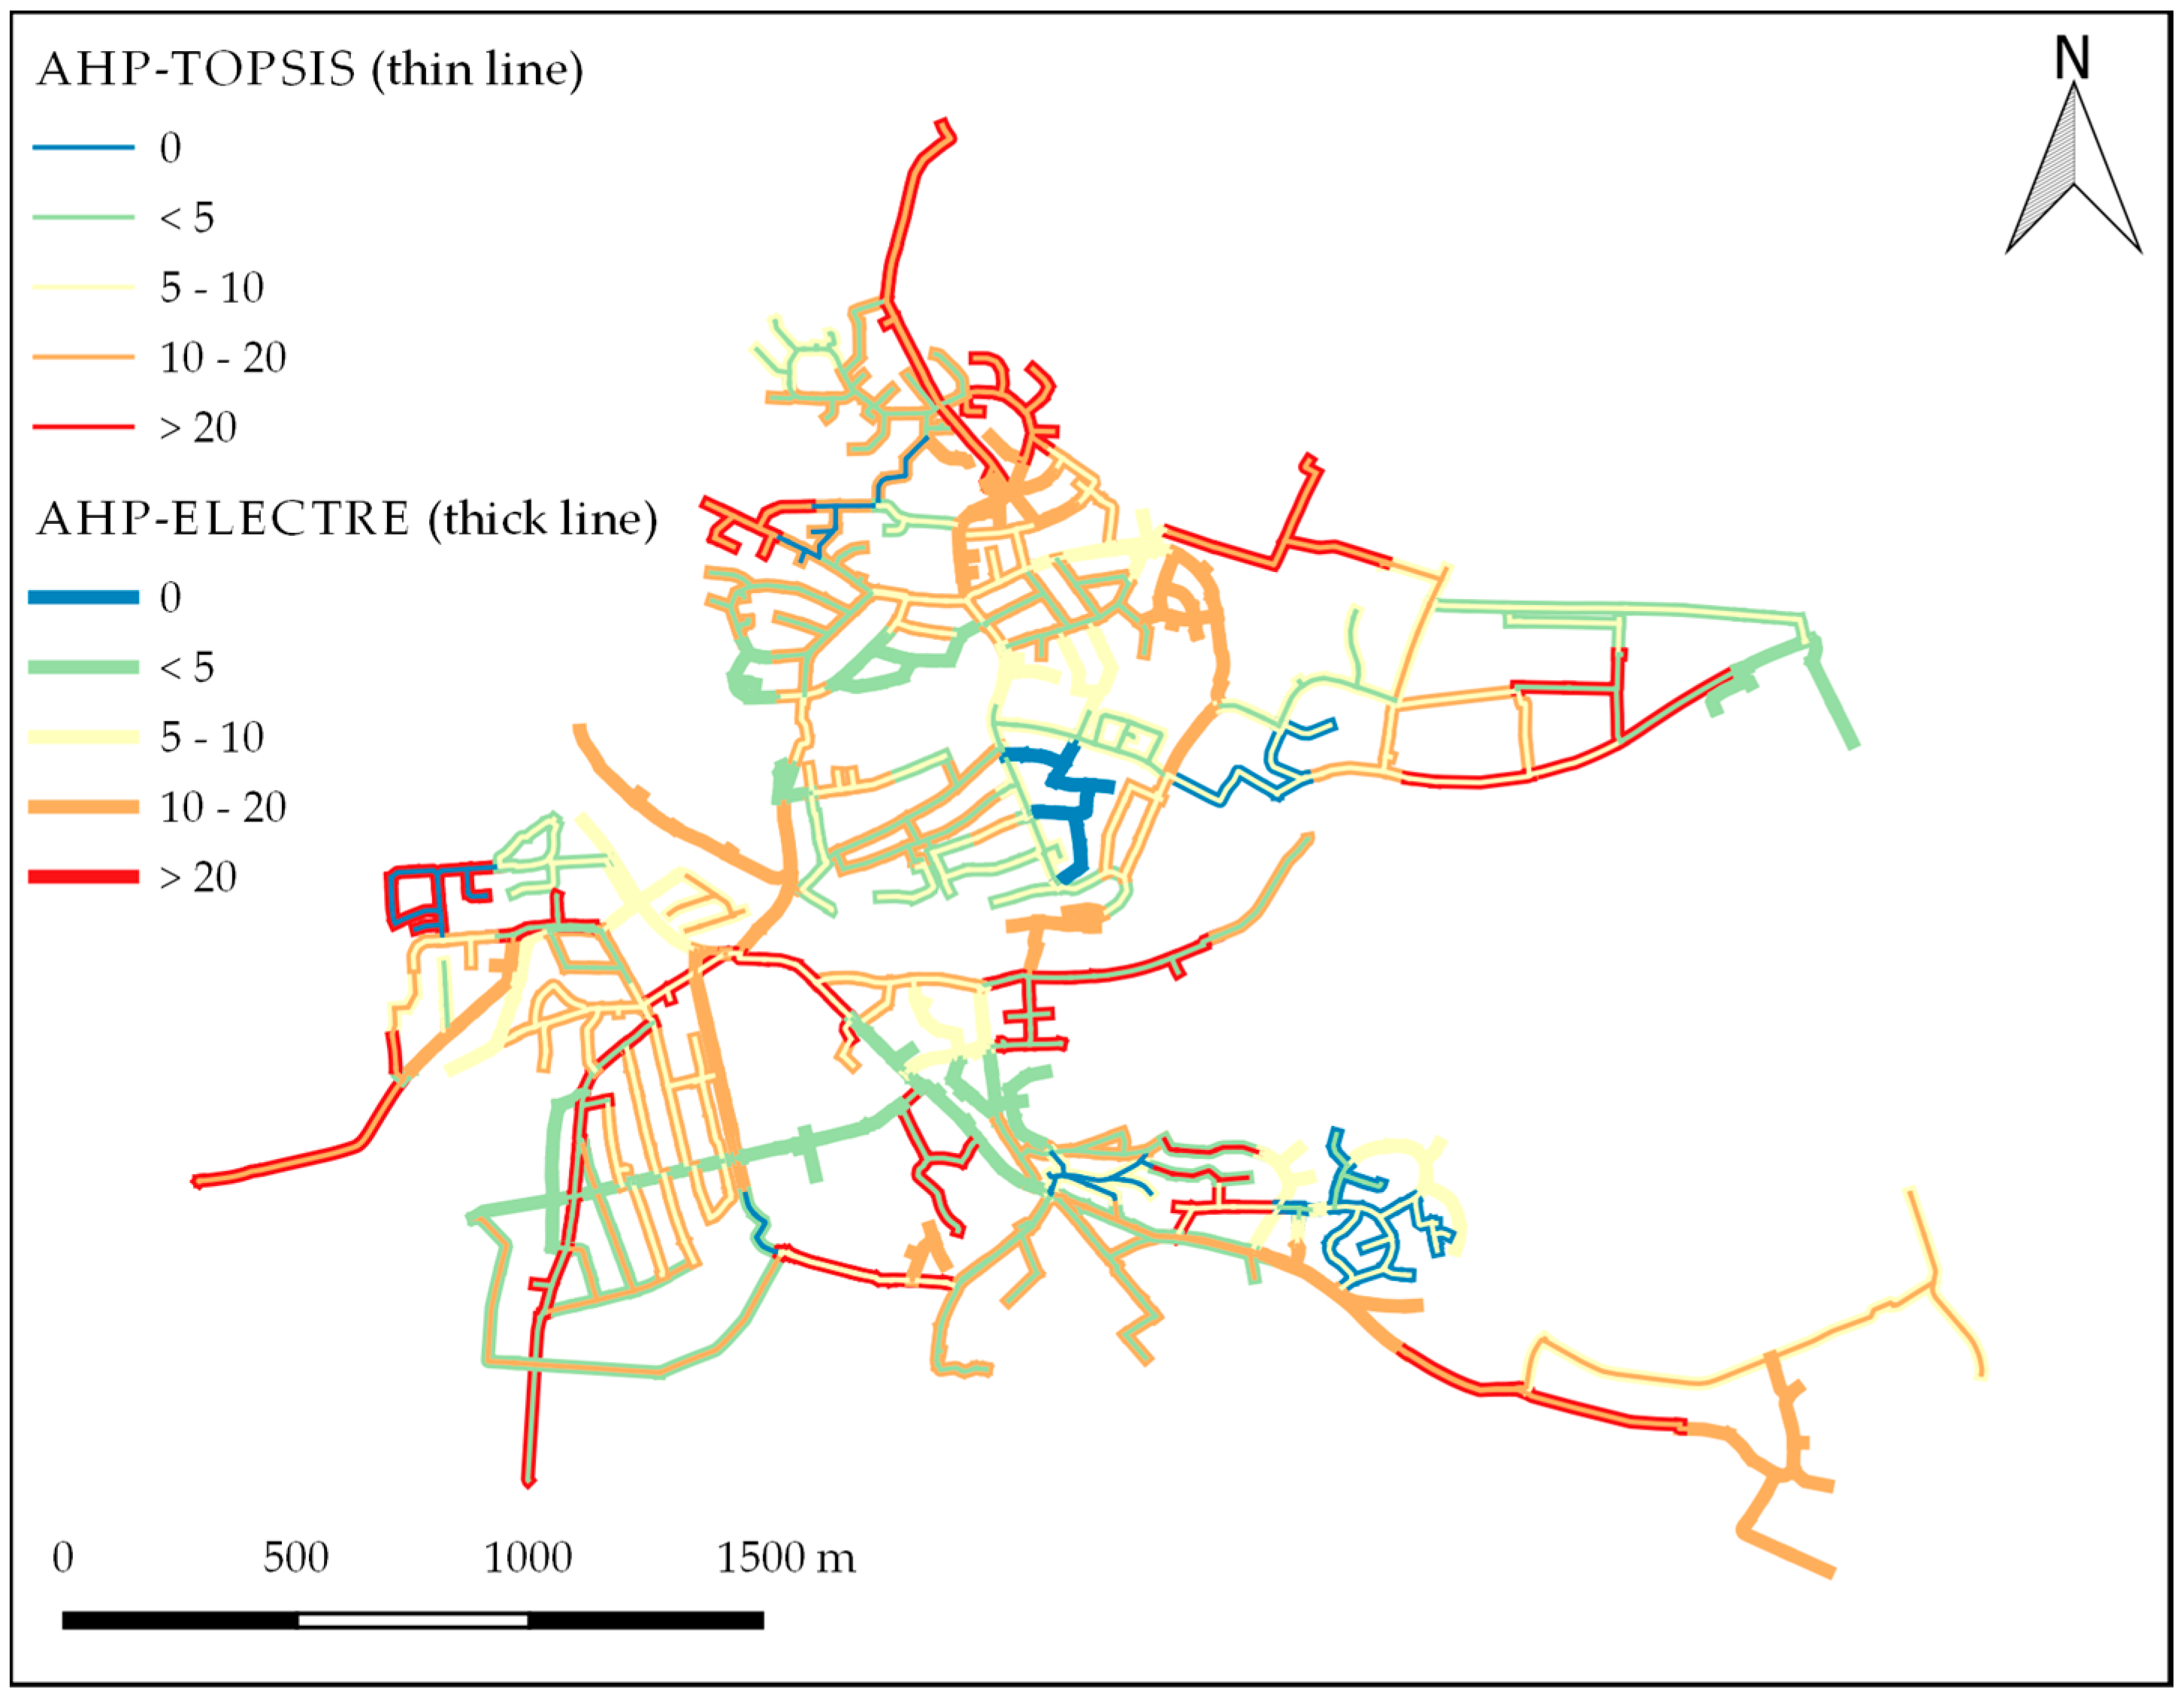
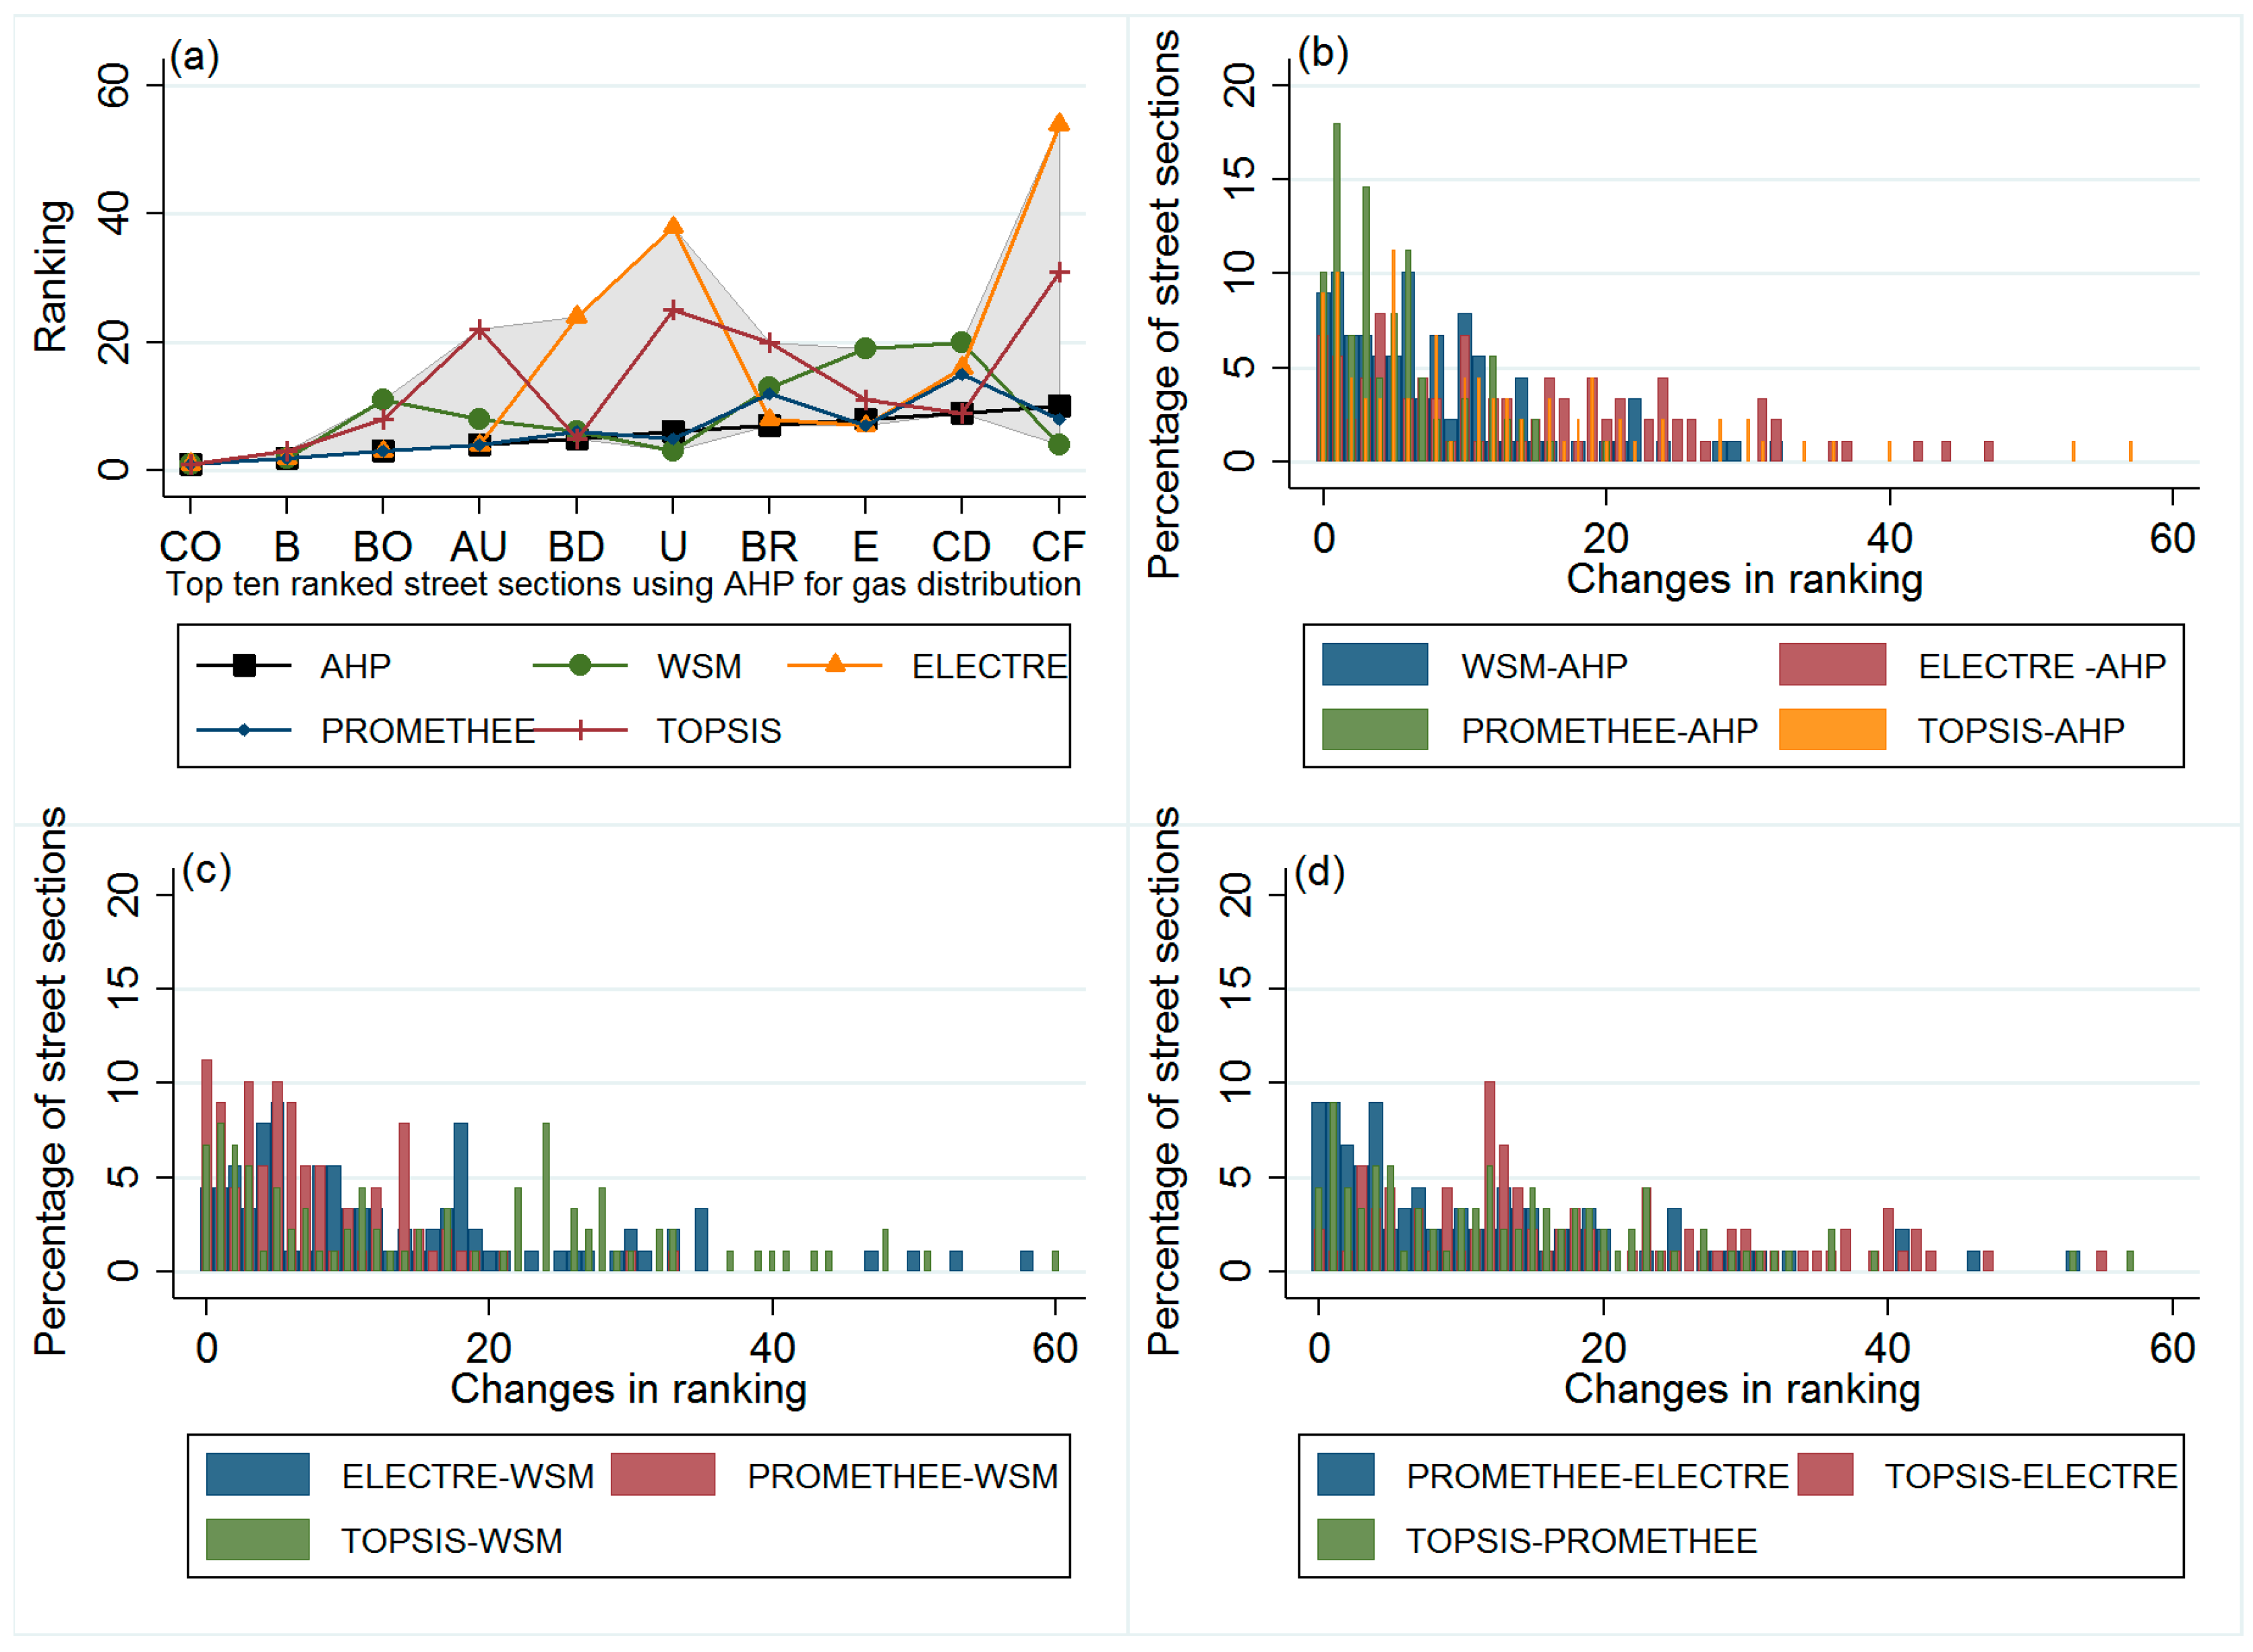
4.3. Gas Distribution Network
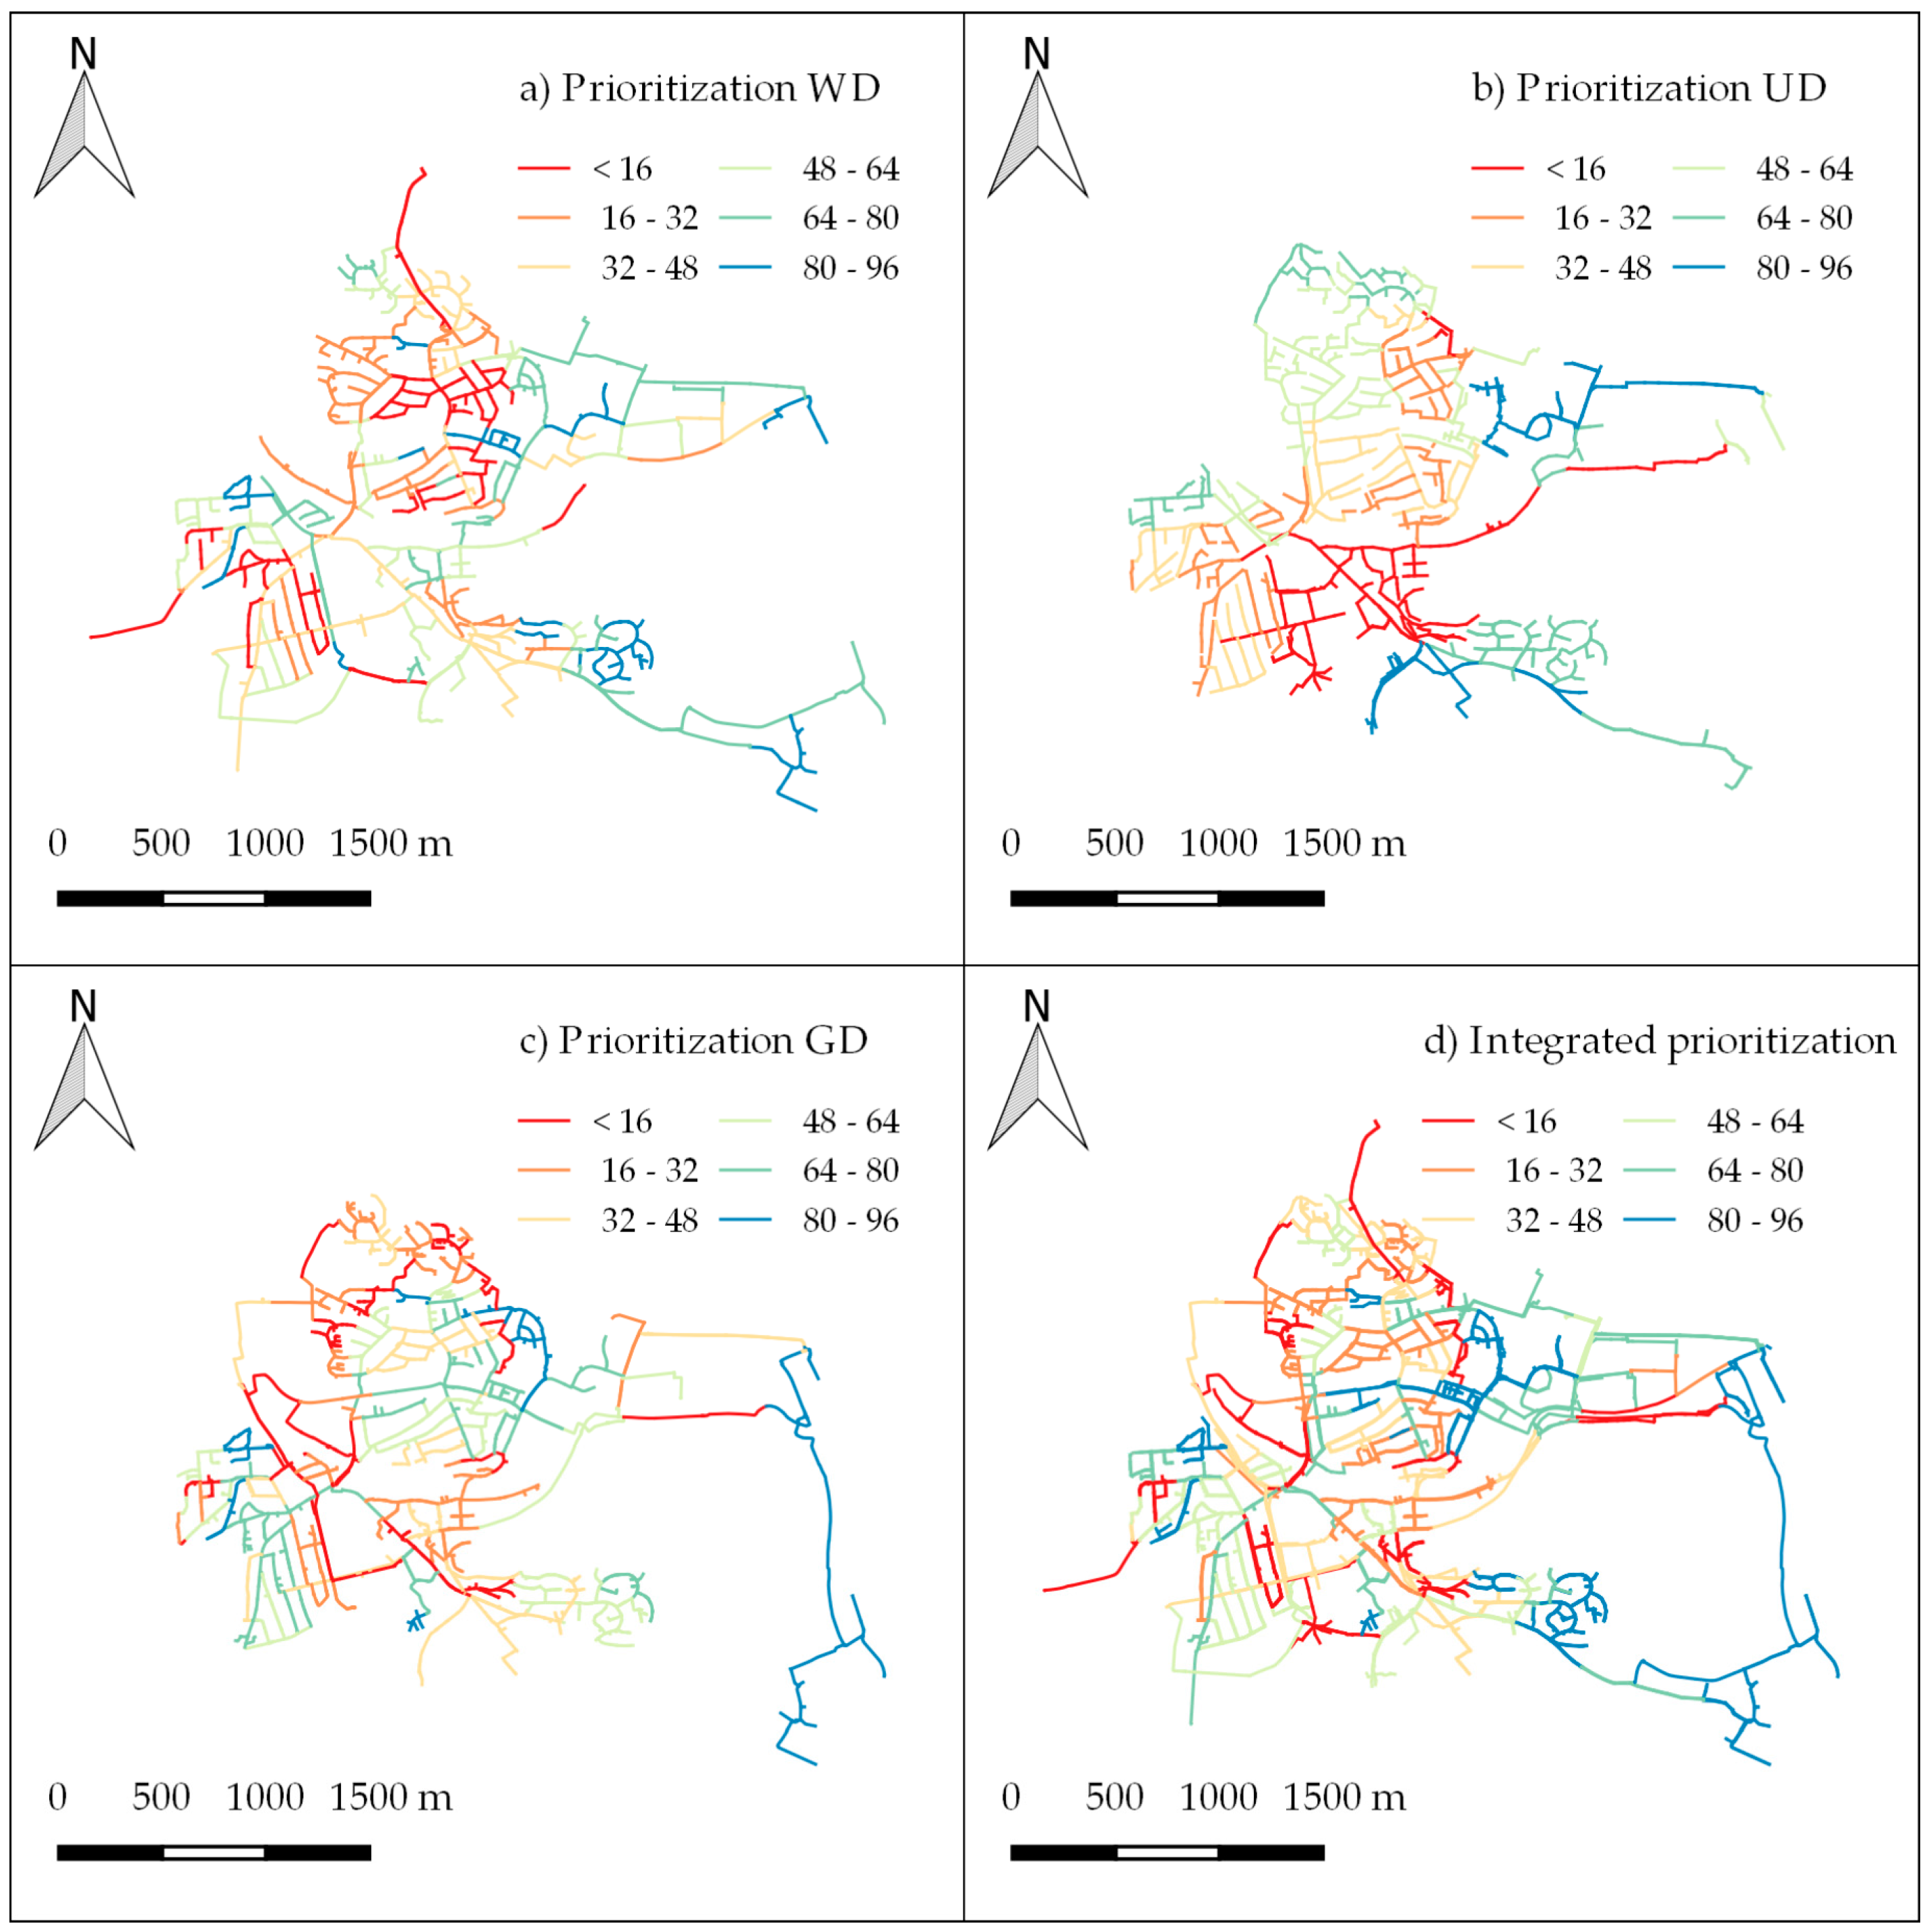
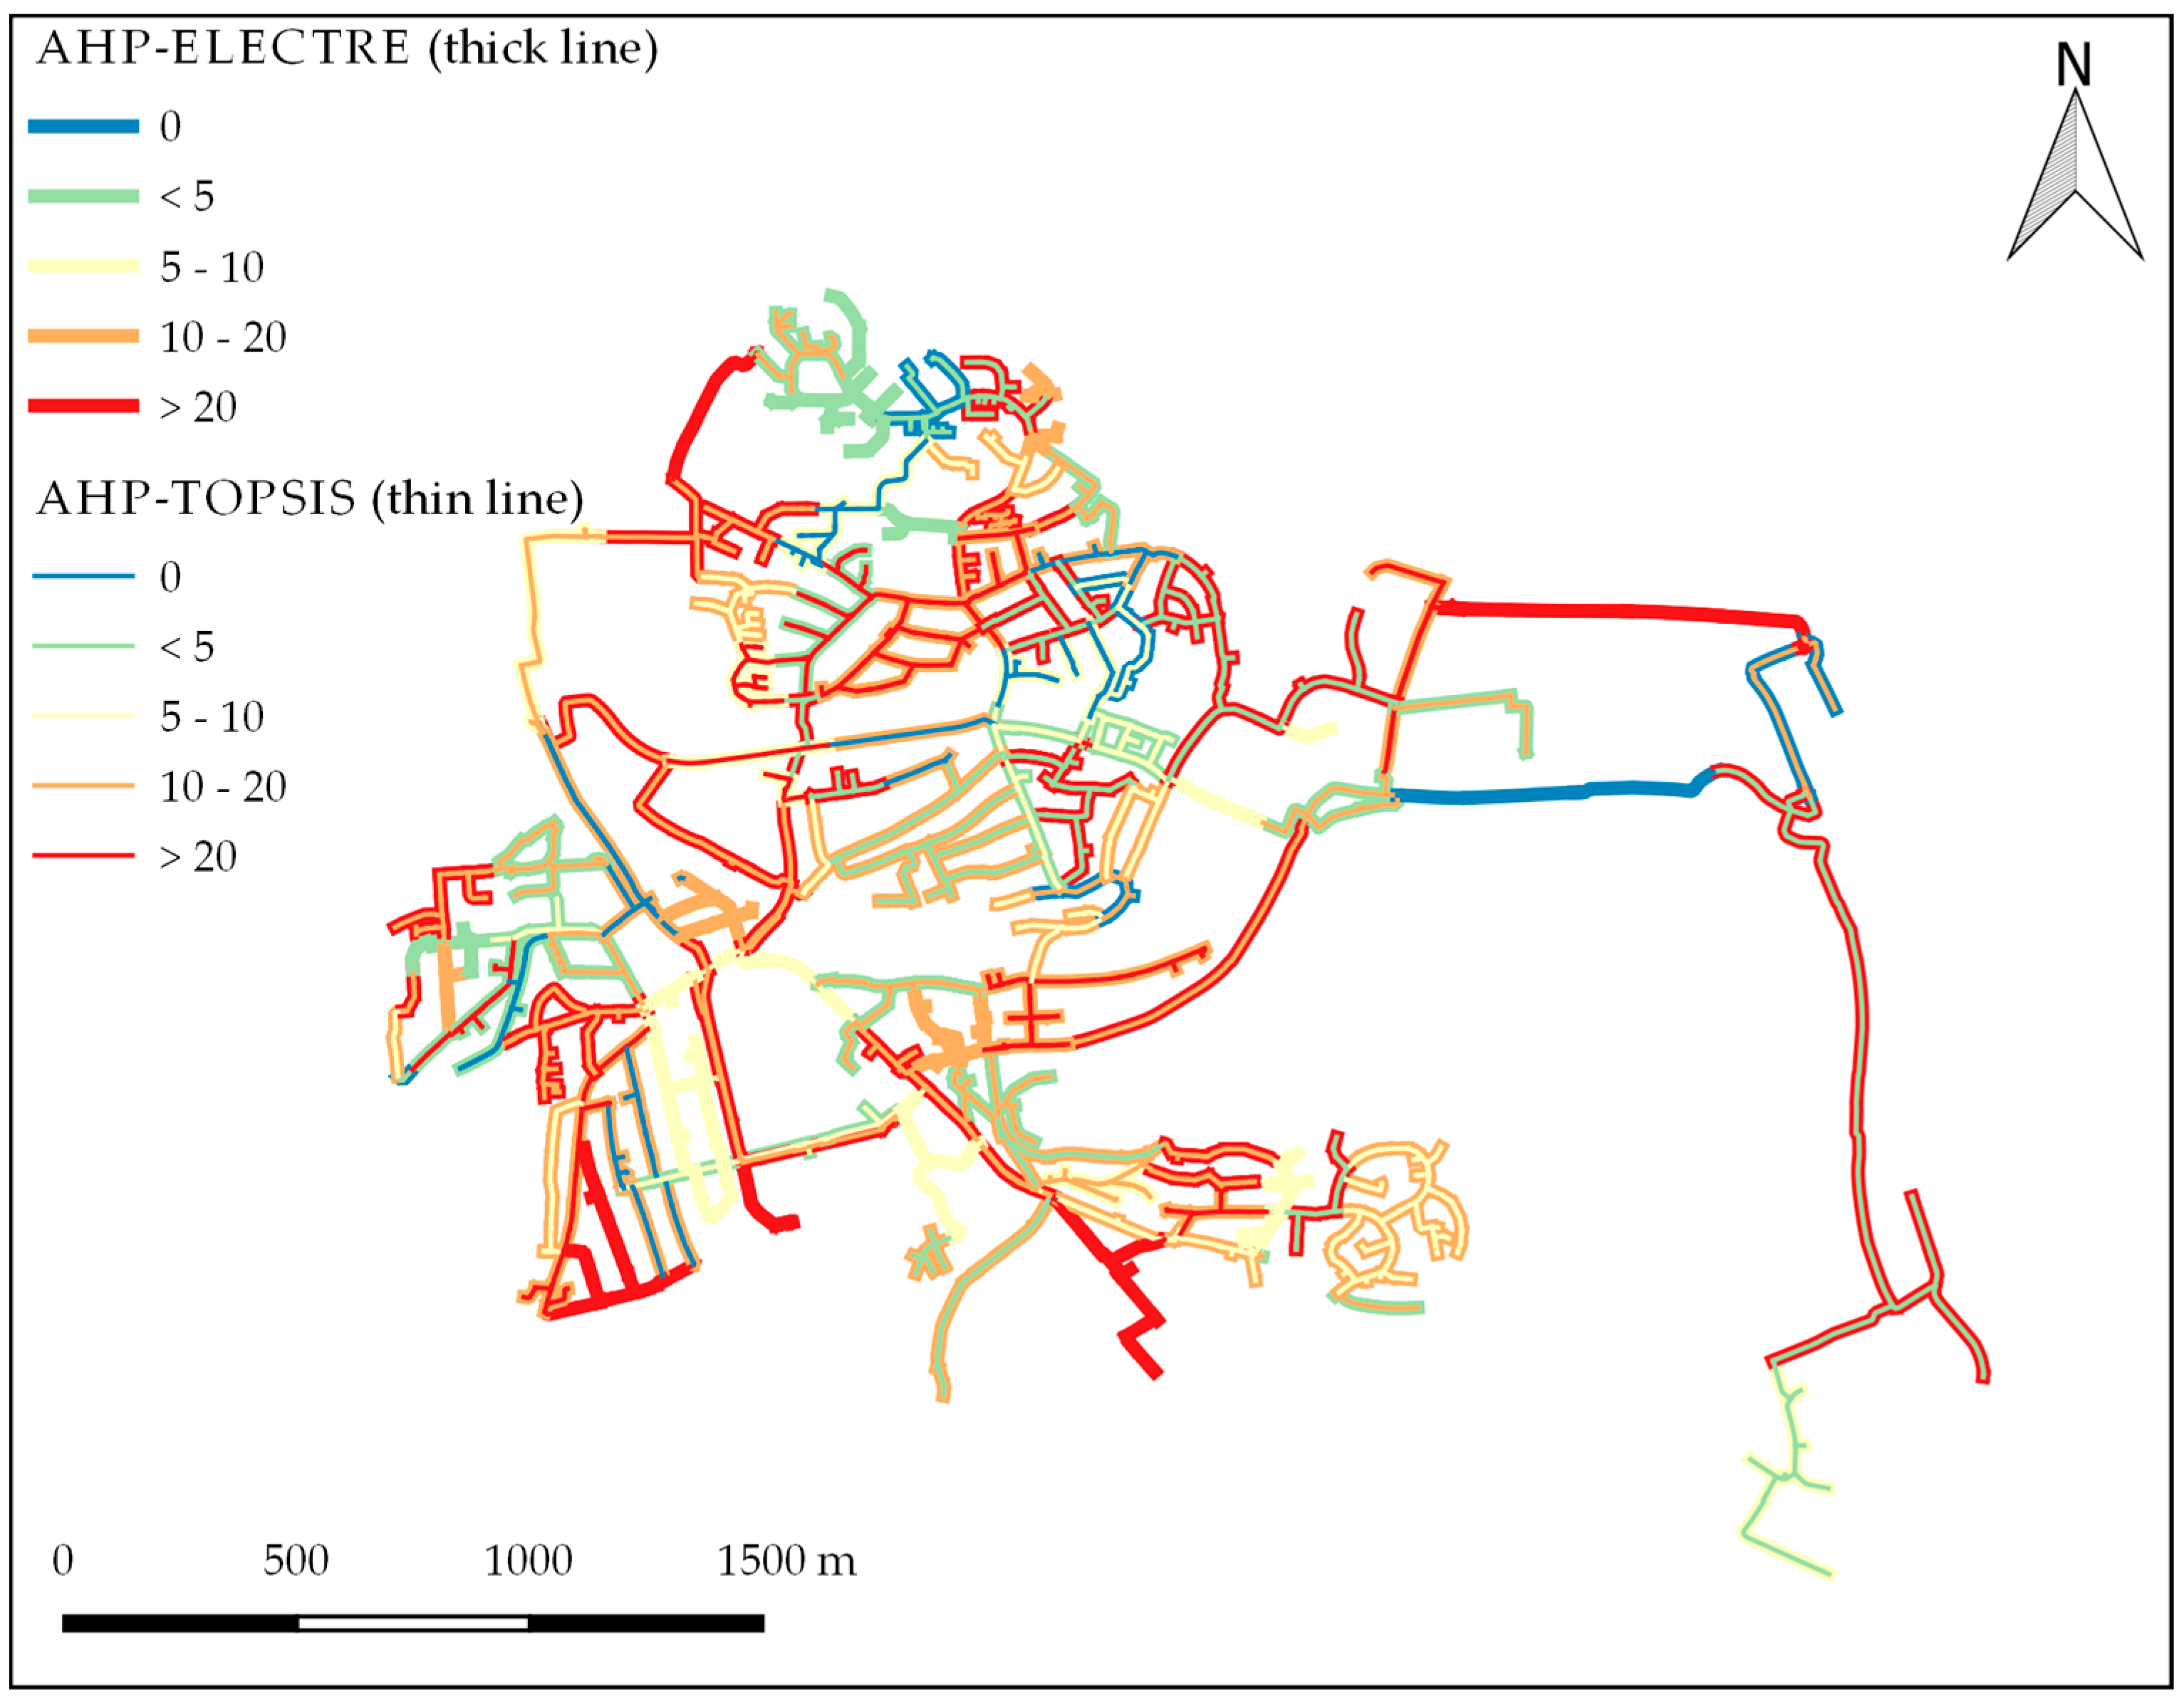
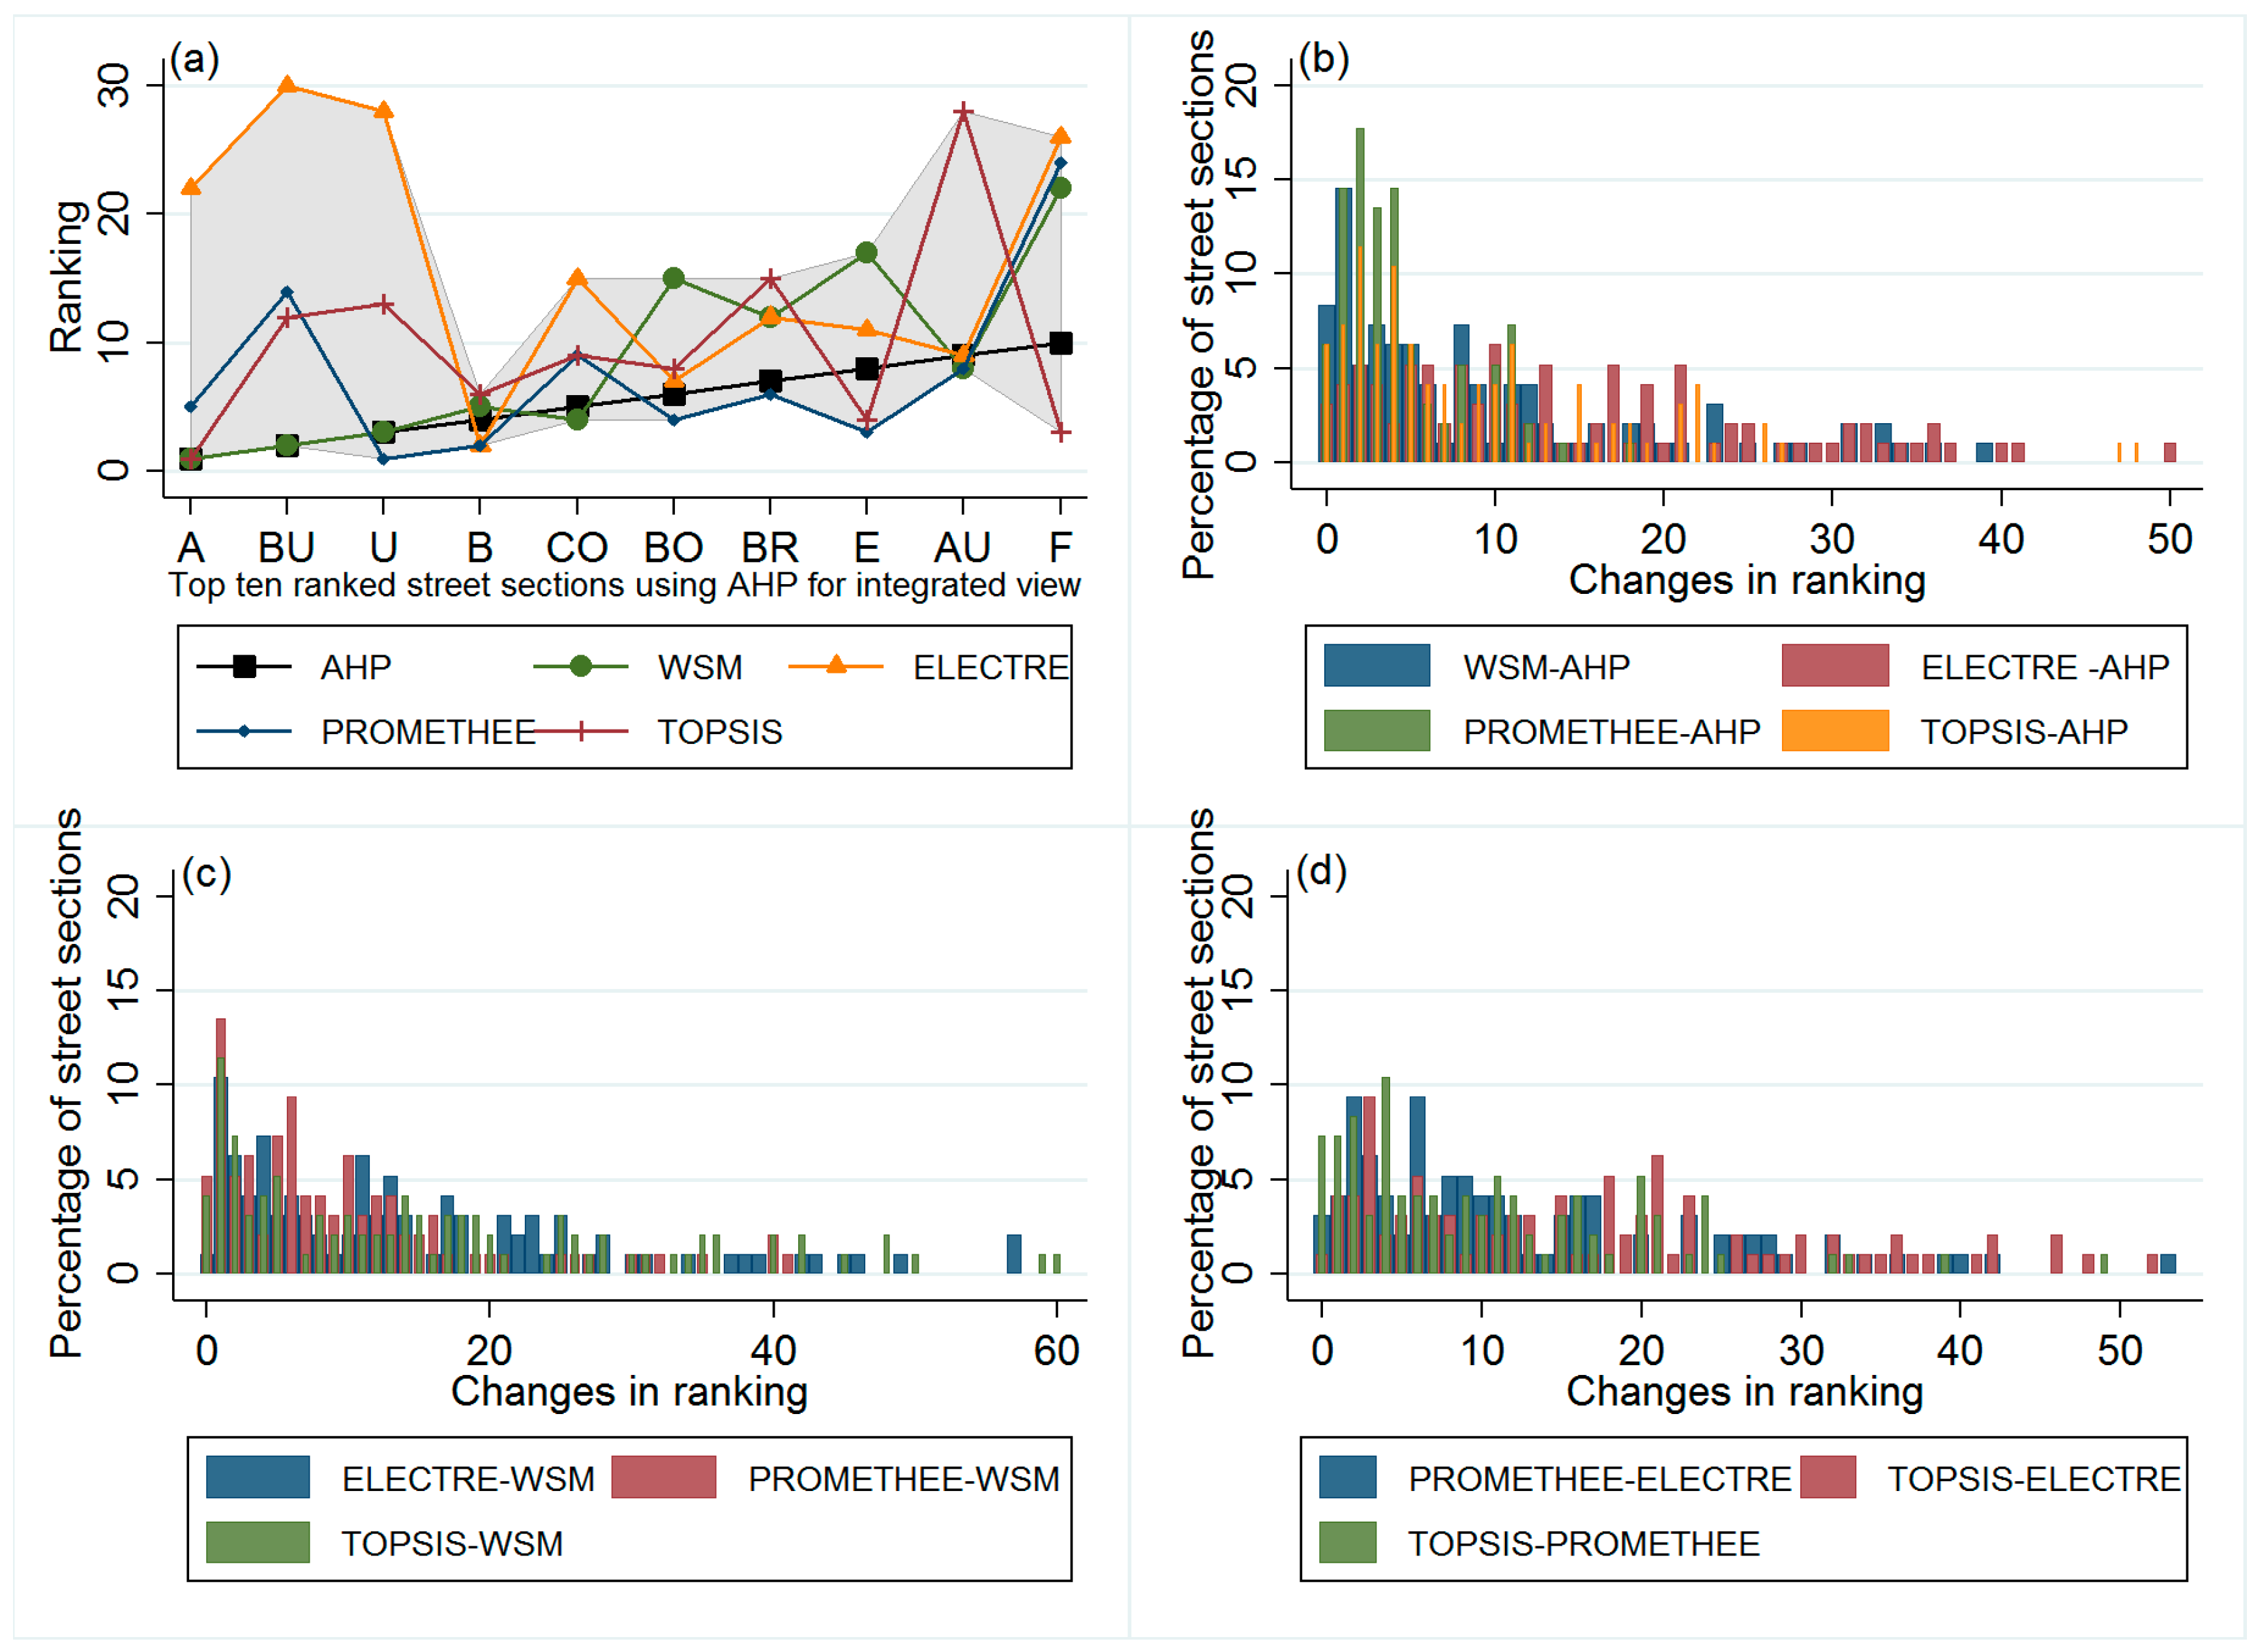
4.4. Integrated Prioritization
5. Conclusions
Acknowledgments
Author Contributions
Conflicts of Interest
References
- European Committee for Standardization. European Standard EN 752. Drain and Sewer Systems Outside Buildings; ICS 93.030; Comite Europeen de Normalisation (CEN): Brussels, Belgium, 2008. [Google Scholar]
- European Committee for Standardization. European Standard EN 805. Water Supply—Requirements for Systems and Components Outside Buildings; ICS 23.040.01; Comite Europeen de Normalisation (CEN): Brussels, Belgium, 2000. [Google Scholar]
- Casillas, M.; Garza-Castañón, L.; Puig, V. Optimal Sensor Placement for Leak Location in Water Distribution Networks using Evolutionary Algorithms. Water 2015, 7, 6496–6515. [Google Scholar] [CrossRef] [Green Version]
- Sörensen, J.; Persson, A.; Sternudd, C.; Aspegren, H.; Nilsson, J.; Nordström, J.; Jönsson, K.; Mottaghi, M.; Becker, P.; Pilesjö, P.; et al. Re-Thinking Urban Flood Management—Time for a Regime Shift. Water 2016, 8, 332. [Google Scholar] [CrossRef]
- Sægrov, S. (Ed.) Care-W: Computer Aided Rehabilitation of Water Networks; IWA Publishing: London, UK, 2005.
- Sægrov, S. (Ed.) Care-S: Computer Aided Rehabilitation of Sewer and Stormwater Networks; IWA Publishing: London, UK, 2006.
- Yoo, D.; Kang, D.; Jun, H.; Kim, J. Rehabilitation Priority Determination of Water Pipes Based on Hydraulic Importance. Water 2014, 6, 3864–3887. [Google Scholar] [CrossRef]
- Osman, H. Coordination of urban infrastructure reconstruction projects. Struct. Infrastruct. Eng. 2015, 12, 108–121. [Google Scholar] [CrossRef]
- Tscheikner-Gratl, F.; Sitzenfrei, R.; Rauch, W.; Kleidorfer, M. Integrated rehabilitation planning of urban infrastructure systems using a street section priority model. Urban Water J. 2016, 13, 28–40. [Google Scholar] [CrossRef]
- Tscheikner-Gratl, F.; Sitzenfrei, R.; Stibernitz, C.; Rauch, W.; Kleidorfer, M. Integrated rehabilitation management by prioritization of rehabilitation areas for small and medium sized municipalities. In Proceedings of the World Environmental and Water Resources Congress 2015: Floods, Droughts, and Ecosytems, Austin, TX, USA, 17–21 May 2015; Karvazy, K., Webster, V.L., Eds.; ASCE: Reston, VA, USA, 2015; pp. 2045–2057. [Google Scholar]
- Zavadskas, E.K.; Turskis, Z.; Kildienė, S. State of art surveys of overviews on MCDM/MADM methods. Technol. Econ. Dev. Econ. 2014, 20, 165–179. [Google Scholar] [CrossRef]
- Huang, I.B.; Keisler, J.; Linkov, I. Multi-criteria decision analysis in environmental sciences: Ten years of applications and trends. Sci. Total Environ. 2011, 409, 3578–3594. [Google Scholar] [CrossRef] [PubMed]
- Belton, V.; Stewart, T.J. Multiple Criteria Decision Analysis; Springer: Boston, MA, USA, 2002. [Google Scholar]
- Løken, E. Use of multicriteria decision analysis methods for energy planning problems. Renew. Sustain. Energy Rev. 2007, 11, 1584–1595. [Google Scholar] [CrossRef]
- Tscheikner-Gratl, F. Integrated Approach for Multi-Utility Rehabilitation Planning of Urban Water Infrastructure: Focus on Small and Medium Sized Municipalities. Ph.D. Thesis, University Innsbruck, Innsbruck, Austria, 2016. [Google Scholar]
- Kabir, G.; Sadiq, R.; Tesfamariam, S. A review of multi-criteria decision-making methods for infrastructure management. Struct. Infrastruct. Eng. 2014, 10, 1176–1210. [Google Scholar] [CrossRef]
- Mardani, A.; Jusoh, A.; MD Nor, K.; Khalifah, Z.; Zakwan, N.; Valipour, A. Multiple criteria decision-making techniques and their applications—A review of the literature from 2000 to 2014. Econ. Res.-Ekon. Istraž. 2015, 28, 516–571. [Google Scholar] [CrossRef]
- Brownlee, T.J.; Finnie, S.; Wightman, D. Identification of potential highways maintenance schemes. Proc. Inst. Civ. Eng.-Transp. 2007, 160, 139–146. [Google Scholar] [CrossRef]
- Tzeng, G.-H.; Huang, J.-J. Multiple Attribute Decision Making: Methods and Appliations; CRC Press: Boca Raton, FL, USA, 2011. [Google Scholar]
- Saaty, T.L. Multicriteria Decision Making: The Analytic Hierarchy Process; Planning, Priority Setting, Resource Allocation, 2nd ed.; McGraw-Hill: New York, NY, USA, 1988. [Google Scholar]
- Macharis, C.; Springael, J.; de Brucker, K.; Verbeke, A. PROMETHEE and AHP: The design of operational synergies in multicriteria analysis. Eur. J. Oper. Res. 2004, 153, 307–317. [Google Scholar] [CrossRef]
- Al-Barqawi, H.; Zayed, T. Infrastructure Management: Integrated AHP/ANN Model to Evaluate Municipal Water Mains’ Performance. J. Infrastruct. Syst. 2008, 14, 305–318. [Google Scholar] [CrossRef]
- Birgani, Y.T.; Yazdandoost, F.; Dehlavi, E. Integrated Approach in Spatial Priority of Urban Areas for Implementation of Urban Drainage Plans Using Analytic Hierarchy Process and GIS for 22nd Municipal District of Tehran, Iran. In Proceedings of the 13th International Conference on Urban Drainage, Sarawak, Malaysia, 7–12 September 2014.
- Sabzi, H.Z.; King, J.P. Numerical Comparison of Multi-criteria Decision-making Techniques: A Simulation on Flood Management Multi-criteria Systems. In Proceedings of the World Environmental and Water Resources Congress 2015: Floods, Droughts, and Ecosytems, Austin, TX, USA, 17–21 May 2015; Karvazy, K., Webster, V.L., Eds.; ASCE: Reston, VA, USA, 2015. [Google Scholar]
- Lee, J.H.; Baek, C.W.; Kim, J.H.; Jun, H.D.; Jo, D.J. Development of a Decision Making Support System for Efficient Rehabilitation of Sewer Systems. Water Resour. Manag. 2009, 23, 1725–1742. [Google Scholar] [CrossRef]
- Young, K.D.; Younos, T.; Dymond, R.L.; Kibler, D.F.; Lee, D.H. Application of the Analytic Hierarchy Process for Selecting and Modeling Stormwater Best Management Practices. J. Contemp. Water Res. Educ. 2010, 146, 50–63. [Google Scholar] [CrossRef]
- Feizizadeh, B.; Jankowski, P.; Blaschke, T. A Spatially Explicit Approach for Sensitivity and Uncertainty Analysis of GIS-Multicriteria Landslide Susceptibility Mapping. In GI_Forum 2013—Creating the GISociety; Jekel, T., Car, A., Strobl, J., Griesebner, G., Eds.; ÖAW Verlag: Vienna, Austria, 2013; pp. 157–164. [Google Scholar]
- Feizizadeh, B.; Omrani, K.; Aghdam, F.B. Fuzzy Analytical Hierarchical Process and Spatially Explicit Uncertainty Analysis Approach for Multiple Forest Fire Risk Mapping. GI-Forum 2015, 1, 72–80. [Google Scholar] [CrossRef]
- Benayoun, R.; Roy, B.; Sussman, N. Manual de Reference du Programme Electre; SEMA: Paris, France, 1966. [Google Scholar]
- Mardani, A.; Jusoh, A.; Zavadskas, E.K. Fuzzy multiple criteria decision-making techniques and applications—Two decades review from 1994 to 2014. Expert Syst. Appl. 2015, 42, 4126–4148. [Google Scholar] [CrossRef]
- Govindan, K.; Jepsen, M.B. ELECTRE: A comprehensive literature review on methodologies and applications. Eur. J. Oper. Res. 2016, 250, 1–29. [Google Scholar] [CrossRef]
- Baur, R.; Herz, R.; Kropp, I. WP6—Multi—Criteria Decision Support: WP6 Conclusive Report; CARE-S Computer Aided REhabilitation of Sewer networks: Dresden, Germany, 2005. [Google Scholar]
- Carrico, N.; Covas, D.I.C.; Almeida, M.C.; Leitao, J.P.; Alegre, H. Prioritization of rehabilitation interventions for urban water assets using multiple criteria decision-aid methods. Water Sci. Technol. J. Int. Assoc. Water Pollut. Res. 2012, 66, 1007–1014. [Google Scholar] [CrossRef] [PubMed]
- Moura, P.M.; Baptista, M.B.; Barraud, S. Comparison between two methodologies for urban drainage decision aid. Water Sci. Technol. 2006, 54, 493. [Google Scholar] [CrossRef] [PubMed]
- Martin, C.; Ruperd, Y.; Legret, M. Urban stormwater drainage management: The development of a multicriteria decision aid approach for best management practices. Eur. J. Oper. Res. 2007, 181, 338–349. [Google Scholar] [CrossRef]
- Haider, H.; Sadiq, R.; Tesfamariam, S. Selecting performance indicators for small and medium sized water utilities: Multi-criteria analysis using ELECTRE method. Urban Water J. 2013, 12, 305–327. [Google Scholar] [CrossRef]
- Morais, D.C.; Almeida, A.T. Water supply system decision making using multicriteria analysis. Water SA 2007, 32, 229–236. [Google Scholar] [CrossRef]
- Le Gauffre, P.; Haidar, H.; Poinard, D.; Laffréchine, K.; Baur, R.; Schiatti, M. A Multicriteria Decision Support Methodology for Annual Rehabilitation Programs of Water Networks. Comput.-Aided Civ. Eng. 2007, 22, 478–488. [Google Scholar] [CrossRef]
- Trojan, F.; Morais, D.C. Prioritising alternatives for maintenance of water distribution networks: A group decision approach. Water SA 2012, 38. [Google Scholar] [CrossRef]
- Buchanan, J.; Vanderpooten, D. Ranking projects for an electricity utility using ELECTRE III. Int. Trans. Oper. Res. 2007, 14, 309–323. [Google Scholar] [CrossRef]
- Pires, A.; Chang, N.-B.; Martinho, G. An AHP-based fuzzy interval TOPSIS assessment for sustainable expansion of the solid waste management system in Setúbal Peninsula, Portugal. Resour. Conserv. Recycl. 2011, 56, 7–21. [Google Scholar] [CrossRef]
- Brans, J.-P.; Mareschal, B. The PROMCALC & GAIA decision support system for multicriteria decision aid. Decis. Support Syst. 1994, 12, 297–310. [Google Scholar]
- Behzadian, M.; Kazemzadeh, R.B.; Albadvi, A.; Aghdasi, M. PROMETHEE: A comprehensive literature review on methodologies and applications. Eur. J. Oper. Res. 2010, 200, 198–215. [Google Scholar] [CrossRef]
- Brans, J.P. L’ingénièrie de la décision; Elaboration d’instruments d’aide à la décision. La méthode PROMETHEE. In L’aide à la Décision: Nature, Instruments et Perspectives d’Avenir; Nadeau, R., Landry, M., Eds.; Presses de l’Université Laval: Ville de Québec, QC, Canada, 1982; pp. 183–213. [Google Scholar]
- Brans, J.P.; Vincke, P. A Preference Ranking Organisation Method: (The PROMETHEE Method for Multiple Criteria Decision-Making). Manag. Sci. 1985, 31, 647–656. [Google Scholar] [CrossRef]
- Gervásio, H.; Simões da Silva, L. A probabilistic decision-making approach for the sustainable assessment of infrastructures. Expert Syst. Appl. 2012, 39, 7121–7131. [Google Scholar] [CrossRef]
- Churchman, C.W.; Ackoff, R.L.; Smith, N.M. An Approximate Measure of Value. J. Oper. Res. Soc. Am. 1954, 2, 172–187. [Google Scholar] [CrossRef]
- Tscheikner-Gratl, F.; Sitzenfrei, R.; Hammerer, M.; Rauch, W.; Kleidorfer, M. Prioritization of Rehabilitation Areas for Urban Water Infrastructure. A Case Study. Procedia Eng. 2014, 89, 811–816. [Google Scholar] [CrossRef]
- Kolios, A.; Mytilinou, V.; Lozano-Minguez, E.; Salonitis, K. A Comparative Study of Multiple-Criteria Decision-Making Methods under Stochastic Inputs. Energies 2016, 9, 566. [Google Scholar] [CrossRef]
- Coutinho-Rodrigues, J.; Simão, A.; Antunes, C.H. A GIS-based multicriteria spatial decision support system for planning urban infrastructures. Decis. Support Syst. 2011, 51, 720–726. [Google Scholar] [CrossRef]
- Ochs, C.-P. Multikriterielle Optimierung der Sanierungsplanung von Entwässerungsnetzen. Ph.D. Thesis, Technische Universität Kaiserslautern, Kaiserslautern, Germany, 2012. [Google Scholar]
- Triantaphyllou, E.; Sánchez, A. A Sensitivity Analysis Approach for Some Deterministic Multi-Criteria Decision-Making Methods. Decis. Sci. 1997, 28, 151–194. [Google Scholar] [CrossRef]
- Hwang, C.L.; Yoon, K. Multiple Attribute Decision Making: Methods and Applications A State-of-the-Art Survey; Springer: Berlin/Heidelberg, Germany, 1981. [Google Scholar]
- Behzadian, M.; Khanmohammadi Otaghsara, S.; Yazdani, M.; Ignatius, J. A state-of the-art survey of TOPSIS applications. Expert Syst. Appl. 2012, 39, 13051–13069. [Google Scholar] [CrossRef]
- Rao, R.V. Decision Making in the Manufacturing Environment: Using Graph Theory and Fuzzy Multiple Attribute Decision Making Methods; Springer: London, UK, 2007. [Google Scholar]
- Alegre, H.; Coelho, S.T. Infrastructure Asset Management of Urban Water Systems. In Water Supply System Analysis—Selected Topics; Ostfeld, A., Ed.; Intech: Rijeka, Croatia, 2012; pp. 49–73. [Google Scholar]
- Baker, D.; Bridge, D.; Hunter, R.; Johnon, G.; Krupa, J.; Murphy, J.; Sorenson, K. Guidebook to Decision Making Methods; United States Department of Energy: Washington, DC, USA, 2001.
- Van Riel, W.; van Bueren, E.; Langeveld, J.; Herder, P.; Clemens, F. Decision-making for sewer asset management: Theory and practice. Urban Water J. 2015, 13, 57–68. [Google Scholar] [CrossRef]
- Van Riel, W.; Langeveld, J.G.; Herder, P.M.; Clemens, F. Intuition and information in decision-making for sewer asset management. Urban Water J. 2013, 11, 506–518. [Google Scholar] [CrossRef]
- Tscheikner-Gratl, F.; Sitzenfrei, R.; Rauch, W.; Kleidorfer, M. Enhancement of limited water supply network data for deterioration modelling and determination of rehabilitation rate. Struct. Infrastruct. Eng. 2016, 12, 366–380. [Google Scholar] [CrossRef]
- Österreichischer Wasser- und Abfallwirtschaftsverband. ÖWAV-Regelblatt 40/ÖVGW Richtlinie W 104: Leitungsinformationssystem; Wasser und Abwasser: Vienna, Austria, 2010. [Google Scholar]
- Deutsche Vereinigung für Wasserwirtschaft. DWA-Merkblatt DWA-M 149-3. DWA-M 149-3: Zustandserfassung und -Beurteilung von Entwässerungssystemen außerhalb von Gebäuden—Teil 3: Zustandsklassifizierung und -Bewertung; Abwasser und Abfall e.V.: Hennef, Germany, 2007. [Google Scholar]
- Ariaratnam, S.T.; El-Assaly, A.; Yang, Y. Assessment of Infrastructure Inspection Needs Using Logistic Models. J. Infrastruct. Syst. 2001, 7, 160–165. [Google Scholar] [CrossRef]
- Ahmadi, M.; Cherqui, F.; de Massiac, J.-C.; Le Gauffre, P. Influence of available data on sewer inspection program efficiency. Urban Water J. 2013, 11, 641–656. [Google Scholar] [CrossRef]
- Bundesministerium für Verkehr, Bau und Stadtentwicklung. Arbeitshilfen Abwasser—Planung, Bau und Betrieb von abwassertechnischen Anlagen in Liegenschaften des Bundes. 2015. Available online: http://www.arbeitshilfen-abwasser.de/html/index.html (accessed on 24 October 2016).
- Deutsche Vereinigung für Wasserwirtschaft, Abwasser und Abfall e.V. Arbeitsblatt DWA-A 118: Hydraulische Bemessung und Nachweis von Entwässerungssystemen; DWA: Hennef, Germany, 2006. [Google Scholar]
- Wolf, M.; Braunschmidt, S.; Rabe, T.; Sympher, K.J. KANSAS Verbundvorhaben—Entwicklung Einer Ganzheitlichen Kanalsanierungsstrategie für Stadtentwässerungsnetze Deutschlands; Leitfaden: München, Germany, 2005. [Google Scholar]
- Bund/Länder-Arbeitsgemeinschaft Wasser (LAWA). Leitlinien zur Durchführung Dynamischer Kostenvergleichsrechnungen (KVR-Leitlinien), 8th ed.; DWA: Hennef, Germany, 2012. [Google Scholar]
- Mareschal, B. Weight stability intervals in multicriteria decision aid. Eur. J. Oper. Res. 1988, 33, 54–64. [Google Scholar] [CrossRef]
- Tscheikner-Gratl, F.; Sitzenfrei, R.; Kohl, B.; Pümpel, T.; Klebinder, K.; Ebner, C.; Leonhartsberger, C.; Knapp, A.; Rauch, W. An Integrated Approach to Identify the Most Efficient Solutions for the Landfill Leachate Problem. In World Environmental and Water Resources Congress 2016; Pathak, C.S., Reinhart, D., Eds.; ASCE Press: Reston, VA, USA, 2016; pp. 11–22. [Google Scholar]
- Huang, J.-J.; Tzeng, G.-H.; Liu, H.-H. A Revised VIKOR Model for Multiple Criteria Decision Making—The Perspective of Regret Theory. In Cutting-Edge Research Topics on Multiple Criteria Decision Making; Shi, Y., Wang, S., Peng, Y., Li, J., Zeng, Y., Eds.; Springer: Berlin/Heidelberg, Germany, 2009; pp. 761–768. [Google Scholar]
- Cheng, S.; Chan, C.W.; Huang, G.H. Using multiple criteria decision analysis for supporting decisions of solid waste management. J. Environ. Sci. Health A 2002, 37, 975–990. [Google Scholar] [CrossRef]
- Osman, H.; Bainbridge, K. Comparison of Statistical Deterioration Models for Water Distribution Networks. J. Perform. Constr. Facil. 2011, 25, 259–266. [Google Scholar] [CrossRef]


| Pipe Level | Street Level | ||||||
|---|---|---|---|---|---|---|---|
| Condition | Importance | ||||||
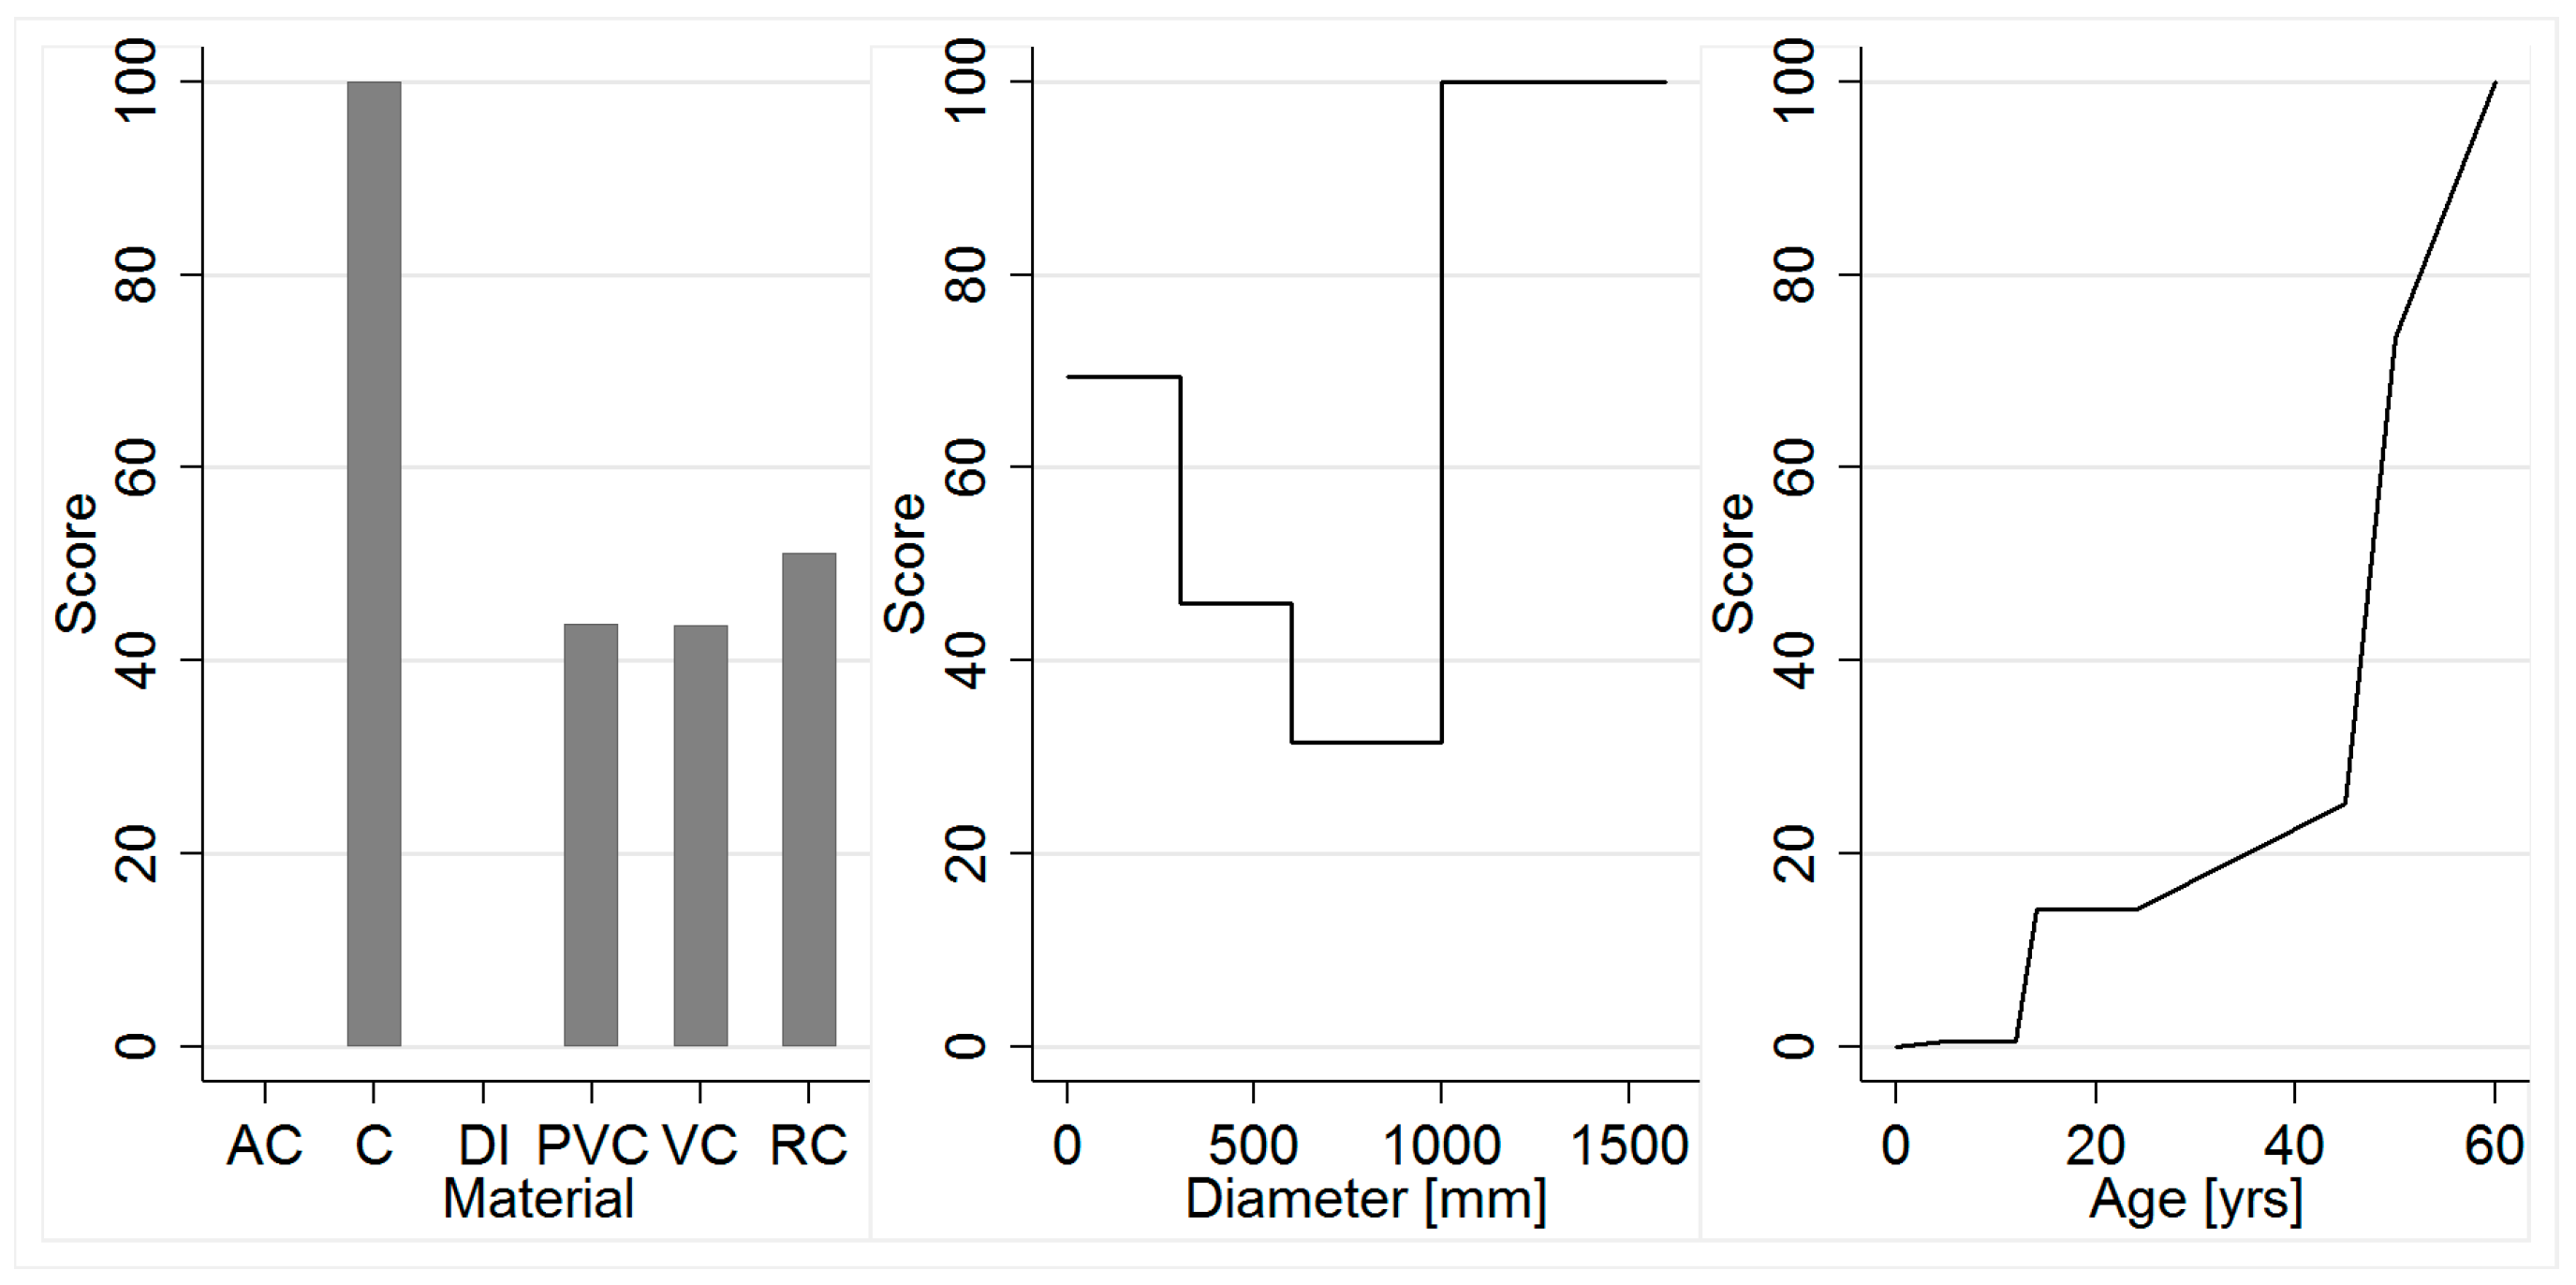
| Material 1 | Diameter DN (m) | Age (Years) | Hydraulic Capacity (%) | Pipe Type 2 | Economics | House Connections | Manholes |
| AC C DI PVC VC RC | 250–1600 | 0–60 | ≤50 50–100 100–150 150–200 >200 No data | WW CS SW | Depreciation derived from age | Number of house connections per m sewer | Number of manholes per m sewer |
| Pipe Level | Street Level | |||||||
|---|---|---|---|---|---|---|---|---|
| Condition | Importance | |||||||
| Material 1 | Diameter DN (mm) | Age (Years) | Nominal Pressure (Bar) | Pipe Type 2 | Economics | House Connections | Valves | Hydrant |
| CI DI PE PVC ST | 20–300 | 0–92 | 6 10 16 | HC DP | Depreciation derived from age | Number of house connections per m distribution pipe | Number of valves per m distribution pipe | Number of hydrants per m distribution pipe |
| Pipe Level | Street Level | ||||||
|---|---|---|---|---|---|---|---|
| Condition | Importance | ||||||
| Material 1 | Diameter DN (mm) | Age (Years) | Nominal Pressure | Pipe Type 2 | Economics | House Connections | Valves |
| PE ST | 20–250 | 0–50 | High, low, medium | HC DP | Depreciation derived from Age | Number of house connections per m sewer | Number of valves per m distribution pipe |
| wl | All Experts | Consistent Experts | |||||||||
|---|---|---|---|---|---|---|---|---|---|---|---|
| 1 | σ 2 | Min | Max | Range | 1 | σ 2 | Min | Max | Range | ||
| WSM | Condition | 0.44 | 0.08 | 0.28 | 0.50 | 0.22 | 0.50 | - | 0.50 | 0.50 | - |
| Importance | 0.34 | 0.05 | 0.28 | 0.44 | 0.17 | 0.32 | 0.02 | 0.28 | 0.33 | 0.06 | |
| Economics | 0.21 | 0.05 | 0.17 | 0.28 | 0.11 | 0.18 | 0.02 | 0.17 | 0.22 | 0.06 | |
| AHP | Condition | 0.59 | 0.18 | 0.24 | 0.73 | 0.49 | 0.70 | 0.04 | 0.64 | 0.73 | 0.09 |
| Importance | 0.32 | 0.17 | 0.19 | 0.67 | 0.48 | 0.21 | 0.03 | 0.19 | 0.26 | 0.07 | |
| Economics | 0.09 | 0.02 | 0.07 | 0.11 | 0.05 | 0.08 | 0.01 | 0.07 | 0.10 | 0.04 | |
| σ | AHP | WSM | ELECTRE | PROMETHEE | TOPSIS |
|---|---|---|---|---|---|
| AHP | - | 2.94 | 6.00 | 3.30 | 2.81 |
| WSM | - | 4.72 | 4.38 | 4.27 | |
| ELECTRE | symmetric | - | 5.10 | 7.10 | |
| PROMETHEE | - | 4.31 | |||
| TOPSIS | - |
| σ | AHP | WSM | ELECTRE | PROMETHEE | TOPSIS |
|---|---|---|---|---|---|
| AHP | - | 10.04 | 12.41 | 4.48 | 6.89 |
| WSM | - | 13.35 | 11.33 | 15.22 | |
| ELECTRE | symmetric | - | 10.57 | 14.67 | |
| PROMETHEE | - | 6.74 | |||
| TOPSIS | - |
| σ | AHP | WSM | ELECTRE | PROMETHEE | TOPSIS |
|---|---|---|---|---|---|
| AHP | - | 7.86 | 14.20 | 5.08 | 11.53 |
| WSM | - | 13.84 | 7.06 | 16.67 | |
| ELECTRE | symmetric | - | 11.37 | 18.43 | |
| PROMETHEE | - | 13.80 | |||
| TOPSIS | - |
| σ | AHP | WSM | ELECTRE | PROMETHEE | TOPSIS |
|---|---|---|---|---|---|
| AHP | - | 9.50 | 14.79 | 4.46 | 9.15 |
| WSM | - | 14.79 | 9.67 | 16.08 | |
| ELECTRE | symmetric | - | 12.58 | 16.88 | |
| PROMETHEE | - | 10.31 | |||
| TOPSIS | - |
© 2017 by the authors. Licensee MDPI, Basel, Switzerland. This article is an open access article distributed under the terms and conditions of the Creative Commons Attribution (CC BY) license ( http://creativecommons.org/licenses/by/4.0/).
Share and Cite
Tscheikner-Gratl, F.; Egger, P.; Rauch, W.; Kleidorfer, M. Comparison of Multi-Criteria Decision Support Methods for Integrated Rehabilitation Prioritization. Water 2017, 9, 68. https://doi.org/10.3390/w9020068
Tscheikner-Gratl F, Egger P, Rauch W, Kleidorfer M. Comparison of Multi-Criteria Decision Support Methods for Integrated Rehabilitation Prioritization. Water. 2017; 9(2):68. https://doi.org/10.3390/w9020068
Chicago/Turabian StyleTscheikner-Gratl, Franz, Patrick Egger, Wolfgang Rauch, and Manfred Kleidorfer. 2017. "Comparison of Multi-Criteria Decision Support Methods for Integrated Rehabilitation Prioritization" Water 9, no. 2: 68. https://doi.org/10.3390/w9020068