Article

Full Spectrum Analytical Channel Design with the Capacity/Supply Ratio (CSR)

1
Department of Civil and Environmental Engineering, Colorado State University, 1372 Campus Delivery, Fort Collins, CO 80523-1372, USA
2
College of Engineering, University of Georgia, 507 Driftmier Engineering Center, Athens, GA 30602, USA
*
Author to whom correspondence should be addressed.
Water 2017, 9(4), 271; https://doi.org/10.3390/w9040271
Submission received: 11 January 2017 / Revised: 6 April 2017 / Accepted: 7 April 2017 / Published: 12 April 2017
(This article belongs to the Special Issue Stream Channel Stability, Assessment, Modeling, and Mitigation)

Abstract

:
Analytical channel design tools have not advanced appreciably in the last decades, and continue to produce designs based upon a single representative discharge that may not lead to overall sediment continuity. It is beneficial for designers to know when a simplified design may be problematic and to efficiently produce alternative designs that approximate sediment balance over the entire flow regime. The Capacity/Supply Ratio (CSR) approach—an extension of the Copeland method of analytical channel design for sand channels—balances the sediment transport capacity of a design reach with the sediment supply of a stable upstream reach over the entire flow duration curve (FDC) rather than just a single discharge. Although CSR has a stronger physical basis than previous analytical channel design approaches, it has not been adopted in practice because it can be a cumbersome and time-consuming iterative analysis without the use of software. We investigate eighteen sand-bed rivers in a comparison of designs based on the CSR approach and five single-discharge metrics: the effective discharge (Qeff) or discharge that transports the most sediment over time; the 1.5-year recurrence interval discharge (Q1.5); the bankfull discharge (Qbf); and the discharges associated with 50th (Qs50) and 75th (Qs75) percentiles of the cumulative sediment yield curve. To facilitate this analysis, we developed a novel design tool using the Visual Basic for Applications (VBA) programming language in Excel® to produce stable channel slope/width combinations based on the CSR methodology for both sand- and gravel-bed streams. The CSR Stable Channel Design Tool’s (CSR Tool) code structure was based on Copeland’s method in SAM and HEC-RAS (Hydrologic Engineering Center’s River Analysis System) and was tested with a single discharge to verify outputs. The Qs50 and Qs75 single-discharge designs match the CSR output most closely, followed by the Qbf, Qeff, and Q1.5. The Qeff proved to be the most inconsistent design metric because it can be highly dependent on the binning procedure used in the effectiveness analysis. Furthermore, we found that the more rigorous physical basis of the CSR analysis is potentially most important in designing “labile” channels with highly erodible substrate, high perennial flow “flashiness”, low width-to-depth ratio, and high incoming sediment load. The CSR Tool provides a resource for river restoration practitioners to efficiently utilize design techniques that can promote sediment balance in dynamic fluvial systems.

1. Introduction

Efforts to manage watersheds for freshwater sustainability have become increasingly important as pressures from population growth and development increasingly strain water resources in an atmosphere of burgeoning climate uncertainty. Almost half (44%) of the rivers in the United States are listed as polluted or impaired, and extinction rates of fresh-water fauna are five times that for terrestrial biota [1,2,3]. Human influences such as urbanization can trigger rapid geomorphic change in streams with excessive erosion or sedimentation that can compromise surrounding infrastructure, degrade habitat, and impede municipal or recreational usages [4,5,6]. These issues often have a common root cause: altered flows of water and sediment. These issues can be addressed in many instances through stream and watershed restoration and more specifically the application of “stable channel design” principles. Stable channel design is a common method in stream restoration that aims to bring a river to a state of dynamic equilibrium between flows of water and sediment, which can reduce excess lateral and vertical instability, as well as improve water quality and habitat for biota [7].
There are many methods used in the current practice of stream restoration and channel design; however, the most common methods usually involve a particular reliance on the use of analogs or designs based on a single “dominant” discharge [8,9,10]. The single-design discharge is often assumed to be the discharge that most influences channel form and an adequate proxy for all flows that influence channel form in the flow regime [11]. Many problems resulting from excessive erosion or sedimentation can arise if care and sound judgment are not employed in choosing the proper discharge, and recognizing limitations on selecting appropriate analogs and using regionalized relationships [12,13]. These techniques can be highly uncertain and often oversimplify the site-specific processes that govern channel morphodynamics. Furthermore, even if great effort is invested in identifying a single representative discharge, resulting designs may still lead to sediment imbalance because other geomorphically-influential flows were not accounted for in the analysis [14]. Notably, a few recent studies have described the use of multiple discharges in design [15,16,17].
Analytical channel design based on a range of sediment transporting flows has the potential to alleviate some of these uncertainties by utilizing hydraulic models and sediment transport functions to derive equilibrium conditions, which makes it applicable to scenarios where historic or current conditions are not in a state of equilibrium between water and sediment [18]. This approach is often described as process-based because it relies on defining a site-specific equilibrium state of the fluxes governing overall channel stability, i.e., water and sediment continuity [19]. This concept is essential to effective river management because the balance of water and sediment is a fundamental driver of river condition, affecting water quality, thermal regime, habitat and aquatic communities, river stability, and natural hazards [7].
A well-known application of the analytical design concept is the Copeland method [20,21] in the stable channel design feature of the U.S. Army Corps of Engineers’ (USACE) Hydrologic Engineering Center’s River Analysis System (HEC-RAS) (Davis, CA, USA) model [20]. This method involves a sediment balance analysis for channel design which can potentially reduce some of the uncertainties associated with the aforementioned methods by explicitly considering inflow sediment loads; however, this method still relies on calculating the sediment balance using a single dominant discharge and does not directly account for the sediment transported by any other flows. The assumptions stated above associated with using a single-discharge methodology can increase the risk of highly unstable channel designs since other influential flows can substantially affect sediment transport.
A more recent approach that aims to improve the physical basis of the Copeland method is the Capacity/Supply Ratio (CSR) method [22]. This approach is analogous to the Copeland method; however, it balances the total sediment delivered from an upstream supply reach through a design reach across the entire flow duration curve (FDC). The CSR approach can provide a more rigorous analysis of stable channel designs compared to single-discharge methods because it accounts for the influence of geomorphically-effective discharges across the entire FDC, thereby alleviating the uncertainty of selecting and assuming the dominant influence of a single discharge [8]. Although there are still many uncertainties that can arise in the CSR methodology as well, specifically in deriving a representative FDC, this approach nevertheless has the potential to provide a more comprehensive and robust channel design analysis over the single-discharge technique [22].
It is not clear, however, what conditions may dictate whether and by how much stable channel designs using the full spectrum of flows may differ from single-discharge designs. Here, we ask whether there are channel characteristics, hydrologic conditions, or other factors that result in differences in full-spectrum and single-discharge channel designs, and if data are insufficient to use the CSR technique, which single discharge matches the CSR output the closest? To investigate this, we compare single-discharge analytical channel designs to designs using the CSR method computed for eighteen sand-bed rivers. These comparisons are made using a software tool developed by the authors, hereafter referred to as the CSR Tool, which facilitates analytical channel design using the CSR method to produce a range of possible design solutions that provide sediment continuity across the entire FDC. The CSR channel designs are compared to single-discharge designs computed from several estimates of the channel-forming discharge: the field-identified bankfull discharge (Qbf), the flow with a 1.5-year recurrence interval (Q1.5), the effective discharge (Qeff), the half-load discharge (Qs50 [23]), and the discharge associated with the 75th percentile of the cumulative sediment yield curve (Qs75 [24]). In all comparisons, we create a simple scenario that maintains constant cross-section dimensions and roughness characteristics to isolate the effects of single versus multiple discharges on channel design and purposefully excludes the influence of other factors such as natural reach-scale channel variability. We use these comparisons to identify conditions in which the CSR approach is most needed for sustainable and robust channel designs, to investigate which other design parameters affect the difference between hydrology techniques the most, and to determine which single discharge produces designs that are closest to the CSR.
We hypothesize that designs computed using a single-discharge approach are more likely to differ from CSR-based designs in “labile” channels with highly erodible substrate, and “flashy” hydrologic regimes that produce a relatively wide range of influential flow events. Here “labile” is defined as an alluvial channel type that has bed sediments that are easily and frequently entrained by flow, have fine grains (typically sand bed), and can characteristically undergo rapid morphological change [25]. We define “flashiness” as a perennial flashiness, or the amount of change in discharge from day to day (sensu Baker et al. [26]) rather than describing dynamic, ephemeral streams. Lastly, we seek to identify the single-discharge designs that are most likely to match the CSR output. We hypothesize designs based on the half-load discharge (Qs50), the discharge associated with 50% of the cumulative sediment yield [23,27], will match CSR designs closer than conventional proxies for the full range of geomorphically-effective flows, i.e., the bankfull and effective discharges [9,28,29].

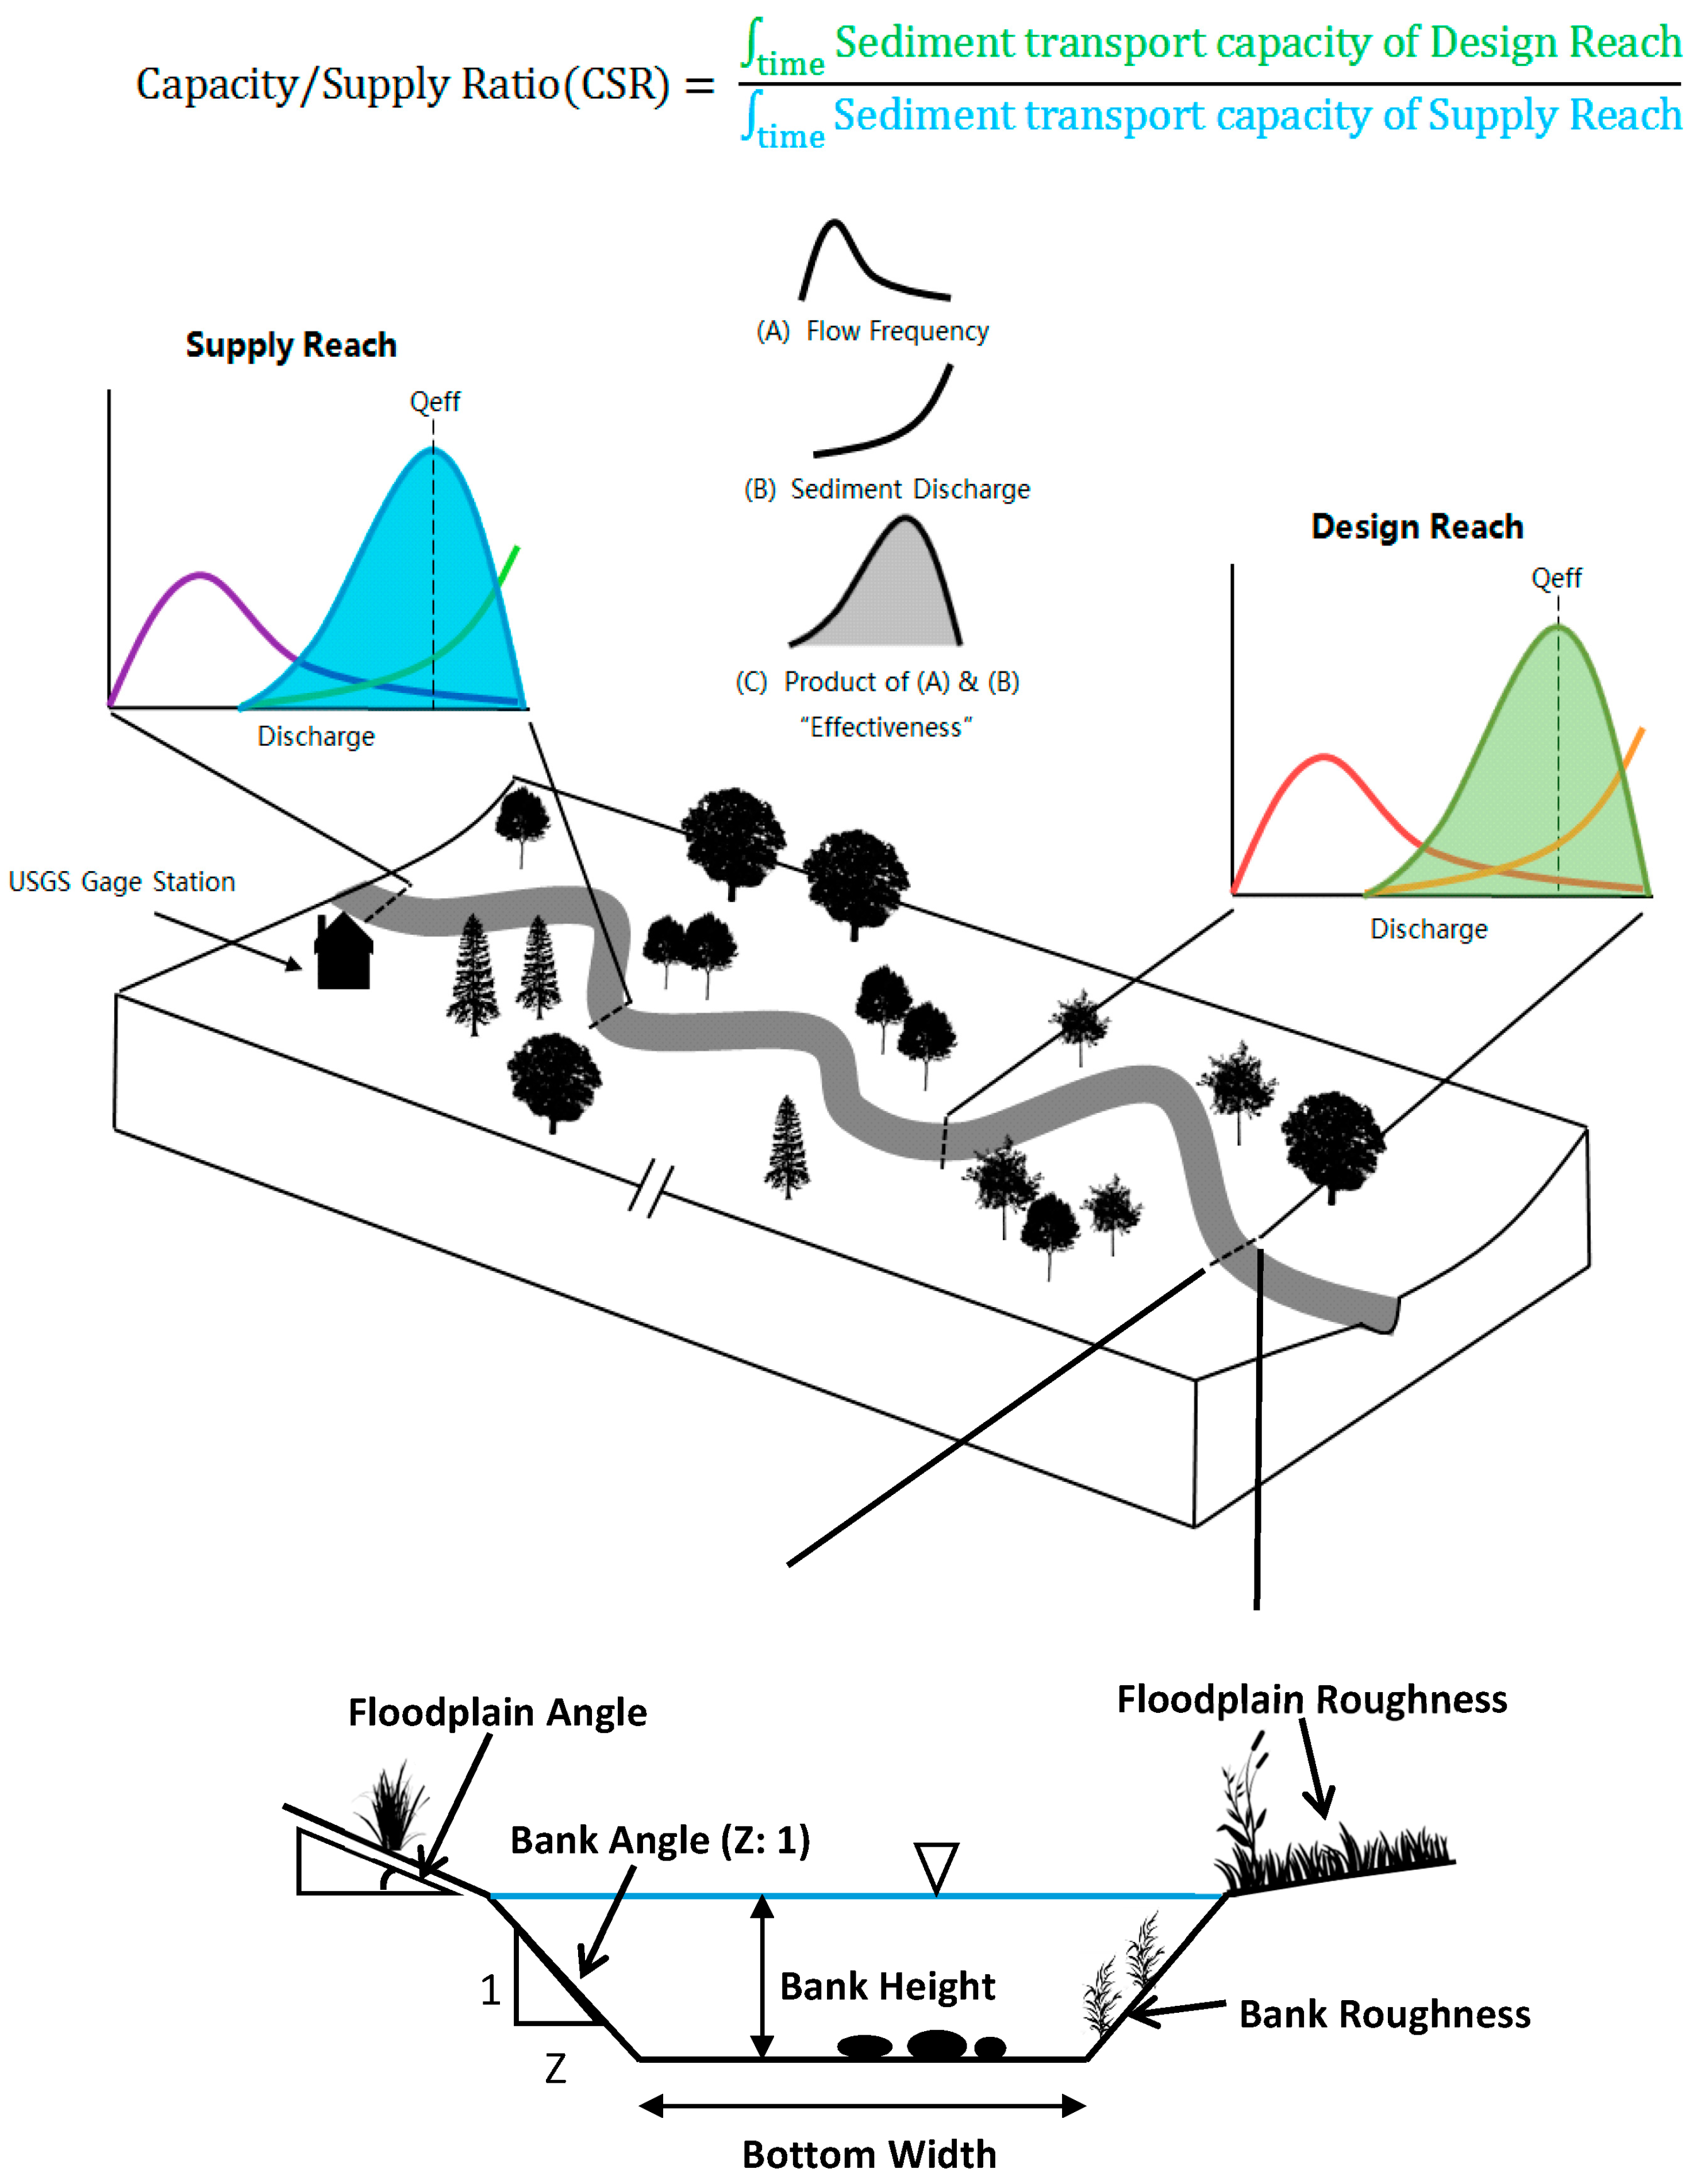
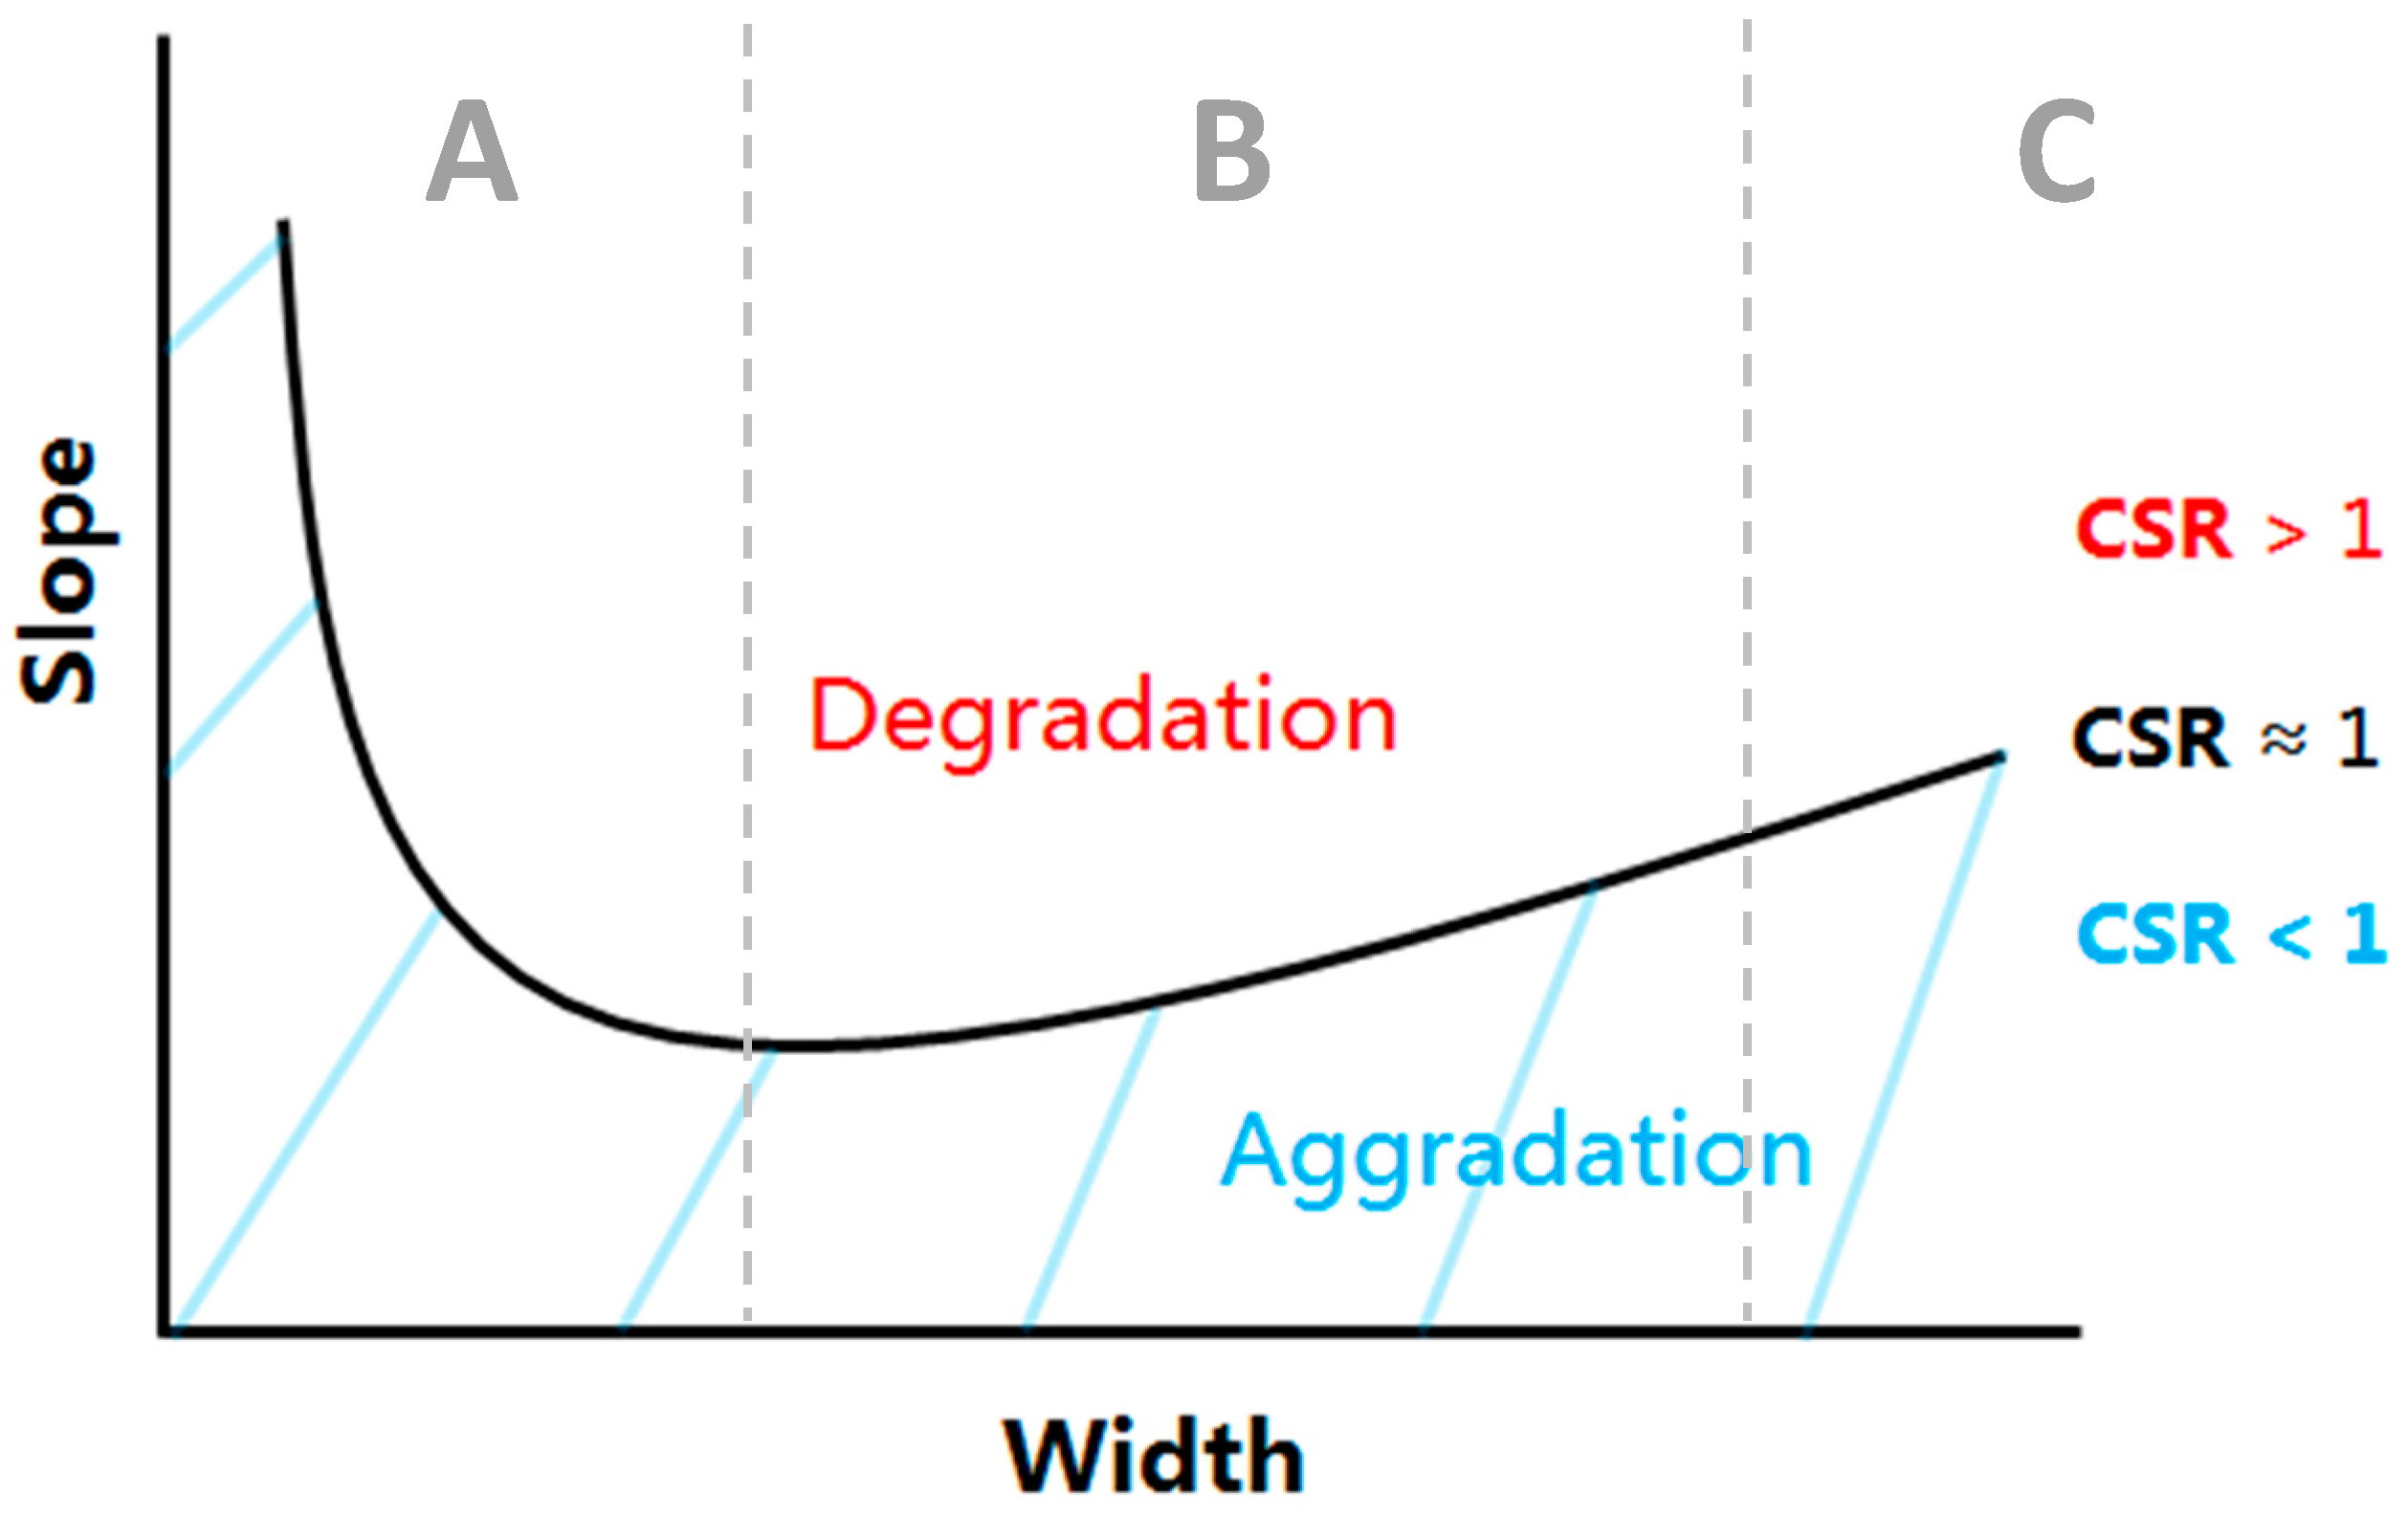
2. The Capacity/Supply Ratio

Soar and Thorne [22] introduced the CSR concept, using it to analyze the faults in a channel design that led to a failed river restoration project at White Marsh Run, Maryland. It is an extension of the Copeland method developed for the USACE SAM software package [21] (Vicksburg, MS, USA), and subsequently included in the stable channel design section of HEC-RAS. The CSR is an analytical channel design methodology that uses a simple balance between the sediment transport capacity of a design reach and the supply of sediment transported into the design reach. This is the same sediment balance concept as used in the Copeland method; however, the difference lies in the range of discharge(s) for which the sediment transport capacity is calculated over a period of years:
CSR   =   time transport   capacity   of   Design   Reach time transport   capacity   of   Supply   Reach
Equation (1) defines the CSR as the bed-material load transported through the river reach by a sequence of flows over an extended time period divided by the bed-material load transported into the reach by the same sequence of flows over the same time period [22]. Ultimately, the CSR method balances the total average sediment yield over an entire distribution of flows for a particular time period rather than just for a single representative discharge as in the Copeland method. The sequence of flows over an extended time period is derived from a user-defined gage flow record, or a FDC from another source such as a hydrologic model. A magnitude/frequency analysis (MFA) is performed to find the “effectiveness”, or sediment transported, on average, over a period of time, by multiplying the probability of flows by their estimated sediment transport capacity [28,29,30]. MFA is performed on a user-defined supply reach to estimate the incoming sediment load to the downstream design reach of interest as depicted in Figure 1. Various width and slope combinations for the associated design reach are iteratively evaluated to identify a set of solutions that produce a CSR approximating unity (Figure 2). The resulting curve or family of stable channel solutions is analogous to the output produced by the Copeland method of HEC-RAS. Slope/width combinations above this line are expected to result in net degradation or erosion in the design reach over time, while those below are expected to produce aggradation or sediment accumulation. A CSR within 10% of unity is likely to achieve sediment balance with minimal aggradation or degradation in the channel [22]. Every design along the curve would theoretically pass the incoming sediment load and through time establish sediment continuity; however, not all the designs on the curve usually fall within the realm of most downstream hydraulic geometry equations and field observations of how channel top width scales with bankfull discharge [22].

3. Methods

This section will first give a brief overview of the CSR Tool, and then explore the methods used to apply the tool on eighteen sand-bed rivers to provide insight into the practical use of the CSR methodology, as well as fundamental insight into differences between single-discharge versus CSR-based designs.

3.1. CSR Tool

The CSR Tool was developed as a Visual Basic for Application (VBA) macro-enabled Microsoft Excel® (Redmond, WA, USA) workbook. This platform was selected to extend the applicability of the tool to both practitioners and researchers by using the user-friendly and familiar environment of Excel®. The basic methodology of the code behind the CSR Tool was closely modeled after the Copeland method in HEC-RAS [20,21]. The model assumes 1D, steady, uniform flow. The channel cross section is represented as a trapezoid, which is split into bed and bank components (Figure 1). The bed and bank components have the same velocity, which is the cross-section averaged velocity, and sediment transport is only calculated over the bed. The hydrology information (the FDC) provided to the CSR Tool is assumed to be valid for both the supply and design reaches, and the sediment transport capacity estimated for the supply reach is assumed to be the incoming sediment load to the design reach. A detailed review of all the equations used in the calculations of the CSR Tool and explanations of their application within the tool can be found in the CSR Tool Reference Manual [14], available upon request from the corresponding author and the National Cooperative Highway Research Program [31].
Unlike the Copeland method included in HEC-RAS, the CSR Tool calculates sediment transport using the entire FDC rather than just a single representative discharge and, therefore, accounts for the morphological influence of the other flows. It also models overbank flow, which can help avoid overestimating the effectiveness of higher flows since the model can account for a floodplain angle that is lower relief than the bank angle. Additionally, the tool is capable of performing the CSR analysis for both sand-bed streams and gravel-/cobble-bed streams.

3.1.1. Channel Partitioning

The in-channel partitioning approach follows the method used by Copeland in HEC-RAS. The Einstein [32] equation is utilized to partition the bed and bank components. This method varies the bank component areas until the velocity through the bed and bank components are equal to the cross-section averaged velocity for the whole channel.
Unlike the Copeland method in SAM and HEC-RAS, the CSR Tool also models overbank flow. Once the flow in the channel breaks into overbank flow, the partition approach is altered because the Einstein [32] method is no longer valid. Instead, the default conveyance method used by HEC-RAS [20] is utilized to converge on a depth solution. In contrast to the in-channel method, the bank partitions are simply delineated by vertical lines.

3.1.2. Hydrology Calculations

The CSR Tool estimates the time-integrated sediment transport capacity of the reaches over the entire FDC rather than a single discharge. For this, the CSR Tool can use a flow gage record or a pre-derived FDC. These flow characteristics are assumed to be the same and representative of the flows through both the supply and design reaches.
If a gage record is chosen for the hydrology data, the program will sort the discharges using an arithmetic binning procedure. A total number of bins must be defined by the user or the program defaults to 25 bins as recommended by Biedenharn et al. [30]. Each bin represents a range of discharges that the flows of the record could fall into. The probability of occurrence for the flows in each range is calculated.
The most common method to perform a MFA is using a flow record when possible; however, it is rare in practice to have a sufficiently long flow record for a stable reach upstream of the design reach. In these instances, the CSR Tool can take a user-defined FDC. A table of exceedance probabilities versus discharges can be directly pasted into the CSR Tool. If the FDC is larger than 50 bins, then it is consolidated to a default of 25 bins, but the user can choose up to 50 bins.

3.1.3. Sediment Transport Calculations

The CSR Tool can perform the CSR analysis to find stable channel design solutions for both sand-bed and gravel/cobble-bed streams. The sand-bed portion of the tool uses the Brownlie [33] total load sediment transport relation to estimate transport rate just like the Copeland method in HEC-RAS. The tool uses both versions of this equation that handle upper and lower regimes, and the transitional regime is assumed to be lower. The sand-bed portion of the tool uses the Manning equation and the Brownlie depth predictor equations [33] that account for bedforms. The Parker [34] and Wilcock and Crowe [35] equations are available to estimate sediment transport rates in gravel- and cobble-bed streams, and the Manning and Limerinos [36] equations were utilized to calculate bed roughness. Overall, the product of the probability of occurrence and the estimated sediment transport capacity for the average discharge in each bin are summed to calculate the effectiveness or total estimated sediment yield.

3.2. Sand-Bed Examples

Eighteen sand-bed river examples were extracted from a data set that was originally collected by J.C. Brice of the U.S. Geological Survey (USGS) and was revisited for use by Soar and Thorne [22]. These data were analyzed to compare stable channel designs using a single-discharge versus the full CSR. Very few sites in the full data set had the data needed for the CSR analysis, so the eighteen sites selected represent sites with sufficiently long flow records (all sites >18 years) and a diverse set of characteristics from varying physiographical regions in the United States (Table 1).
All parameters needed to run the CSR analysis were available in the data set for each example except the bank and floodplain Manning’s roughness (n) values and angles. Typical values of 0.03 to 0.035 for bank Manning’s n, 1 to 1.5 (horizontal:vertical (H:V)) for the bank angle, and 4 (H:V) for the floodplain angle were selected in the absence of field data. All other channel dimensions and characteristics were derived from field-measured data for each site. As we are focusing on the effects of hydrology on channel design, the channel dimensions, roughness characteristics, and grain size distributions were matched for the supply reach and design reach, with the exception of the design width and slope are the outputs from the CSR Tool.
The CSR Tool was applied to all eighteen sites to produce a family of stable channel width/slope combinations with a CSR equal to 1. Additionally, a feature in the CSR Tool that facilitates performing analyses with single discharges was used to compute stable channel designs at each site using five of the most common single discharges used for design: the effective discharge (Qeff), the field-determined bankfull discharge (Qbf), the 1.5-year recurrence interval discharge (Q1.5), and the discharges associated with 50% and 75% of the cumulative sediment yield Qs50 and Qs75, respectively. The Qeff, Qs50, and Qs75 discharges were derived from the MFA output for the supply reach of each example. The Qbf is a field-determined metric that was available for each sand-bed site from the original data set, and the Q1.5 was derived using the Weibull plotting position method with the USGS gage annual peak flow series for each site. Then, these design discharges were input into the CSR Tool using the same channel characteristics as the CSR analysis of the full FDC.
The entire family of stable channel design solutions is calculated to have a CSR of unity; however, not all the solutions are viable or realistic for practical design purposes, as there are no a priori limits on design width specified in the CSR Tool. Soar and Thorne [22] derived a practical channel design width equation from the same sand-bed data set used in this research. This equation is a function of bankfull discharge (Qbf in m3/s) and a binary variable (V) that is unity if tree cover over the banks is less than 50% or zero if tree cover is more than 50% (Equation (2)):
w   =   ( 3.38   +   1.94 V ) Q b f 0.5 e ± 0.083
where, w is the bankfull top width (in m) within a 95% confidence interval of the mean response. The range of widths calculated by this equation was used to select relevant widths to compare between the CSR and each single-discharge design output.
The stable design slopes that fell within the derived width range were extracted to compare single-discharge designs to the CSR design for each site. These width and slope combinations for each single-discharge design were input back through the CSR Tool to obtain a potential sediment yield for that design using the entire flow record. These single-discharge sediment yields were then compared to the associated CSR design sediment yield for that same width as a percent difference from the CSR (henceforth referred to as a percent difference). All the percent differences for each width in the derived range were finally averaged for each single discharge (Qeff, Qbf, Q1.5, Qs50, and Qs75) to compare potential designs for each method.
An analysis was performed to quantify the potential practical implications of the differences in sediment yield between the CSR and single-discharge designs. If the CSR design is assumed to provide the most encompassing physical basis for channel design, then the differences in sediment yield for designs based on the single discharges can lead to potential erosion or deposition within the channel. The percent differences in sediment yield between the CSR and single-discharge outputs were converted to a potential depth of erosion or sedimentation over a 1-km river reach. This conversion can give a practical sense of the potential channel effects due to the differences for each design methodology.
Lastly, differences in sediment yield between the CSR and single-discharge designs were plotted against potential influencing factors such as the Richards–Baker flashiness index (R-B Index [26]) and the width-to-depth ratio to identify trends. For each site, the R-B Index was calculated to make inferences about the deviations of the single-discharge designs and the CSR with flashy hydrographs. The R-B Index is calculated by first taking the sum of the absolute values of day-to-day changes in discharge for the entire daily flow record. This value is then divided by the sum of mean daily flows. The R-B Index is high for flashy hydrographs and low when hydrographs rise and fall gradually (Equation (3)):
R - B   Index   =   i = 1 N | q i q i 1 | i = 1 N q i
where qi is the daily-averaged discharge for day i, and N is the number of days in the flow record.

4. Results

CSR Designs versus Single-Discharge Designs

The average stable design slopes within the range given by the downstream hydraulic geometry (Equation (3)) from Soar and Thorne [22], computed with both the full CSR method and the five single discharges, are presented in Table 2. In the table, we show the ratio of the average stable single-discharge design slope (from the family of solutions within the width range calculated with Equation (3)) to the average stable slope from the CSR design. The sites below the South River in Table 2 had the Qeff in the first bin from the MFA. The Qs50 and Qs75 designs were consistently the closest to the CSR design slopes across the eighteen examples, with most of the Qs50 and Qs75 design slopes within 2% of the CSR design slope.
The sediment yields of these designs were compared to find the percent differences from the CSR design. Table 3 presents comparisons of the single-discharge designs versus the CSR output for the eighteen sand-bed examples. The Qs50 and Qs75 single-discharge designs had sediment yields most similar to the CSR designs at 40% of the sites for both discharges. In comparisons of the total average percent difference for each single discharge to the CSR output for all eighteen sites, Qs75 was consistently the closest (3.8%), followed closely by Qs50 (4.0%), and then Qbf (4.6%), with Qeff and Q1.5 the farthest at 7.6% and 10.5%, respectively.
In general, the Qs50, Qs75, and Qbf design slopes and sediment yields were closest to the CSR designs and were, on average, within 5% across all eighteen examples. These single-discharge designs only produced one instance of a difference greater than 10%. In contrast, the Qeff and Q1.5 designs showed the greatest departures with average percent deviations from 5% to 10%. The Qeff and Q1.5 designs had differences greater than 10% in six and three scenarios, respectively. Eleven of the eighteen designs based on Qeff had the Qeff in the first bin of the MFA and had almost three times more deviation with a total average deviation of 6.3%. In the other seven Qeff designs, the design discharge did not occur in the first bin and the total average deviation was 2.4%.
The Qeff and Qs50 designs tended to be closer together and overestimate the slope and sediment yield of the CSR design, while the Qs75 and Qbf designs were more similar and tended to underestimate the slope and sediment yield of the CSR design. The Qs50 and Qs75 designs were often close to matching the CSR result or bracketing the CSR result. On average, Qs50 and Qs75 either matched (within 0.2% tolerance) or bracketed the CSR design for fifteen out of eighteen sand-bed sites.
The practical implications of the percent differences in Table 3 with respect to potential aggradation or degradation varied widely across the eighteen sites. The most influential factor on the resulting depth of erosion or deposition based on the comparison of single-discharge designs to the CSR designs is the incoming sediment load. For example, the potential erosion or deposition over a 1-km reach due to differences between single-discharge and CSR designs can be illustrated with Sugar Creek, the Buttahatchee River, and the Washita River, each of which had single-discharge sediment yields that differed from the CSR yield by approximately 5% and 10% (Table 4). These sites have incoming sediment yields that differ by orders of magnitude, so a 5% difference in design sediment yield can result in potential erosion or deposition of 0.03 m/year for Sugar Creek (93 tons/day incoming sediment yield) and 2.6 m/year for the Washita River (13,588 tons/day incoming sediment yield).
The R-B Index was compared to many other variables influencing the CSR analysis to make inferences about the robustness of the single-discharge designs. Figure 3 shows the deviation of single discharges Qeff, Q1.5, Qs50, and Qs75 relative to Qbf with a change in the R-B Index. This can reveal the sensitivity of these discharges’ ability to estimate Qbf with changes in “flashiness”. Departures between field identified bankfull discharge and Qeff show a significant positive correlation (R2 = 0.31, p < 0.02) with an increase in the R-B Index; however, Qs75, Qs50, and Q1.5 are much less sensitive than Qeff (R2 < 0.11, p > 0.17). Qs75 and Q1.5 were the least sensitive to changes in R-B flashiness.
In general, the R-B Index and the width-to-depth ratio (derived from field estimates of bankfull top width and bankfull depth for each site) were strong indicators of the deviation between single-discharge designs and the CSR result (Figure 3). The Qeff and Q1.5 deviations are most sensitive to changes in R-B flashiness and the width-to-depth ratio followed by Qs50 with Qbf, and Qs75 the least sensitive (Figure 4). More detailed comparisons show that the average R-B Index tends to be higher when the Qeff is in the first bin (average R-B Index = 0.34) than when not (average R-B Index = 0.21).

5. Discussion

5.1. Strengths and Weaknesses of the CSR Tool Model

The CSR Tool has a number of features that improve the physical basis of stable channel design, but still has characteristics that can potentially limit its applicability. In general, the approach requires specification of an incoming sediment load to the design reach to calculate the sediment balance. This requires the user to identify and analyze a stable upstream supply reach that will be representative of the incoming sediment load into the design reach [14]. This can introduce many uncertainties and may be impossible in some situations. Secondly, the sediment balance is based on estimates from sediment transport equations which have inherent uncertainties and can give misleading results without field validation. However, these uncertainties are alleviated to some extent because solutions are based on a relative sediment balance from the same equation rather than relying on any absolute magnitude.
The CSR approach adds the complexity of modeling sediment transport across the entire FDC rather than relying on a single representative discharge. This approach is representative of the full spectrum of effective flows that the channel conveys through time, but still requires assumptions in the design process. First, the flow record used must be available for a stable upstream supply reach and be representative of inflows to the design reach of interest, or the user must use a derived FDC that is often based on regionalized curves and extrapolation to ungaged sites that can add uncertainty. Secondly, the estimated total sediment transported by the channel or ‘yield’ is computed with a binning procedure and average discharges which can substantively change the output depending on the binning method used. Lastly, the CSR Tool has many fundamental assumptions as do all hydraulic models. The underlying hydraulic relationships are based on 1-D cross-section averaged, steady flow; sediment transport is assumed to occur only on the bed for in-channel and overbank flow; and the cross section is trapezoidal. Channel complexity can be very important in efforts to restore riverine ecosystem functions [37,38], and some channel design scenarios with high channel variability or complex multi-flow patterns may warrant the use of multi-dimensional hydraulic models. In these cases, the CSR Tool may serve as a useful pre-cursor to more complex multi-dimensional hydraulic modeling as it can be applied at multiple locations within the supply and design reaches to give an indication of within-reach variability in transport capacity, and bracket a range of quasi-equilibrium slope and width combinations for further analysis. Overall, the CSR Tool can offer a more physically realistic representation of the full range of geomorphically-effective flows over single-discharge methods, but remains a highly simplified representation of a complex system that provides one line of evidence in the overall design process.

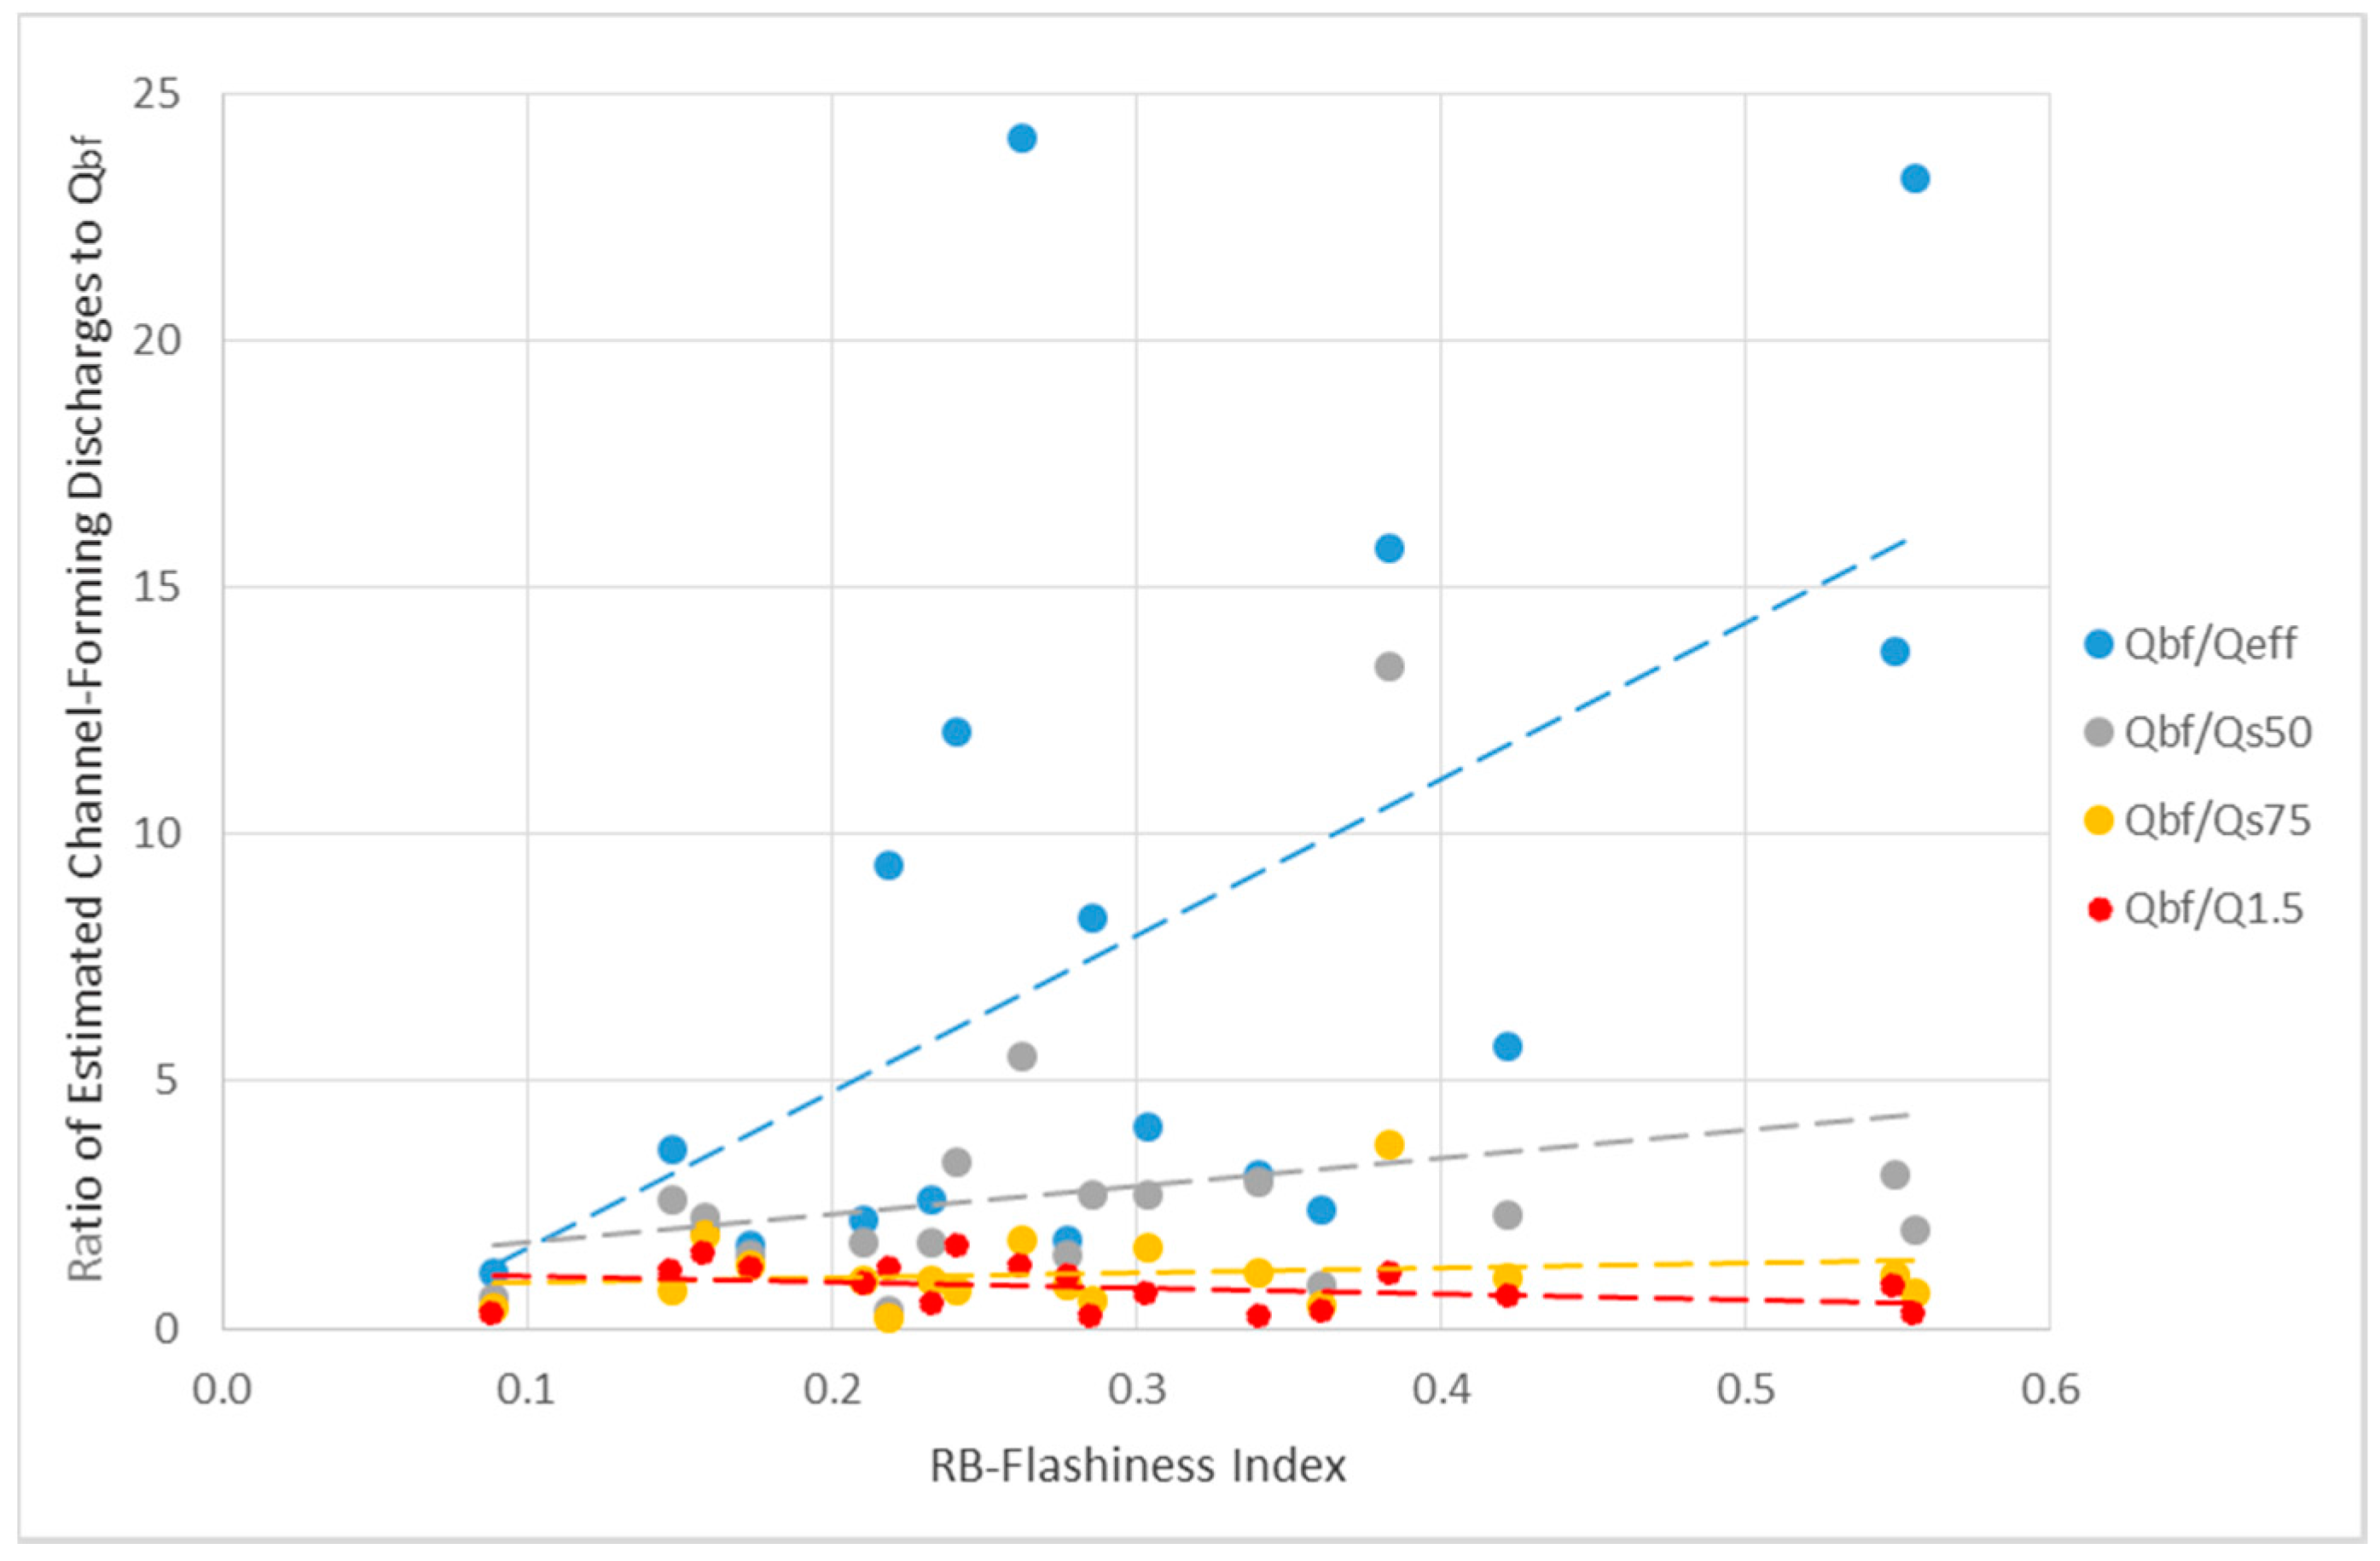
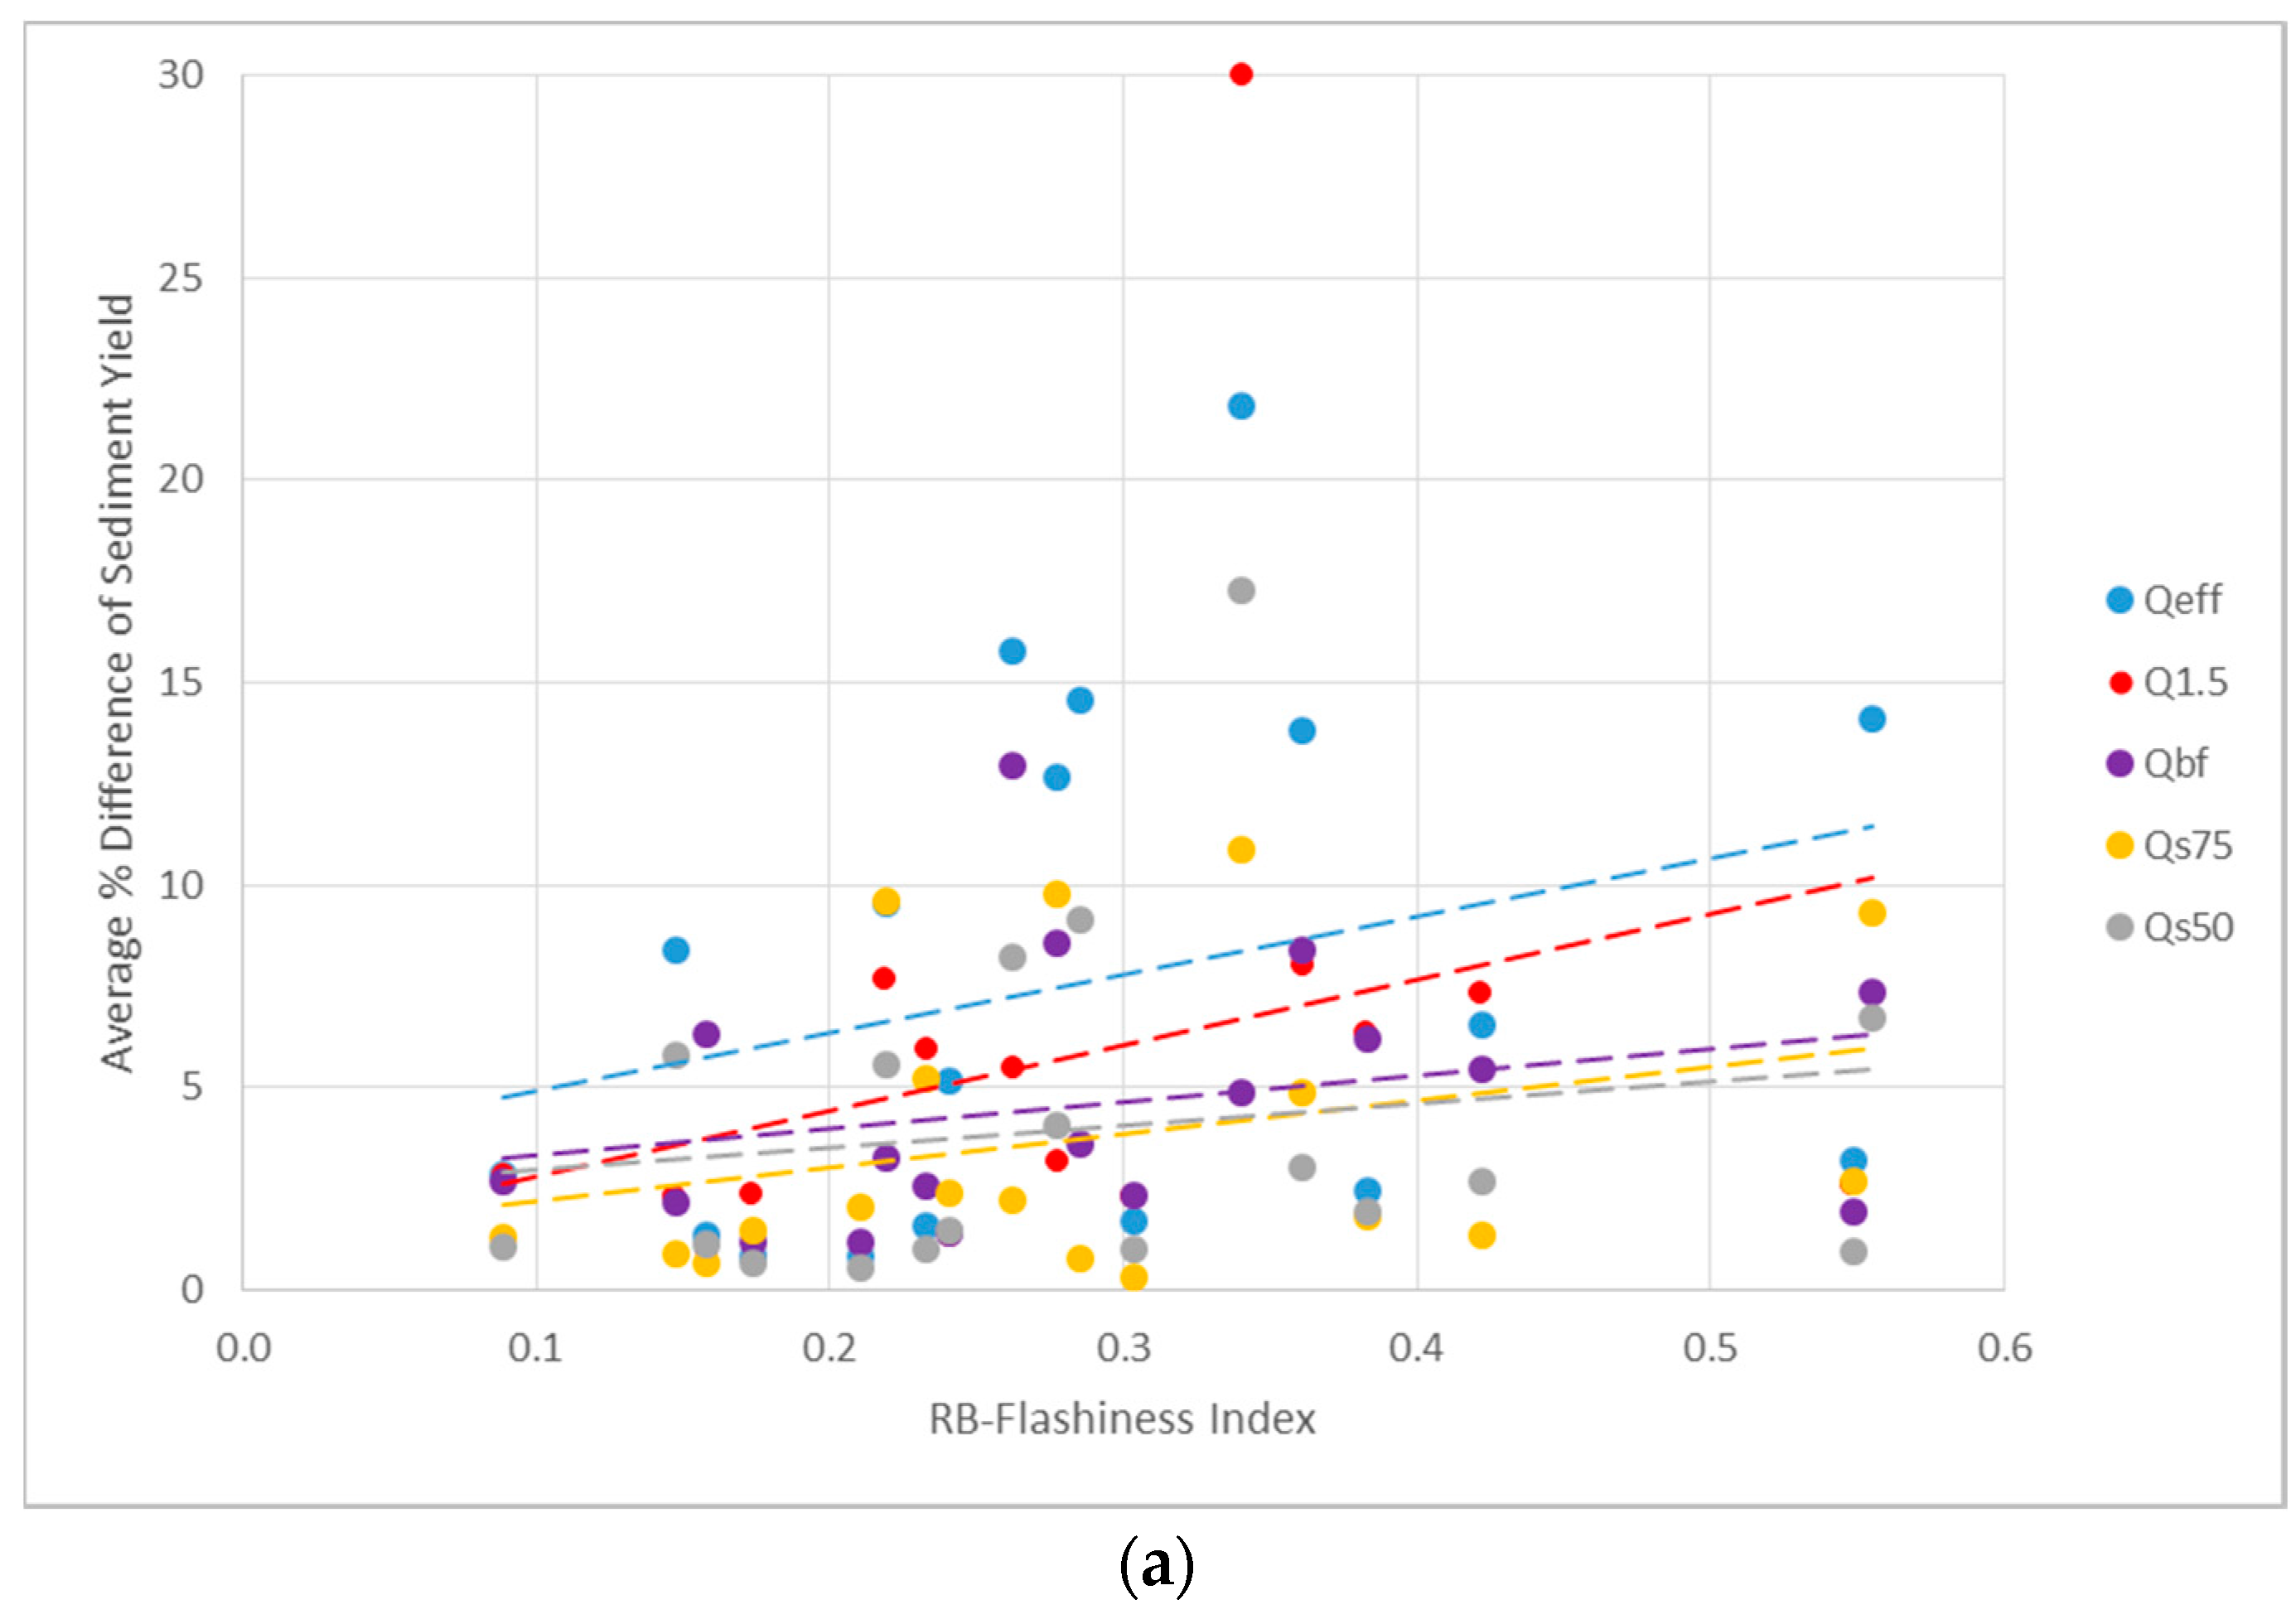
5.2. What Are the Most Important Influences on the Deviation of Single-Discharge Designs from the CSR Output?

In practice, every channel design scenario has a contextual combination of factors and influences that can lead to departures between a single-discharge design and a full spectrum CSR design. However, the eighteen examples explored in this research revealed a few key variables that clearly influence the deviation of single-discharge designs from the CSR output.
Flashiness has a strong influence on the deviation of the CSR from the single-discharge designs. Streams with highly variable or “flashy” hydrographs are more likely to have more frequent large flows and floods that can dominate overall sediment yield as proposed by Wolman and Miller [39], and subsequently demonstrated in fine-bed streams [22] and coarse-bed streams [40]. Rosburg et al. [41] showed that sediment yields computed for flashy streams with the R-B Index greater than about 0.4 can be significantly underestimated when a daily, rather than sub-daily, flow record is used because the high flows that strongly influence sediment transport are not captured in the daily record. One representative discharge will often not account for the effectiveness of these other influential flows which may lead to designs prone to excessive erosion or deposition.
We hypothesize that the high sensitivity of Qeff to flashiness exhibited at our study sites is attributed to the dynamic characteristics of labile channels which can skew the estimation of the effective discharge. Intermediate flows within a flow regime are the most “channel-forming” or effective discharges, particularly those with snowmelt and other relatively stable flow regimes [28,29], because large floods are too infrequent, and frequent low flows lack sufficient capacity to maintain and rework channel form through sediment transport. However, in ”labile” channels with highly erodible substrate, others have shown that low flows well below Qbf can have the capacity to rework the channel and be considered the most effective discharges [22,42]. A high frequency of low flows with capacity to transport sediment can also skew the effectiveness curve to the lowest discharges in the first bin and potentially lead to underestimating Qeff [30]. If Qeff is underestimated, then channel designs based on that discharge will probably not produce sediment continuity at more influential flows and lead to over-compensation of slope and channel degradation (Figure 2). This effect is prevalent in the eighteen sand-bed sites analyzed in this study which supports previous research indicating that Qeff can be underestimated if it is derived from the first bin [22,30]. This issue was noted by Biedenharn et al. [30] who recommended addressing the problem by increasing the number of bins in the hydrologic analysis. The CSR Tool starts at 25 bins and sorts the flows into as many bins as possible without having a zero frequency bin, and thus does not address the first bin issue in its current version. Examining the Qeff in more detail to avoid the first bin issue could increase the potential of this discharge matching the CSR designs closer. Furthermore, it was observed that a stream with a Qeff in the first bin was more likely to have a higher R-B Index which could be another potential explanation for the deviation of these scenarios and aligns with what was found in Soar and Thorne [22].
Few previous studies have focused on the theoretical basis of Qs50 and Qs75 as dominant discharges for design; however, they have separately been proposed as indicators of Qbf in fine-bed streams [23,24]. These discharges are potentially more robust to changes in flashiness, because they do not suffer from the previously discussed binning issues or misleading field indicators that can hinder Qbf estimation (e.g., Rosburg et al. [41]). The small deviation from the CSR by these designs is probably because they are derived from a MFA in a manner similar to the derivation of the CSR. However, it is also recognized that this can be one of the leading downfalls of these design discharges, because a cumulative frequency distribution of sediment transport is required which can be limited by data availability. Thus, if a cumulative distribution function (CDF) of discharges is available, then a designer could use the CSR method instead of a single discharge.
The width-to-depth ratio is a strong influence on deviations in sediment yield between single discharges versus CSR designs. A low width-to-depth ratio and high R-B Index seem to align with increasing deviation of the single-discharge designs from the CSR (Figure 4). This suggests that the width-to-depth ratio could possibly provide another line of evidence that a stream is “flashy” when the data needed to calculate the R-B Index are not available.

5.3. Is the CSR Analysis Needed and, If So, When Is It Most Important to Use over a Single-Discharge Design?

One of the most important implications of this research for practical design applications is that the benefits of a CSR analysis depend on the specific design scenario. Riverine ecosystems are complex, diverse, and influenced by many variables such that several factors including bed material, flashiness, width-to-depth ratio, and incoming sediment load must be considered in addressing this question. In addition, the CSR Tool developed in this research provides a means for designers and researchers to systematically explore this question in the context of their specific situation.
Soar and Thorne [22] suggested designing for a CSR within 10% of unity for dynamic stability. This research used differences in sediment yield to compare deviations so they are scaled with the magnitude of sediment load; however, the outputs of these methods do not explicitly translate to practical erosion or sedimentation potential. Table 3 showed that the percent differences for the single-discharge designs can be substantially sensitive to incoming sediment load and differences in yield can produce large aggradation/degradation potential on the order of meters. The influence of inflowing sediment load on a potential design is also dependent on many site-specific characteristics such as the size of the river, grain size distribution, and flow regime which interact to determine the sediment transport capacity of the stream.

5.4. What Single-Discharge Design Matches the CSR Output the Closest?

Of the five single discharges examined in this research, Qs50 and Qs75 stand out as the single discharges that produce designs that match the CSR designs most closely (Table 3), although there were several instances where all single-discharge estimates were very close to the CSR output. Sholtes and Bledsoe [23] and Copeland et al. [24] found Qs50 and Qs75, respectively, to be good predictors of bankfull discharge in fine-grained streams. This research supports these findings and suggests that both Qs50 and Qs75 can be robust design discharges as proxies for the full spectrum CSR analysis. There were no clear trends in the examples that explained where or why the CSR was closer to Qs50 versus Qs75, but these design discharges consistently matched or bracketed the CSR design, which can have useful implications for narrowing down a single discharge in practical design applications. However, as previously stated, the derivation of these discharges can be just as limited by data availability as the CSR, as computation of the Qs50 and Qs75 requires the full FDC along with a sediment rating curve.
The field-based bankfull discharge Qbf performed nearly as well as the Qs50 and Qs75. This is perhaps unsurprising because observed bankfull conditions may be expected to reflect the flow and sediment regime that a channel experiences. The 1.5-year recurrence interval discharge (Q1.5) performed well in some circumstances and poorly in others (Table 3). There were three outliers in the analysis that brought the average percent difference of this design discharge higher overall (10.5% with and 4.0% without). The Q1.5 is the easiest single discharge to compute as it only requires an annual maximum peak flow series, and it can predict Qbf well in some gravel- and sand-bed scenarios [23]; however, it can be a poor predictor of channel-forming conditions for flashy streams (Figure 4a).
The effective discharge (Qeff) had the worst agreement with the CSR design (Table 3). This is somewhat counterintuitive since there is a large body of research supporting the use of Qeff (e.g., Biedenharn et al. [30], Doyle et al. [11], and Shields et al. [9]). However, the examples used in this research are scenarios that can be particularly vulnerable to the methodological idiosyncrasies of Qeff. For example, Qeff can be difficult to estimate in dynamic labile streams, because it can be sensitive to characteristics of these channels such as the flashiness and the calculation methodology [30].

6. Conclusions

Eighteen sand-bed sites were investigated to compare analytical channel designs based on single-discharge versus the CSR approach, and to identify situations in which it is most important to perform a CSR analysis. The CSR Tool was developed to perform a full spectrum analytical channel design calculation using the CSR sediment balance concept in order to conduct this analysis. Outputs include a family of stable channel design solutions that provide the continuity of water and sediment over the entire FDC. The CSR Tool has the additional feature of floodplain modeling which can increase the fidelity of the model to actual physical processes, and it provides the ability to perform the CSR analysis on both sand-bed and gravel-bed streams for future design and research applications.
We suggest that the CSR method can be the preferred technique in many instances since it provides a more rigorous physical basis over single-discharge designs. Four key variables indicating that a CSR design is appropriate are (1) highly erodible substrate; (2) flashy flow regime; (3) small width-to-depth ratio; and (4) large inflowing sediment loads. Highly erodible channels are often sand-bed dominated channels, but also extend to gravel-bed channels with high sand mixtures that also exhibit “labile” behaviors. Deviations of the four single-discharge designs from the CSR result were positively correlated with an increasing R-B Index. This is most likely because “flashier” streams have a higher potential to have several influential flows that are not accounted for with a single-discharge design. The single-discharge deviations also had a negative correlation with an increasing width-to-depth ratio. This is presumably because smaller streams with smaller basins have a higher potential to have flashy hydrographs.
In general, the single-discharge designs based on Qs50 and Qs75 were the closest to the CSR followed by Qbf, Qeff, and Q1.5. The Qeff can be an inconsistent design metric because of its sensitivity to binning procedures used in the MFA. The Qbf can also be challenging to obtain accurately, especially in disturbed systems in need of restoration, because field indicators are often confounding or absent in urban and incised streams. However, when field indicators and expert judgement are present it can still prove to be a useful design metric. The Q1.5 is the simplest to calculate and can be a useful design metric is some instances, but can be highly dependent on the quality and quantity of available hydrologic data. The Qs50 and Qs75 are robust single-discharge design metrics because they are computed from cumulative sediment transport distributions and are less sensitive to the common difficulties of estimating the Qeff, Q1.5, and Qbf discharges; however, they may also be the most limited by data availability. Furthermore, most sand-bed streams examined in this study showed that the Qs50 and Qs75 designs matched or bracketed the CSR design which can provide a useful practical reference for choosing a design discharge. Lastly, this research showed that the percent differences for the single-discharge designs can be substantially sensitive to incoming sediment load and differences in yield can produce large aggradation/degradation potential on the order of meters. This is expected since the same percent difference will have more sediment available for erosion or deposition for a higher incoming sediment load.
Rivers and streams are highly complex systems and numerous factors influence their behavior and response. As a result, analytical channel designs that are subject to practical time and socio-economic constraints necessitate many simplifying assumptions. Designers can only hope to minimize these assumptions to provide the most robust solutions within the constraints of the project. The CSR Tool developed in this research along with the practical insights derived from its application provide a means of improving the physical basis and promoting sediment balance within the constraints of a typical river management or restoration project.

Author Contributions

Travis R. Stroth, Brian P. Bledsoe, and Peter A. Nelson conceived and designed the experiments; Travis R. Stroth developed the analysis tool and performed the experiments; Travis R. Stroth, Brian P. Bledsoe, and Peter A. Nelson analyzed the data; Brian P. Bledsoe, and Peter A. Nelson contributed supplementary reagents/materials/analysis tools; Travis R. Stroth wrote the paper with revisions by Brian P. Bledsoe, and Peter A. Nelson.

Conflicts of Interest

The authors declare no conflict of interest.

References

  1. U.S. Environmental Protection Agency (EPA). National Water Quality Inventory: Report to Congress: 2004 Reporting Cycle; EPA Publication 841-R-08-001; EPA: Washington, DC, USA, 2009; p. 37. Available online: https://www.epa.gov/sites/production/files/2015-09/documents/2009_01_22_305b_2004report_2004_305breport.pdf (accessed on 15 June 2016).
  2. Ricciardi, A.; Rasmussen, J.B. Extinction rates of North American freshwater fauna. Conserv. Biol. 1999, 13, 1220–1222. [Google Scholar] [CrossRef]
  3. Strayer, D.L.; Dudgeon, D. Freshwater biodiversity conservation: Recent progress and future challenges. J. N. Am. Benthol. Soc. 2010, 29, 344–358. [Google Scholar] [CrossRef]
  4. Hawley, R.J.; Bledsoe, B.P.; Stein, E.D.; Haines, B.E. Channel evolution model of semiarid stream response to urban-induced hydromodification. J. Am. Water Resour. Assoc. 2012, 48, 722–744. [Google Scholar] [CrossRef]
  5. Trimble, S.W. Contribution of stream channel erosion to sediment yield from an urbanizing watershed. Science 1997, 278, 1442–1444. [Google Scholar] [CrossRef] [PubMed]
  6. Piégay, H.; Cuaz, M.; Javelle, E.; Mandier, P. Bank erosion management based on geomorphological, ecological and economic criteria on the Galaure River, France. Regul. Rivers Res. Manag. 1997, 13, 433–448. [Google Scholar] [CrossRef]
  7. Wohl, E.; Bledsoe, B.P.; Jacobson, R.B.; Poff, N.L.; Rathburn, S.L.; Walters, D.M.; Wilcox, A.C. The natural sediment regime in rivers: Broadening the foundation for ecosystem management. Bioscience 2015, 65, 358–371. [Google Scholar] [CrossRef]
  8. Soar, P.J.; Thorne, C.R. Design discharge for river restoration. In Stream Restoration in Dynamic Fluvial Systems: Scientific Approaches, Analyses, and Tools; Simon, A., Bennett, S.J., Castro, J.M., Eds.; Geophysical Monograph Series, 194; American Geophysical Union; Geopress: Washington, DC, USA, 2013; pp. 123–150. [Google Scholar]
  9. Shields, F.D., Jr.; Copeland, R.R.; Klingeman, P.C.; Doyle, M.W.; Simon, A. Design for stream restoration. J. Hydraul. Eng. 2003, 129, 575–584. [Google Scholar] [CrossRef]
  10. McCandless, T.L.; Starr, R.R.; Harman, W.A. Bankfull regional curves for the Alleghany Plateau/Valley and Ridge, Piedmont, and Coastal Plain regions of Maryland. J. Am. Water Resour. Assoc. 2015, 51, 1568–1580. [Google Scholar] [CrossRef]
  11. Doyle, M.W.; Shields, D.; Boyd, K.F.; Skidmore, P.B.; Dominick, D. Channel-forming discharge selection in river restoration design. J. Hydraul. Eng. 2007, 133, 831–837. [Google Scholar] [CrossRef]
  12. Bain, D.J.; Copeland, E.M.; Divers, M.T.; Hecht, M.; Hopkins, K.G.; Hynicka, J.; Koryak, M.; Kostalos, M.; Brown, L.; Elliott, E.M.; et al. Characterizing a major urban stream restoration project: Nine Mile Run (Pittsburgh, Pennsylvania, USA). J. Am. Water Resour. Assoc. 2014, 50, 1608–1621. [Google Scholar] [CrossRef]
  13. Vietz, G.J.; Walsh, C.J.; Fletcher, T.D. Urban hydrogeomorphology and the urban stream syndrome: Treating the symptoms and causes of geomorphic change. Prog. Phys. Geogr. 2016, 40, 480–492. [Google Scholar] [CrossRef]
  14. Bledsoe, B.P.; Baker, D.; Nelson, P.A.; Rosburg, T.; Sholtes, J.; Stroth, T.R. Design Hydrology for Stream Restoration and Channel Stability at Stream Crossings; Report, National Cooperative Highway Research Program (NCHRP) Project 24-40; National Cooperative Highway Research Program (NCHRP): Washington, DC, USA, 2017. [Google Scholar]
  15. Elkins, E.M.; Pasternack, G.B.; Merz, J.E. Use of slope creation for rehabilitating incised, regulated, gravel bed rivers. Water Resour. Res. 2007, 43, W05432. [Google Scholar] [CrossRef]
  16. Pasternack, G.B.; Brown, R.A. Ecohydraulic design of riffle-pool relief and morphological-unit geometry in support of regulated gravel-bed river rehabilitation. In Ecohydraulics: An Integrated Approach; Maddock, I., Harby, A., Kemp, P., Wood, P., Eds.; John Wiley & Sons, Ltd.: Chichester, UK, 2013. [Google Scholar]
  17. Brown, R.A.; Pasternack, G.B.; Lin, T. The topographic design of river channels for form-process linkages. Environ. Manag. 2016, 57, 929–942. [Google Scholar] [CrossRef] [PubMed]
  18. Skidmore, P.B.; Shields, F.D.; Doyle, M.W.; Miller, D.E. A categorization of approaches to natural channel design. In Proceedings of the 2001 Wetlands Engineering and River Restoration Conference, Reno, NV, USA, 27–31 August 2001; Hays, D.F., Ed.; American Society of Civil Engineers: Reston, VA, USA, 2001; pp. 1–12. [Google Scholar]
  19. Beechie, T.J.; Sear, D.A.; Olden, J.D.; Pess, G.R.; Buffington, J.M.; Moir, H.; Roni, P.; Pollock, M.M. Process-based principles for restoring river ecosystems. BioScience 2010, 60, 209–222. [Google Scholar] [CrossRef]
  20. Brunner, G.W. HEC-RAS River Analysis System, User’s Manual; Report No. CPD-68, Version 4.1; U.S. Army Corps of Engineers, Hydrologic Engineering Center: Davis, CA, USA, 2010; p. 790. Available online: http://www.hec.usace.army.mil/software/hec-ras/documentation/HEC-RAS_4.1_Users_Manual.pdf (accessed on 14 May 2015).
  21. Copeland, R.R. Application of Channel Stability Methods Case Studies; Technical Report HL-94-11; U.S. Army Corps of Engineers, Waterways Experiment Station: Vicksburg, MS, USA, September 1994; p. 60. Available online: http://www.dtic.mil/dtic/tr/fulltext/u2/a285625.pdf (accessed on 11 June 2015).
  22. Soar, P.J.; Thorne, C.R. Channel Restoration Design for Meandering Rivers; Technical Report No. ERDC/CHL CR-01-1; Coastal and Hydraulics Laboratory, U.S. Army, Engineer Research and Development Center: Vicksburg, MS, USA, 2001. Available online: http://www.nrcs.usda.gov/Internet/FSE_DOCUMENTS/stelprdb1043218.pdf (accessed on 9 March 2015).
  23. Sholtes, J.S.; Bledsoe, B.P. Half-yield discharge: Process-based predictor of bankfull discharge. J. Hydraul. Eng. 2016, 142. [Google Scholar] [CrossRef]
  24. Copeland, R.R.; McComas, D.N.; Thorne, C.R.; Soar, P.J.; Jonas, M.M.; Fripp, J.B. Hydraulic Design of Stream Restoration Projects; Technical Report No. ERDC/CHL-TR-01-28; Engineer Research and Development Center, Coastal and Hydraulics Laboratory: Vicksburg, MS, USA, 2001. Available online: http://www.nrcs.usda.gov/Internet/FSE_DOCUMENTS/stelprdb1043219.pdf (accessed on 10 November 2015).
  25. Church, M. Bed material transport and the morphology of alluvial river channels. Annu. Rev. Earth Planet. Sci. 2006, 34, 325–354. [Google Scholar] [CrossRef]
  26. Baker, D.B.; Richards, R.P.; Loftus, T.T.; Kramer, J.W. A new flashiness index: Characteristics and applications to Midwestern rivers and streams. J. Am. Water Resour. Assoc. 2004, 40, 503–522. [Google Scholar] [CrossRef]
  27. Vogel, R.M.; Stedinger, J.R.; Hooper, R.P. Discharge indices for water quality loads. Water Resour. Res. 2003, 39. [Google Scholar] [CrossRef]
  28. Andrews, E.D. Effective and bankfull discharges of streams in the Yampa River Basin, Colorado and Wyoming. J. Hydrol. 1980, 46, 311–330. [Google Scholar] [CrossRef]
  29. Emmett, W.W.; Wolman, M.G. Effective discharge and gravel-bed rivers. Earth Surf. Process. Landf. 2001, 26, 1369–1380. [Google Scholar] [CrossRef]
  30. Biedenharn, D.S.; Copeland, R.R.; Thorne, C.R.; Soar, P.J.; Hey, R.D.; Watson, C.C. Effective Discharge Calculation: A Practical Guide; Technical Report No. ERDC/CHL TR-00-15; U.S. Army Corps of Engineers, Engineer Research and Development Center: Vicksburg, MS, USA, 2000; p. 60. [Google Scholar]
  31. National Cooperative Highway Research Program. NCHRP Reports. Available online: http://www.trb.org/Publications/PubsNCHRPProjectReports.aspx (accessed on 1 March 2017).
  32. Einstein, H.A. The Bed-Load Function for Sediment Transportation in Open Channel Flows; Technical Bulletin No. 1026; U.S. Department of Agriculture, Soil Conservation Service: Washington, DC, USA, September 1950; p. 74. Available online: https://naldc.nal.usda.gov/download/CAT86201017/PDF (accessed on 9 July 2015).
  33. Brownlie, W.R. Prediction of Flow Depth and Sediment Discharge in Open-Channels; Report No. KH-R-43A; California Institute of Technology, W.M. Keck Laboratory of Hydraulics and Water Resources: Pasadena, CA, USA, November 1981; p. 246. Available online: http://authors.library.caltech.edu/25957/1/KH-R-43A.pdf (accessed on 23 June 2015).
  34. Parker, G. Surface-based bedload transport relation for gravel rivers. J. Hydraul. Res. 1990, 28, 417–436. [Google Scholar] [CrossRef]
  35. Wilcock, P.R.; Crowe, J.C. Surface-based transport model for mixed-size sediment. J. Hydraul. Eng. 2003, 129, 120–128. [Google Scholar] [CrossRef]
  36. Limerinos, J.T. Determination of the Manning Coefficient from Measured Bed Roughness in Natural Channels; U.S. Geological Survey Water-Supply Paper 1898-B; U.S. Government Printing Office: Washington, DC, USA, 1970; p. 47. Available online: http://pubs.usgs.gov/wsp/1898b/report.pdf (accessed on 7 October 2015).
  37. Rendell, H.; Alexander, D. Note on some spatial and temporal variations in ephemeral channel form. Geol. Soc. Am. Bull. 1979, 90, 761–772. [Google Scholar] [CrossRef]
  38. Brown, R.A.; Pasternack, G.B. Bed and width oscillations form coherent patterns in a partially confined, regulated gravel–cobble-bedded river adjusting to anthropogenic disturbances. Earth Surf. Dyn. 2017, 5, 1–20. [Google Scholar] [CrossRef]
  39. Wolman, M.G.; Miller, J.P. Magnitude and frequency of forces in geomorphic processes. J. Geol. 1960, 68, 54–74. [Google Scholar] [CrossRef]
  40. Bunte, K.; Swingle, K.W.; Abt, S.R.; Cenderelli, D. Steep Gravel Bedload Rating Curves Obtained from Bedload Traps Shift Effective Discharge to Flows Much Higher than “Bankfull”; ePoster EP41A-0774; American Geophysical Union: San Francisco, CA, USA, 2012. [Google Scholar]
  41. Rosburg, T.T.; Nelson, P.A.; Sholtes, J.S.; Bledsoe, B.P. The effect of flow data resolution on sediment yield estimation and channel design. J. Hydrol. 2016, 538, 429–439. [Google Scholar] [CrossRef]
  42. Hey, R.D. Design discharge for natural channels. In Science, Technology and Environmental Management; Hey, R.D., Davies, T.D., Eds.; Saxon House: Farnborough, UK, 1975; pp. 73–88. [Google Scholar]
Figure 1. Visual representation of CSR analysis for simplified trapezoidal channel geometry.
Water 09 00271 g001
Figure 2. Family of width and slope combinations which provide continuity of water and sediment with solutions in section A: low width, high slope (generally too high velocity and stream power); section B: realistic range for single thread; and section C: high width (tendency toward braiding/habitat considerations).
Water 09 00271 g002
Figure 3. Sensitivity of departures between field-identified bankfull discharge versus Qeff, Q1.5, Qs50, and Qs75 with changes in the R-B Index.
Water 09 00271 g003
Figure 4. Total average percent difference in sediment yield computed from single-discharge designs to those computed with CSR designs for all eighteen sites with changes in (a) the R-B Index and (b) the width-to-depth ratio. R-B Index relationship with Q1.5 is significant at p < 0.05, all others have p > 0.10. Width–depth ratio relationship with Q1.5 and Qbf is significant at p < 0.10, all others have p > 0.10.
Water 09 00271 g004aWater 09 00271 g004b
Table 1. Summary of data for eighteen sand-bed river sites used in analytical channel design analysis.
Stream NameSite LocationUSGS a GageFlow DaysTop Width (m)Depth (m)D50 (mm)Bed SlopeSinuosity
Big Raccoon CreekCoxville, IN0334130014,25639.42.610.500.000541.2
St. Joseph Rivernear Newville, IN0417800018,88258.42.040.610.000192.0
Tallahala Creeknear Runnelstown, MS0247450015,70642.62.690.330.000581.4
Fishing Creeknear Enfield, NC0208300024,47243.33.091.070.000172.0
Licking RiverFarmers, KY03249500684843.24.191.380.000252.9
Rough Rivernear Dundee, KY03319000830937.54.600.150.000112.1
South Rivernear Parkersburg, NC0210700012,78919.81.250.530.000271.5
Mud Creeknear Lewsburg, KY0331600012,05416.32.690.140.000282.1
Cahaba Rivernear Sprott, AL0242450011,32361.06.580.300.000411.4
East Nishnabotna RiverRed Oak, IA0680950022,80558.63.170.430.000601.4
Buttahatchee Rivernear Sulligent, AL02439000751921.73.490.280.000441.7
Wolf RiverRossville, TN0703050015,52429.32.020.350.000451.6
Big Sioux RiverAkron, IA0648550025,60058.33.550.590.000251.7
Cossatot Rivernear Dequeen, AR0734050015,52449.53.550.120.000791.7
Rock Rivernear Rock Valley, IA0648350018,40754.32.510.500.000511.8
Red RiverClay City, KY0328350021,12835.23.831.600.000401.7
Sugar Creeknear Edinburgh, IN0336250020,20835.12.031.340.000401.2
Washita RiverAnadarko, OK0732650025,63955.12.090.290.000431.4
NOTE: a U.S. Geological Survey (USGS).
Table 2. Comparison of stable slopes from the CSR and single-discharge designs. The average stable CSR design slope within the range of widths given in Equation (3) is shown in the “CSR Slope” column, and subsequent columns give the ratio of the average stable slope (within the range of widths from Equation (3)) from the single-discharge design to the CSR design slope. Entries where this ratio falls outside the range of 0.95 to 1.05 are presented in bold font.
Stream NameCSR SlopeQeff/CSRQbf/CSRQs50/CSRQs75/CSRQ1.5/CSR
Big Raccoon Creek0.0005321.011.011.001.001.01
St. Joseph River0.000180.991.010.991.011.01
Tallahala Creek0.0005771.001.001.001.011.00
Fishing Creek0.0001620.941.040.991.051.01
Licking River0.000260.990.950.991.000.99
Rough River0.000111.001.001.001.041.00
South River0.0002721.010.991.000.990.99
Mud Creek0.0002751.091.051.041.010.75
Cahaba River0.0004461.070.921.041.010.97
East Nishnabotna River0.0006961.030.960.991.000.96
Buttahatchee River0.0004111.150.971.121.080.52
Wolf River0.0004620.910.970.941.001.18
Big Sioux River0.0002671.061.011.041.001.01
Cossatot River0.0008091.020.991.000.980.98
Rock River0.0005561.030.991.000.980.99
Red River0.0004111.040.961.010.990.95
Sugar Creek0.0004131.081.051.020.970.96
Washita River0.000450.981.021.000.980.99
Table 3. Summary of sediment yield comparisons of CSR to single-discharge designs.
Comparison MetricQeffQbfQs50Qs75Q1.5
Number of times closest to CSR02772
Average % difference7.6%4.6%4.0%3.8%10.5%
Number of times (<5%)81012139
Number of times (5% to 10%)47546
Number of times (>10%)61113
Table 4. Potential erosion or deposition for varying incoming sediment loads over a 1-km reach.
Stream NameSingle-Design Discharge Average % DifferenceIncoming Sediment Yield (tons/Day)Erosion/Deposition (m/Year)
Sugar CreekQs754.9930.03
Buttahatchee RiverQbf4.910130.8
Washita RiverQs505.613,5882.6
Sugar CreekQbf9.8930.06
Buttahatchee RiverQs7510.910131.9
Washita RiverQs759.613,5885.8

