
Prediction of Iron Release during Riverbank Filtration


Division of Water Sciences, Faculty of Civil Engineering & Architecture, Dresden University of Applied Sciences, 01069 Dresden, Germany
*
Author to whom correspondence should be addressed.
Water 2017, 9(5), 317; https://doi.org/10.3390/w9050317
Submission received: 19 February 2017
/
Revised: 21 April 2017
/
Accepted: 24 April 2017
/
Published: 30 April 2017
(This article belongs to the Special Issue Water Quality Considerations for Managed Aquifer Recharge Systems)
Abstract
:At many sites, anoxic conditions and dissolution of iron and manganese are already present, or are likely to develop during riverbank filtration (RBF). A prediction of iron and manganese mobilization during riverbank filtration is required to evaluate the need for further water treatment. Different methods have been tested at RBF sites in Germany: water and sediment analysis, batch and column experiments using river water, sequential extraction, and the mass balance approach. At these sites, a “wash out” effect was observed, resulting in a gradual decrease in iron concentrations between the riverbank and the abstraction well over two decades. Hydrogeochemical exchange processes in the aquifer can cause a long-term release of iron and manganese even if the organics concentration in the river water is low. Contrary to common expectations, high iron concentrations are often dominated by the portion of landside groundwater, whereas iron concentrations in bank filtrate often undergo a long-term decline.
1. Introduction
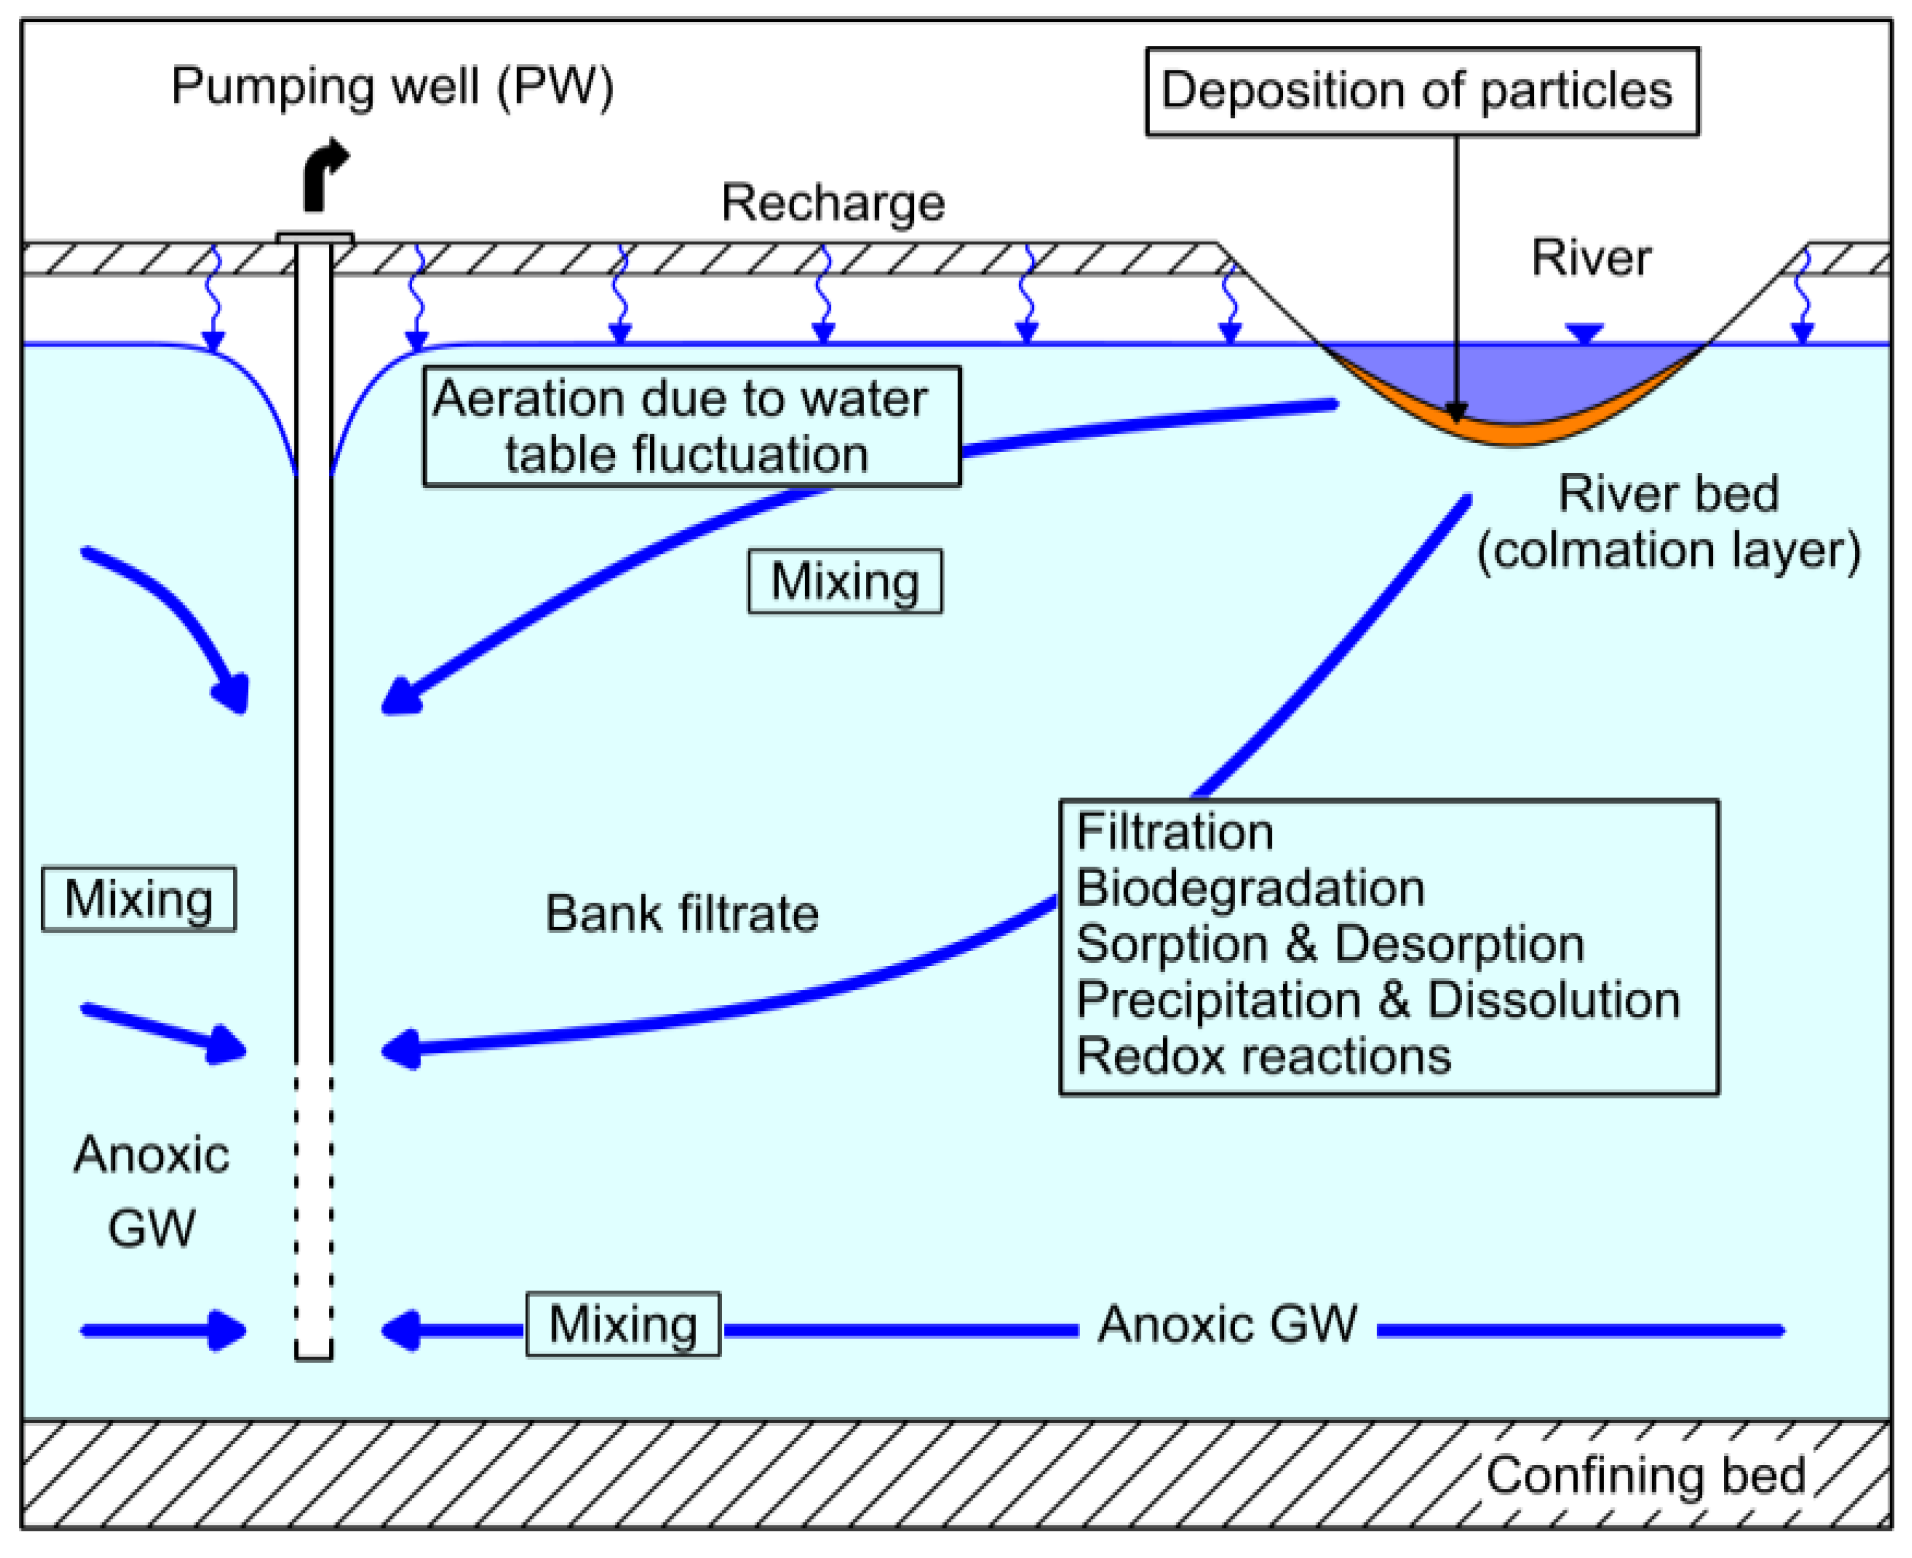
Riverbank filtration (RBF) is a natural or technically-induced process during which surface water is subjected to subsurface flow prior to extraction from vertical or horizontal wells, caisson wells, or drain pipes. The raw water abstracted from the pumping well consists of a mixture of infiltrated river water and groundwater recharged in the landside catchment (Figure 1).
From a water resources perspective, RBF is normally characterized by improved water quality [1,2]. Therefore, RBF is a well-proven treatment step which, at numerous sites, is part of a multi-barrier approach to the drinking water supply. The positive effects of RBF arise primarily in the mixing, sorption, and degradation processes. The whole process can be thought of as occurring in two distinct steps:
- (1)
- the highly biologically active colmation (clogging) zone in the riverbed, in which intensive filtration, degradation, and sorption processes take place over short flow paths and residence times; and
- (2)
- the subsequent subsurface aquifer passage with more moderate degradation and sorption rates, and also the increasing effects of mixing processes.
Many organic, especially nonpolar water substances, are completely retained during RBF, while poorly-degradable polar compounds are hardly removed at all. A synoptic evaluation of the elimination processes at RBF sites in the Netherlands revealed a strong and sustainable removal of polycyclic aromatic hydrocarbons, polychlorinated biphenyls, organochlorine pesticides, bromoform, nitrobenzene, nitrotoluene, and chloronitrobenzene, regardless of redox conditions [3]. Anoxic conditions bring about a thorough removal of pesticides, like atrazine, diuron, and simazine, which are hardly broken down under aerobic conditions. During RBF on the Rhine River, concentrations of dissolved organic carbon (DOC), adsorbable organic halogen or sulfur compounds (AOX or AOS) were reduced, on average, by more than 50% after a residence time of 6–8 weeks. An overview of the removal of organic and inorganic water substances with respect to redox conditions is offered by Stuyfzand [3] and Ray et al. [4].
Depending on the quality of the surface water, redox conditions can already change quickly in the riverbed or along the subsequent flow path in the aquifer. This depends especially on organic carbon, oxygen, and nitrate concentrations, and temperature. If riverbed and/or aquifer sediments contain iron and/or manganese minerals/(hydr)oxides, these can be reduced and dissolved. The resulting increases in dissolved iron and/or manganese concentrations can create problems for drinking water supply.
Precipitation of iron and manganese can cause incrustations in pipes, which are relevant for flow hydraulics and offering surfaces for microbial growth, which can cause increased turbidity and a brown color in the water during times of increased flow velocities in networks. It will also adversely affect the taste of the water. Thus, using the abstracted water as drinking water, but also for industrial and agricultural purposes, requires adequate treatment, which is commonly performed after abstraction e.g., by aeration and filtration. As a result, iron and manganese removal is required as a further treatment step, making RBF more costly and representing a drawback that may limit its wider use as an alternative to direct surface water abstraction and treatment. Thus, prediction of iron and manganese release during riverbank filtration is required.
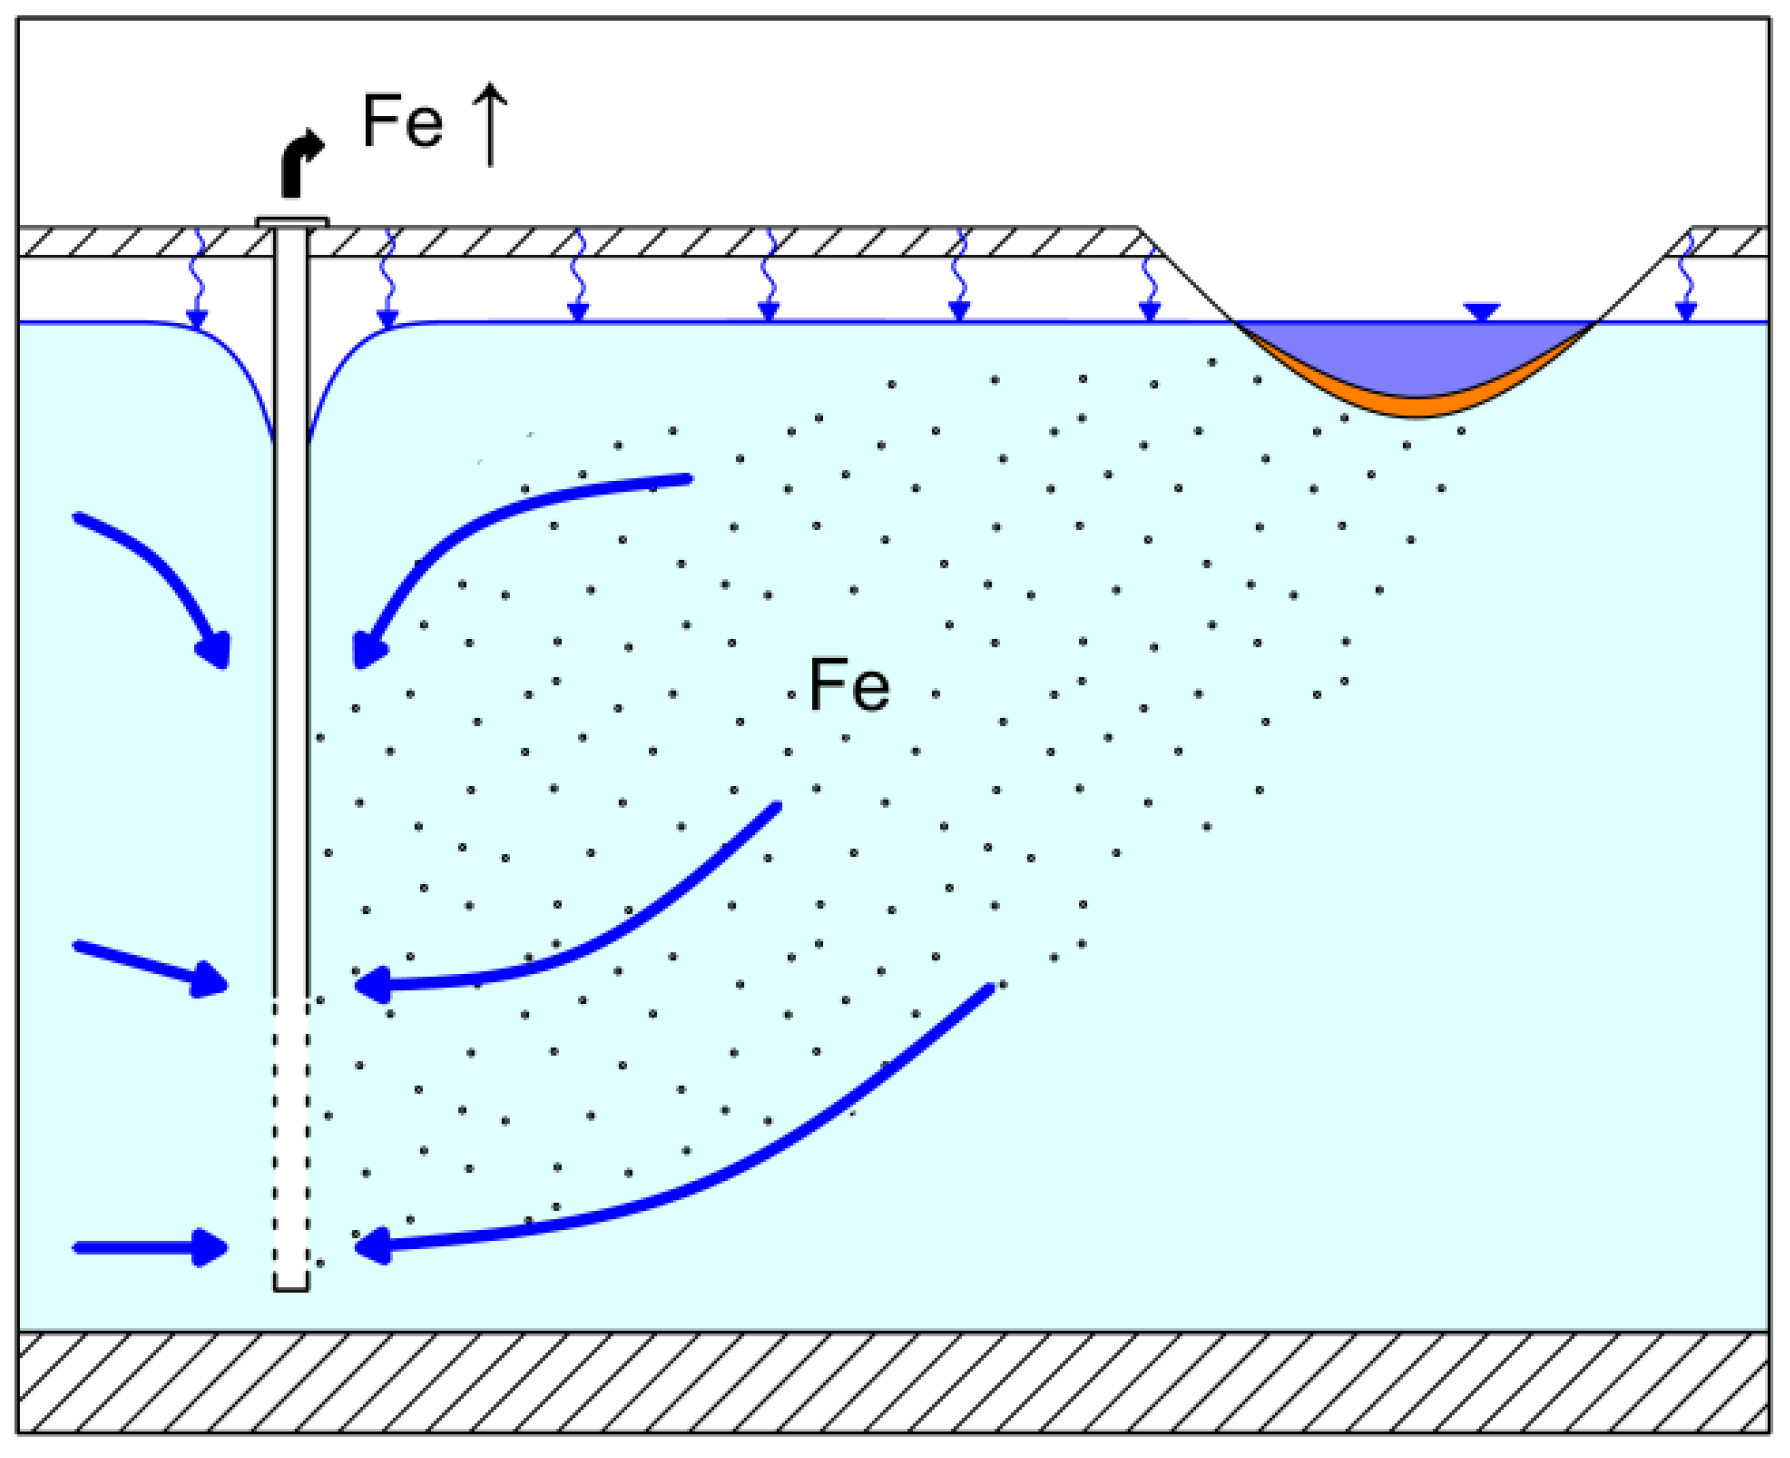
If the biodegradable portion of total organic carbon (TOC) in river water is relatively high, biodegradation processes can consume all dissolved oxygen, and often nitrate as well [5]. This, again, can cause anoxic environments in the aquifer (especially in aquifers that exhibit low hydraulic conductivity and/or confined conditions) and dissolution of iron and manganese. Such a case is shown in principle in Figure 2, where the iron concentration in the pumped water increases as a result of redox and/or dissolution processes in the riverbed and/or aquifer. A simple DOC analysis is not sufficient because particulate organic matter (the difference between TOC and DOC) often accumulates in the riverbed and consumes oxygen and nitrate. Even autochthonous production of TOC at the sediment-water interface has been observed at RBF sites [6].
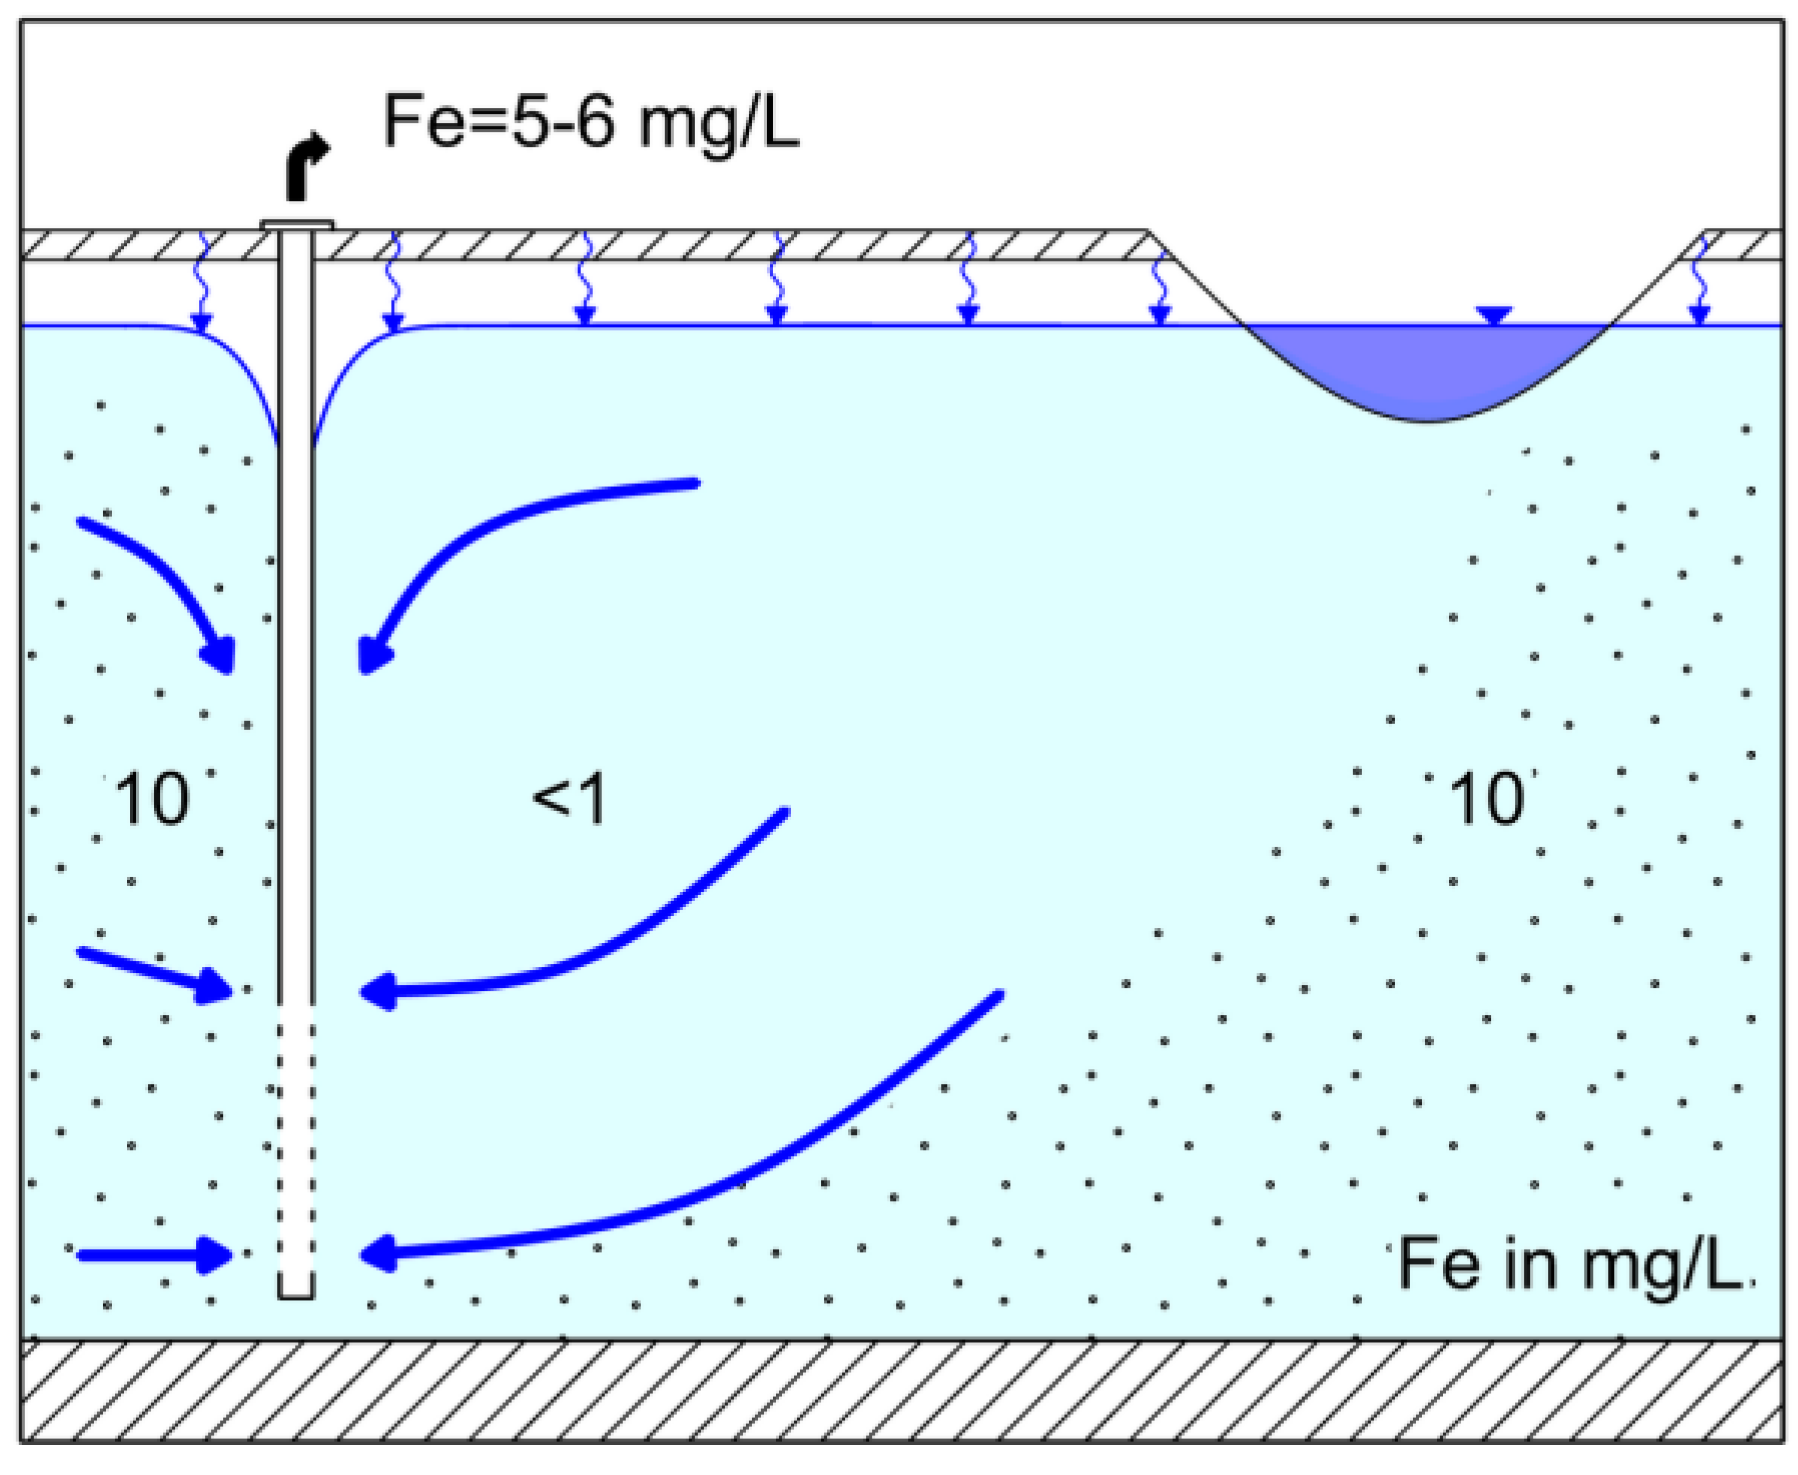
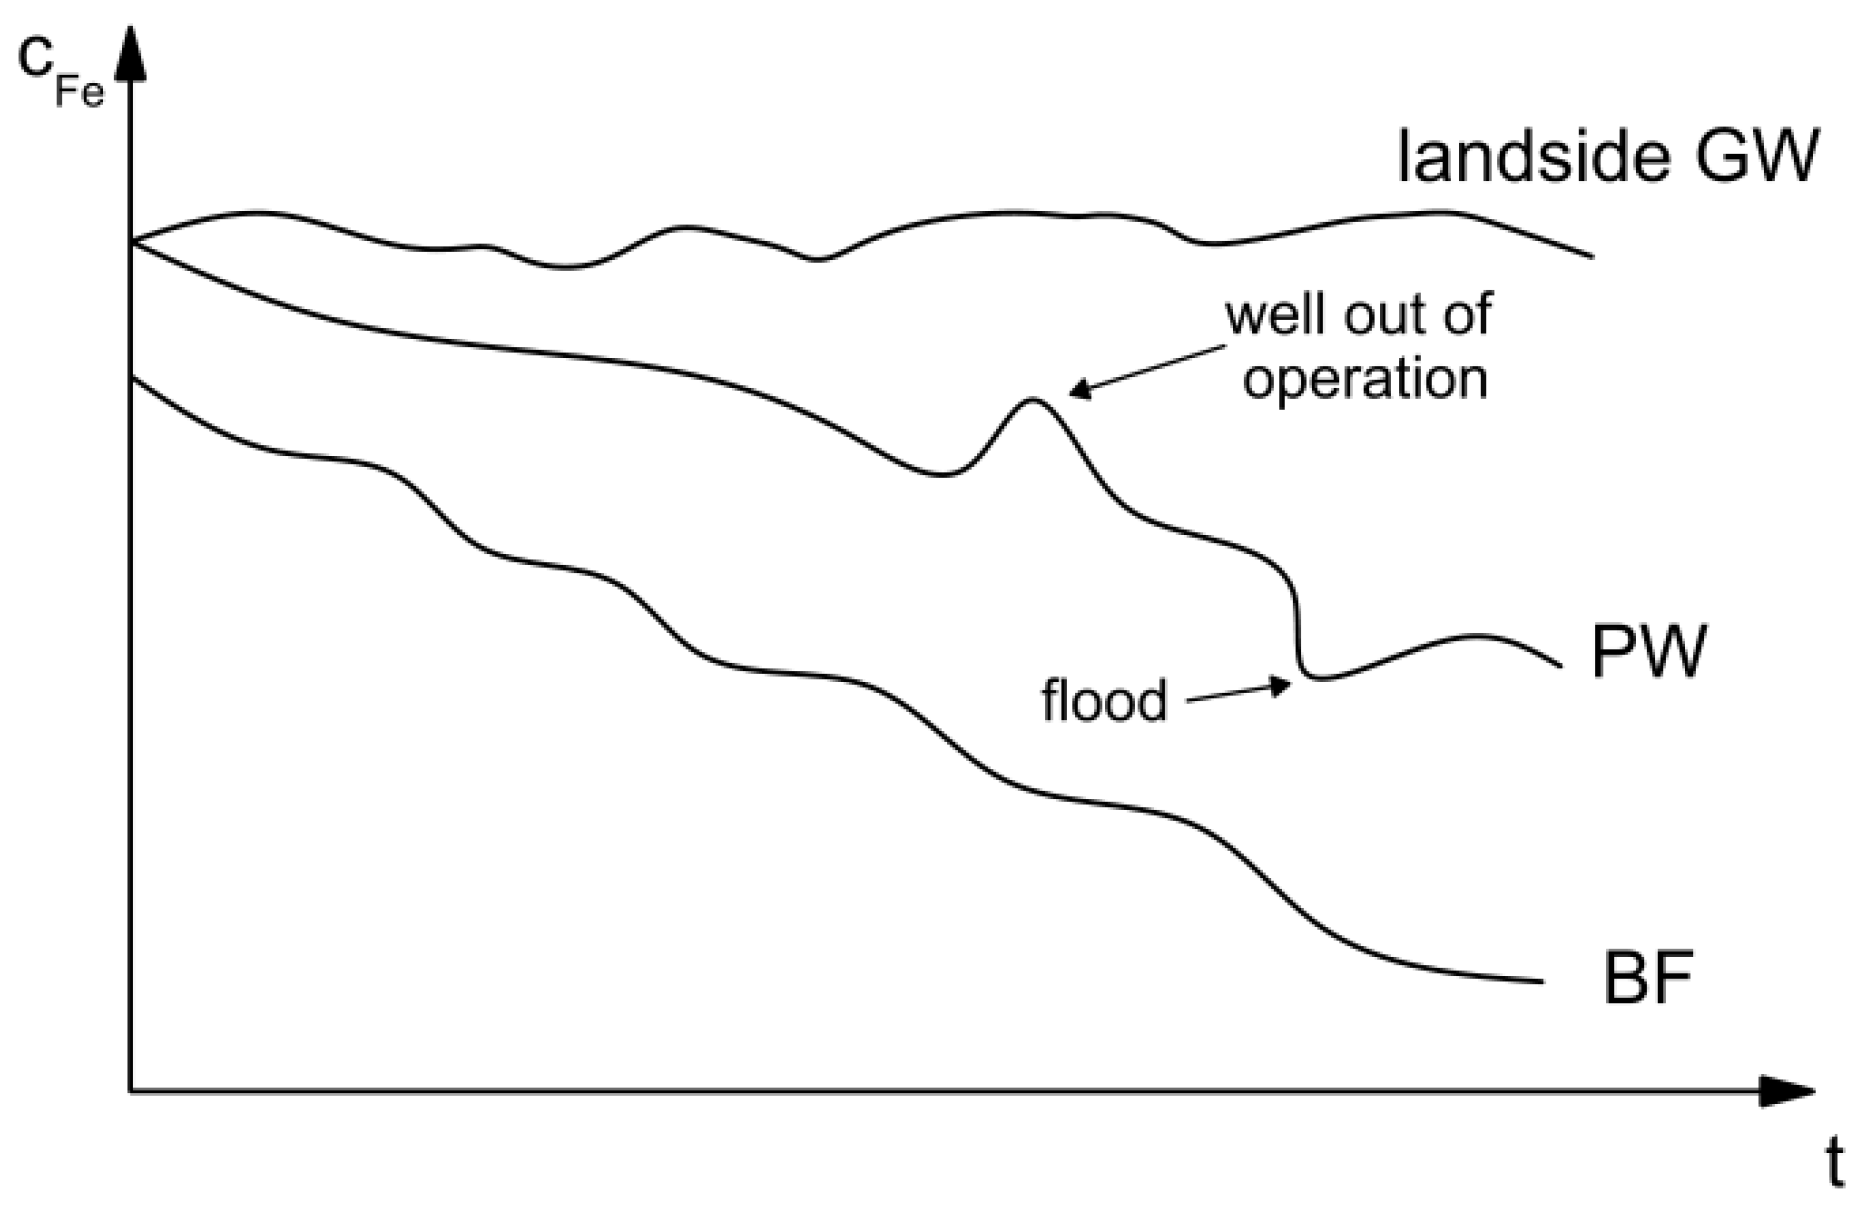
At many sites, anoxic conditions are already present (Figure 3) and dissolution of iron and manganese would develop during RBF. Although this paper will focus on iron and manganese, at a few sites such dissolution can also be observed for arsenic as a result of a reduction of As(V) to As(III) having a higher solubility or related to dissolution of iron (hydr)oxides containing previously-adsorbed or co-precipitated As. Recent findings on As removal during RBF are published by Postma et al. [7]. Continuous pumping and low(er) iron and manganese concentrations in bank filtrate would change the local equilibria in the aquifer and result in dissolution and/or desorption of iron and manganese. Figure 4 and Figure 5 demonstrate the principal, time-dependent change in Fe concentration between the river and the pumping well (PW). If the portion of bank filtrate (BF) in the pumped water is high, e.g. 80%, the expected decrease in the iron concentration in the pumped water will be stronger during the same time Δt (Figure 6). It must be mentioned that a prediction of the iron concentration is not straightforward, as the river stage and well operation will affect the portion of BF (Figure 7, higher portion during floods, lower portion after non-operational periods of wells) and the landside groundwater quality has some dynamics.
Based on field site investigations along the Elbe River in Germany, long-term water quality changes will be discussed together with accompanying laboratory experiments.
2. Materials and Methods
2.1. Water Quality Investigation at RBF Site at Torgau
The source water catchment of the RBF waterworks at Torgau is located along the left bank of the Elbe River (Figure 8). There are 42 vertical wells arranged in 9 groups of 3–7 wells, at an average distance from the riverbank of 300 m, over a river reach about 15 km long. Abstraction rates of approximately 150 m3/h per well provide a total waterworks capacity of around 150,000 m3/d. Well screens have a length of 15–20 m and are located at a depth of 30–50 m below ground level inside a zone of coarse to medium sand layers. The total thickness of the aquifer does not exceed 55 m.
Groundwater samples were taken at least monthly from cross-sections, including several observation wells at different distances from the riverbank and different depths between 1995 and 1997, later with lower frequency during routine sampling campaigns of the water company. Groundwater was obtained using either a mobile submersible pump lowered into observation wells or from in situ membrane pumps used to sample from directly below the riverbed. Chemical analyses included major ions, iron, and manganese, and were carried out according to German guidelines and DIN methods (e.g., DIN 38401 for iron analysis [8,9]).
2.2. Laboratory Experiments
To properly estimate the magnitude of iron and manganese released from the sediment, the source of the high iron concentrations, especially in the landside groundwater, must be identified. The total iron content, as well as the chemical speciation of iron were, therefore, determined by running tests on the soil. By using a variety of extraction methods, it is possible to quantify the fractions of a certain metal (e.g. iron) in its different species, since the stability of the different species largely depends on the respective dominant redox and pH conditions. In this way, stepwise (sequential) changes in these conditions revealed how much each fraction contributed to the total iron content.
Preliminary tests were conducted with sediment samples from drill cores from observation well (OW) I-6. The total iron concentration in the grain size fraction <2 mm decreased from 3500 mg/kg in the unsaturated zone to a relatively constant level of 1500 mg/kg below 69 meters above sea level (masl). This decrease was corroborated by the observation of strong surface deposits of red iron hydroxides on the quartz grains in the unsaturated zone. In the deepest part of the aquifer, the total iron content was higher than in the middle layers. The portion of easily extractable iron made up 41% ± 11.5% of the total iron content. No crystalline iron minerals were found using X-ray diffraction analysis in any samples. An iron content of 6400 mg/kg was extracted from a soil sample from a depth of 48.5 masl, which contained lignite particles.
Soil samples A and B were taken from OW II-6 immediately next to well 33 on the land side, from depths of 22–25 m below ground level (mbgl) and 40–43 mbgl, respectively. These were used in a batch experiment following the method of sequential extraction according to Brand [10]. In the first three steps for the determination of well soluble iron salts, exchangeable ions and carbonate-bound phases, it was possible to extract 70 mg/kg from the soil. The fourth extraction step using hydroxylammonium chloride solution at a pH of 2 revealed high iron concentrations. Since repeated batch experiment trials all yielded high iron concentrations, a large-scale experimental approach was taken.
In January 1994, four columns were setup to run in a closed loop with extraction chemicals, each containing 1000 g of air-dried soil, sieved to below 2 mm. The iron content of the soil samples was in the range of 0.2%–0.4%, typical for Quaternary medium sand. In the first three extraction steps a total of only 5 mg/kg of iron was released. The fourth extraction step with hydroxylammonium chloride solution allowed a repeated extraction of iron at concentrations between 20 and 26 mg/L iron, virtually without end. Therefore, the solutions were renewed weekly in the beginning, later every two weeks, to continue the iron extraction and to quantify the easily-reducible iron fraction. Two experiments with two columns in parallel ran over 511 days, and two other columns over a total of 873 days.
3. Results
3.1. Field Observations
Much of the biodegradable portion of particulate organic matter, DOC, and biodegradable single organic compounds are swiftly attenuated in the riverbed, which has a high organic carbon content. For DOC and many single compounds, up to a 50% decrease in concentration occurred along the first few centimeters of the flow path [5]. Accordingly, oxygen is completely consumed along the first decimeters of the flow path. At the RBF site at Torgau, with retention times of the bank filtrate in the aquifer between 50 and 300 days [9], the nitrate concentration decreased from 22 to <1 mg/L as a result of heterotrophic and autotrophic denitrification (Table 1). Mass balance calculations and laboratory experiments showed that the input of biodegradable organic carbon during riverbank filtration is lower than the stoichiometric demand for oxygen consumption and denitrification [5,9,11]. The oxidation of 1 mg/L DOC requires about 1.2 mg/L O2 and the oxidation of 1 mg/L NH4+ requires about 3.6 mg/L O2. These observations implied that particulate organic carbon, which forms an organic rich layer in the upper centimeters of the riverbed (proven by analyses of TOC in sediment samples from different depths), acts as a reducing agent for O2 and nitrate in the bank filtrate. The resulting Fe(II) concentration in bank filtrate at OW I-6/3 is slightly increased compared to river water, but is much lower than in landside groundwater.
The iron concentration in the abstracted water of the wells in the whole catchment covers a wide range, with an average value of 17 mg/L for the observed wells. Additionally, large variations of iron concentration (from 0 to over 100 mg/L) can be observed over the vertical expanse of the aquifer [10]. In the bank filtrate the median Fe(II) concentrations increased very slightly by 0.25 mg/L, up to the OW nearest to the Elbe River. In the shallow depths, no increase in Fe(II) concentration was found, as expected in the presence of nitrate. In cross-section I a decrease in iron concentrations was found below the silt layer, likely due to the infiltration of groundwater from the right-hand side of the Elbe River. The old groundwater at the greatest depth showed iron concentrations of about 4 mg/L.
Figure 9 provides an overview of the distribution of the total iron concentrations. As Fe(III) is only slightly soluble at neutral pH, the total iron concentration at values above 1 mg/L can be primarily attributed to the Fe(II) concentrations.
Given the lack of oxygen and nitrate and the availability of biodegradable organic compounds, reduction of Fe(III) was expected at the medium depth. However, as well operation continued, a decrease in Fe(II) concentrations in bank filtrate was found in both cross-sections. This change was most pronounced in cross-section II. Figure 10 shows the decrease in iron concentrations at OW II-3/3, II-4/3, II-5/3, and well 33.
Before well 33 was put into operation in 1993, the water sampled from OW II-5/3 was under the strong influence of landside groundwater, which showed iron concentrations as high as 100 mg/L. Depending on the water level in the river, iron-rich landside groundwater can enter the region between the wells and the river, during times when well 33 is operating at a low flow rate or the well gallery is not in operation. This water is subsequently extracted from the wells, leading to iron concentration peaks in the raw water. The augmented flow of bank filtrate, brought about by the steady operation of wells, led to a drastic reduction in median iron concentrations during the period from 1993 to 1998 from 34 mg/L to 4.4 mg/L at OW II-5/3 (bank filtrate) and from 1993 to 2009 from 40 mg/L to 20 mg/L at well 33 (mixture of bank filtrate and groundwater), as well as manganese concentrations from 1.6 mg/L to 0.1 mg/L at OW II-5/3 and from 1.6 mg/L to 0.9 mg/L at well 33 during the same periods. The decreasing iron and manganese concentrations could be explained as a result of leaching of the most reactive Fe(OH)3 phase in the aquifer between the river and the well.
3.2. Laboratory Experiments
Figure 11 shows the cumulative mass curves of the iron extracted during the column experiments. Soil sample A yielded 2470 mg/kg of extract out of a total 3550 mg/kg, and 400 mg/kg was found in the subsequent soil analysis. Soil sample B yielded 2000 mg/kg of extract out of a total 2470 mg/kg, and 130 mg/kg was measured in the subsequent soil analysis. The portion of extracted iron made up 70% and 81% of the total iron content, respectively. These figures are underestimates, as the cumulative mass curves showed a clear upward trend, and more iron would have been extracted had the experiments been continued. It can be concluded from these results that the vast majority of iron in the soil is present in the form of amorphous iron hydroxides and iron oxides.
Mineralogical tests of the soil samples from the groundwater aquifer indicated the presence of quartz, feldspar, and iron-rich chlorite [12], probably Thuringite. The chlorite comes from alluvially-deposited fragments of mica slate and from the weathering of biotite, which is contained in granodiorite boulders. In some isolated cases magnetite was found in grain sizes below 100 µm, but was generally found below 2 mm throughout the entire depth, as determined by suspension experiments and with the help of magnets.
4. Discussion
4.1. Control of Iron Concentration at an Existing RBF Site at Torgau
Steady operation of the wells led to a displacement of groundwater through bank filtrate and to a slow reduction in iron concentrations in the raw water. This conclusion has been supported by the analysis of raw water data from other wells. In the time between 1986 and 1994 there was a gradual decrease in iron concentrations of about 1 mg/L per year for all wells near cross-section I. From 1995–1997 to 2007, the mean iron concentration at well 22 decreased from 14.4 mg/L by about 50% and remained stable between 6 and 8 mg/L during the period from 2007 to 2016 as a result of high iron concentrations in landside groundwater. Which iron concentrations should be expected in the bank filtrate in the long term? In the Elbe valley at Torgau, the steady operation of the wells is likely to cause a continued displacement of the iron-rich pore water and eventually lead to iron concentrations below 3 mg/L in bank filtrate, even at cross-section II, which had a high initial iron concentration in the groundwater. In 2006, the mean iron concentrations in OW II-5/3 and well 33 were 3.2 mg/L (n = 7) and 23.1 mg/L (n = 9), respectively. Later on, sampling was reduced to specific observation wells. Pumping from well 33 was stopped in 2009 due to a decreasing water demand and the option to pump water with lower iron concentrations from other wells. Thus, the further development of iron concentrations could not be investigated.
The Fe(II) concentrations in the bank filtrate continue to fall as the well galleries operate over the years, as Figure 7 shows in principle, and are hardly influenced anymore by reductive processes. The increased portion of bank filtrate in the raw water caused by higher pumping rates is causing a decrease in the iron concentration of the raw water down to a threshold value that is determined by the influx of landside groundwater. The well galleries are designed for long-term continuous operation. This creates a continuous replacement of the iron-rich water in the area between the wells and the river.
Before the well galleries started operating, the Elbe valley at Torgau was characterized by unusually high iron concentrations between 10 and 100 mg/L in the middle and lower depths of the aquifers, mainly as a result of pyrite oxidation. At the majority of the OW, the highest iron concentrations were found at medium depths (20 to 30 m below the water table) together with high sulphate concentrations (see Table 1, OW I-21/3). The high iron concentrations of the landside groundwater are not likely to decrease in the coming decades due to a very low flow velocity of less than 0.1 m/d. Even at a 60%–65% portion of bank filtrate, with its ever-decreasing iron concentrations, 10 mg/L is the lowest concentration that is likely to be achieved in the raw water.
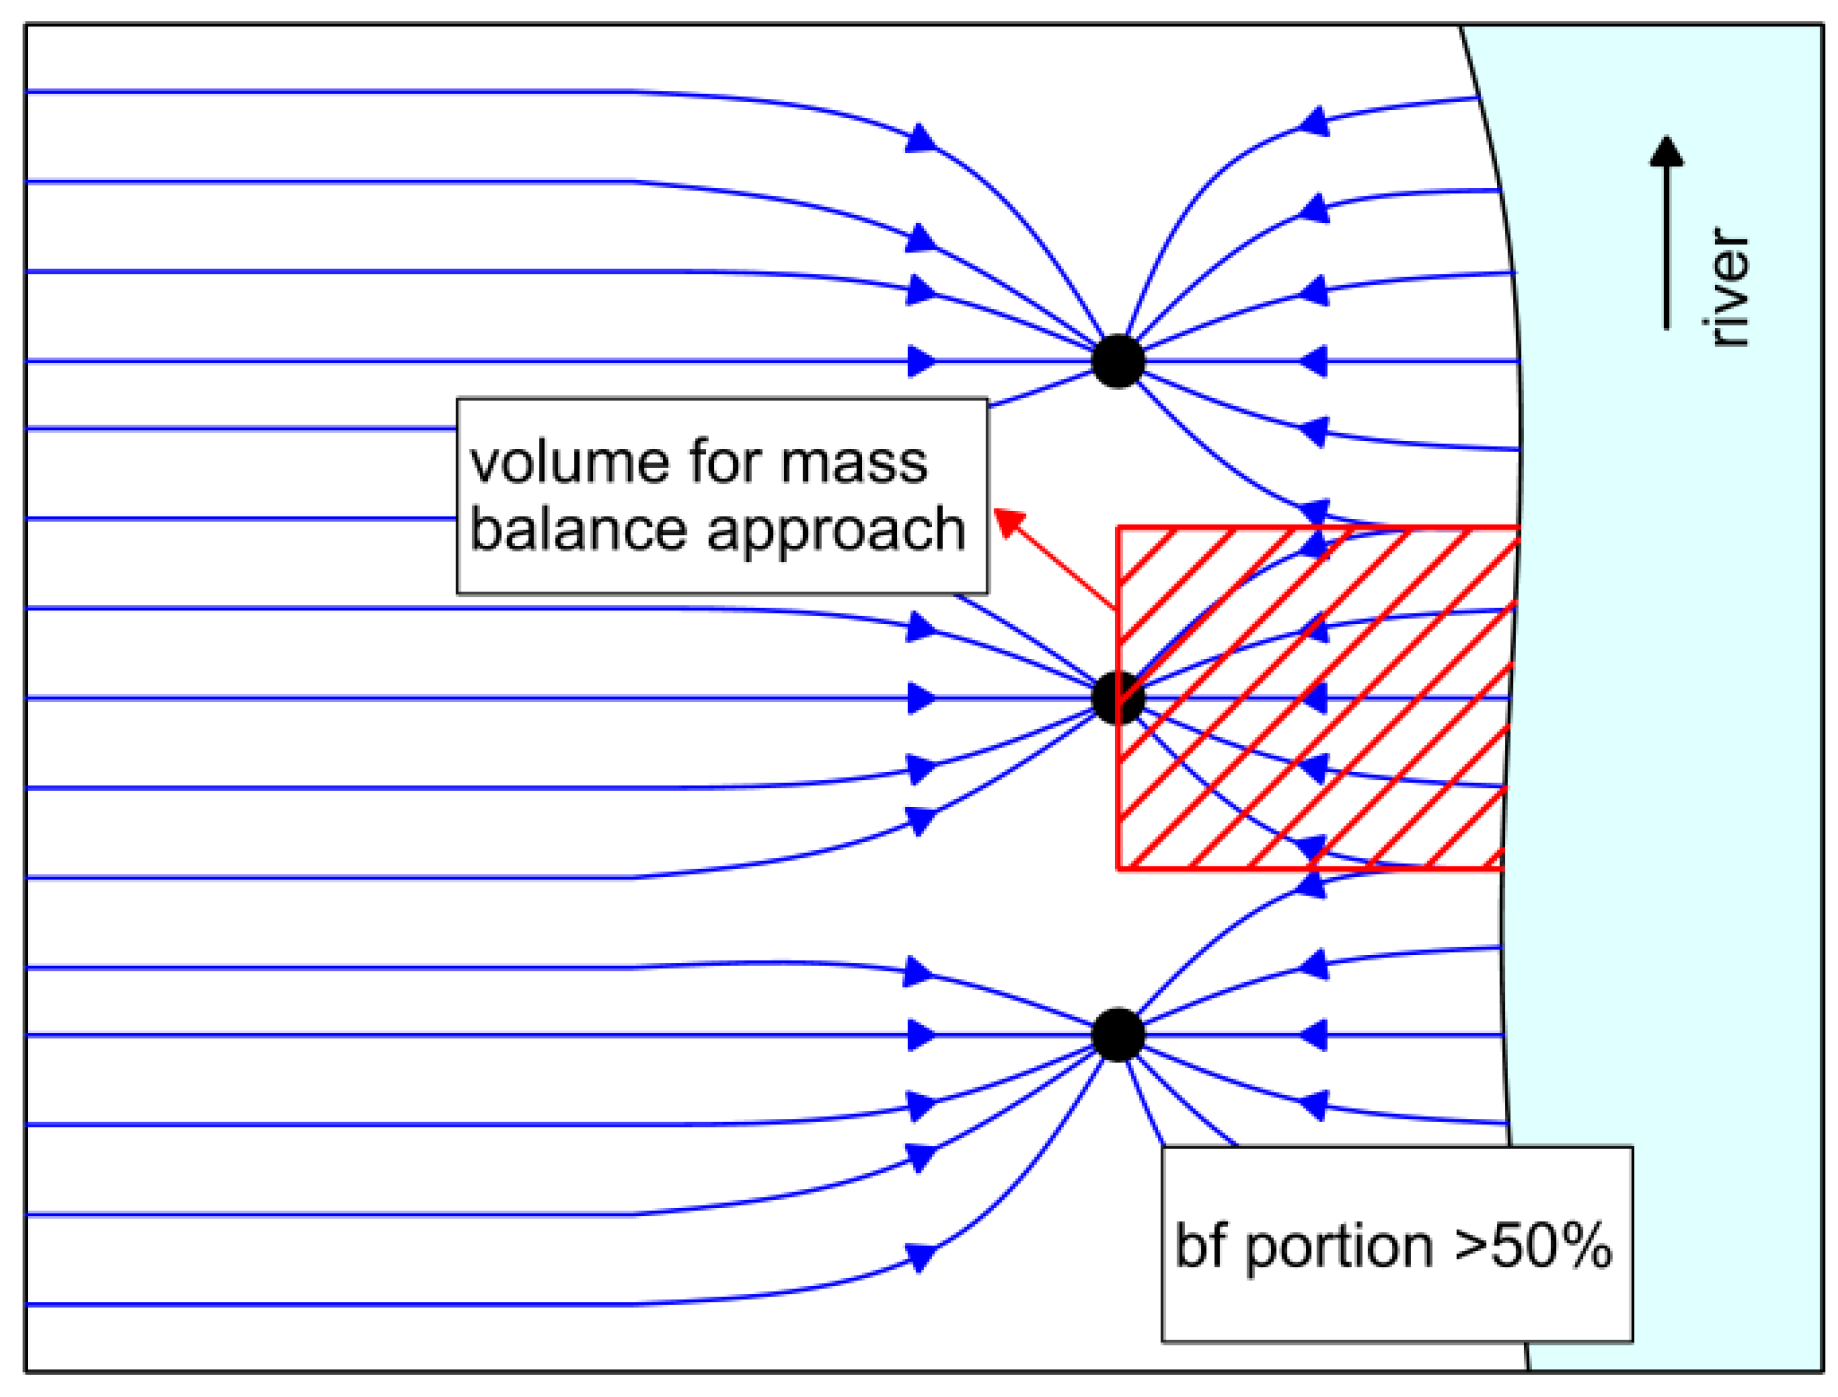
The location of wells 22 and 33 within well groups allowed an estimation of the region of the aquifer from which they receive water if all wells are active. Figure 12 shows the principle of fixing the catchment area, which is much more difficult for single wells. If data on the bank filtrate portion, flow conditions, thickness of the aquifer, and easily-reducible fraction of iron in the aquifer material are available, and an input concentration of iron beneath the riverbed can be neglected, a simple calculation can be done to theoretically estimate the time at which the available iron in the aquifer between the wells is mainly removed.
For cross-section II in Torgau, a pool of >2.5 million kg iron was calculated for the actively-used part of the aquifer based on about 2500 mg/kg soluble iron in the lab experiments (Figure 11). At a pumping rate of about 150 m3/h, a portion of bank filtrate of 50% and a starting iron concentration in the bank filtrate of about 40 mg/L (optimistic approach with start concentration, Figure 10), a removal of 26,280 kg iron per year can be calculated. Assuming a stable removal rate despite the observed decrease in iron concentrations in bank filtrate due to different flow paths in the aquifer, a complete iron removal would be achieved within 95 years. This is much longer than the field observations indicate. Reasons for such overestimation of time are neglecting lower iron concentrations in the aquifer in the upper layer and near the river due to surface water–groundwater interaction before installation of the RBF scheme, optimistic observations along cross-section II at the centre of the defined area presenting the shortest travel times, and different flow velocities in different aquifer layers resulting in faster “wash out” along preferred flow paths in layers having a higher hydraulic conductivity. On the other hand, this explains the slow response of the iron concentration in well water (Figure 10). In summary, the mass balance approach gave a rough and more pessimistic estimate for the time required for rendering the aquifer section between the well and the river becoming iron-free.
4.2. Control of Iron Concentration as an Aspect of Planning New RBF Sites
In designing new RBF sites, the first step should be a comparison with existing sites with similar boundary conditions. Field experiments using observation wells to study the removal efficiency and to obtain parameters for the design of large RBF facilities are only useful if the pumping rates are high and the experiments are carried out for a long time (years). Such field studies should be accompanied by batch and/or column experiments in the laboratory using actual river water and sediments from the riverbed and aquifer at the site in question. These experiments could be completed within six months. After installation of abstraction wells, a minimum of two observation wells should be placed between the riverbank and the wells and one on the land side of the wells, each with sampling points at different depths depending on the thickness of the aquifer. If frequent sampling is difficult to manage, e.g., during long winter periods, a continuous automated measurement of water temperature and electrical conductivity in the observation wells using probes and data loggers is advised [13].
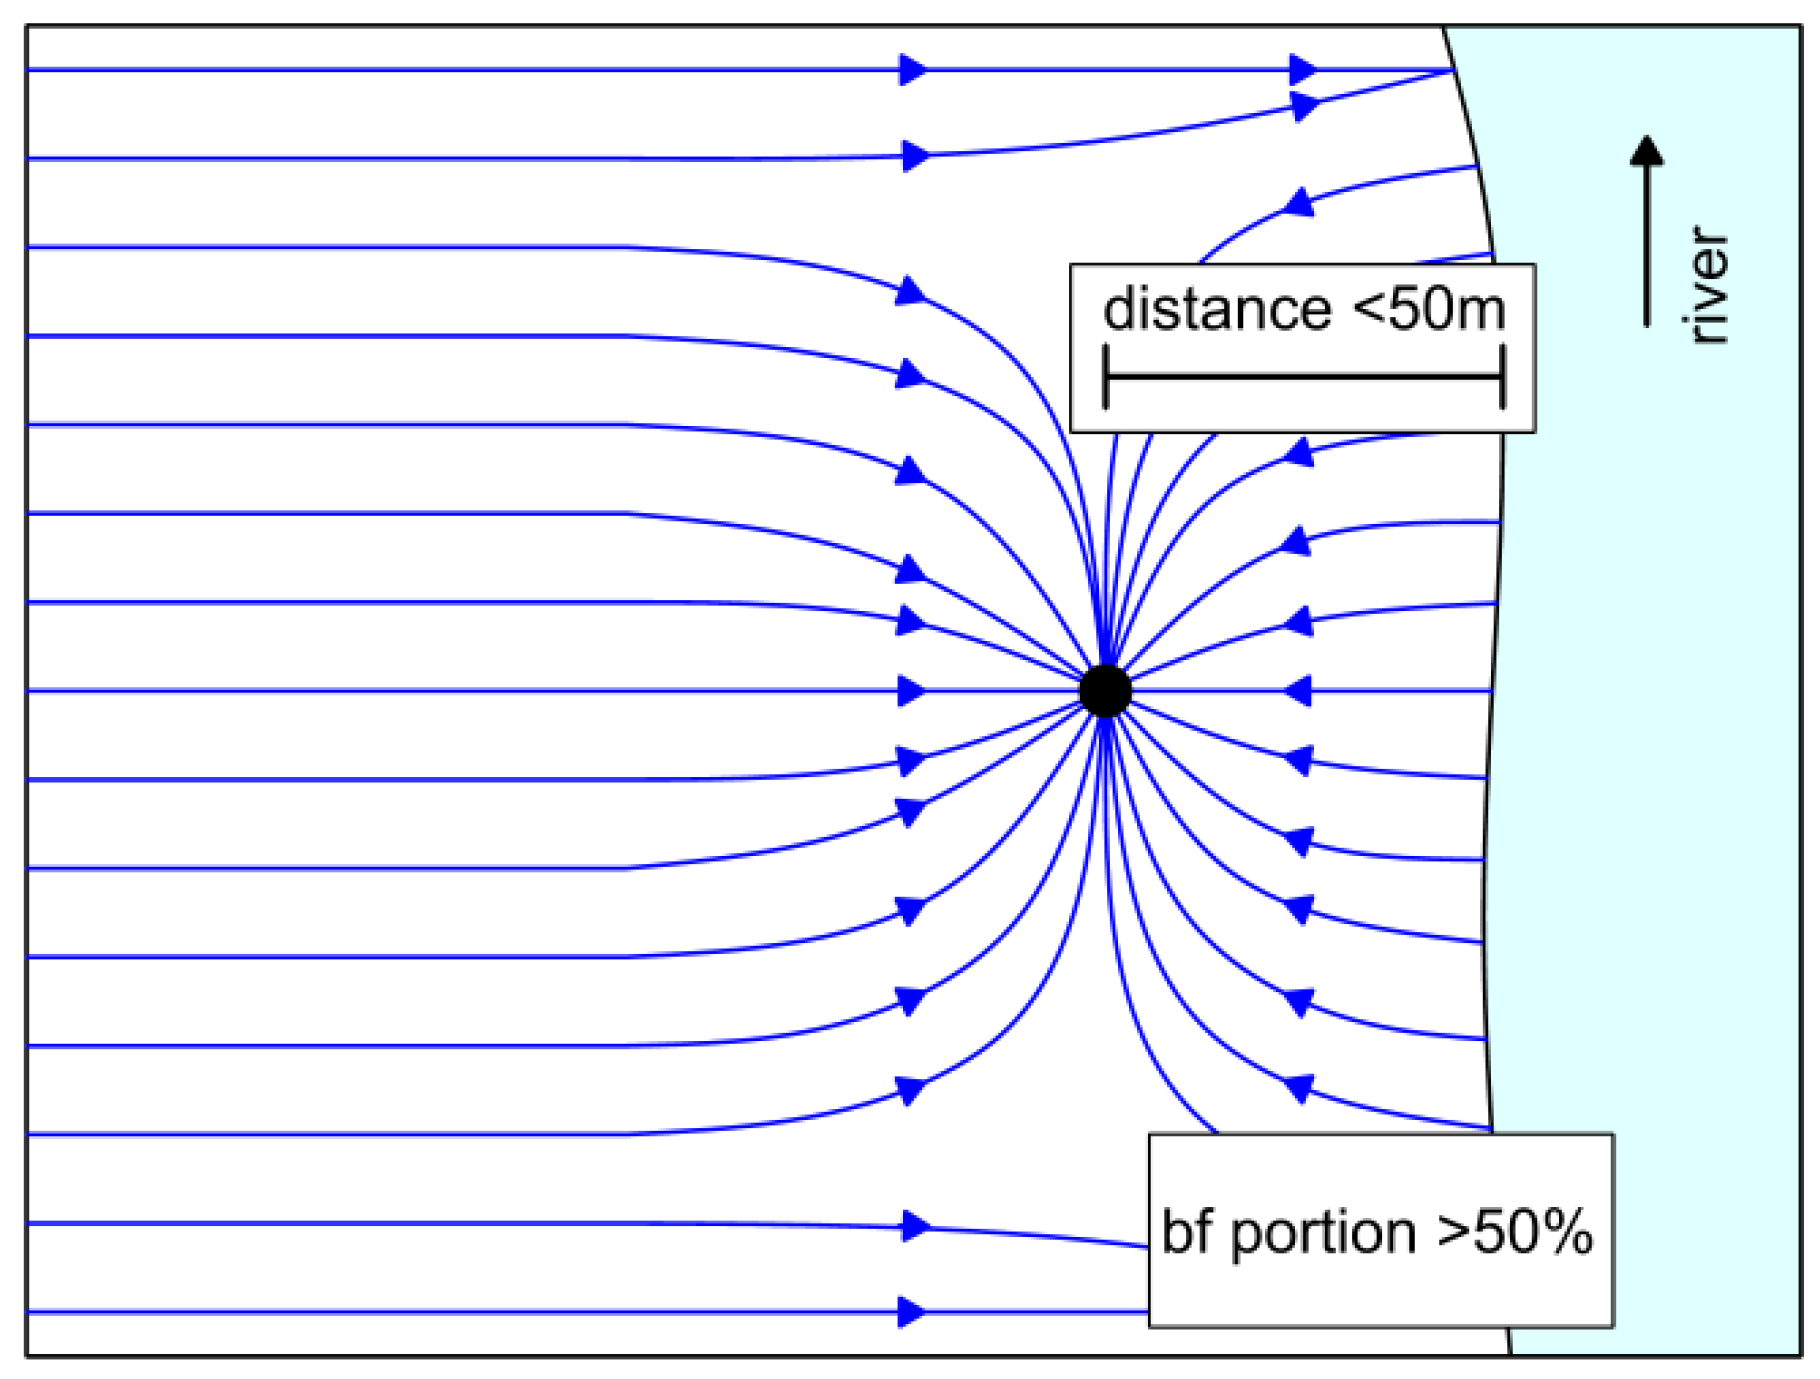
The occurrence of iron in groundwater is a common problem that constrains wide groundwater use for drinking water supplies worldwide. For example, in Egypt, a baseline national water quality monitoring report [14] indicated a high level of iron and manganese in some observation wells in the Nile delta. Iron concentrations in the Quaternary aquifer of the Nile delta exceed the Egyptian drinking water standards of 0.3 mg/L in about 20% of wells sampled [15] with a maximum value of 1.7 mg/L [16]. There is great potential for RBF in Egpyt [17]. However, elevated iron concentrations in landside groundwater indicate that the part of the aquifer between the riverbank and the newly-planned pumping well could release iron in the long term, even if the biodegradable portion of DOC of the river water is low and redox processes are limited. Control of iron concentration by specific well operation will be marginal. Design parameters of an RBF scheme, such as the number and pumping rates of wells and the distance between the wells and the riverbank, are the most important. If RBF is mainly used to remove particles and pathogens, and to achieve some pre-treatment, the wells might be placed near to the riverbank (Figure 13), thereby pumping a higher portion of bank filtrate and achieving lower iron concentrations in raw water after several months or years. Therefore, it is necessary to understand flow conditions, especially if test wells are operated.
Intermittent operation of the wells, or the entire gallery, should be avoided, since this would allow the iron-rich landside groundwater to spill over the wells into the area between the river and the wells, erasing the positive effects on total iron concentration in the raw water achieved through the continuous extraction of bank filtrate (Figure 7).
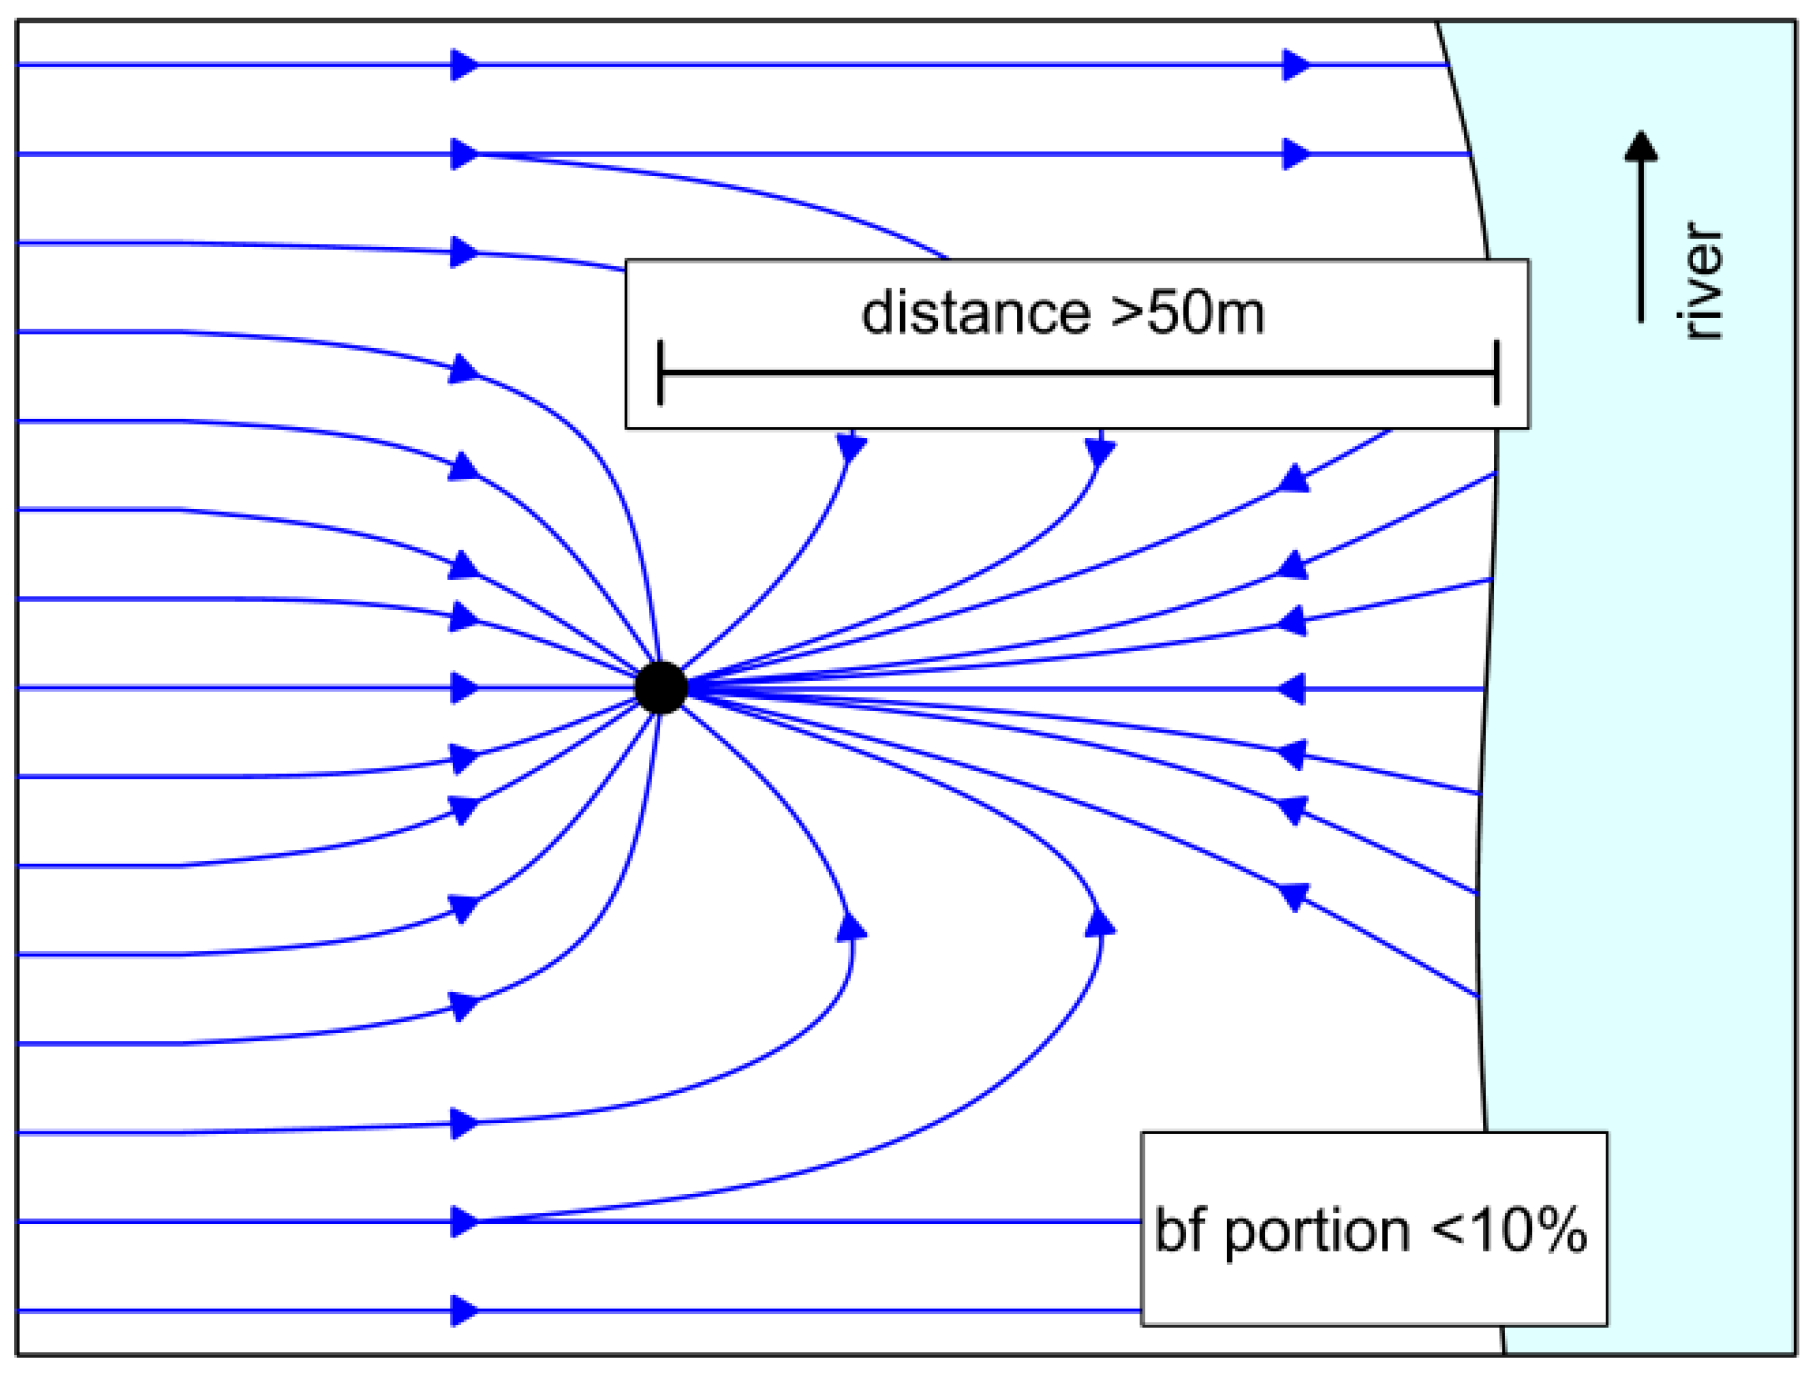
In some cases, the pumping rate of a test well has been too low compared to the distance to the riverbank, or it was not continuously pumped [13]. In such cases (Figure 14), the portion of bank filtrate would be very low and no “wash out” effect for iron would be observed.
A high portion of bank filtrate, which could be achieved by locating wells on an island or in a meander, could be advantageous for preventing the necessity of iron removal in post-treatment. As the composition and clogging of the riverbed are of major importance, the potential of iron, manganese, and arsenic remobilization within the riverbed should be investigated in detail, e.g., using column experiments with original riverbed sediment and river water.
4.3. Further Issues Related to Manganese Release
If redox processes cause remobilization of metals along the flow path of bank filtrate, an increase in manganese is frequently also observed, which is more difficult to handle than iron during post-treatment. Possibilities of influencing the manganese concentration in mixed raw water were investigated at two sites in Germany by altering the operation of bank filtration wells. Success depends on the boundary conditions affecting the release of manganese, as well as the operational demands with respect to the choice, operating time, and discharge rates of the wells. The change in manganese concentration during bank filtration fundamentally depends on the groundwater flow velocity (residence time), temperature, pH, the presence and thickness of a clogging layer on the bank of the surface water body, and the degree of oxygen consumption. The evaluation of data from bank filtration sites in Meissen and Dresden along the Elbe River show that manganese concentrations in pumped raw water are most influenced by the mode of operation of the wells and the resulting mixture ratio. Depth-dependent sampling in individual pumping and observation wells was a precondition to distinguish between mixing and redox processes. A mass balance study of manganese in riverbed sediment and aquifer material showed that manganese can be released over a period of many decades during an anoxic subsurface passage of bank filtrate [18]. Finally, it has to be mentioned that the remobilization of manganese is more difficult to predict, as observed in aquifer storage and recovery studies in The Netherlands [19,20] and at a lake bank filtration site in Berlin, Germany [21].
5. Conclusions
Current guidelines do not exist to support engineers in identifying appropriate sites for RBF. A complex and comprehensive assessment of hydrological, hydrogeological, and hydrochemical aspects, together with information about country- and state-specific regulations, land use, cost, and other issues, are necessary for optimal RBF siting [9,22]. It is essential to have a clear understanding of how RBF will be utilized (e.g., as a means of pre-treatment or as a primary treatment) prior to commencing site location planning studies, as certain conditions may be likely to arise that demand additional technical measures.
At the RBF site at Torgau, a long-term “wash out” effect was observed, resulting in a slow, but steady decrease in iron concentrations between the riverbank and the abstraction well. Exchange processes in the aquifer can cause a long-term release of iron and manganese even if the DOC concentration is low. A combination of the sequential extraction of aquifer sediments and the mass balance approach proved that iron release can last several decades. Thus, at some sites, a short distance between the riverbank and the wells would be advantageous in lowering costs for further treatment.
Coupling of RBF and subsurface iron removal (SIR) is an interesting option and has been used for many years at Linz in Austria, Boker Heide in Germany, and Khabarovsk in Russia [23,24]. Results from a five-month field experiment coupling RBF and SIR in Torgau, Germany, showed satisfying iron removal which partly exceeded the expectations by far [24]. However, the results from the Torgau experiments cannot be simply transferred to other sites because of numerous factors affecting the chemical processes involved. The relatively large distance between the Elbe River and the pumping wells cause equilibration of concentrations and water levels to a higher degree than observed at other RBF sites.
Acknowledgments
The authors are grateful to the BMBF for funding the projects “NIRWINDU” (02WCL1356A) and “FHproUnt2012: Optimization of bank filtration and subsurface removal of iron and manganese” (03FH042PX2). Manganese data analysis was supported by an ESF grant (no. 200031585) to S. Paufler. The authors thank Fernwasserversorgung Elbaue-Ostharz GmbH and DREWAG Netz GmbH for providing data and supporting sampling campaigns.
Author Contributions
T.G. reviewed data from the Torgau RBF site, conducted samplings and lab experiments within his PhD work and later projects, S.P. reviewed literature on manganese dissolution and conducted field experiments at the Hosterwitz RBF site 2015–2016.
Conflicts of Interest
The authors declare no conflict of interest. The founding sponsors had no role in the design of the study; in the collection, analyses, or interpretation of data; in the writing of the manuscript, and in the decision to publish the results.
References
- Hiscock, K.; Grischek, T. Attenuation of groundwater pollution by bank filtration. J. Hydrol. 2002, 266, 139–144. [Google Scholar] [CrossRef]
- Kuehn, W.; Mueller, U. River bank filtration—An overview. J. AWWA 2000, 92, 60–69. [Google Scholar]
- Stuyfzand, P.J. Fate of pollutants during artificial recharge and bank filtration in the Netherlands. In Artificial Recharge of Groundwater; Peters, Ed.; Balkema: Rotterdam, The Netherlands, 1998; pp. 119–125. [Google Scholar]
- Ray, C.; Melin, G.; Linsky, R.B. Riverbank Filtration–Improving Source Water Quality; Kluwer Academic Publishers: Dordrecht, The Netherlands, 2003; p. 364. [Google Scholar]
- Grischek, T.; Hiscock, K.M.; Metschies, T.; Dennis, P.; Nestler, W. Factors affecting denitrification during infiltration of river water into a sand and gravel aquifer in Saxony, Germany. J. Water Res. 1998, 32, 450–460. [Google Scholar] [CrossRef]
- Diem, S.; Rudolf von Rohr, M.; Hering, J.G.; Kohler, H.P.; Schirmer, M.; von Gunten, U. NOM degradation during river infiltration: Effects of the climate variables temperature and discharge. J. Water Res. 2013, 47, 6585–6595. [Google Scholar] [CrossRef] [PubMed]
- Postma, D.; Mai, N.T.; Lan, V.N.; Trang, P.T.; Sø, H.U.; Nhan, P.Q.; Larsen, F.; Viet, P.H.; Jakobsen, R. Fate of arsenic during Red River water infiltration into aquifers beneath Hanoi, Vietnam. Environ. Sci. Technol. 2017, 51, 838–845. [Google Scholar] [CrossRef] [PubMed]
- German Standard Methods for the Examination of Water, Waste Water and Sludge; Cations (Group E); Determination of Iron (E1); DIN 38406-1; Beuth Verlag GmbH: Berlin, Germany, 1983.
- Grischek, T. Management of Bank Filtration Sites along the Elbe River. Ph.D. Thesis, Communication of the Institute for Groundwater Management, TU Dresden, Dresden, Germany, 2003; p. 252. (In German). [Google Scholar]
- Brand, K. Investigation of precipitation and remobilization of heavy metals Pb, Cd, Cu and Zn during bank filtration. In Schriftenreihe Angewandte Geologie Karlsruhe; Angewandte Geologie Karlsruhe: TH Karlsruhe, Germany, 1989; Volume 6, pp. 73–77. (In German) [Google Scholar]
- Nestler, W.; Walther, W.; Jacobs, F.; Trettin, R.; Freyer, K. Water Production in Alluvial Aquifers along the River Elbe; UFZ-Research Report 7; Helmholtz Centre for Environmental Research: Leipzig, Germany, 1998; p. 203. (In German) [Google Scholar]
- Clayton, R.G. Geochemical modelling of an unconfined aquifer adjacent to the River Elbe, Dresden. Master’s Thesis, NRG Fossil Fuels and Environmental Geochemistry, University of Newcastle, Callaghan, NSW, Australia, 1993. [Google Scholar]
- Bartak, R.; Grischek, T.; Ghodeif, K.O.; Wahaab, R.A. Shortcomings of the RBF pilot site in Dishna. Egypt. J. Hydro. Eng. 2015, 20. [Google Scholar] [CrossRef]
- NWRC. National Water Quality Monitoring Component: National Water Quality and Availability Management (NAWQAM) Project; National Water Research Center: Cairo, Egypt, 2003. [Google Scholar]
- El Arabi, N. Problems of groundwater quality related to the urban environment in Greater Cairo. In Impacts of Urban Growth on Surface Water and Groundwater Quality; IAHS Publ. No. 259; IASH Press: Wallingford, UK, 1999; pp. 29–38. [Google Scholar]
- Emara, M.M.; El Sabagh, I.; Kotb, A.; Turkey, A.S.; Husseen, D. Evaluation of drinking groundwater for the rural areas adjacent to the nearby desert of Giza governorate of Greater Cairo, Egypt. In Environmental Security in Harbors and Coastal Areas; Linkov, I., Kiker, G.A., Wenning, R.J., Eds.; Springer: Berlin, Germany, 2007; pp. 379–394. [Google Scholar]
- Ghodeif, K.; Grischek, T.; Bartak, R.; Wahaab, R.; Herlitzius, J. Potential of river bank filtration (RBF) in Egypt. Environ. Earth Sci. 2016, 75. [Google Scholar] [CrossRef]
- Paufler, S.; Grischek, T. Sources and behavior of manganese during riverbank filtration. In Proceedings of the 42nd IAH Congress AQUA 2015, Rome, Italy, 13–18 September 2015; p. 246. [Google Scholar]
- Antoniou, E.A.; Stuyfzand, P.J.; van Breukelen, B.M. Reactive transport modeling of an aquifer storage and recovery (ASR) pilot to assess long-term water quality improvements and potential solutions. Appl. Geochem. 2013, 35, 173–186. [Google Scholar] [CrossRef]
- Antoniou, E.A.; van Breukelen, B.M.; Putters, B.; Stuyfzand, P.J. Hydrogeochemical patterns, processes and mass transfers during aquifer storage and recovery (ASR) in an anoxic sandy aquifer. Appl. Geochem. 2012, 27, 2435–2452. [Google Scholar] [CrossRef]
- Henzler, A.; Greskowiak, J.; Massmann, G. Seasonality of temperatures and redox zonations during bank filtration – A modeling approach. J. Hydrol. 2016, 535, 282–292. [Google Scholar] [CrossRef]
- Sandhu, C. A Concept for the Investigation of Riverbank Filtration Sites for Potable Water Supply in India. Ph.D. Thesis, Faculty of Civil Engineering and Architecture, Dresden University of Applied Sciences, and Faculty of Environmental Sciences, Dresden, Germany, 2015. [Google Scholar]
- Herlitzius, J.; Sumpf, H.; Grischek, T. German-Russian cooperation for clean drinking water. Int. J. Water Manag. Bluefacts 2012, 76–81. [Google Scholar]
- Ahrns, J.; Klügel, S.; Schoenheinz, D.; Eichhorn, D.; Grischek, T. Subsurface iron removal at river bank filtration sites. In Proceedings of the IWA Eastern European Regional Young Water Professionals Conference, Minsk, Belarus, 21–22 May 2009; pp. 290–297. [Google Scholar]
Figure 1.
Schematic diagram of processes affecting iron and manganese concentration during riverbank filtration.
Figure 1.
Schematic diagram of processes affecting iron and manganese concentration during riverbank filtration.

Figure 2.
Case A—Low iron conc. in GW, increase due to RBF processes in riverbed and aquifer.

Figure 3.
Case B—High iron-conc. in GW feeding the river, low iron conc. near groundwater surface.
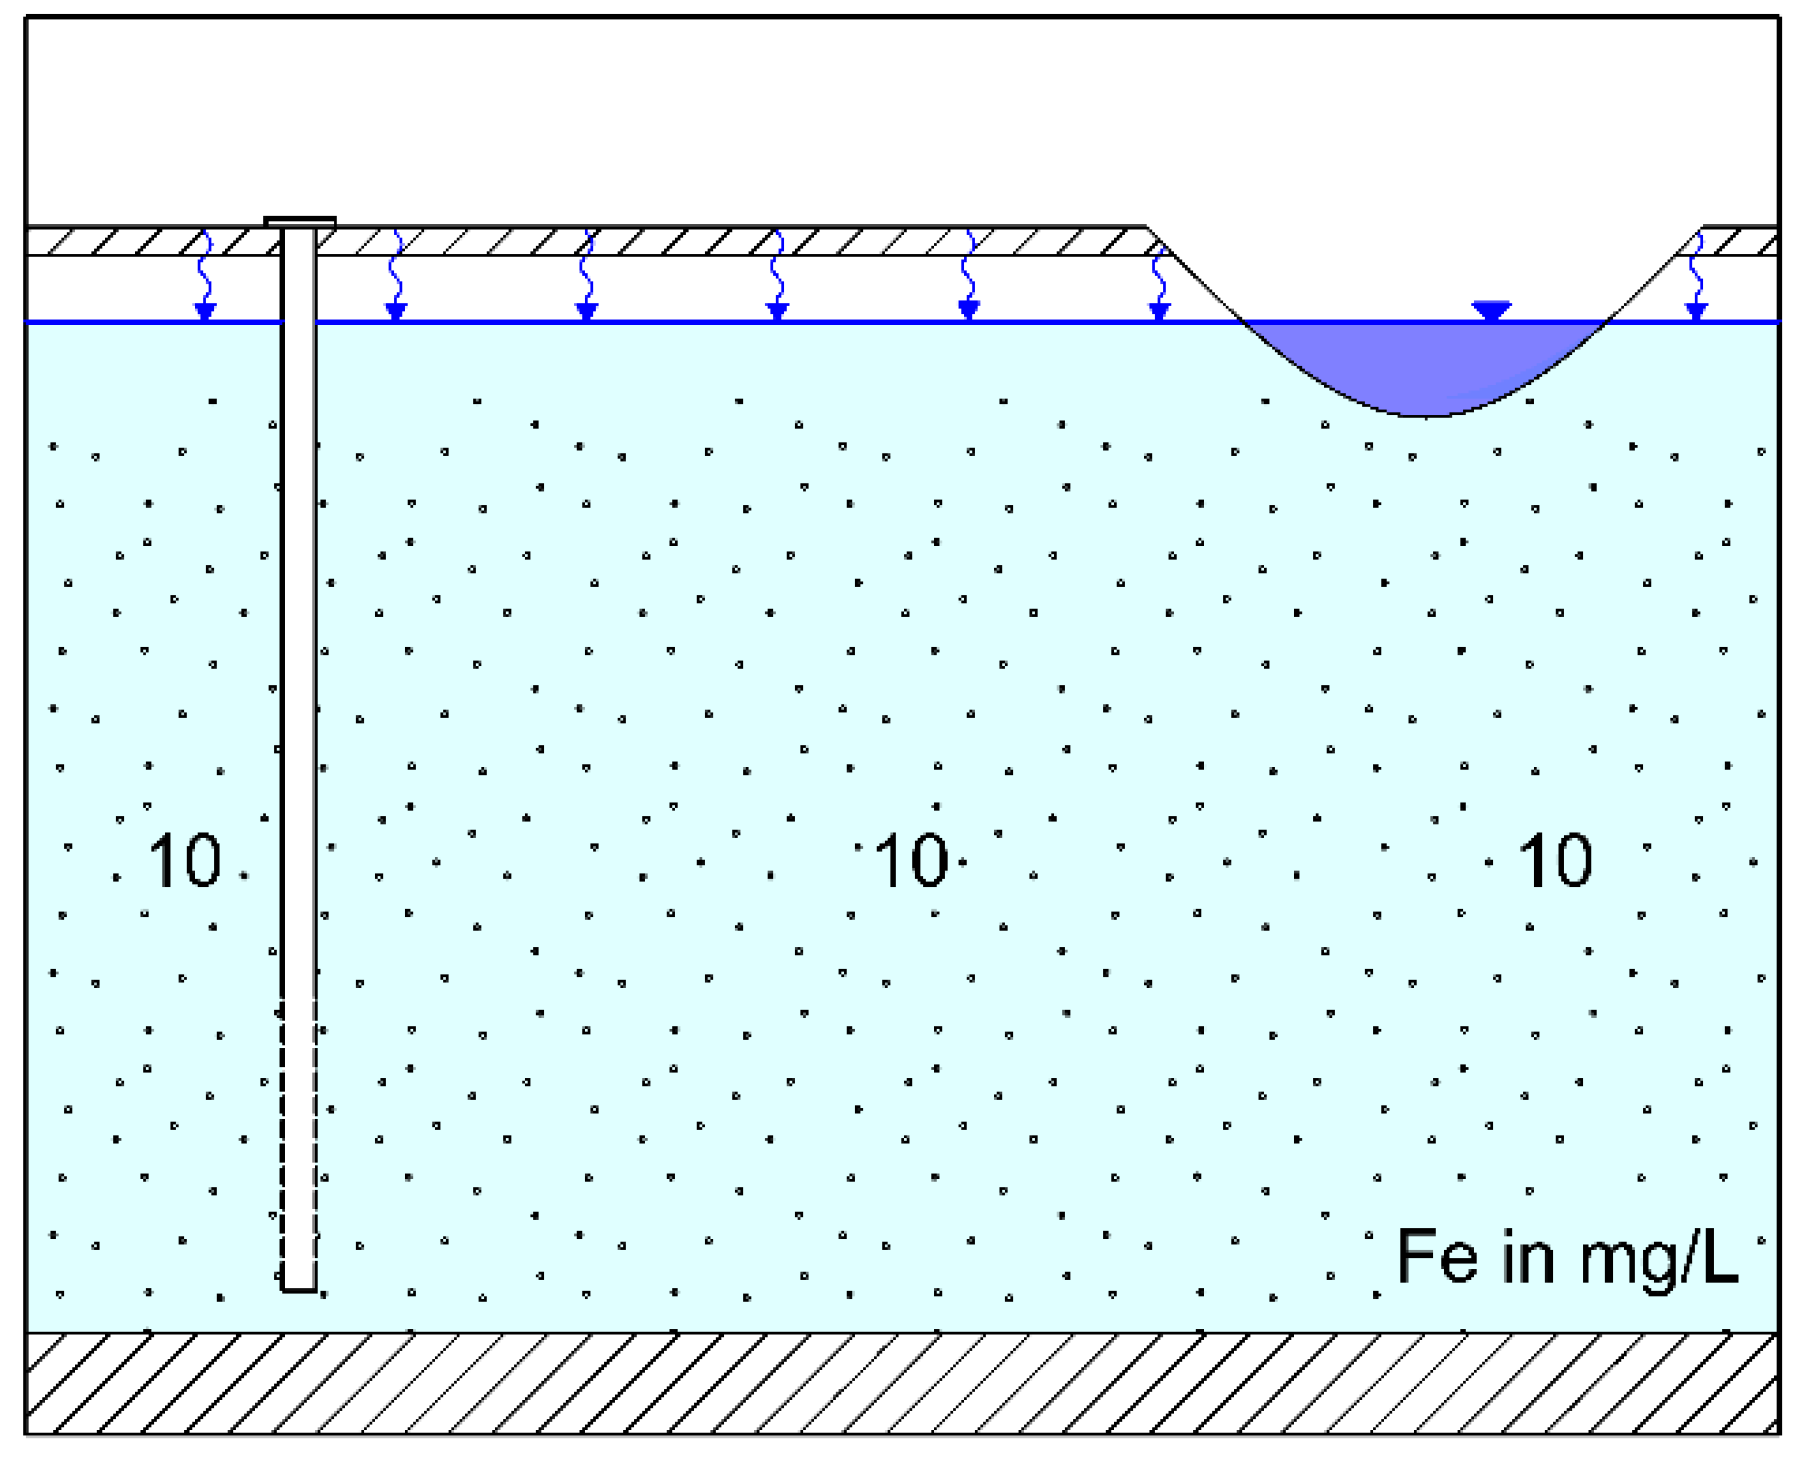
Figure 4.
Case B—Infiltration of river water resulting low iron conc. in bank filtrate.
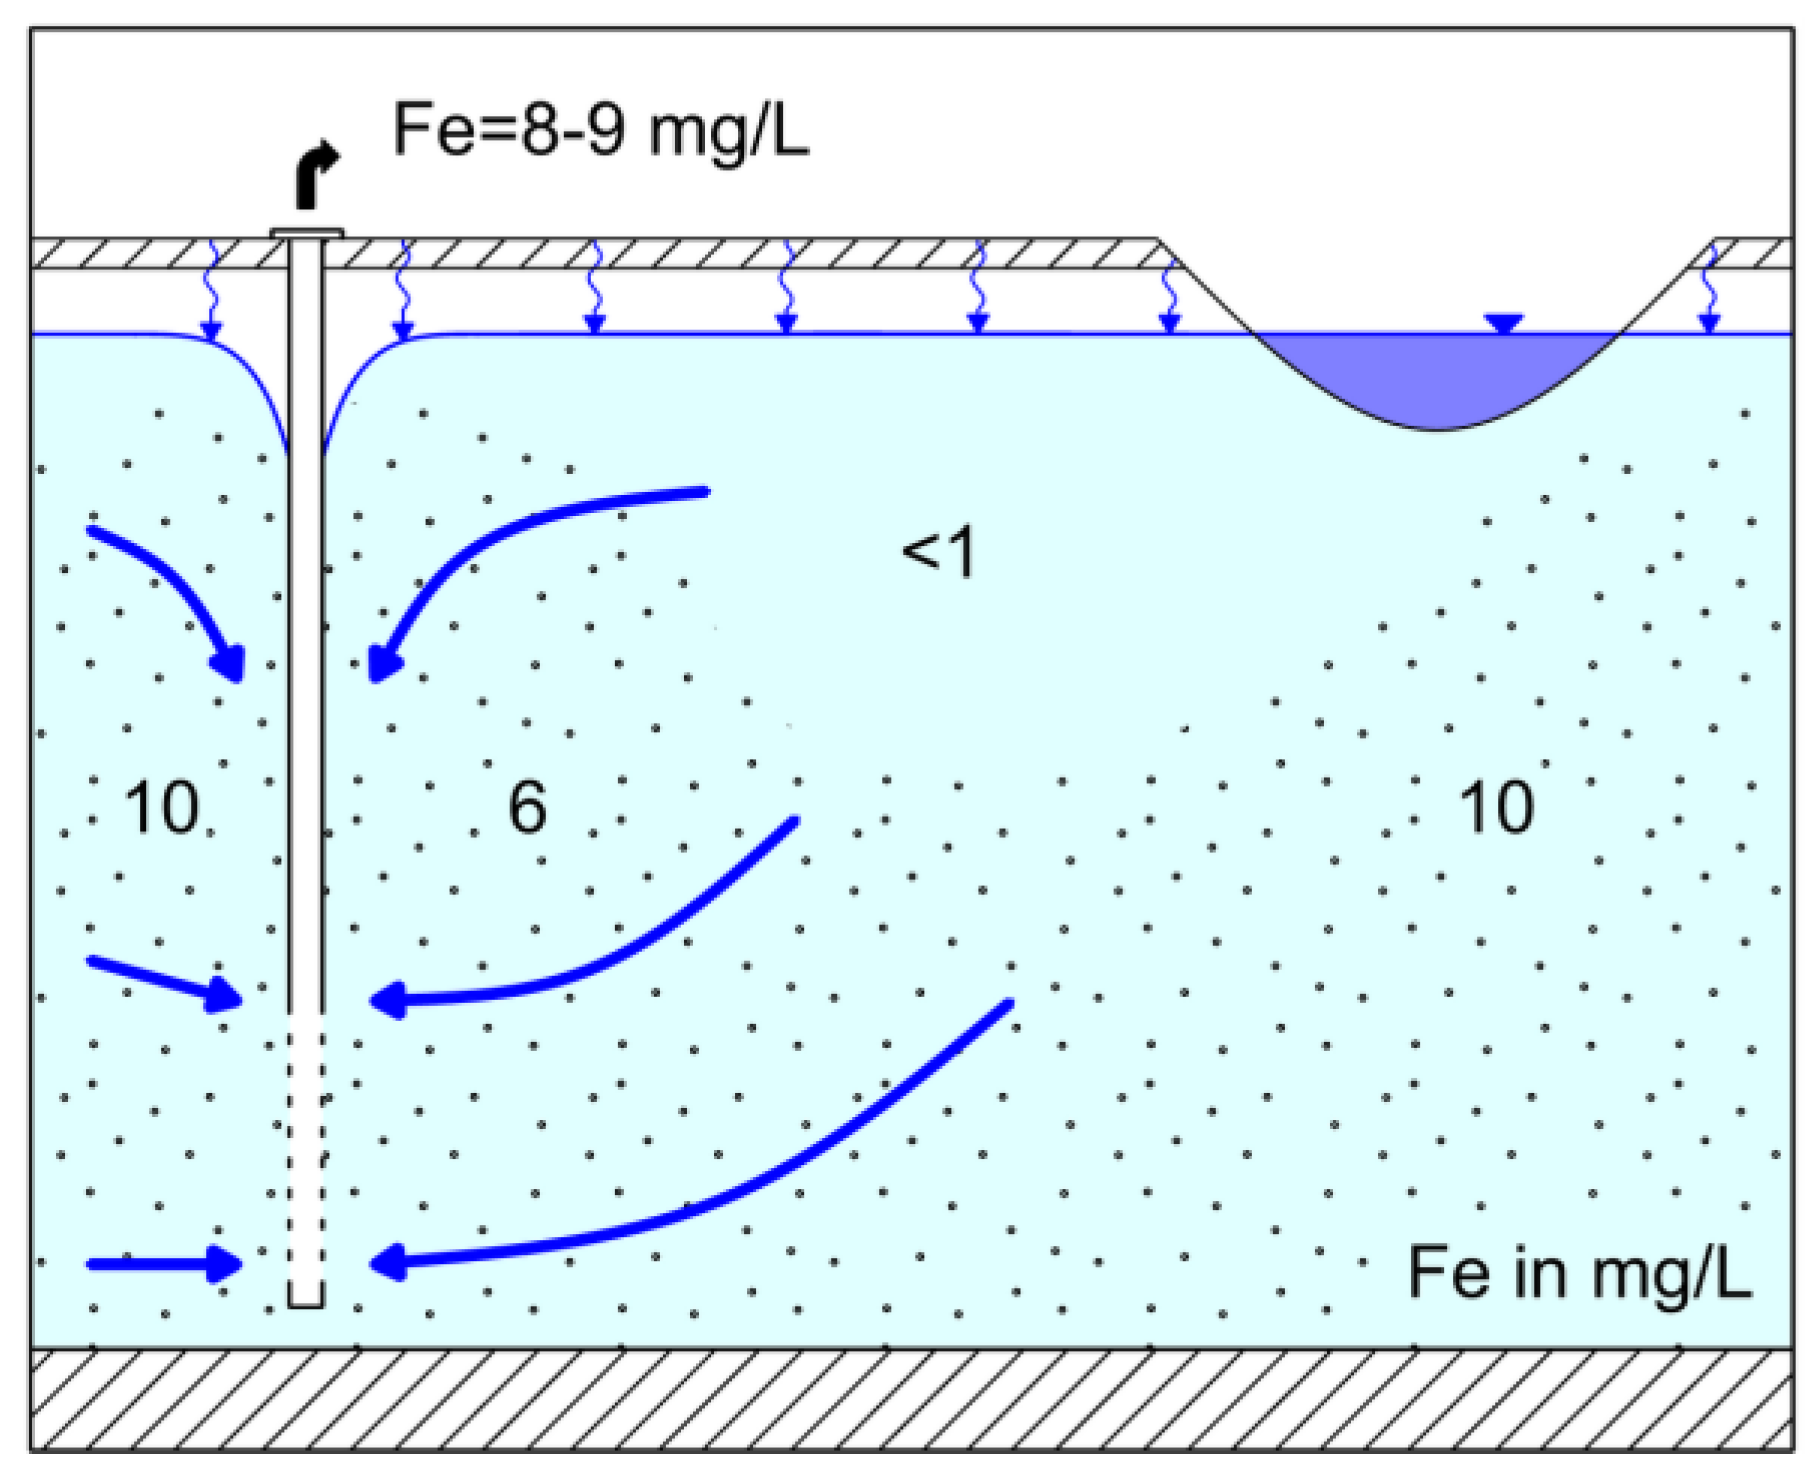
Figure 5.
Case B—Significant decrease in iron conc. in in pumped water after years or decades.

Figure 6.
Change in iron conc. in pumped water (PW) with time depending on iron conc. in GW.
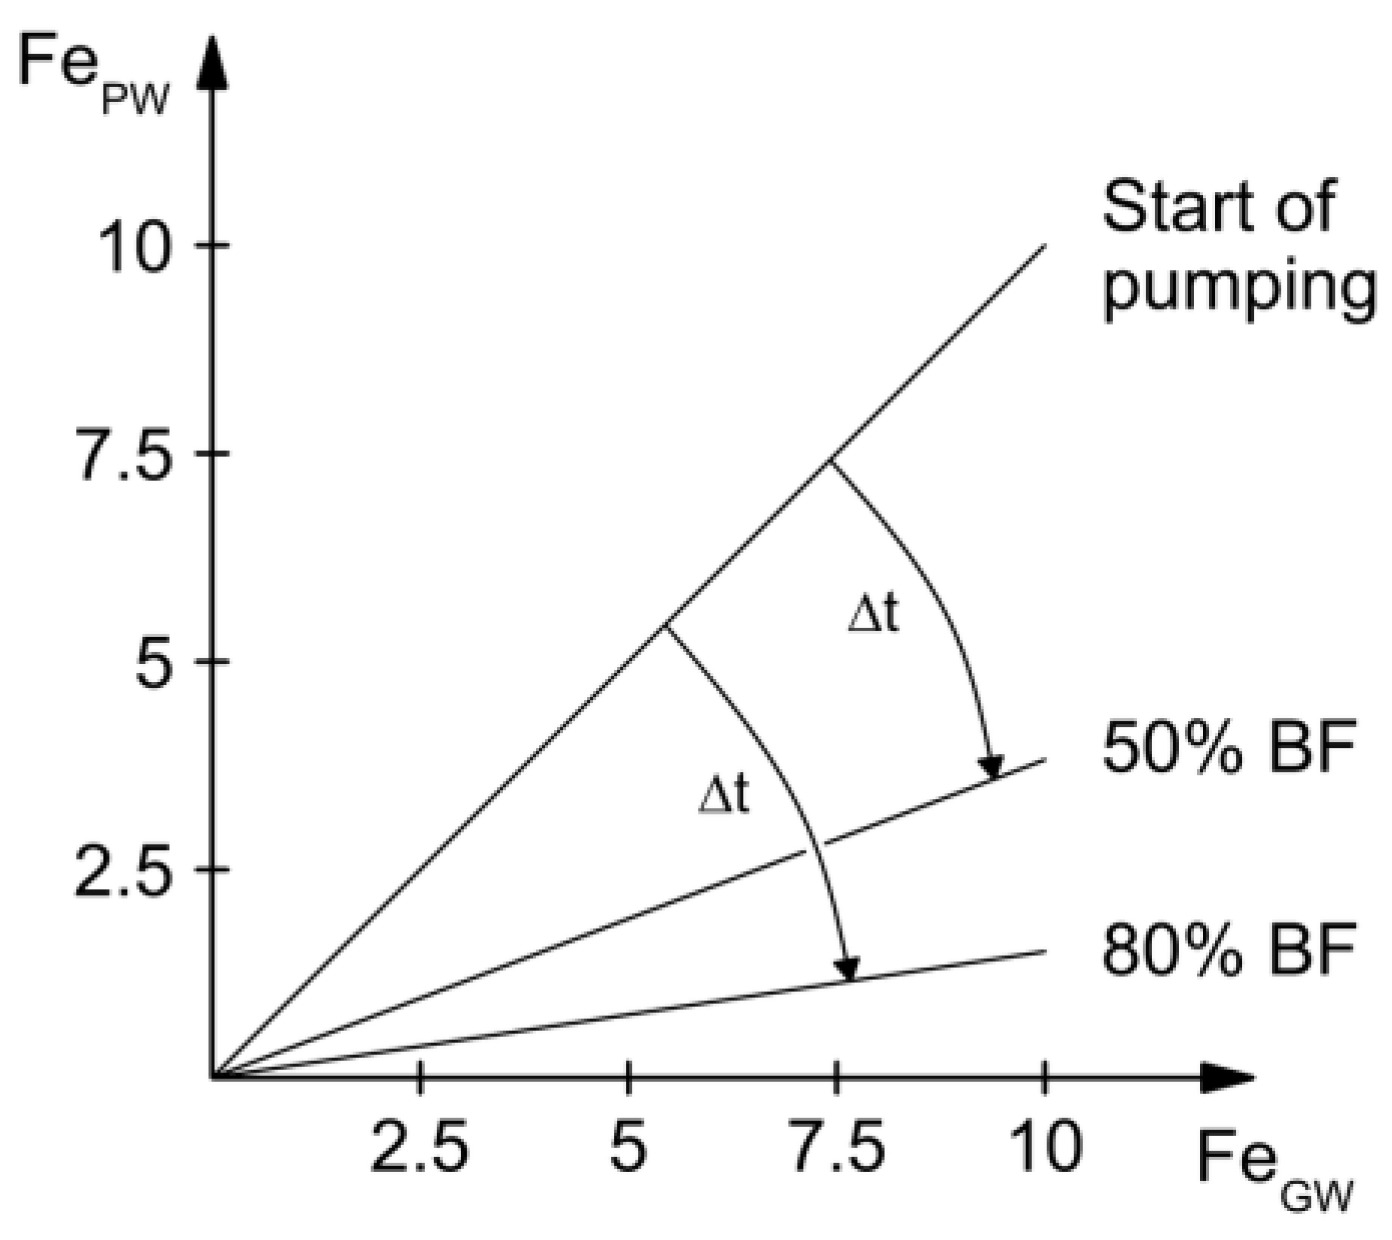
Figure 7.
Expected change in iron conc. in pumpedwater (PW) and bank filtrate (BF) for Case B.

Figure 8.
Location map of RBF site Torgau along the River Elbe, showing cross-sections I and II.

Figure 9.
Mean total iron concentrations in mg/L at (a) cross-section I and (b) cross-section II in Torgau, 1995-97 (n > 12), looking downstream.
Figure 9.
Mean total iron concentrations in mg/L at (a) cross-section I and (b) cross-section II in Torgau, 1995-97 (n > 12), looking downstream.
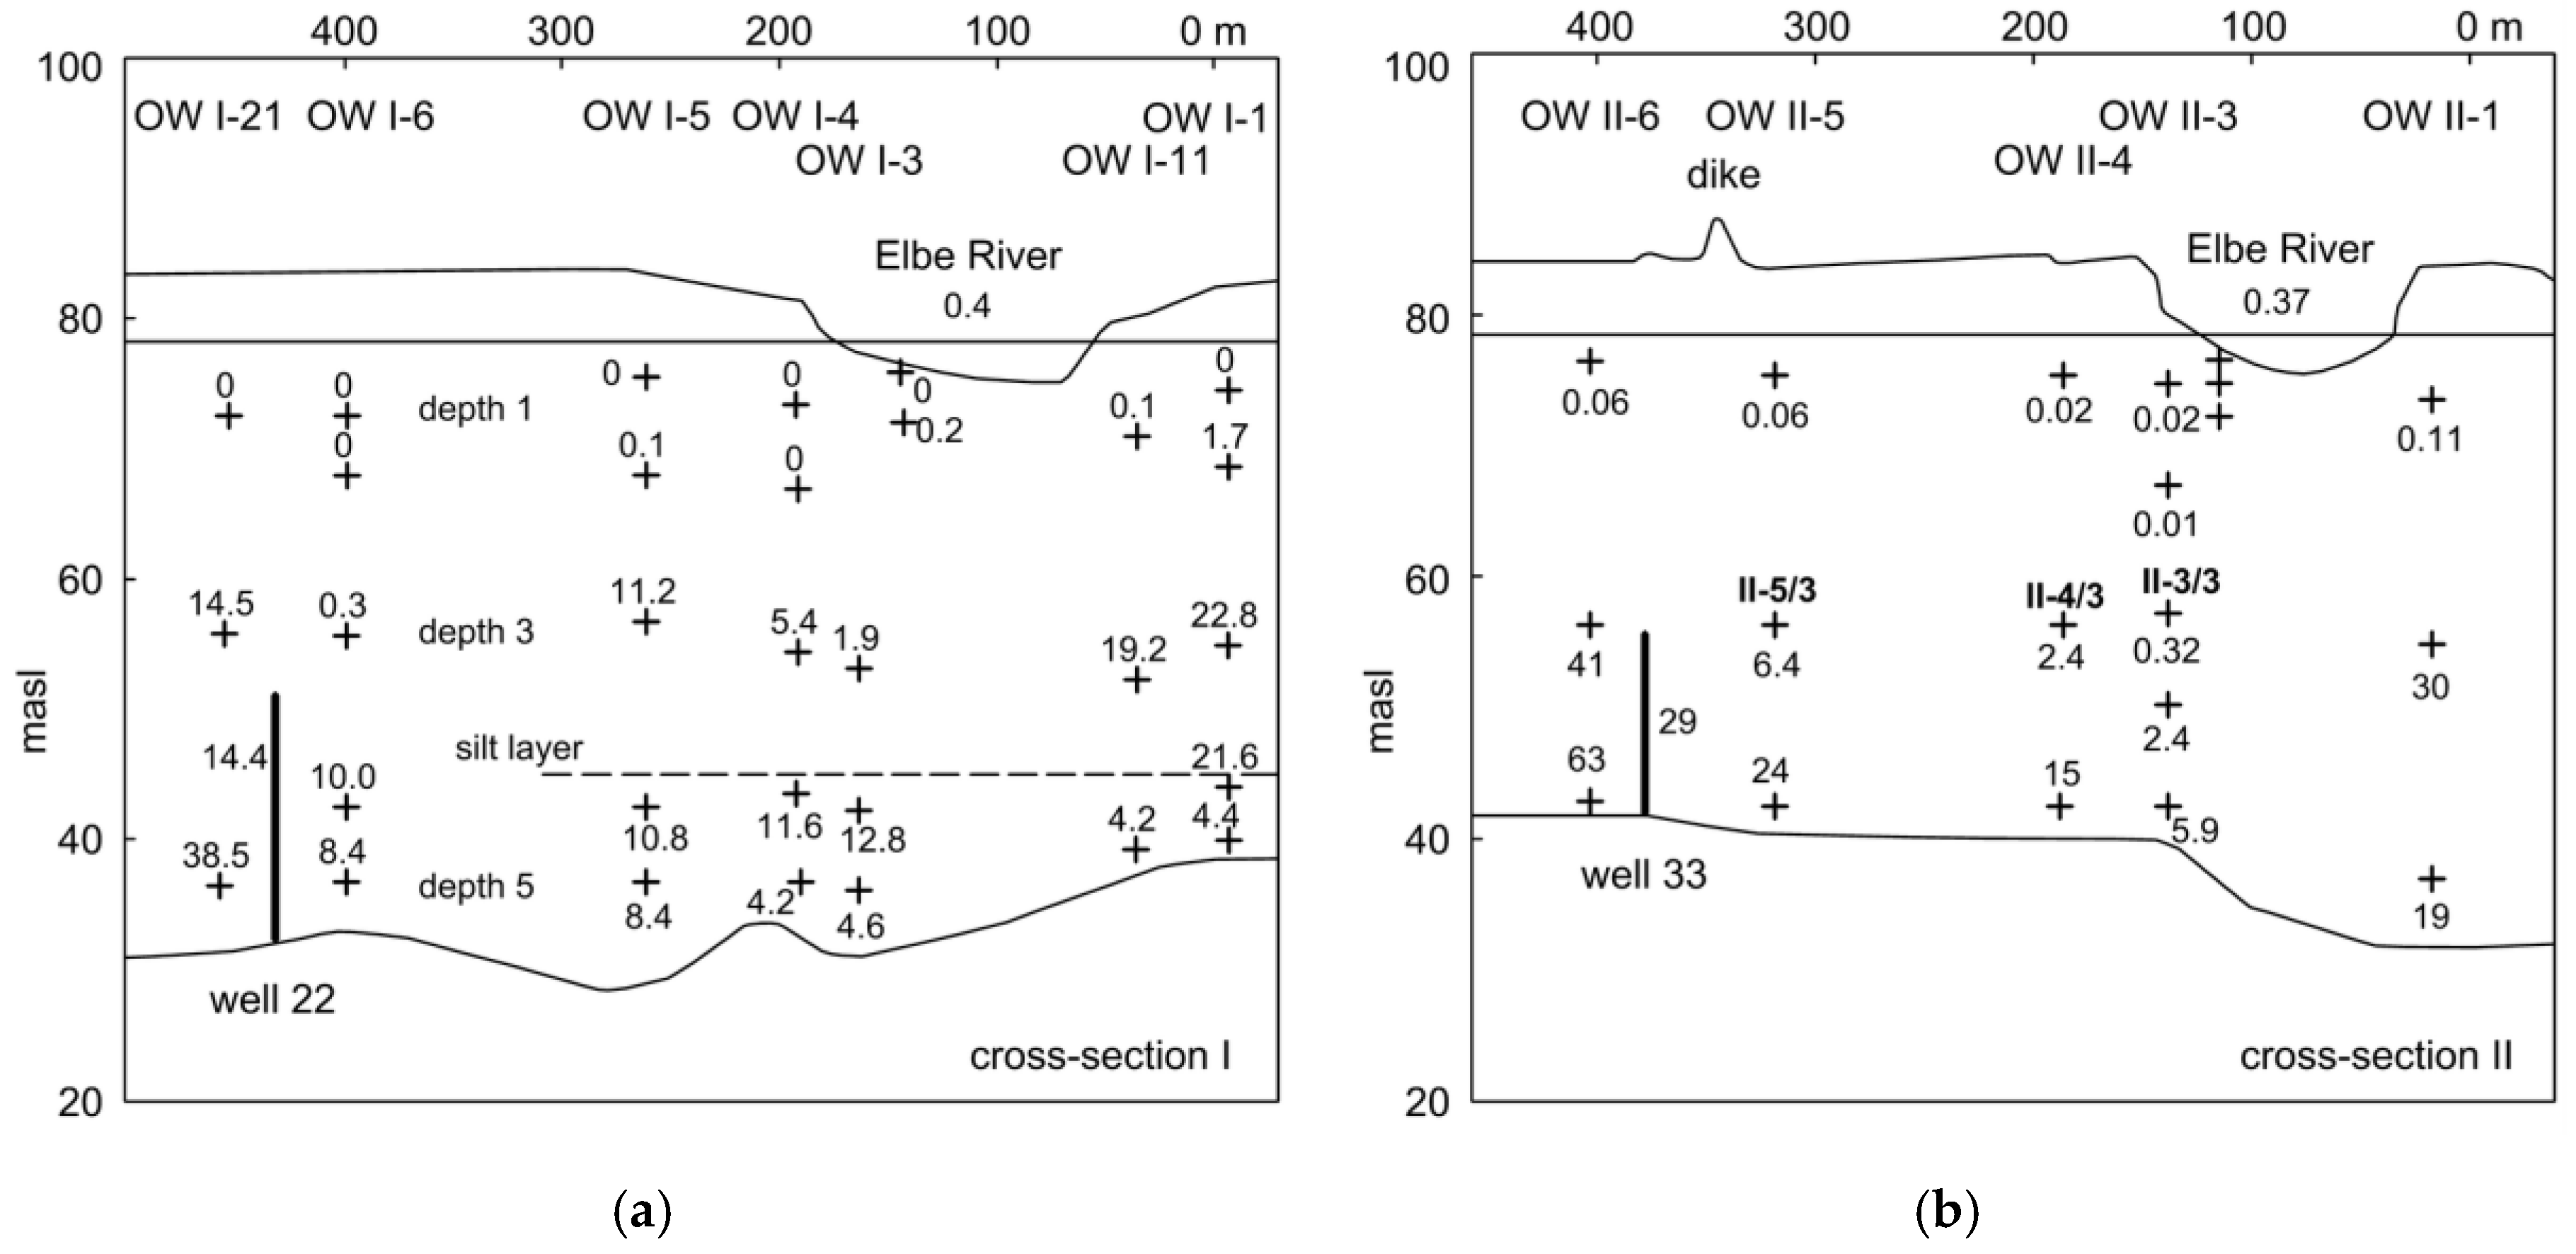
Figure 10.
Progression of total iron concentrations in mg/L, medium depth, and cross-section II in Torgau.
Figure 10.
Progression of total iron concentrations in mg/L, medium depth, and cross-section II in Torgau.
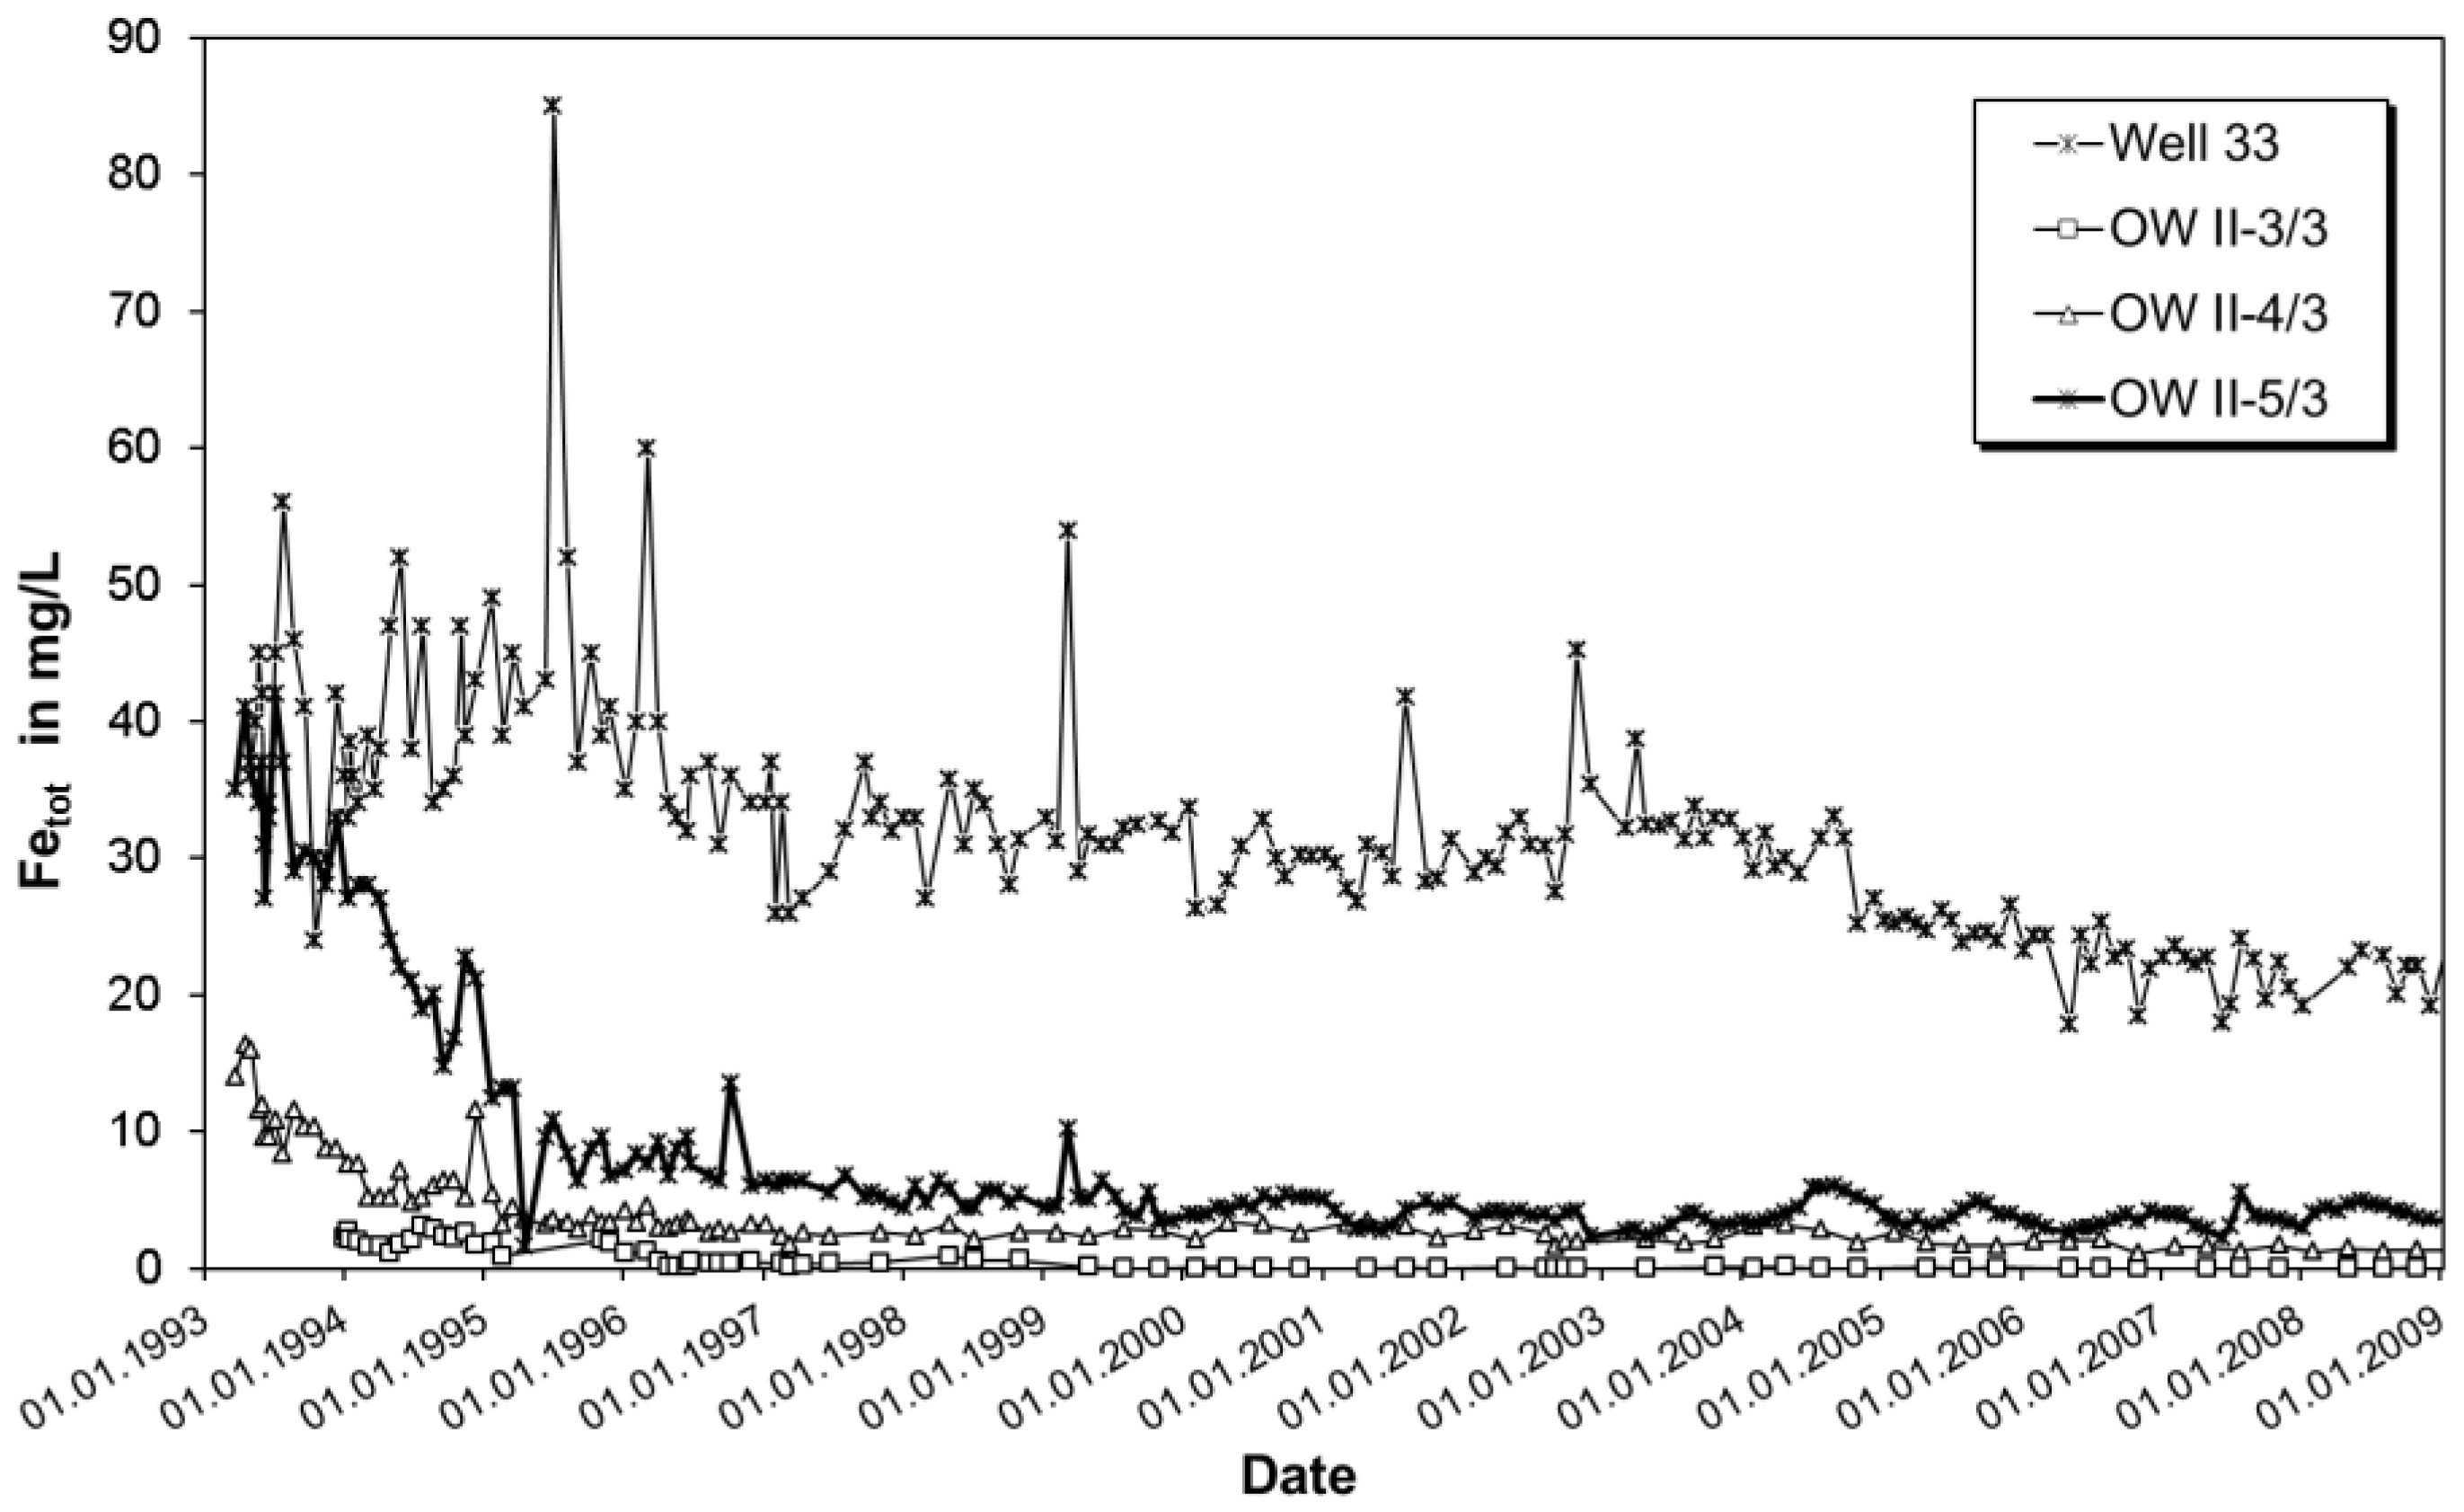
Figure 11.
Cumulative mass curves of the iron extracted from the soil samples from OW II-6.
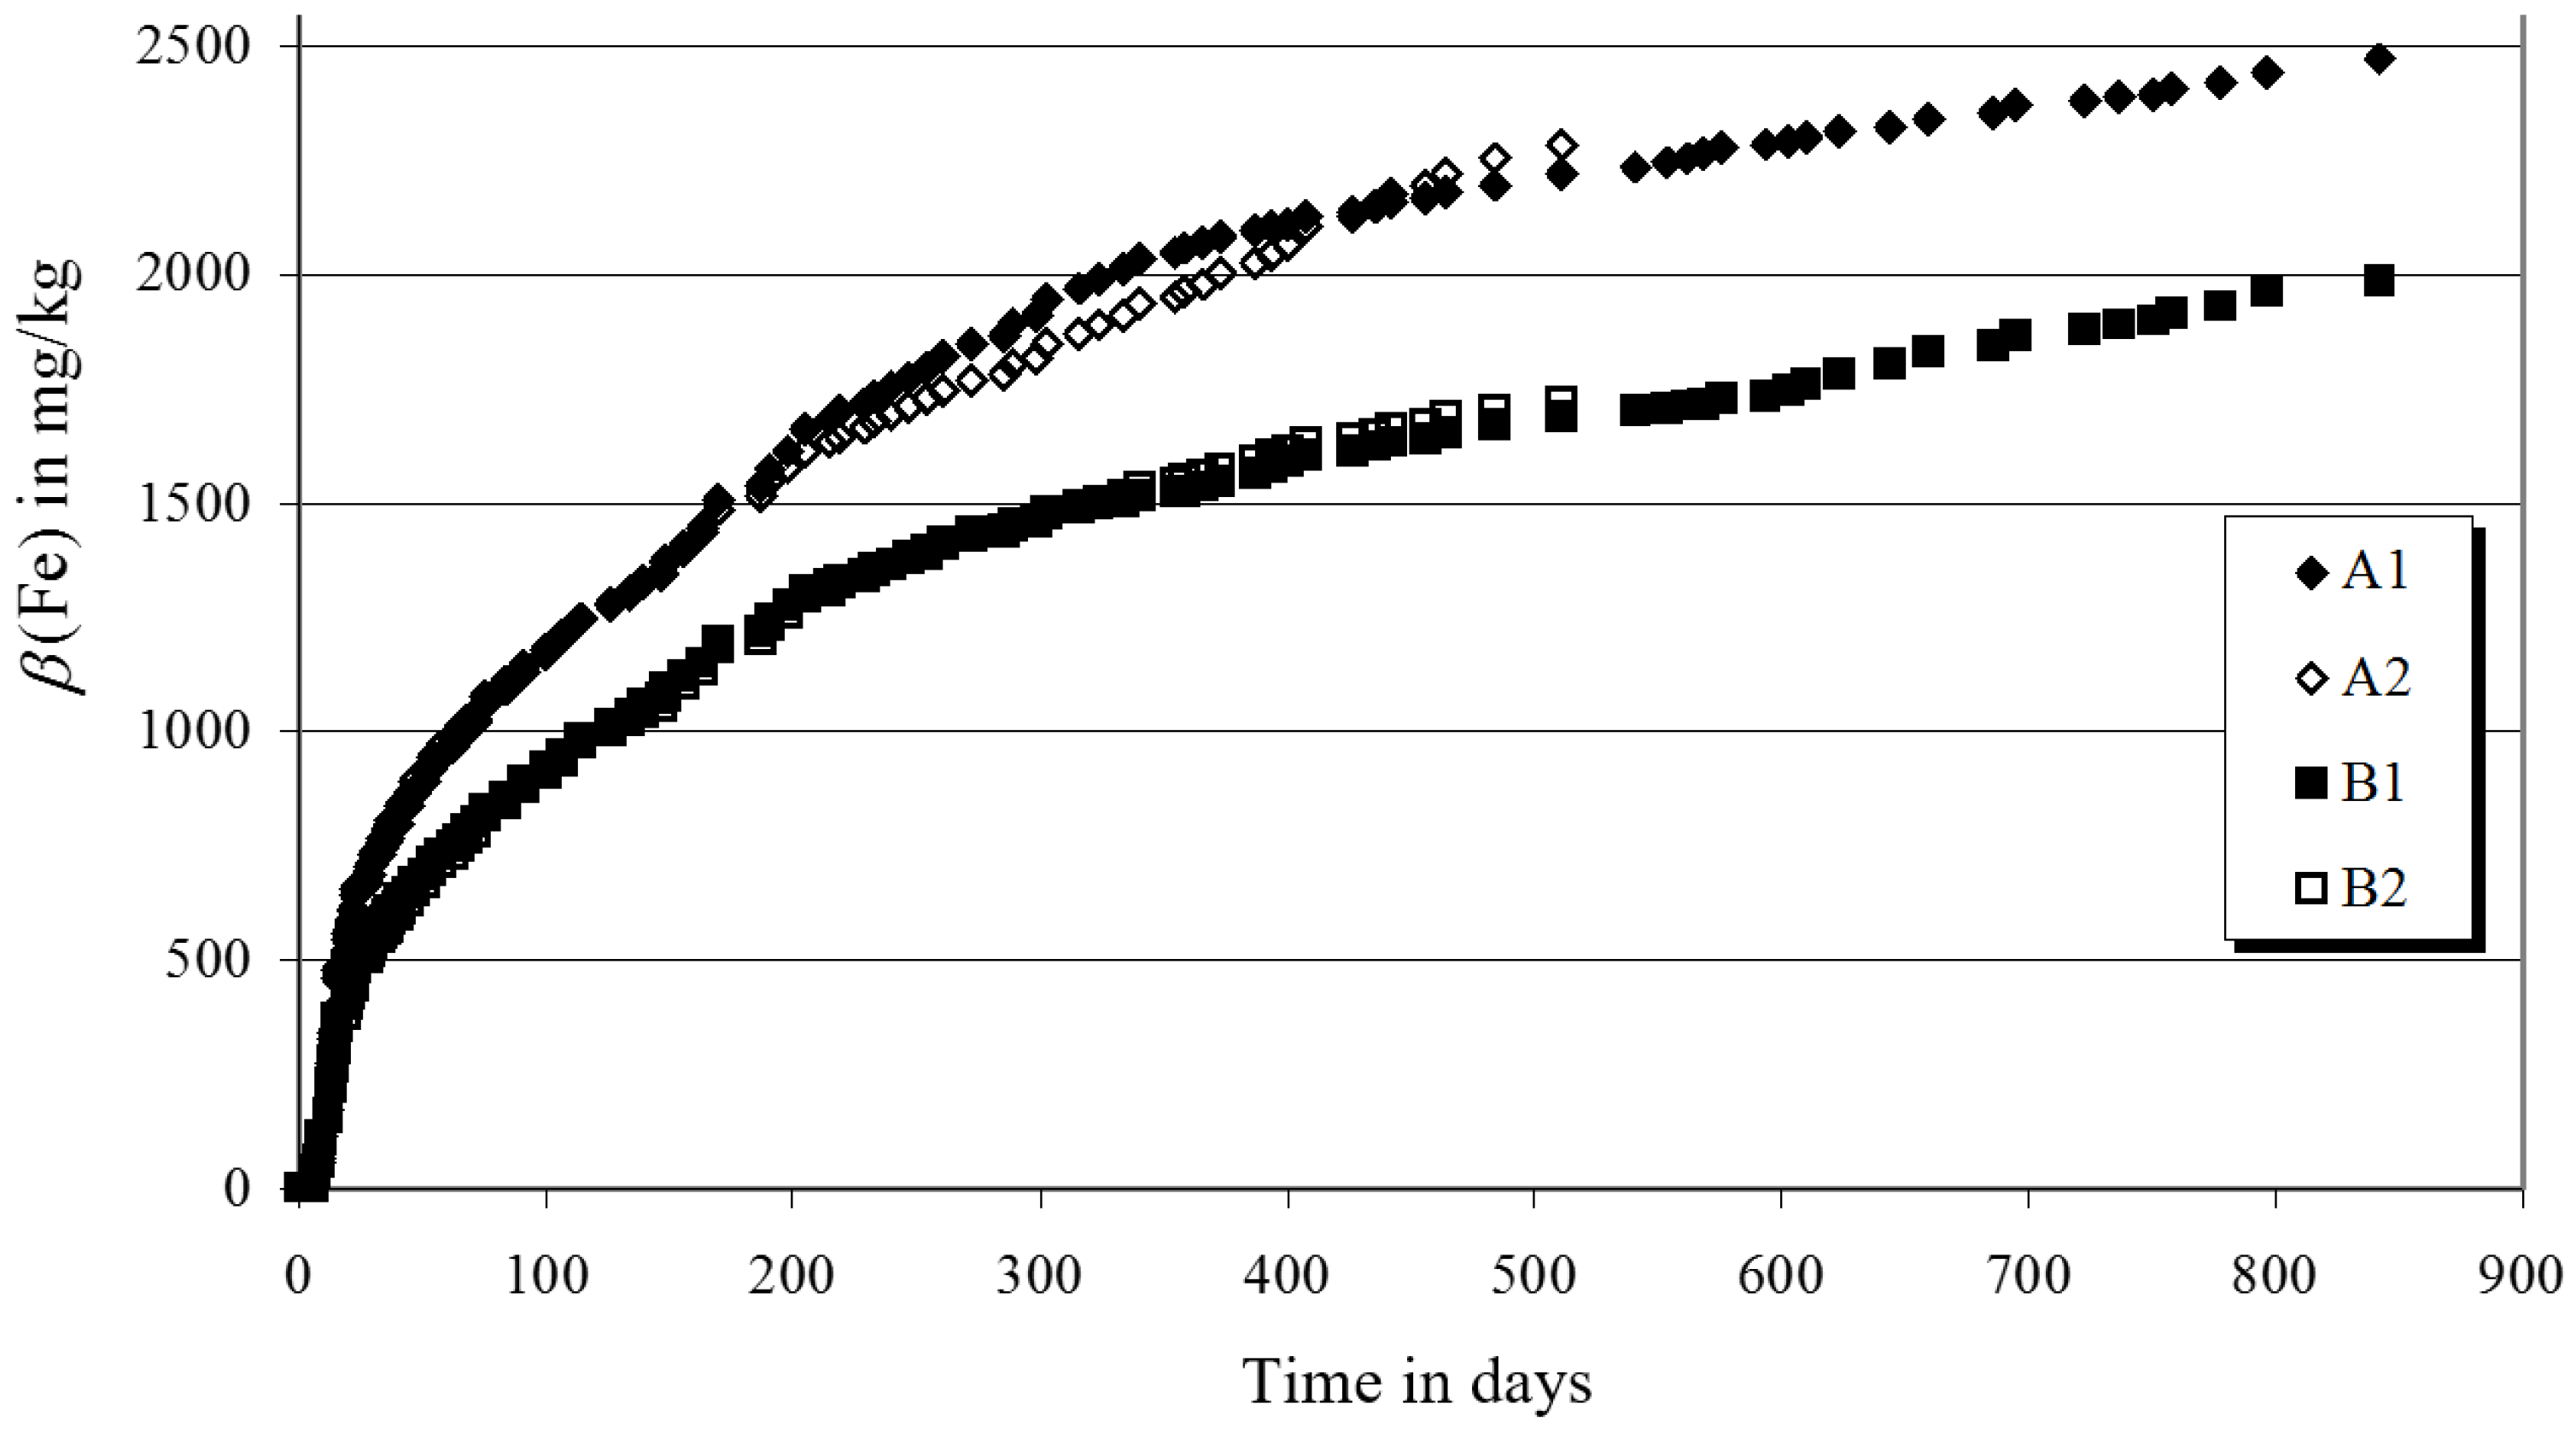
Figure 12.
Approach to determine the aquifer volume from which iron could be released.

Figure 13.
Well placed near the riverbank, pumping more than 50% bank filtrate (bf).

Figure 14.
Well placed too far from riverbank pumping less than 10% bank filtrate (bf).

Table 1.
Hydrochemical parameters of Elbe River water, bank filtrate (BF) near the river at OW I-4/2 and near the pumping well at OW I-6/3, pumped water from Well 22, and landside groundwater at OW I-21/3 at the RBF site in Torgau, Germany (median values for the period 1995-97, n > 36; location of OW see Figure 9).
| Elbe River | Bank filtrate | Well 22 | Landside GW | Change from River to BF | ||
|---|---|---|---|---|---|---|
| Parameter | OW I-4/2 | OW I-6/3 | OW I-21/3 | OW I-6/3 | ||
| pH | 7.5 | 7.0 | 6.9 | 6.6 | 6.1 | - |
| EC in µS/cm | 479 | 475 | 466 | 581 | 761 | - |
| O2 in mg/L | 10 | <0.1 | <0.1 | <0.1 | <0.1 | down >99% |
| DOC in mg/L | 5.5 | 3.2 | 2.8 | 2.2 | 1.6 | down 49% |
| NH4+ in mg/L | 0.4 | 0.02 | 0.06 | 0.16 | 0.02 | down 85% |
| NO3− in mg/L | 22.1 | 16.1 | <1 | 1.6 | <1 | down >95% |
| Fe2+ in mg/L | <0.1 | <0.1 | 0.3 | 14.4 | 14.5 | up >200% |
| Mn in mg/L | 0.11 | 0.14 | 0.08 | 0.63 | 0.59 | down 27% |
| Cl− in mg/L | 26.5 | 27.2 | 27.0 | 33.4 | 42.9 | - |
| SO42- in mg/L | 85 | 91 | 104 | 162 | 257 | up 22% |
| Ca2+ in mg/L | 56.6 | 49.5 | 54.1 | 65.3 | 76.3 | - |
| Mg2+ in mg/L | 11.0 | 10.1 | 10.3 | 11.9 | 15.2 | - |
| Na+ in mg/L | 22.9 | 23.8 | 22.4 | 22.7 | 25.6 | - |
© 2017 by the authors. Licensee MDPI, Basel, Switzerland. This article is an open access article distributed under the terms and conditions of the Creative Commons Attribution (CC BY) license (http://creativecommons.org/licenses/by/4.0/).
Share and Cite
MDPI and ACS Style
Grischek, T.; Paufler, S. Prediction of Iron Release during Riverbank Filtration. Water 2017, 9, 317. https://doi.org/10.3390/w9050317
AMA Style
Grischek T, Paufler S. Prediction of Iron Release during Riverbank Filtration. Water. 2017; 9(5):317. https://doi.org/10.3390/w9050317
Chicago/Turabian StyleGrischek, Thomas, and Sebastian Paufler. 2017. "Prediction of Iron Release during Riverbank Filtration" Water 9, no. 5: 317. https://doi.org/10.3390/w9050317
Note that from the first issue of 2016, this journal uses article numbers instead of page numbers. See further details here.