Article

Variations in Spectral Absorption Properties of Phytoplankton, Non-algal Particles and Chromophoric Dissolved Organic Matter in Lake Qiandaohu

1
Ocean College, Zhejiang University, Hangzhou 310028, China
2
State Key Laboratory of Satellite Ocean Environment Dynamics, Second Institute of Oceanography, State Oceanic Administration, Hangzhou 310012, China
3
Hangzhou Institute of Environmental Science, Hangzhou 310014, China
4
Shanghai Institute of Technical Physics of the Chinese Academy of Sciences, Shanghai 200083, China
*
Author to whom correspondence should be addressed.
Water 2017, 9(5), 352; https://doi.org/10.3390/w9050352
Submission received: 14 March 2017 / Revised: 5 May 2017 / Accepted: 12 May 2017 / Published: 18 May 2017
(This article belongs to the Special Issue Water Quality Monitoring and Modeling in Lakes)

Abstract

:
Light absorption by phytoplankton, non-algal particles (NAP) and chromophoric dissolved organic matter (CDOM) was investigated at 90 sites of a clear, deep artificial lake (Lake Qiandaohu) to study natural variability of absorption coefficients. Our study shows that CDOM absorption is a major contributor to the total absorption signal in Lake Qiandaohu during all seasons, except autumn when it has an equivalent contribution as total particle absorption. The exponential slope of CDOM absorption varies within a narrow range around a mean value of 0.0164 nm−1 ( s d = 0.00176 nm−1). Our study finds some evidence for thIS autochthonous production of CDOM in winter and spring. Absorption by phytoplankton, and therefore its contribution to total absorption, is generally greatest in spring, suggesting that phytoplankton growth in Lake Qiandaohu occurs predominantly in the spring. Phytoplankton absorption in freshwater lakes generally has a direct relationship with chlorophyll-a concentration, similar to the one established for open ocean waters. The NAP absorption, whose relative contribution to total absorption is highest in summer, has a spectral shape that can be well fitted by an exponential function with an average slope of 0.0065 nm−1 ( s d = 0.00076 nm−1). There is significant spatial variability present in the summer of Lake Qiandaohu, especially in the northwestern and southwestern extremes where the optical properties of the water column are strongly affected by the presence of allochthonous matter. Variations in the properties of the particle absorption spectra with depths provides evidence that the water column was vertically inhomogeneous and can be monitored with an optical measurement program. Moreover, the optical inhomogeneity in winter is less obvious. Our study will support the parameterization of the Bio-optical model for Lake Qiandaohu from in situ or remotely sensing aquatic color signals.

1. Introduction

It is known that light absorption in a natural water body is influenced by the inherent optical properties (IOPs) of optically active constituents (OACs) residing in the water. There are three types of OACs: phytoplankton, non-algal particles (NAP) and chromophoric dissolved matter (CDOM). The IOPs of the specific OACs present play a vital role in determining underwater light distribution, photosynthetic process and remote sensing reflectance [1]. For example, the spectral absorption properties of the three OAC types and the specific light absorption by phytoplankton have been well documented in the literature, which illustrates that the dynamics controlling the distribution of OACs are important for determining the light attenuation and primary production in open oceans and productive inland waters [2,3,4,5,6,7,8].
Initially, several studies concentrated on the variability of the absorption coefficient in open oceanic waters (so-called Case-I waters) [9,10,11]. The total absorption coefficient [ a t ( λ ) ] is the sum of the absorption coefficients of pure water [ a w ( λ ) ], phytoplankton [ a p h ( λ ) ], NAP [ a N A P ( λ ) ], and CDOM [ a C D O M ( λ ) ]:
a t ( λ ) = a w ( λ ) + a N A P ( λ ) + a p h ( λ ) + a C D O M ( λ )
where a w ( λ ) is rather constant. Previous research has shown that all components, except a w ( λ ) , in Equation (1) are often assumed to co-vary with chlorophyll-a (Chl-a) concentration in oceanic waters [12,13,14]. Further, phytoplankton absorption is the main contributor to particle absorption in oceanic waters [15,16]. The results of Bricaud et al. (1981) [17] indicated that the spectrum of a C D O M ( λ ) typically follows an exponential function.
Many studies about global oceanic primary production have shown that understanding the role of oceanic OACs become an important element that could not be neglected for addressing problems in biological oceanography [18,19,20,21,22,23,24,25]. For example, the optical properties of OACs (involving absorption coefficient, scattering coefficient, backward scattering coefficient, attenuation coefficient for downward irradiance ( K d ), etc.) are vital parameters in bio-optical algorithms used remote sensing techniques for water quality monitoring. Morel (1988) [26], using a substantial number of data sampled from different oceanic regions, reported that K d had a direct relationship with Chl-a concentration. Specifically, with the development of ocean color remote sensing in the 1980s and 1990s, IOPs were needed to build empirical or bio-optical algorithms for quantifying the concentrations of OACs. Unraveling the details of the processes that change the optical properties of OACs and quantifying the variability in IOPs should improve the accuracy of the retrieval of individual parameters using remote sensing techniques. There are two approaches to obtain the IOPs of a water body from aquatic remote sensing. First, IOPs can be either measured in situ using instruments such as the Wetlabs AC-S, or they can be measured in controlled laboratory experiments using UV-spectrometer and quantitative filter technique (QFT) [27]. Second, they can be parameterized using bio-optical modeling from in situ measurements of apparent optical properties (AOPs). Bricaud et al. (1995, 1998) [28,29] presented derived parameterizations of a p h ( λ ) as a function of Chl-a concentration. Cleveland (1995) [30] proposed a parametric relation between a p h ( λ ) , a N A P ( λ ) and Chl-a concentration. Parameterization of total absorption ( a t ( λ ) ) has been used to build reflectance models and to use in the development of ocean color algorithms [31,32,33].
In recent years, increasing attention has been placed on inland and coastal waters (so-called Case-II waters). IOPs in Case-II waters are more complex than in oceanic waters due to the larger input of allochthonous sources of OACs. These can be introduced from numerous sources, such as riverine input of CDOM, particle resuspension due to turbulent mixing in shallow waters or the increased input of additional sources from human activities. Precisely because of these differences between oceanic waters and inland waters, either CDOM or NAP absorption may dominate the total absorption. However, in some cases, phytoplankton absorption may still dominate the optical characteristics of coastal and inland waters, especially in algal growing season [16,34,35]. Whether the components in Equation (1) co-vary, following the robust relationship established for Case-I waters, or are decoupled in Case-II waters remains uncertain. Stramski et al. (2004), Bowers et al. (2006), and Astoreca et al. (2012) [36,37,38] provided valuable evidence on the optical properties of suspended minerals, and pointed out that their optical properties are determined by both particle size and composition. Recently, CDOM absorption properties have been documented frequently, regarding to the biogeochemical processes acting to transform them, and their resulting variability [39,40,41].
Although there has been considerable research in the bio-optical properties of oceanic waters, there are several unresolved issues: (1) there is very little information on the seasonal variations of optical properties in artificial lakes; (2) there is uncertainty in whether a p h ( λ ) in a deep artificial lake has a relationship with Chl-a concentration similar to that observed in Case-I and shallow inland waters; and (3) there is a need for a better understanding of how both natural factors and human activity affect the optical properties of an artificial lake. The first objective of the present study is to illustrate the absorption properties of different components in Lake Qiandaohu compared to those in oceanic and shallow inland waters. The second objective is to characterize seasonal and spatial variability of the spectral absorption properties and the factors driving that variability. Our study also makes a further contribution to bio-optics and the use of remote sensing for the water quality assessment of Lake Qiandaohu.

2. Materials and Methods

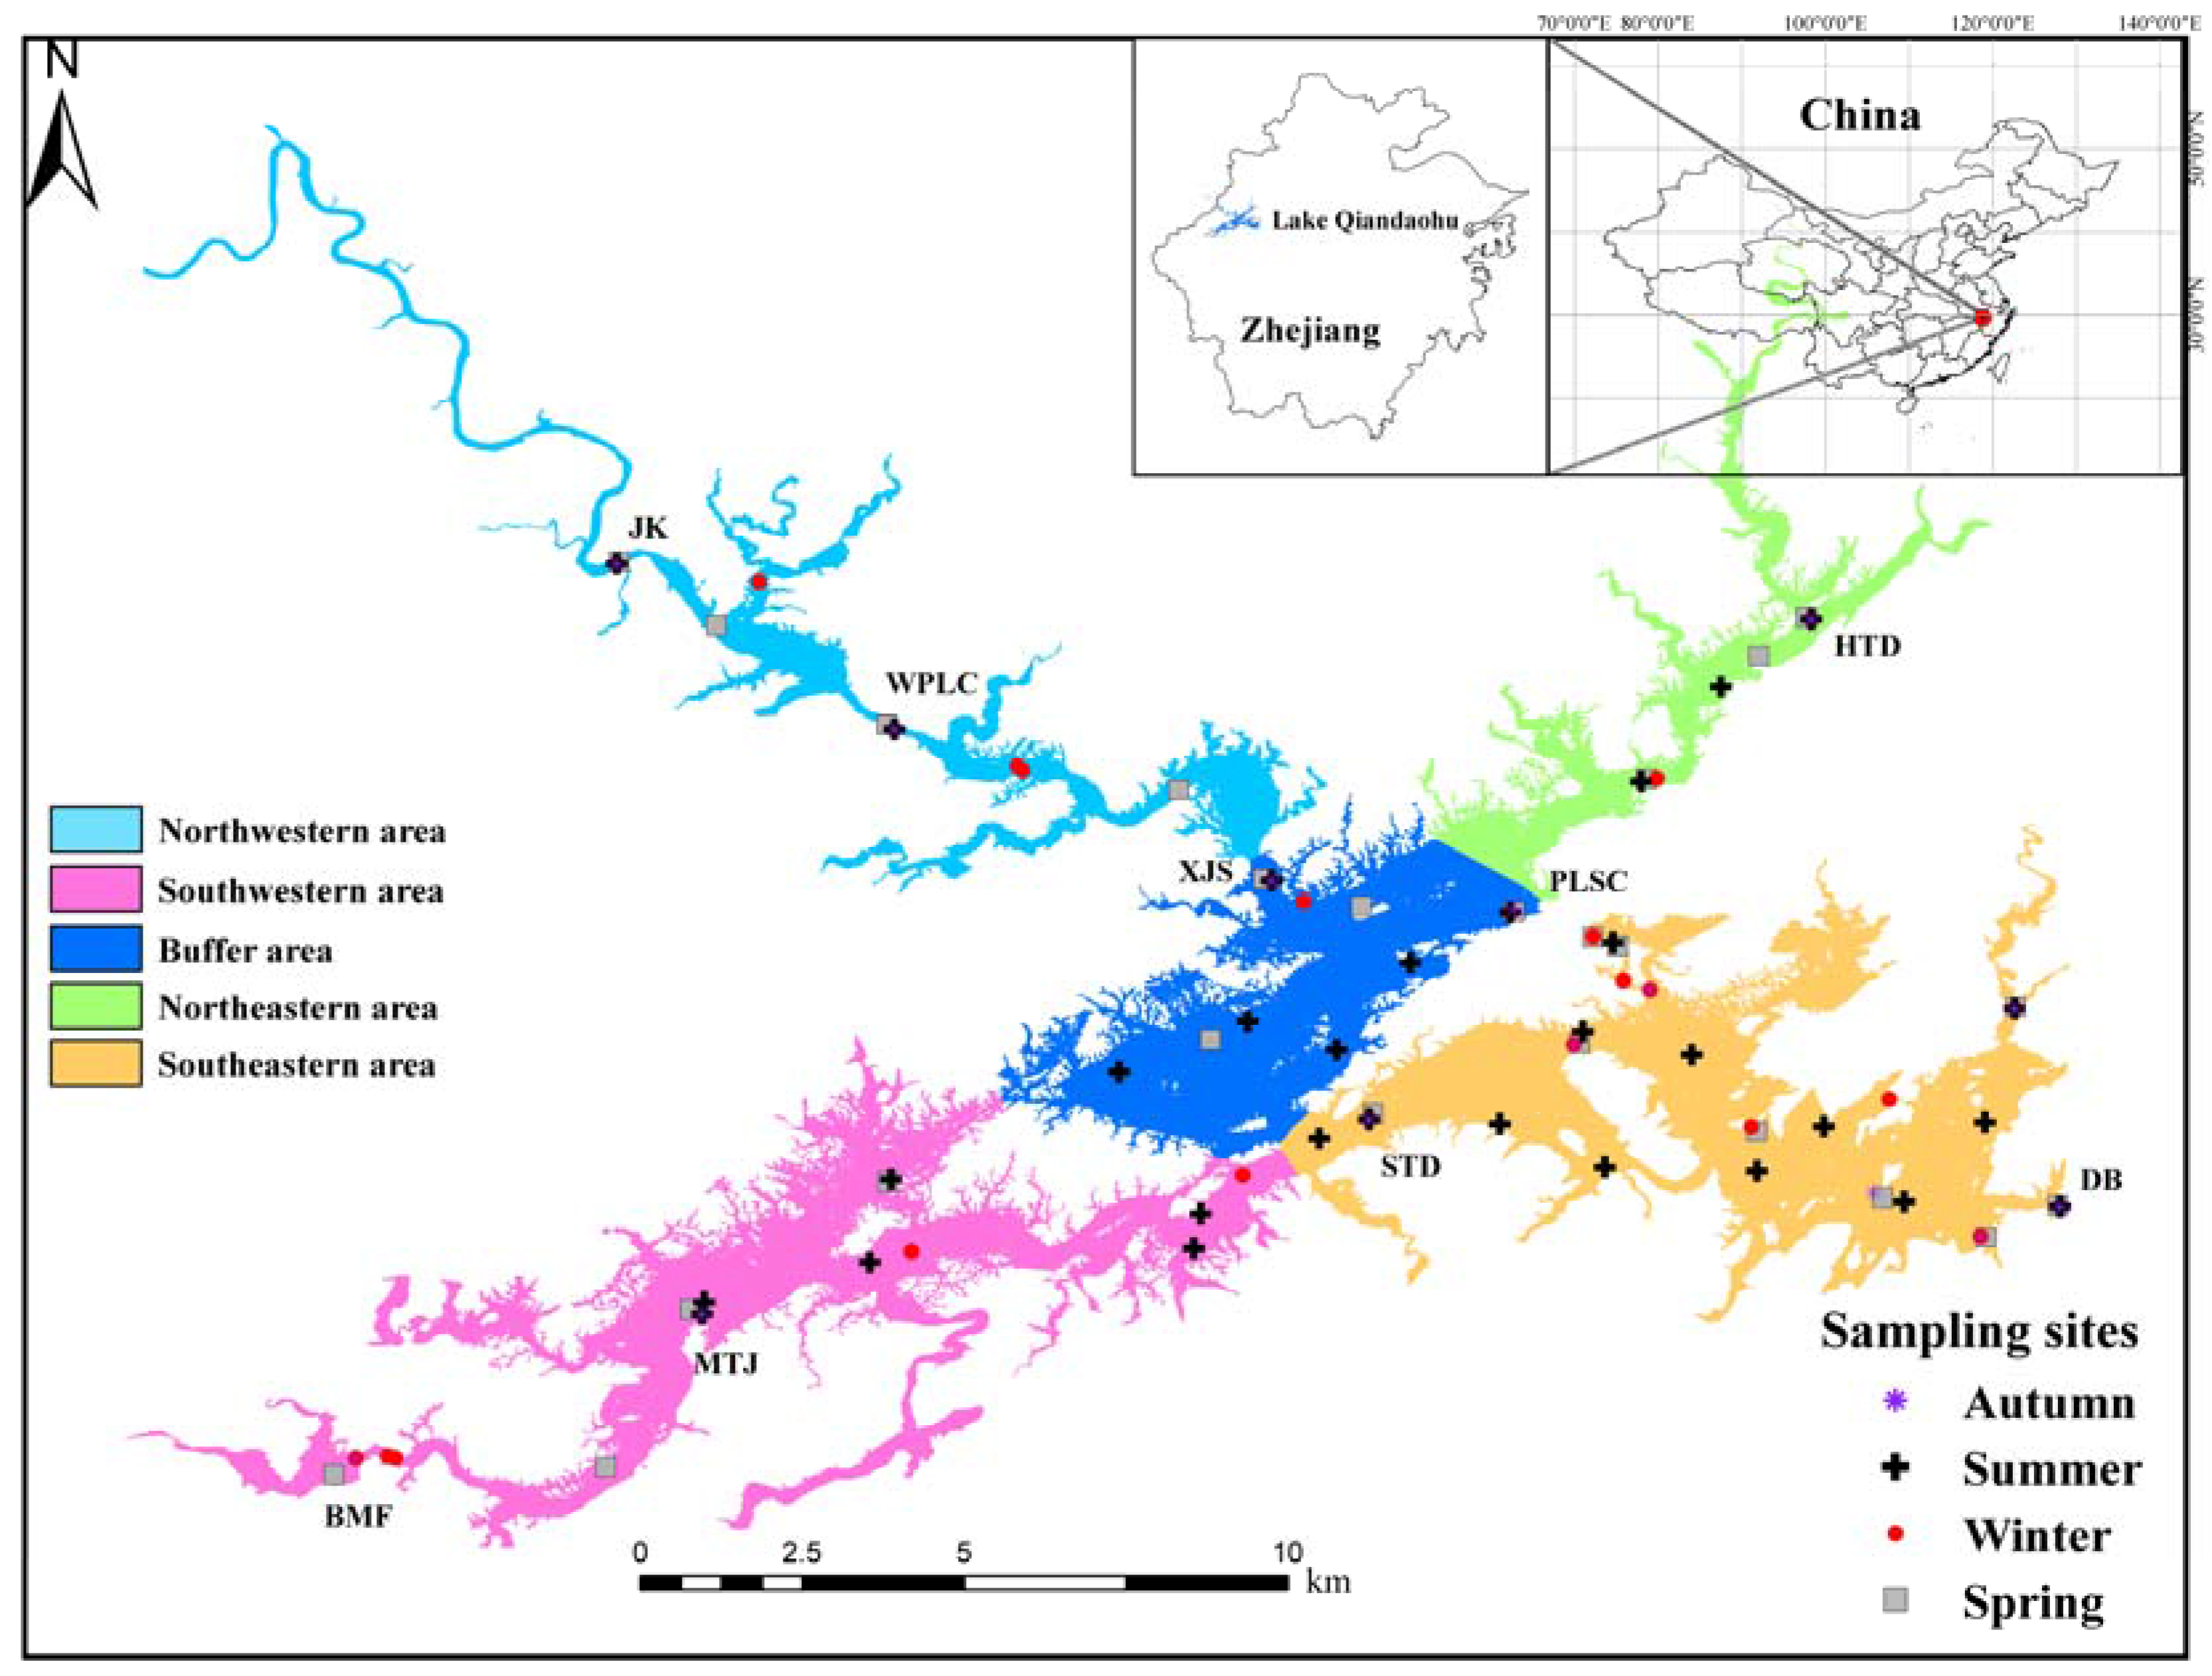
2.1. Study Sites and Sampling

Lake Qiandaohu (meaning Thousand Island Lake in Chinese), part of Xin’an Jiang Reservoir, is a freshwater lake in China, and a famous tourist attraction for its clear water surrounding numerous islands. It is located between 118°34′–119°15′ E and 29°22′–29°50′ N, in Zhejiang Province (Figure 1) and has a water surface area of 578 km2 and a mean depth of 37 m. The reservoir was constructed in 1959, and has served a variety of purposes, including power generation, flood control, tourism, drinking water supply, industrial usage, and irrigation [42]. The watershed of Lake Qiandaohu serves as a buffer between the Xin’an and Qiantang Rivers. Therefore, it is of great significance in maintaining the ecological environmental health and water services in the Qiantang River Basin.
To interpret the spatial variability of optical properties and determine the impacts from the external environment on different regions, Lake Qiandaohu (Figure 1) is divided into five different regions according to its hydrological structure and spatial shape. The northwestern area of Lake Qiandaohu is the upstream arm of the lake and includes the primary surface runoff inlet accounting for approximate 65% of total water input to the lake. As a result, soil erosion and human activity have a great influence on this area. The southwestern area includes the secondary runoff inlet, accounting for about 25% of total water input. The buffer area, located in the center of the lake, connects the two surface runoff areas to the other arms of the lake. The southeastern area serves as both a holding area and the only outlet from Lake Qiandaohu.
Sampling was conducted in Lake Qiandaohu during four field campaigns, summer (August 2015), autumn (November 2015), winter (January 2016), and spring (March 2016), as part of the High Resolution Earth Observation System of National Science and Technology Major Projects. During each campaign, optical measurements were made, and water samples were taken from the surface and different depths at a total of 90 sites in different parts of the lake (Figure 1). The number of sites sampled in spring, summer, autumn, and winter were 29, 25, 14 and 22, respectively. Among the 90 sampling sites, nine were fixed sites (marked with site name in Figure 1) that were sampled every season. Among all the sampling sites, JK, XJS, and DB were sampled at multiple depths, as shown in Table 1. Water samples obtained at each station were immediately filtered, and stored in darkness, for determining particle, CDOM spectral absorption and Chl-a concentration.

2.2. Laboratory Measurements

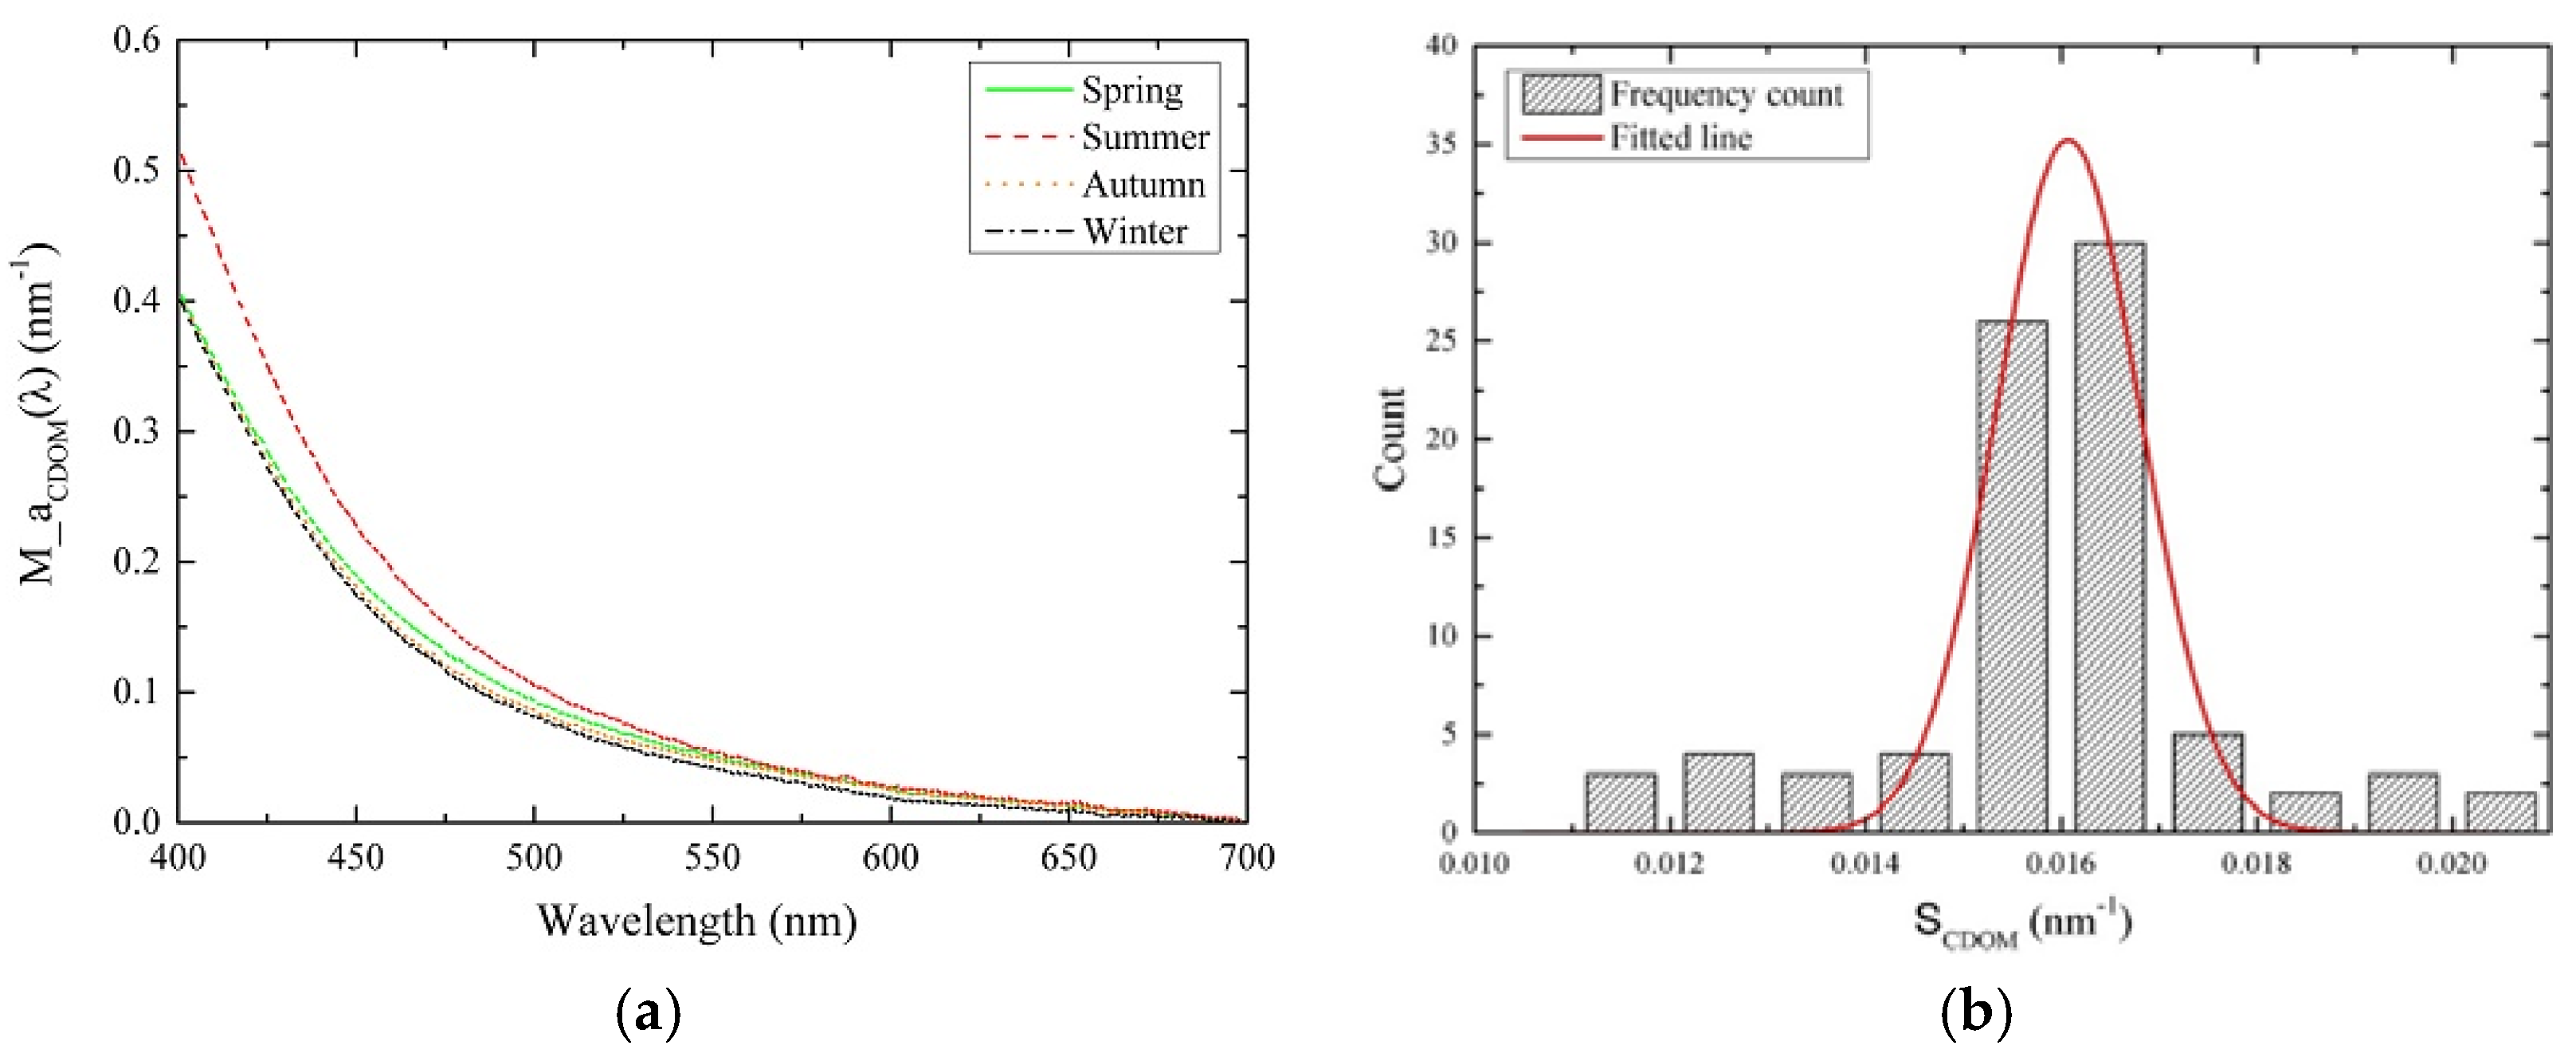
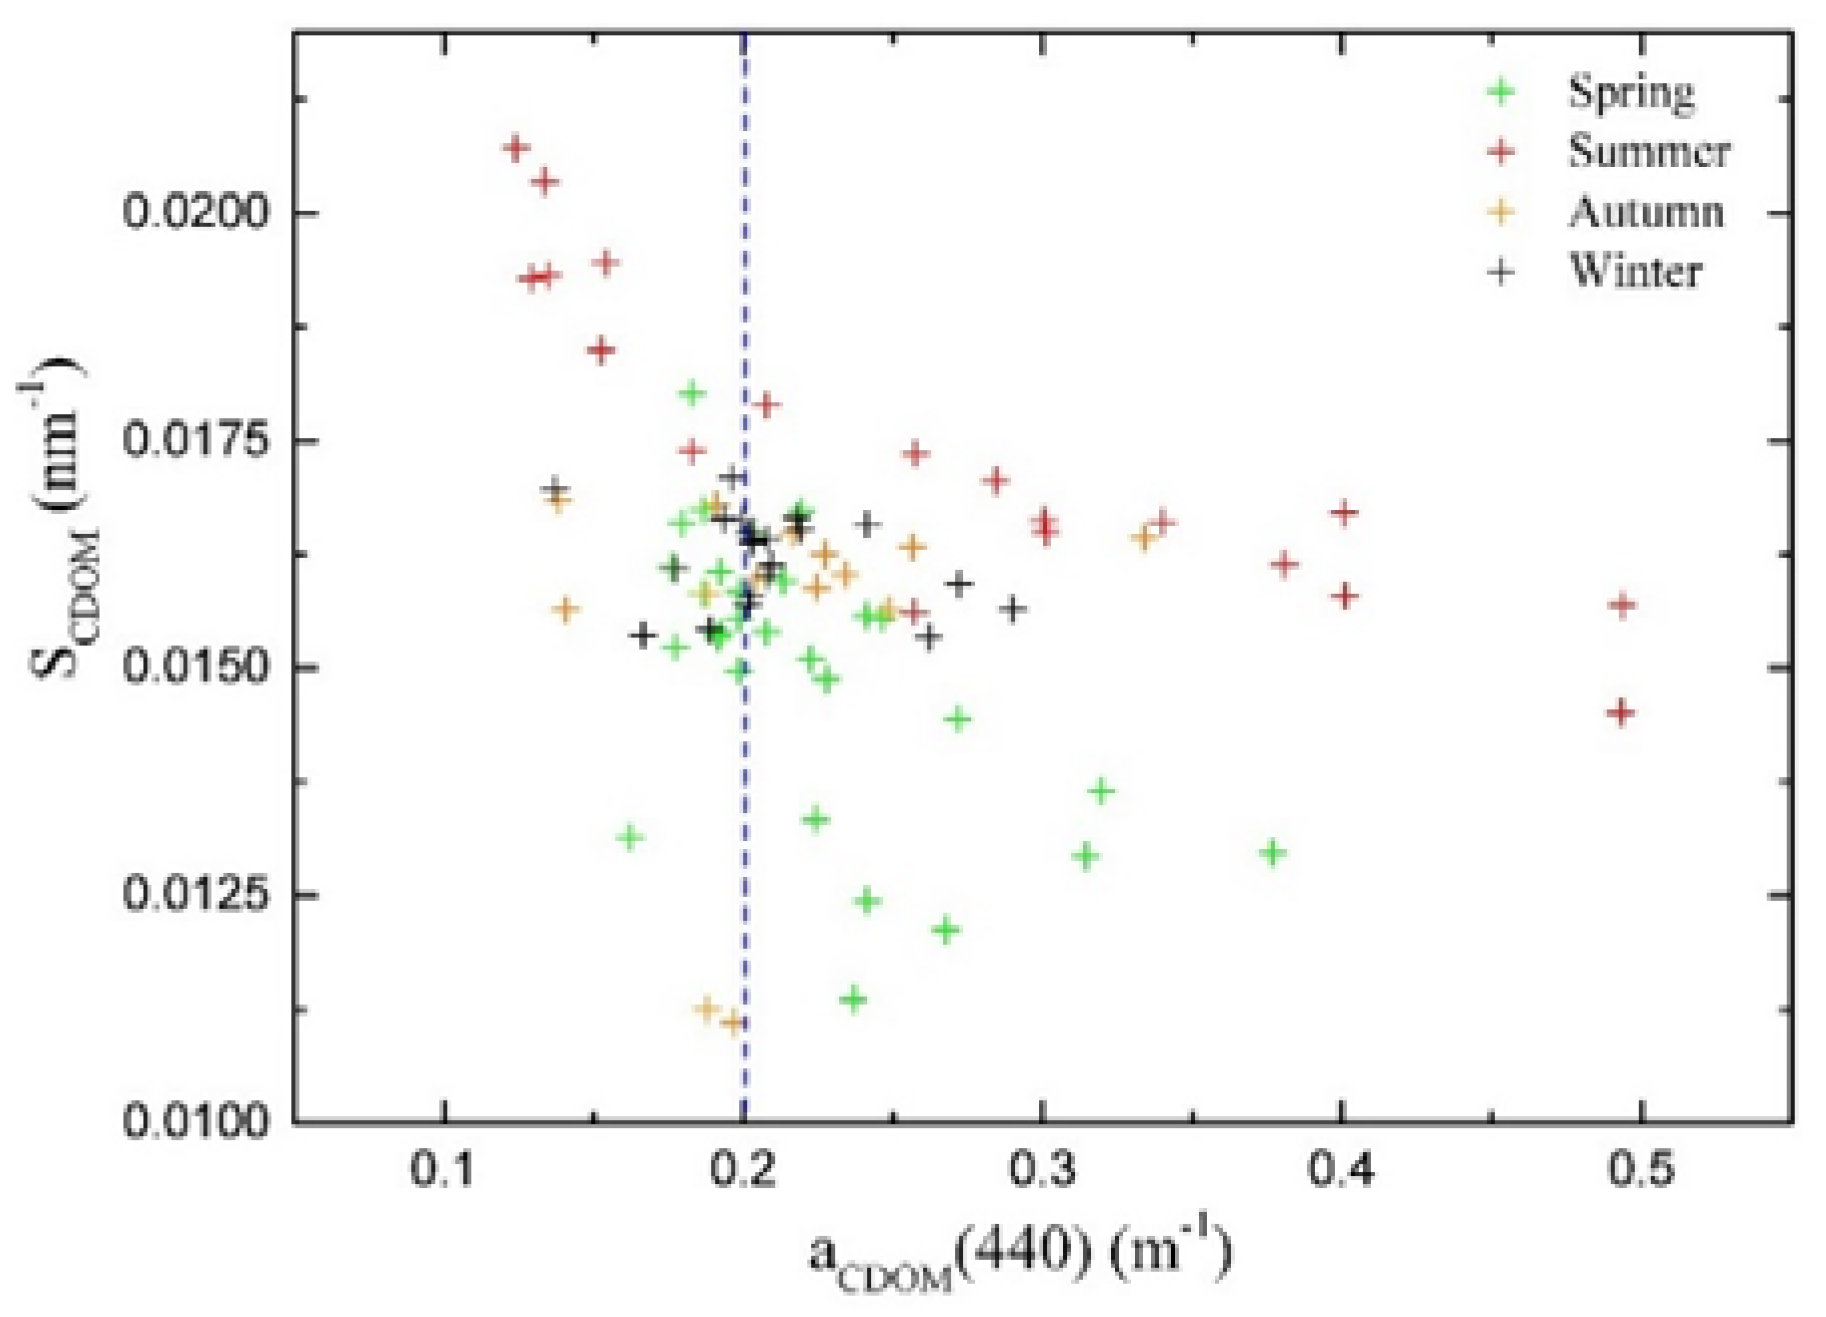
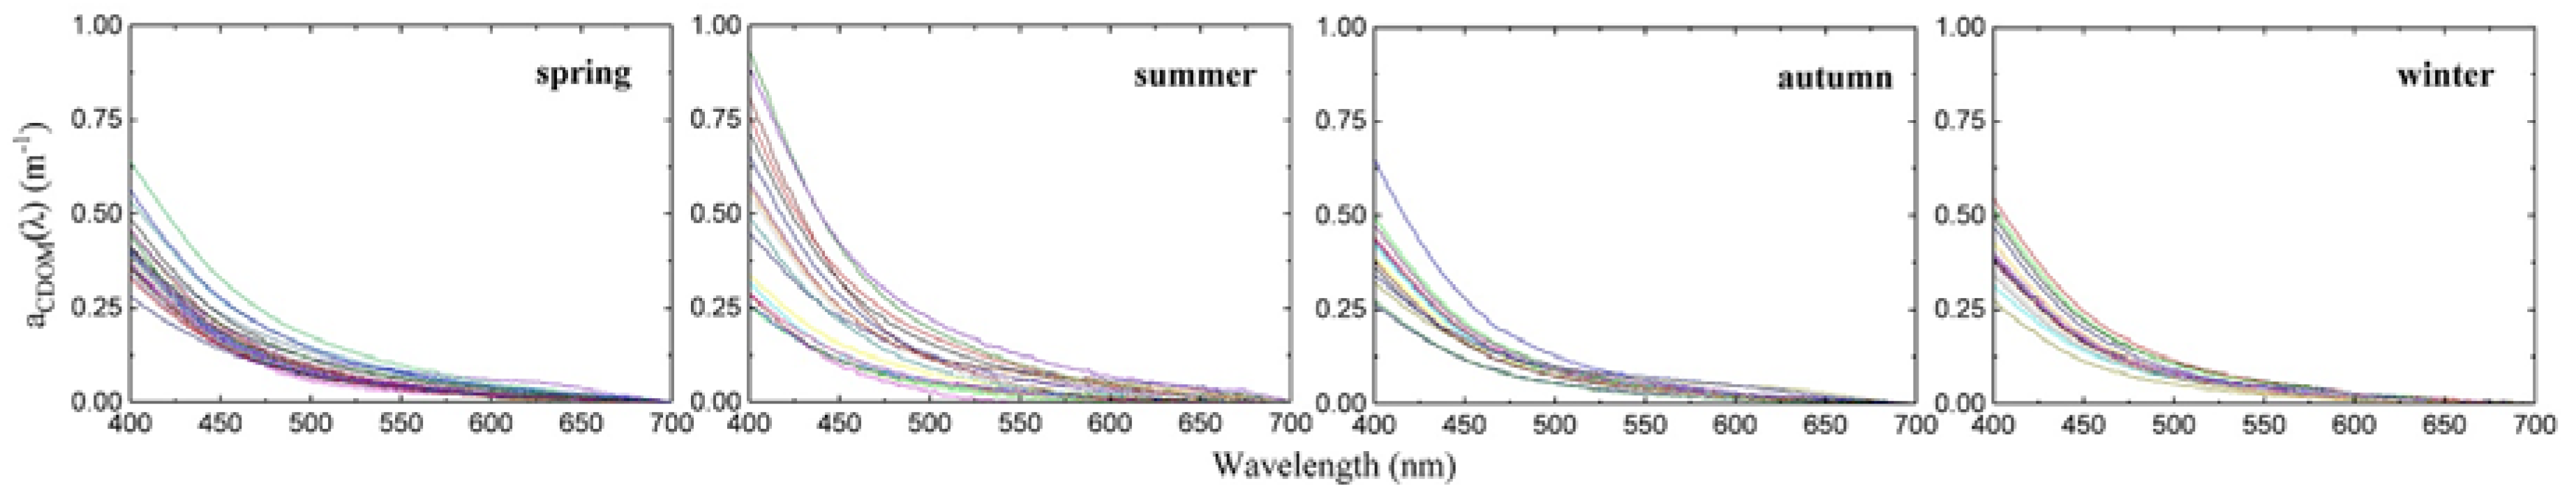
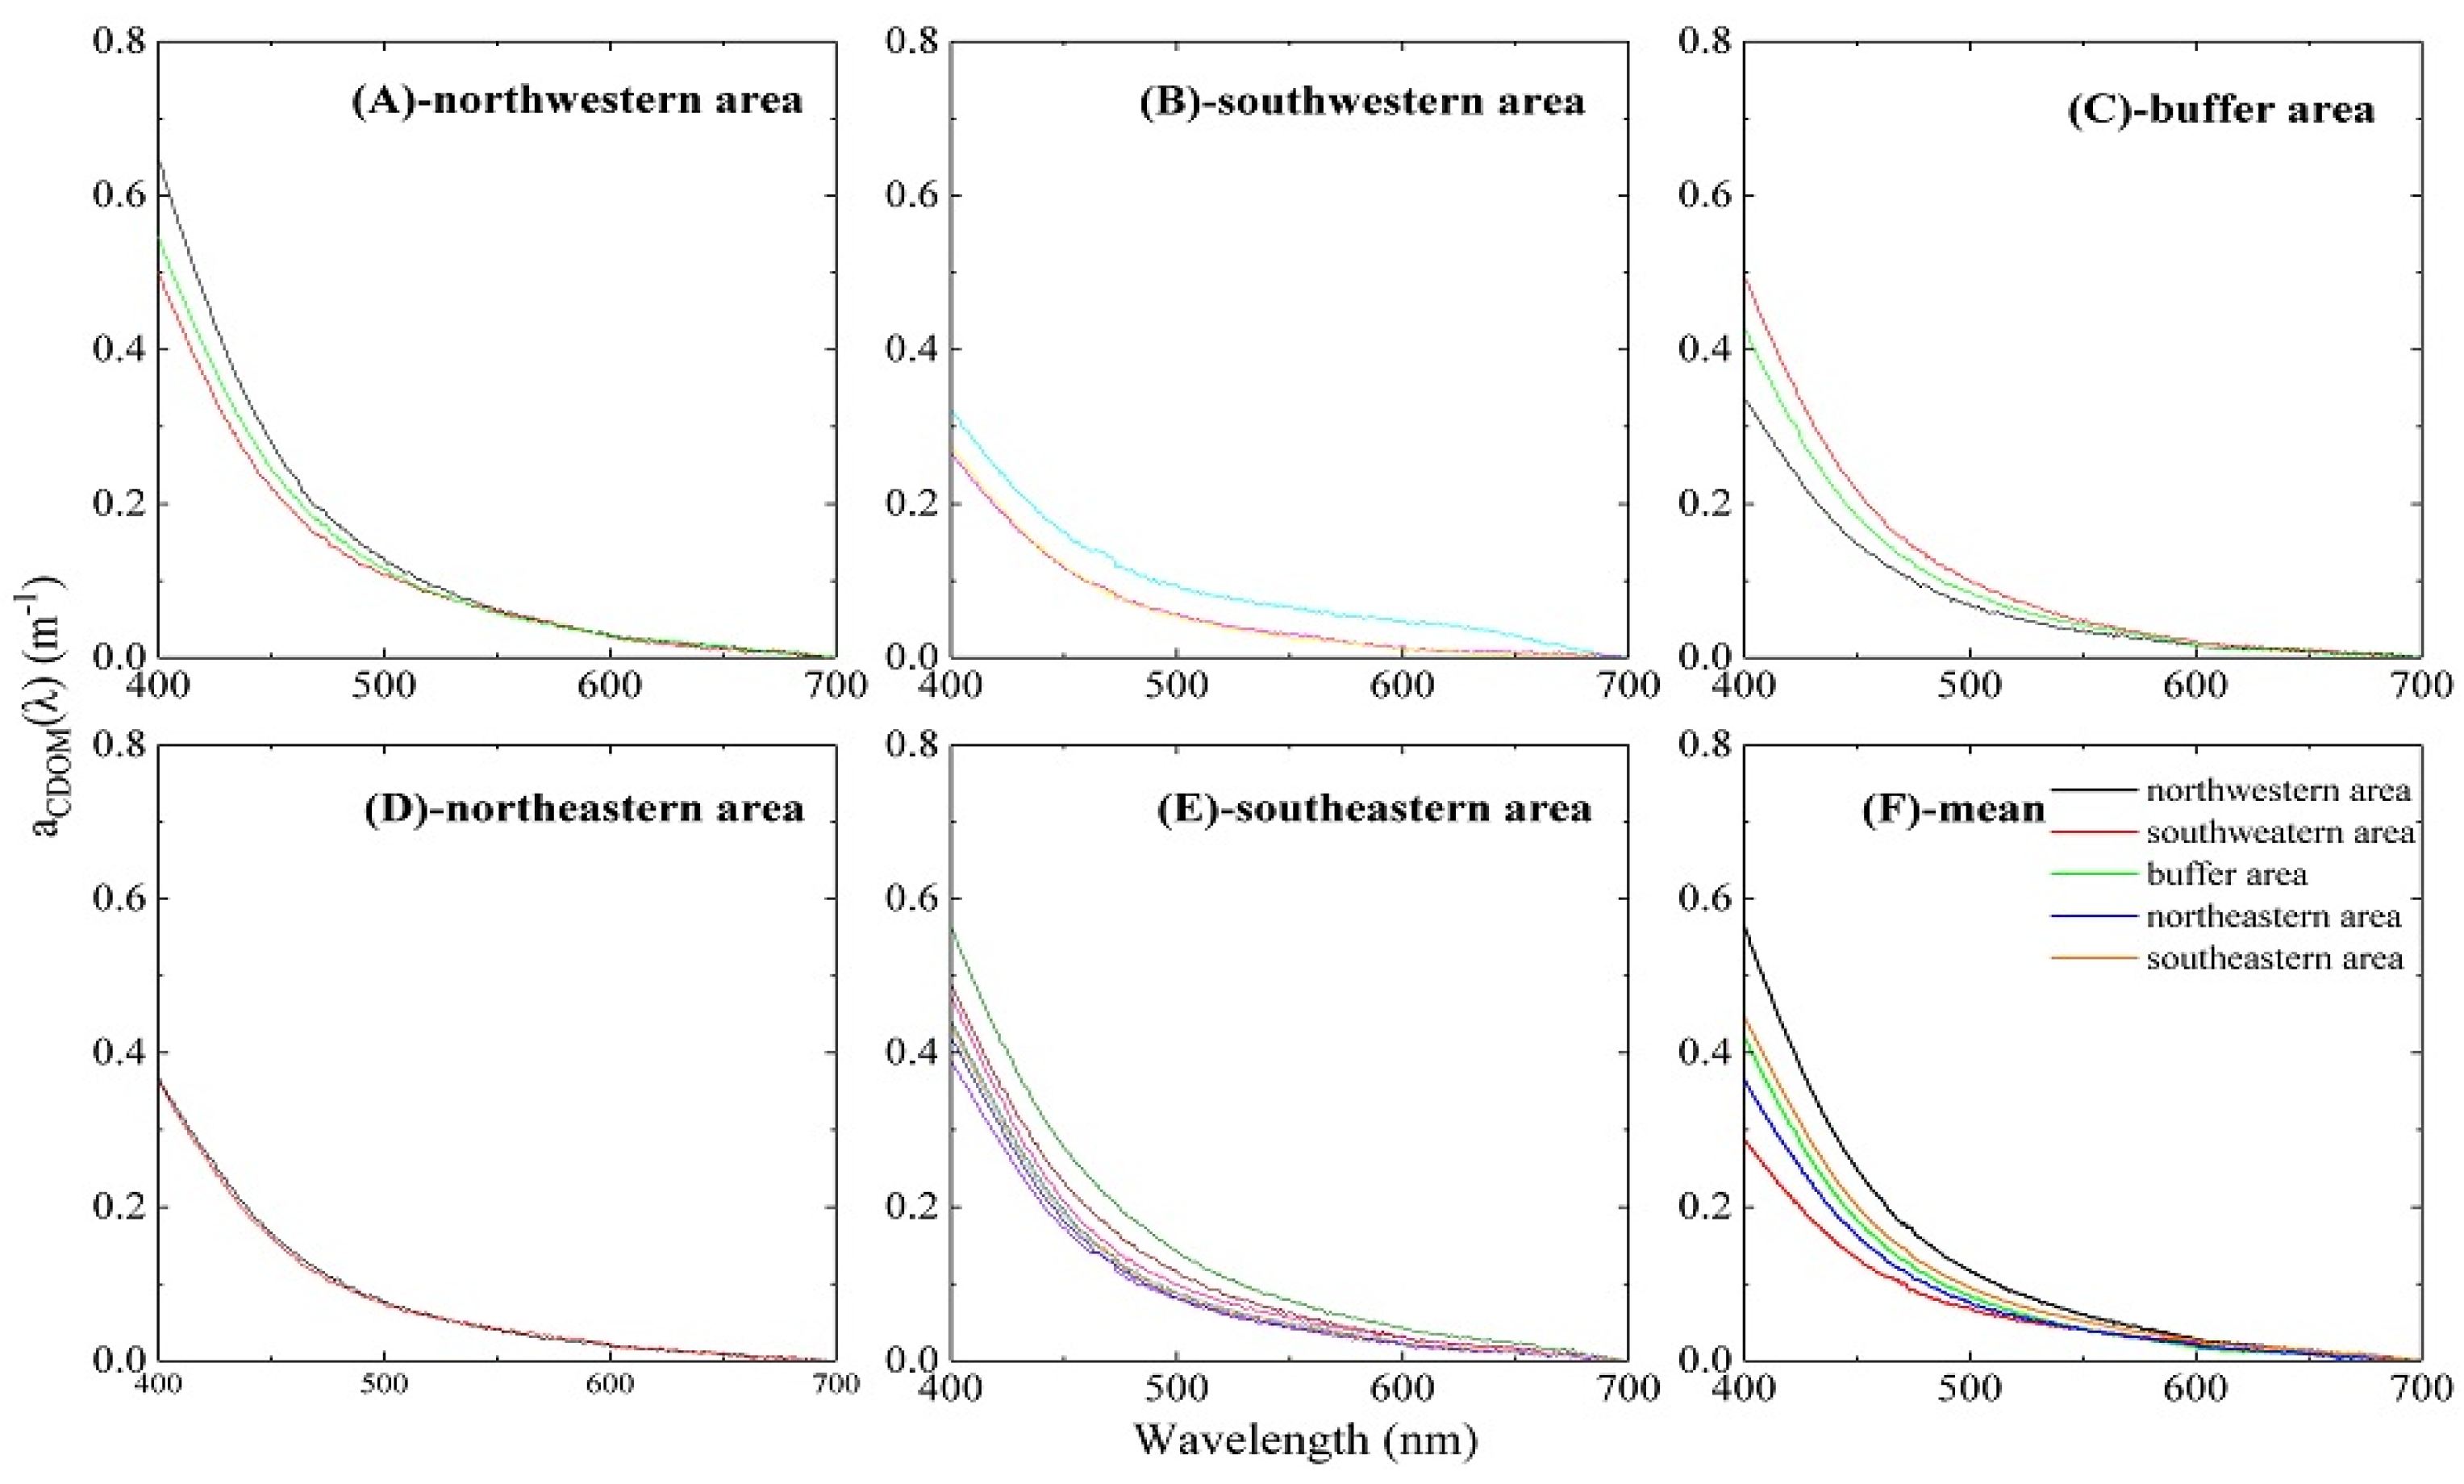
2.2.1. CDOM Absorption

Water samples for CDOM were first filtered through 47-mm diameter Whatman glass-fiber GF/F filters with pore size of 0.70-µm, and then re-filtered through 47-mm diameter Millipore polycarbonate filters with a pore size of 0.22-µm. It is worth noting that CDOM samples were refrigerated immediately after filtration and stored for no more than one week before processing to avoid degradation. The optical density of the sample ( O D s ( λ ) ) were measured over 250–860 nm at 1-nm increment using a Perkin Elmer (PE) lambda-35 spectrophotometer and a 10-cm quartz cuvette. Milli-Q water served as blanks. Blanks and samples were equilibrated to room temperature and the spectrophotometer was stabilized for >45 min prior to measurements. Some samples were divided into two parallel samples to estimate measurement error. The spectral absorption coefficient, a C D O M ( λ ) was calculated from the measured optical density of the sample by:
a C D O M ( λ ) = 2.303 l [ ( O D s ( λ ) O D n u l l ]
where l is the cuvette path length (10 cm), 2.303 is the convention factor between log10 based OD and natural log based coefficients, and O D n u l l is the optical density at the wavelength where absorption by CDOM can be assumed to be zero. In our study, wavelength of 700 nm was taken according to [43].
Bricaud (1981) [17] reported that absorption coefficient of CDOM from 400 to 750 nm can be fitted to an exponential model as follows:
a C D O M ( λ ) = a C D O M ( λ 0 ) e ( S C D O M ( λ λ 0 ) )
where λ 0 is the specific reference wavelength, and S C D O M represents an average slope of CDOM absorption spectra. In our study, the absorption coefficient at 440 nm is used as reference.

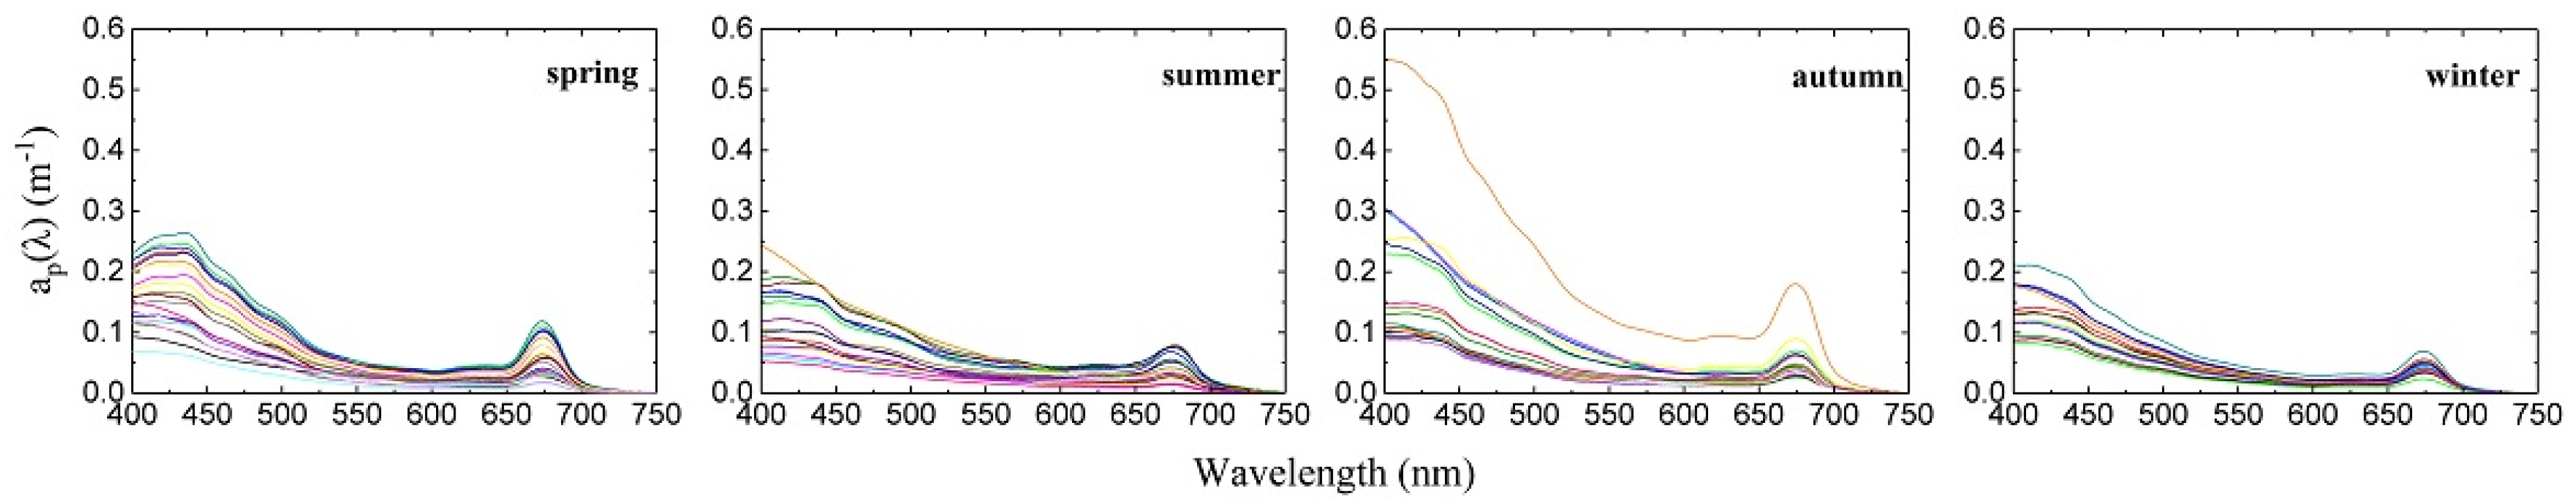
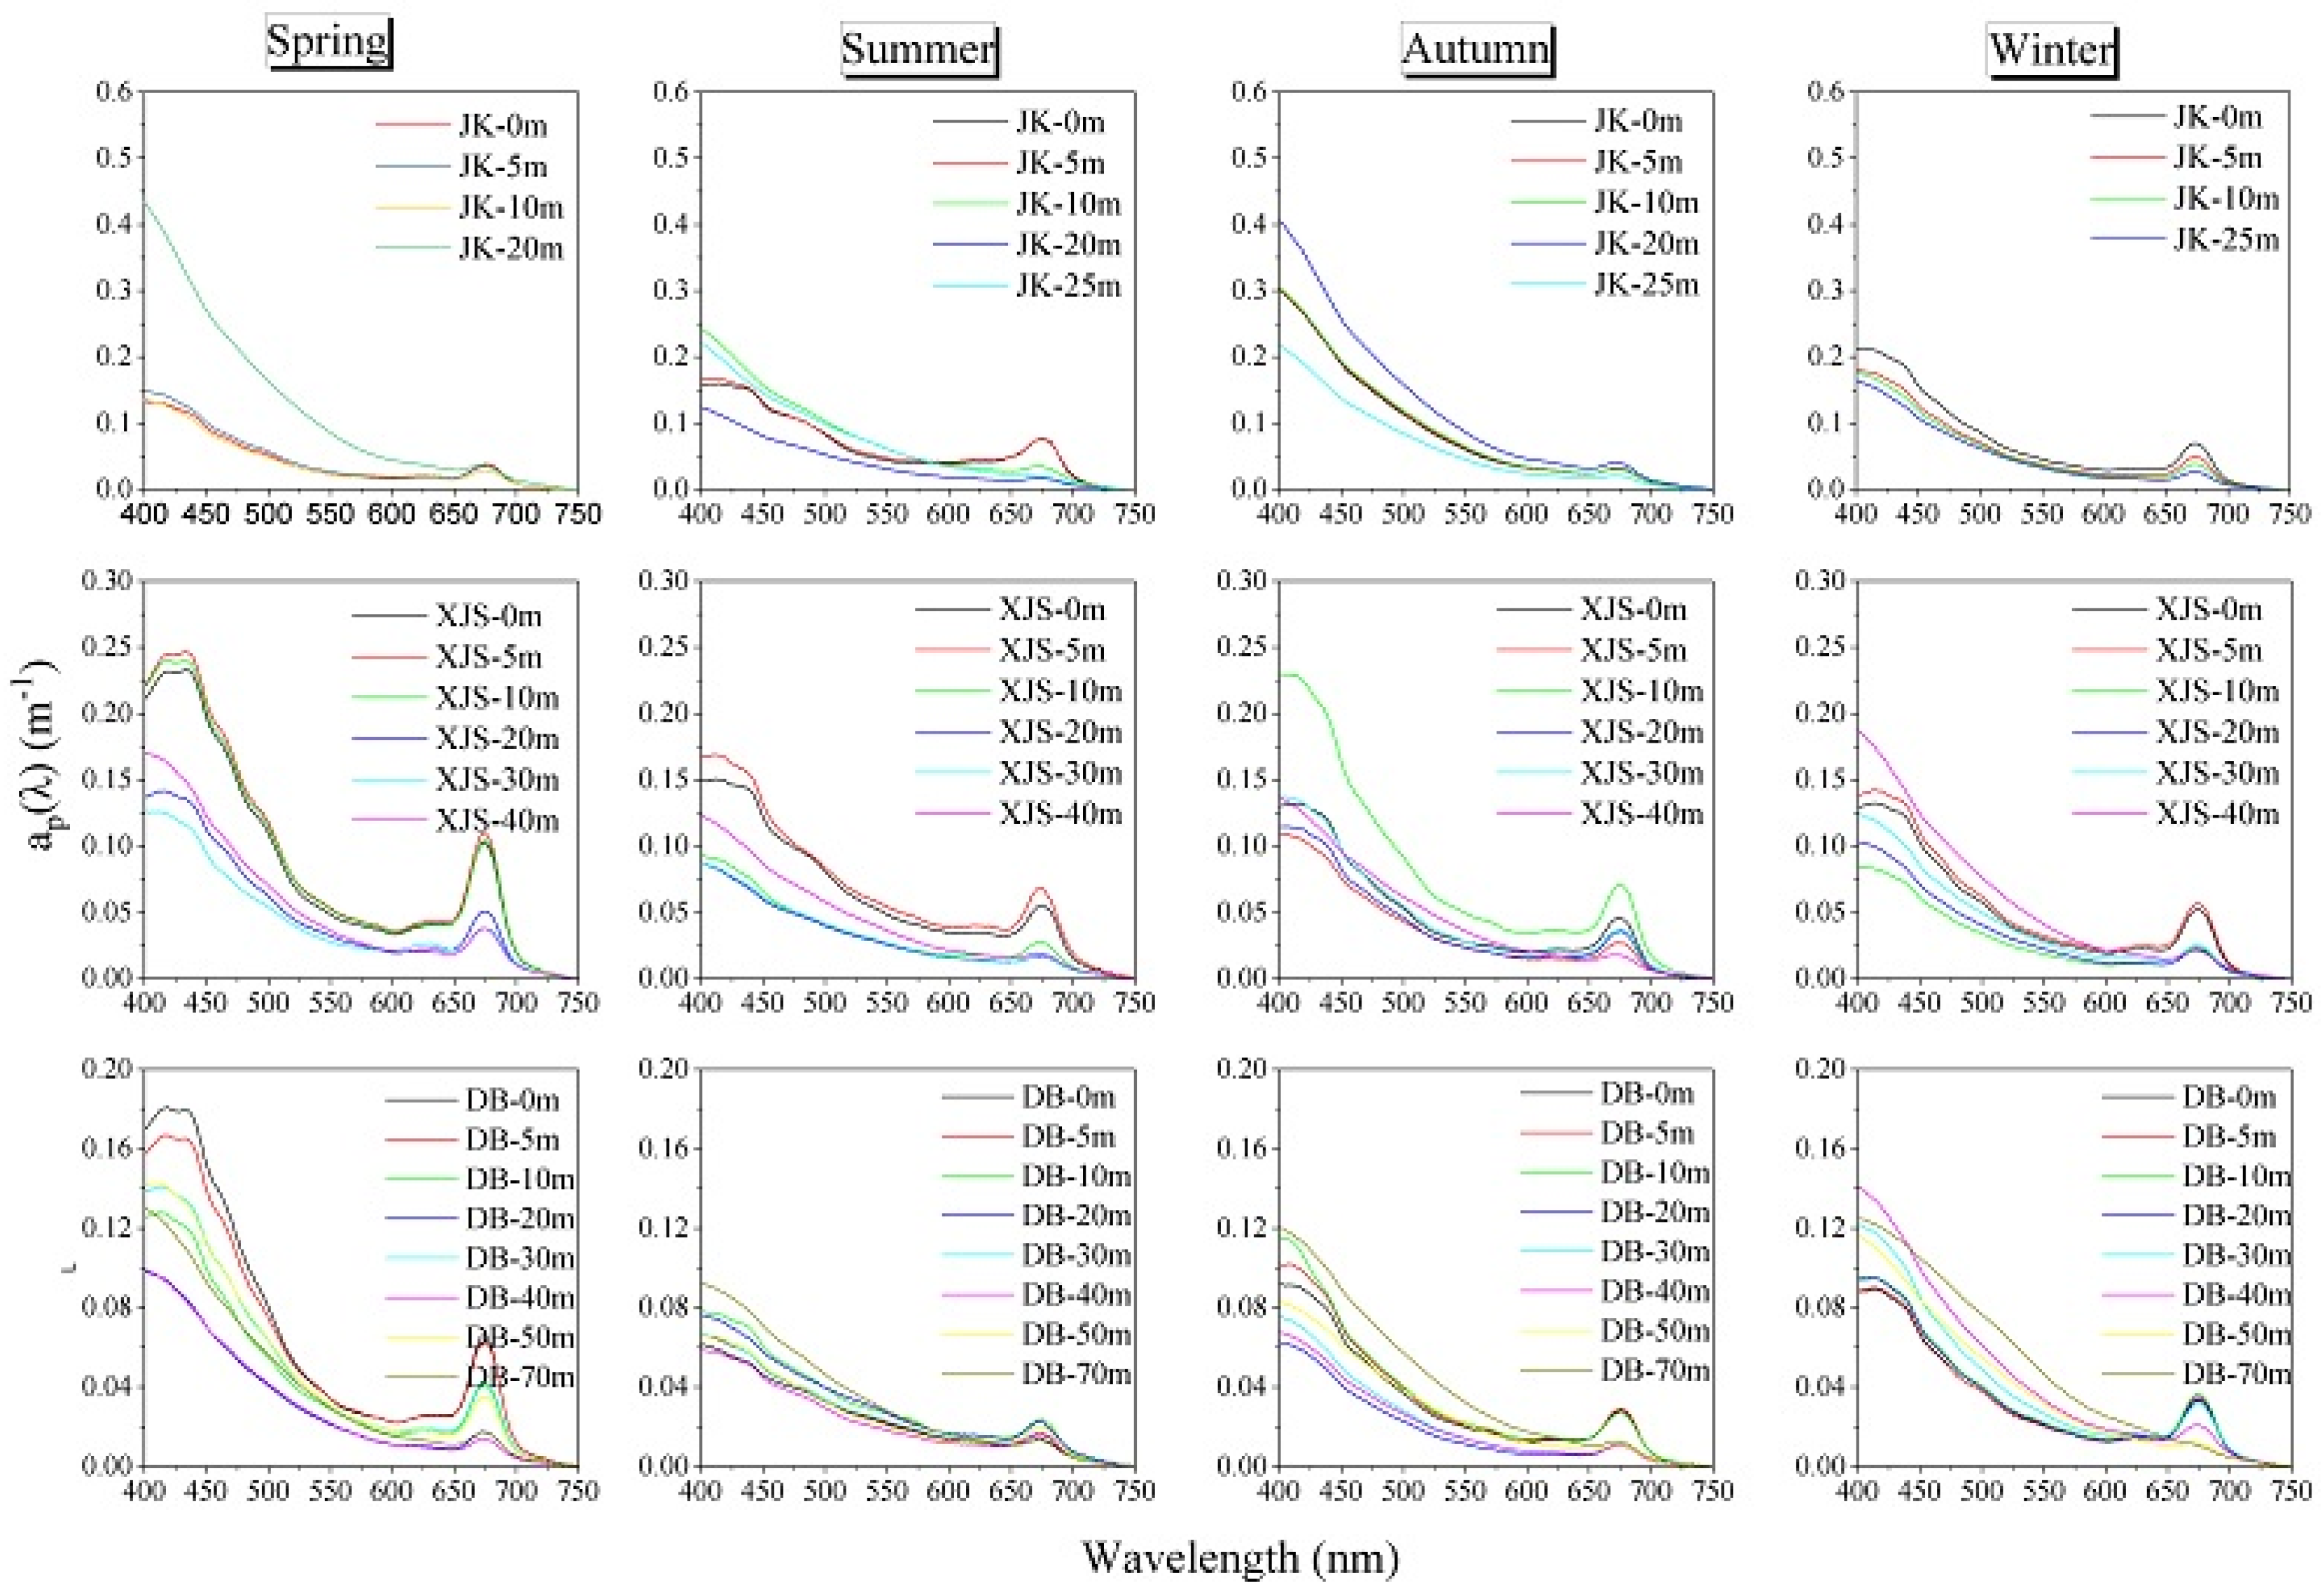
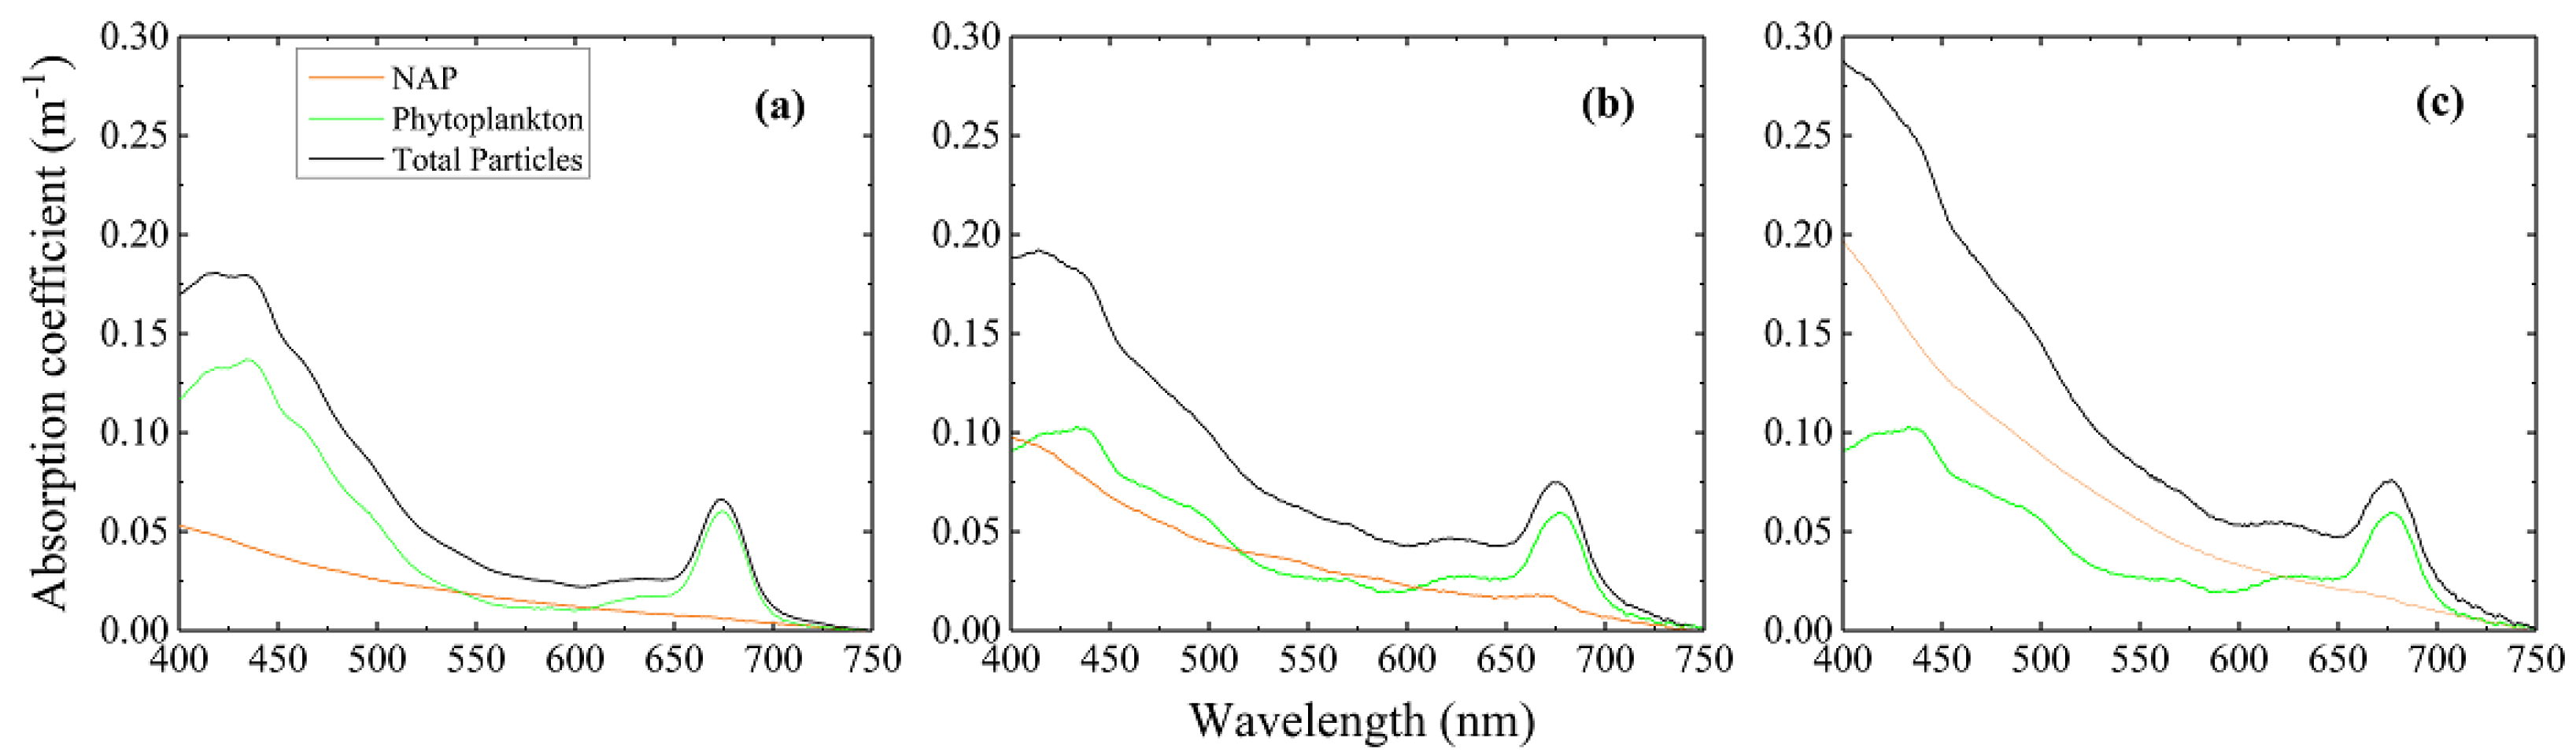
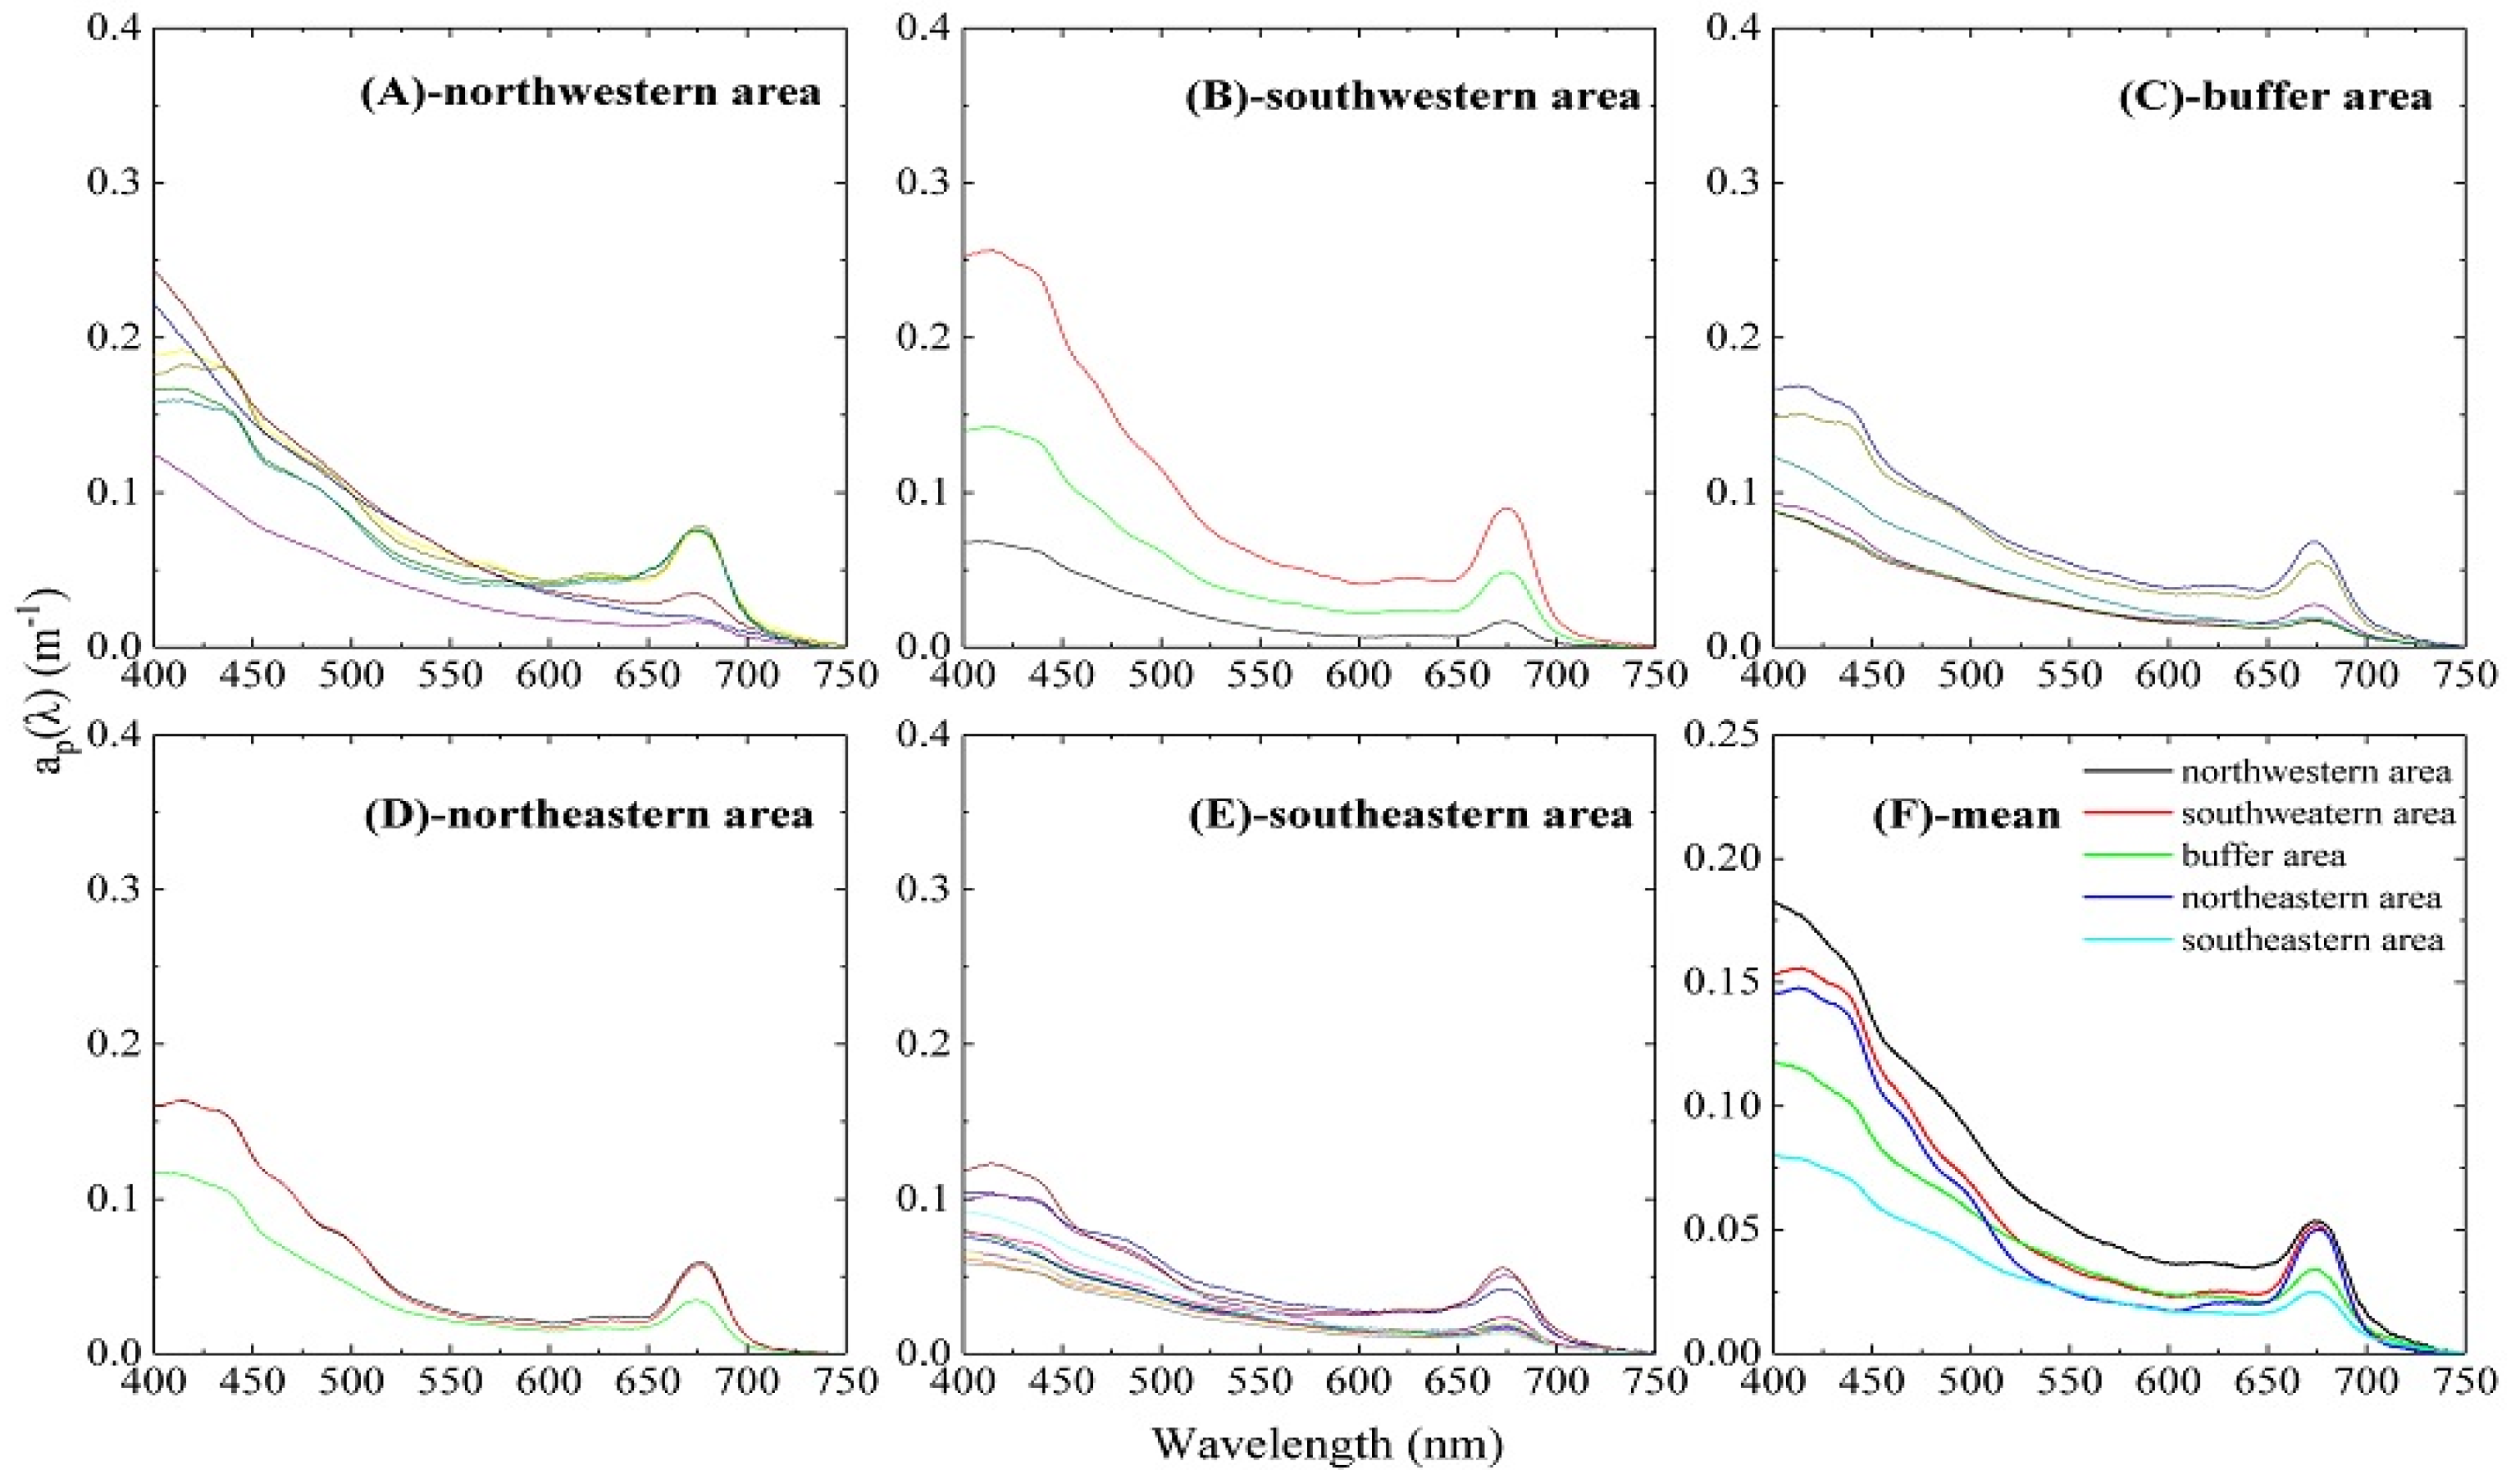
2.2.2. Particle Absorption

The coefficients of a p ( λ ) , a p h ( λ ) and a N A P ( λ ) were measured using the quantitative filter technique (QFT), a detailed discussion of the methods see [27]. The spectral absorption of total particles retained on a filter is comprised of the absorption by phytoplankton ( a p h ( λ ) ) and that by NAP ( a N A P ( λ ) ), whose signals can be separated by either bleaching or a solvent extraction method. Currently, the most widely used method is methanol extraction [44].
A water volume of 50–500 mL, depending on particle concentration, was filtered onto 25-mm diameter Whatman glass-fiber GF/F filters using low vacuum to ensure that the distribution of filtered particles on the filter is relatively uniform. The absorption spectrum, a p ( λ ) was then determined using the T-R technique [45]. Sample absorbance ( O D s ( λ ) ) was measured at 1-nm increment from 300 to 800 nm using a dual beam PE lambda-950 UV/VIS/NIR spectrophotometer equipped with a 60-mm integrating sphere. A blank filter ( O D b l a n k ( λ ) ), wetted with Milli-Q water, was used as reference. It should be noted that the baseline must be horizontal and fluctuate about zero. Pigmented particles were bleached for 40 min with 10-mL methanol, and thoroughly rinsed with Milli-Q before being re-scanned to obtain a N A P ( λ ) . Total particle ( a p ( λ ) ) and NAP ( a N A P ( λ ) ) spectral absorptions were calculated from the total and bleached optical densities, respectively, as follows:
a p ( λ ) = 2.303 β ( V / S ) [ O D s ( λ ) O D n u l l ]
where V/S represents the geometric absorption path length of the material in suspension, with V the volume filtered and S the clearance area of the filter. β is the path length amplification factor which was corrected using the expression given by Tassan and Ferrari (1995) [45]. This correction was shown to be dependable when using the T-R technique [46]. O D n u l l is the average absorption measured around 750 nm. The absorption coefficient for phytoplankton particles ( a p h ( λ ) ) was obtained using
a p h ( λ ) = a p ( λ ) a N A P ( λ )

2.2.3. Physicochemical Variables Measurements

For Chl-a concentration measurements, 50–500 mL water samples collected from each site were filtered on 0.45 µm Whatman glass-fiber GF/F filters. The filtered sample was stored in the dark in a container with liquid nitrogen, and taken to the laboratory for Chl-a concentration analysis within 6 h. The Chl-a filter samples were extracted in hot (80 °C) 90% ethanol, the extract cleared by centrifugation and the Chl fluorescence determined using a Turner fluoroprobe with a two replicated measurements. Afterwards the extract was acidified with 10% hydrochloric acid and the fluorescence measured again to correct for the fluorescence of phaeophytin. The fluoroprobe was calibrated against laboratory measurements using historical data with a high precision that satisfy the requirements of Chl-a modeling. Water transparency was measured using a Secchi disc (SD) and total nitrogen (TN) and total phosphorus (TP) were measured using a HACH HACH NPW-160 online analyzer.

2.2.4. Data Analysis

Statistical analyses (mean value, standard deviation, ANOVA and linear fitting) were performed using OriginPro 2017 software. Comparisons of the population parameters between the two groups were assessed using t-test with a p-value of 0.05 chosen to determine significance. Regression and correlation analyses were performed to estimate the degree of relationship between the variables with the statistical significance levels set at p > 0.05. It is worth noting that, to show the regional variability in the summer, the samples in BMF were not used in Figure 4, Figure 8 and Figure 13 due to its extremely high value than others, whereas, to show the seasonal variability, the samples from depths below 10 m were not used in Figure 2, Figure 6, Figure 11 and Figure 13 and Table 3 to minimize the variability caused by depth.

3. Results and Discussion

There was no great variability in the properties of OACs in Lake Qiandaohu compared to Lake Taihu [47,48], both within and between seasons. Table 2 presents the Chl-a concentration and observed ranges of some parameters measured in Lake Qiandaohu during the four cruises in 2015 and 2016. The Chl-a concentrations measured in Lake Qiandaohu were relatively low, ranging from 0.37 to 19.62 µg/L with a mean of 4.01 µg/L. There were seasonal-spatial differences in spectral absorption of particle (Figure 2 and Figure 4). The concentrations of Chl-a, TN, TP, and SD (Table 2) indicate that Lake Qiandaohu was in mesotrophic status with good water quality.
The total particle absorption ( a p ( λ ) ) shown in Figure 2 was characterized by strong absorption in the blue band of the visible spectrum, mainly caused by suspended minerals and/or detrital particles, and a distinct Chl-a absorption peak at near-infrared wavelengths. The total particle absorption spectrum at most sites possessed a significant absorption peak at 675 nm, with a companion peak around 440 nm. It is worth noting that there was a small percentage of particle absorption spectra that has no obvious peak at 440 nm. The reason for this is NAP absorption coefficients are generally bigger than phytoplankton absorption coefficients in these waters. However, overall the absorption peak at 675 nm was generally larger in spring than in the other seasons, suggesting a relatively more important contribution of phytoplankton to particle absorption in spring.
There were three typical sets of spectra of the particles absorption coefficient in Lake Qiandaohu (Figure 3). Figure 3a,c, respectively, illustrates times when phytoplankton and NAP dominate the total particle absorption, while Figure 3b represents a time when neither phytoplankton nor NAP dominate the total particle absorption. Considering the entire lake, our analyses indicate that most sampling sites tended to present water conditions whose total particle absorption spectral belonged to the second type (Figure 3b). This implies that NAP and phytoplankton had a similar influence on the total particle absorption. The first spectral type (Figure 3a) illustrated conditions where the phytoplankton dominated the total particle counts, and the third spectral type (Figure 3c) indicated conditions where NAP contributed more to the total particle counts than phytoplankton.
In order to avoid differences among different seasons act upon total particle absorption, a single summer season was chosen to illustrate the spatial variability. The total particle absorption spectra from the different regions in the summer are shown in Figure 4. The ranges of a p ( 440 ) and a p ( 675 ) were 0.090–0.178 m−1 and 0.016–0.078 m−1 in northwestern area, respectively. However, the ranges of a p ( 440 ) and a p ( 675 ) were 0.061–0.236 m−1 and 0.017–0.090 m−1 in southwestern area, respectively. The mean absorption spectrum of total particle in the northwestern area is larger than those from the other areas, as shown in Figure 4F. Because the northwestern area is where the majority of the surface runoff enters, it has to an increased input of terrestrial origin detritus and runoff particulates in the summer. The total particle absorption spectra in the southeastern area is second in amplitude to the southeastern area, which is consistent with this area being the secondary area of Lake Qiandaohu in terms of surface runoff input.
As shown in Figure 1, sampling sites JK, XJS and DB, which are located in the northwestern, buffer and southeastern areas, respectively, were sampled at multiple depths. It is reported by Dong et al. (2013) and Zhang et al. (2014) [49,50] that a monomictic thermal stratification was observed in Lake Qiandaohu, initiating in April and lasting until December, and stratification in summer is most evident. To determine the vertical structure of the optical properties of the water column, the particle absorption spectra of water samples taken from the three sites at several depths are shown in Figure 5. These spectra show that the particle absorption varies both with depth and time of year, with the depth dependence being weakest in winter (Table 3). It has also reported by Dong et al. (2013) that the chlorophyll a concentration was higher in the surface water and lower in the bottom water, and besides, the maximum algal growth rate were found at the depth 5–10 m below the water surface. In our study, it is clear that the particle absorption peaks at 440 and 675 nm for depth shallower than 10 m are generally stronger than the others. This evidence suggests that phytoplankton concentration in the near surface water was greater than at deeper depths, indicating that the water column was vertically inhomogeneous.

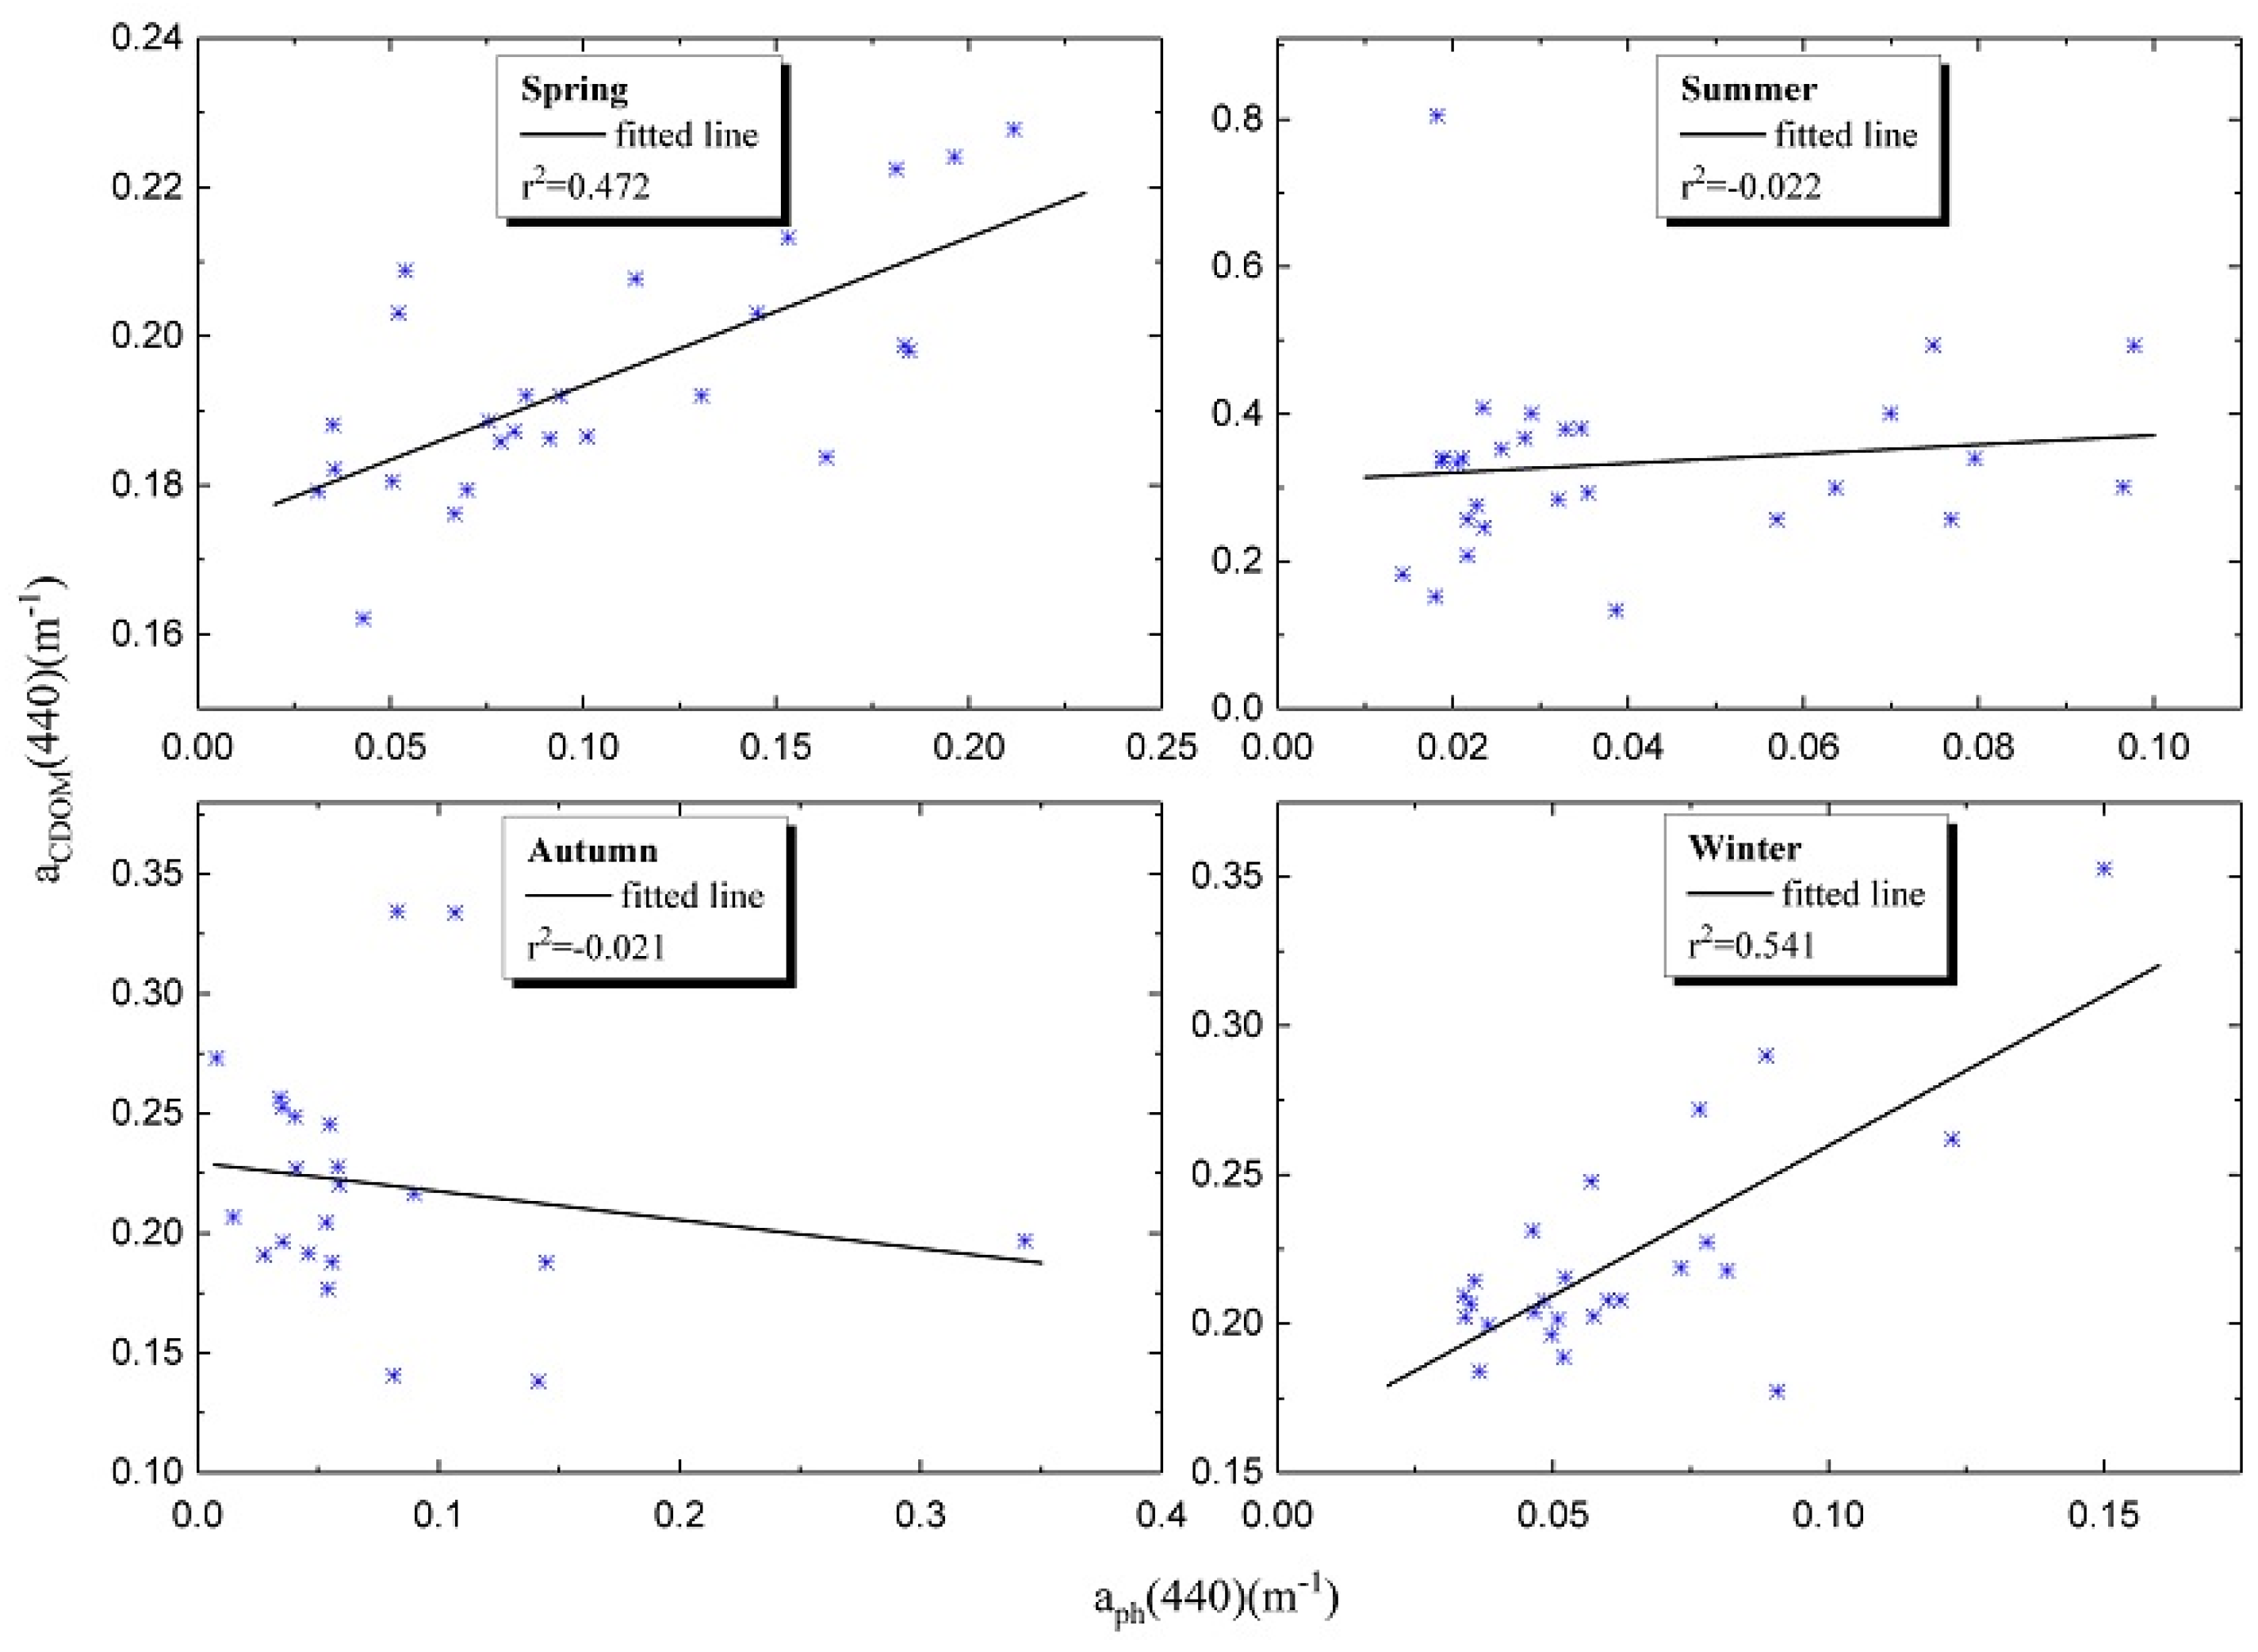
3.1. Absorption by CDOM

Figure 6 shows the a C D O M ( λ ) spectra measured in all four seasons. The absorption coefficient of CDOM decreased exponentially with increasing wavelength over the 400–700 nm range. The mean CDOM absorption coefficients at 440 nm, M _ a C D O M ( 440 ) , were, respectively, 0.22 ± 0.05, 0.27 ± 0.12, 0.21 ± 0.05, and 0.21 ± 0.04 m−1 in spring, summer, autumn, and winter. The mean CDOM absorption coefficient in summer was significantly higher than those in the other seasons according to ANOVA (p < 0.0001) analysis. The average CDOM absorption of each season is shown in Figure 7a. In general, a C D O M ( λ ) in summer is significantly higher than in the other seasons (ANOVA analysis p < 0.005), due to the organic matter inputs from upstream rivers in northwestern area [51]. Similar slopes of CDOM absorption spectra are found in spring, autumn and winter.
Statistical results of CDOM absorption coefficients in the summer are shown in Figure 8 to interpret the spatial variations in different region of Lake Qiandaohu. In Figure 8A–F, there are obvious spatial differences, especially in northwest area (Figure 8A) the main runoff inlet of Lake Qiandaohu, which exhibited larger CDOM absorption coefficients than other areas in summer. However, the southwestern area, another runoff inlet, did not show this trend. This indicated that affection to CDOM absorption by human activity in northwestern area is greater than southwestern area. Besides, we can see a decreasing trend from upstream to downstream at spatial scale through Figure 8A,E. We may also deduce that northeastern area was minimally affected by outer source compared to other regions.
Figure 7b exhibits the overall variation of the S C D O M estimates according to Equation (5). The average S C D O M value based on the data was 0.0164 nm−1 with a standard deviation of 0.00176 nm−1. The slope for the absorption spectra of CDOM, S C D O M , measured in Lake Qiandaohu was of similar magnitude to values measured by Roesler (1989) [11] in oceanic waters, which range from 0.0140 to 0.0191 nm−1, as well as being consistent with those measured in inland waters, which range from 0.0128 to 0.0197 nm−1, with a mean of 0.0163 nm−1. Certainly, it should be noted that S C D O M depends on the wavelength range used to the exponential fitting in each study. Our results are slightly higher than the S C D O M of Lake Taihu reported by Ma et al. (2006) [52]. Most S C D O M values concentrate around 0.0164 nm−1 with small variations, which suggests that the composition of CDOM in Lake Qiandaohu is relatively uniform.
Figure 9 shows the relationship between S C D O M and a C D O M ( 440 ) during all seasons. An inverse relationship can be discerned for a C D O M ( 440 ) < 0.2 m−1 (r = −0.61), in agreement with the results of Carder et al. (1989) [53]. Futher, there is large variability in S C D O M for a C D O M ( 440 ) > 0.2 m−1 (r = −0.14), which is consistent with the pattern found by Babin et al. (2003) [15]. It was reported by Carder et al. (1989) and Zepp and Schlotzhauer (1981) [53,54] that spectral slope of a C D O M ( λ ) varies inversely with molecular weight, with high molecular weight humic acids exhibiting slopes less than 0.5 of the lower molecular weight fulvic acids. The relationship between S C D O M and a C D O M ( 440 ) in summer (r2 = 0.78, p < 0.001) and spring (r2 = 0.32, p < 0.005) was significantly higher than in autumn and winter. This may indicate the composition of the CDOM in summer is different from other seasons. Our study shows that, on average, the CDOM absorption spectra in Lake Qiandaohu can be expressed as follows:
a C D O M ( λ ) = a C D O M ( 440 ) e ( 0.0164 ( λ 440 ) ) , ( 400 < λ < 700 )
Using data from all sites for each season in regression analyses, linear least-squares fits between a p h ( 440 ) and a C D O M ( 440 ) are obtained and presented in Figure 10. Overall, the least-squares fits between a p h ( 440 ) and a C D O M ( 440 ) showed r-squared coefficients in spring (r2 = 0.47, p < 0.001) and winter (r2 = 0.54, p < 0.001) that are considerably higher than those in summer and autumn, which gives some evidence for the autochthonous production of CDOM during those two seasons. However, the composition of CDOM was governed by exogenous organic matter due to the soil erosion caused by rainfall in summer and autumn. This is an intrinsic characteristic of clear-deep lakes distinguish them from shallow inland lakes in their sources of CDOM.

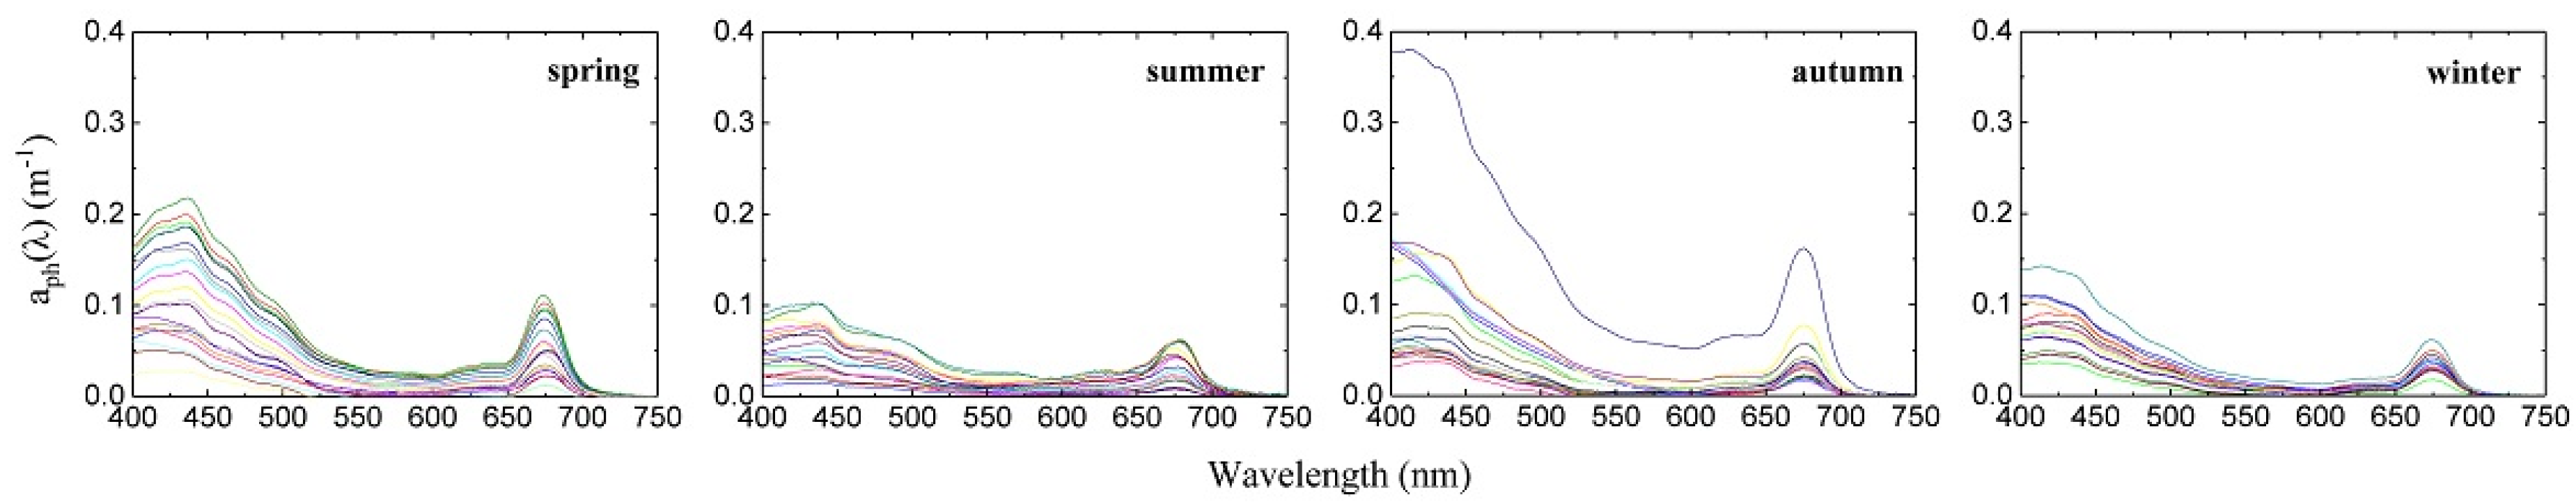
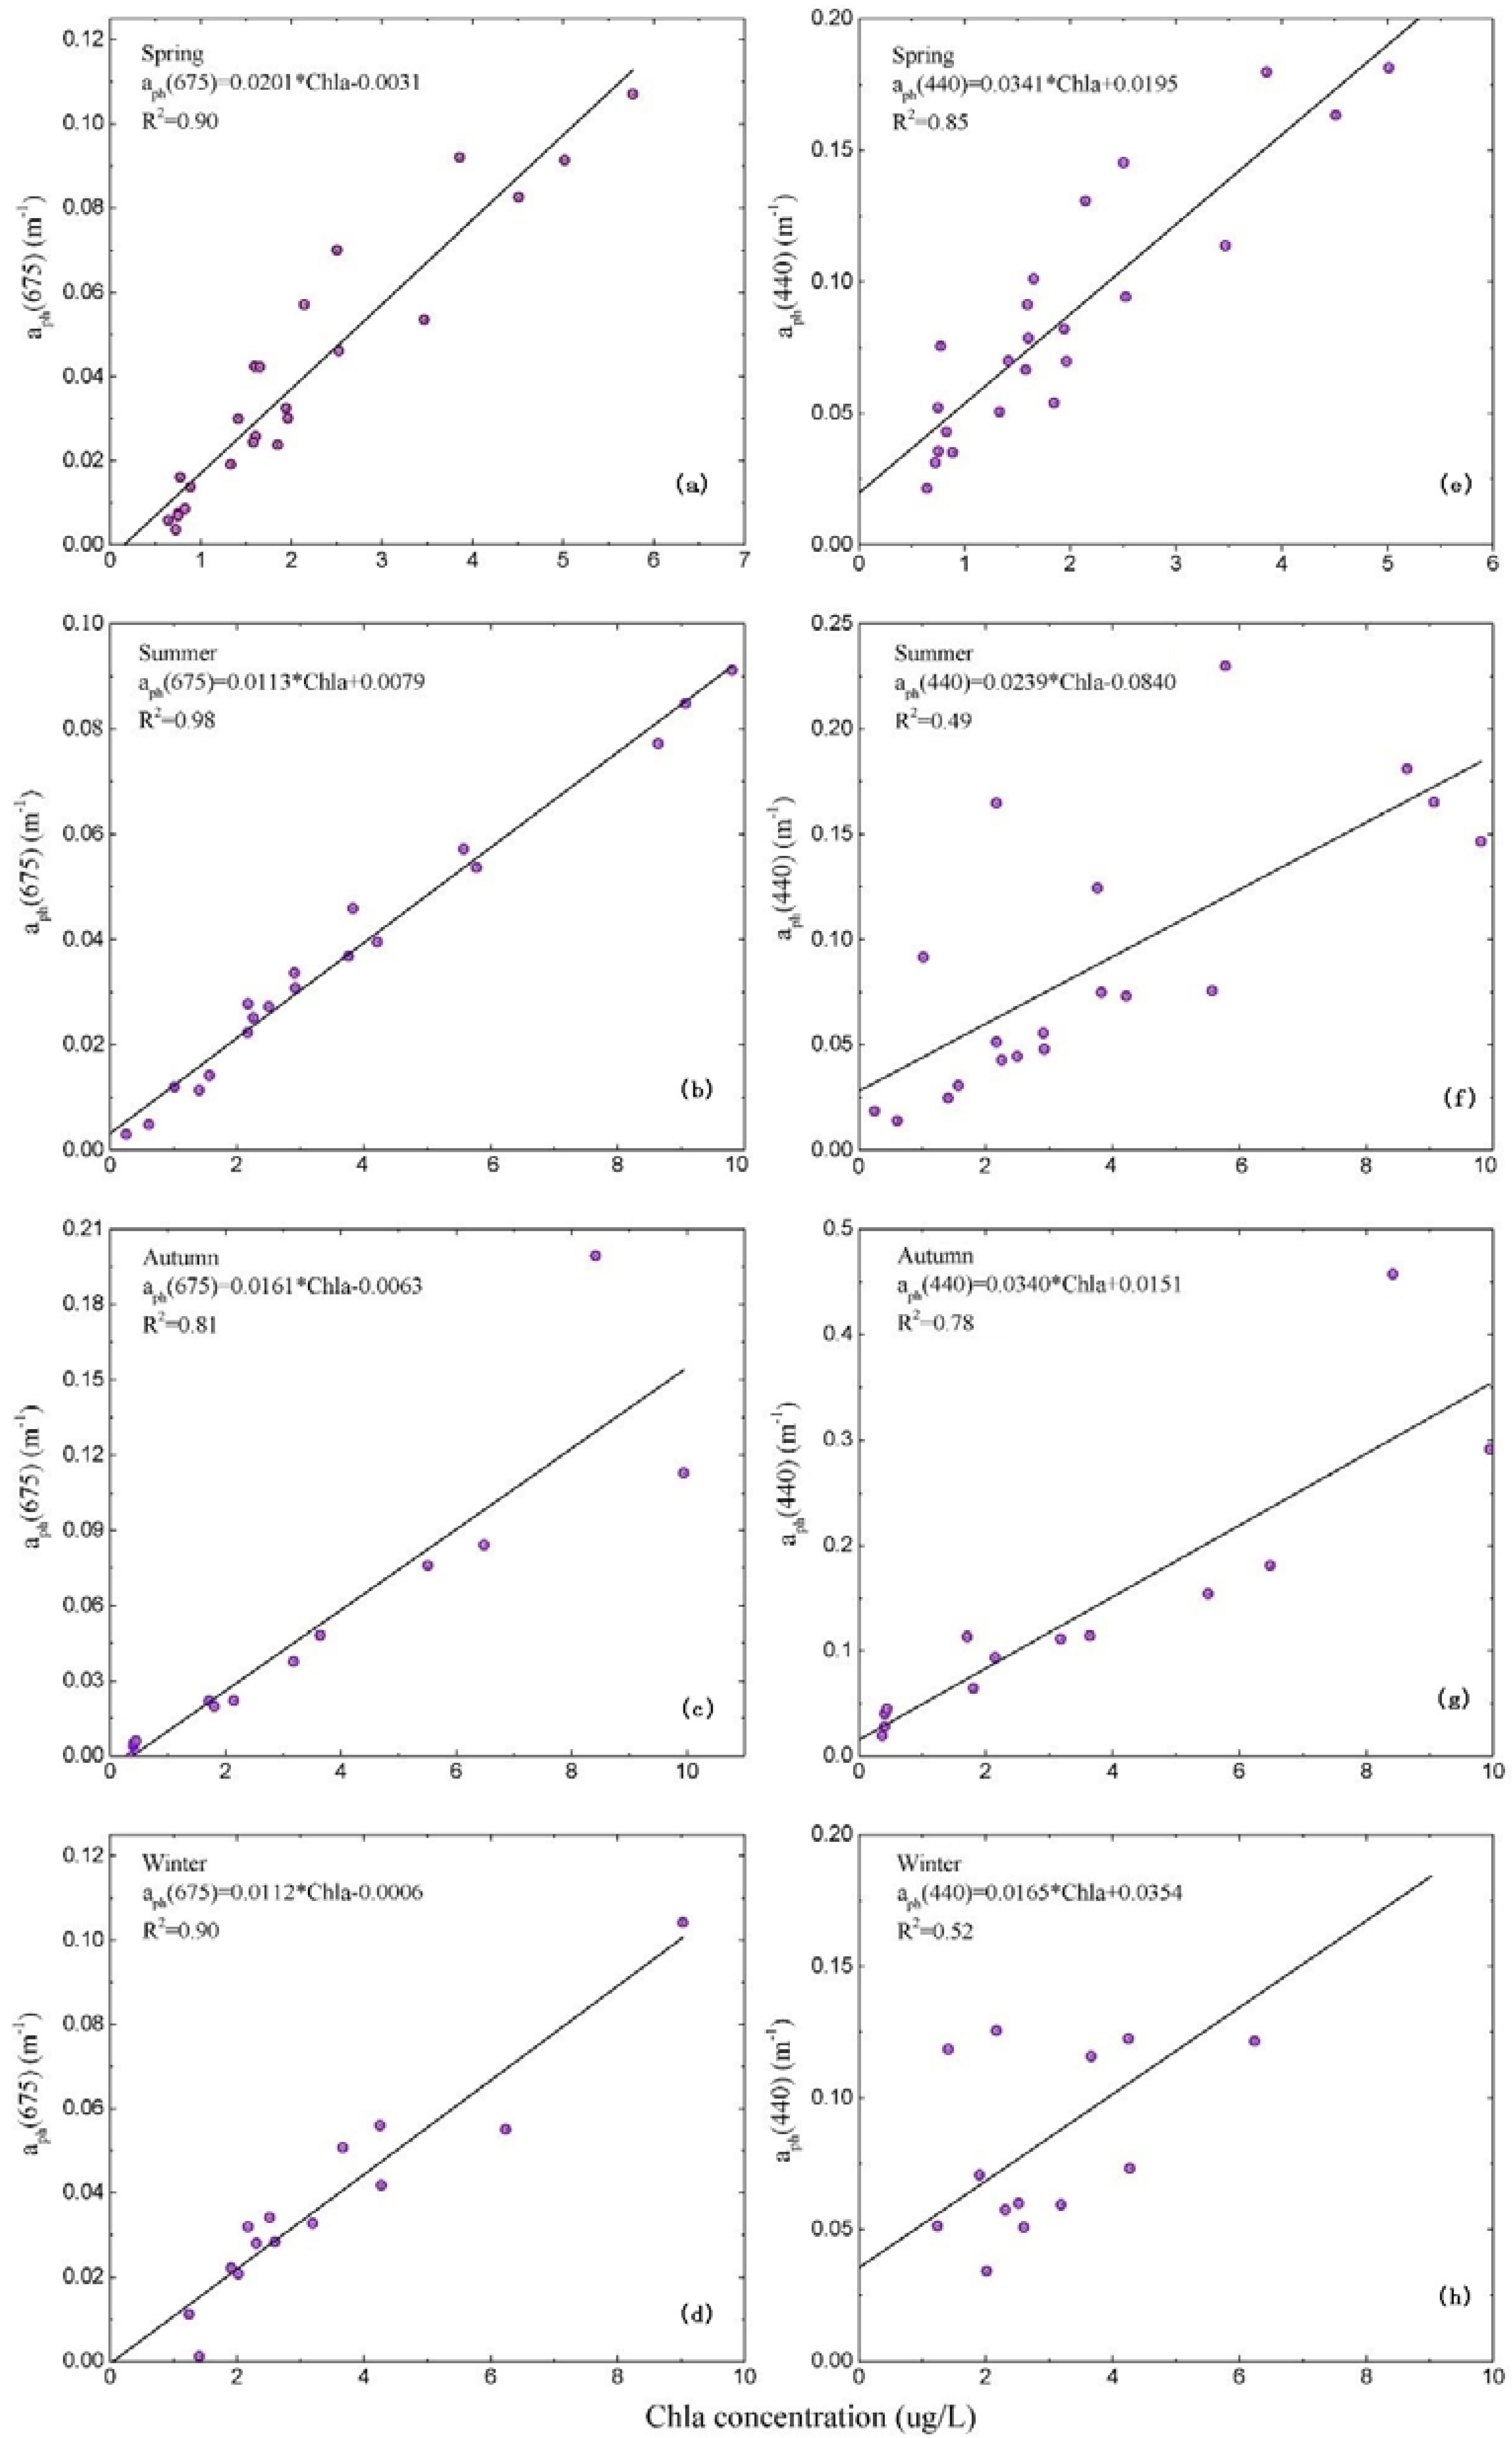
3.2. Absorption by Phytoplankton

Overall, the phytoplankton absorption coefficient in Lake Qiandaohu in spring is different from those in other seasons (Figure 11). The absorption peaks around 440 and 675 nm in spring were more obvious than in the other three seasons, with the absorption peak at 675 nm being significantly stronger than the one at 440 nm, which is an indicator that spring is a strong growth period for phytoplankton in Lake Qiandaohu. There are obvious variations in the phytoplankton absorption coefficient at different sites due to marked differences in Chl-a concentration around the lake.
It is well known that Chl-a concentration varies with the amount of phytoplankton and composition of the population. We performed a quality assessment of Chl-a concentration measurements prior to analysis by splitting some samples and performing parallel analysis. If there were a large difference between the measured values for the two parallel samples, the sampling data would not be used for modeling between a p h and Chl-a. For acceptable samples, we plotted a p h as a linear function of Chl-a concentration at 440 and 675 nm in Figure 12. It is readily apparent that robust correlations exist between a p h ( 440 ) and Chl-a concentration and between a p h ( 675 ) and Chl-a concentration in each season. The coefficient of determination between a p h ( 675 ) and Chl-a concentration (p < 0.001) was significantly larger than that between a p h ( 440 ) and Chl-a concentration (p < 0.001). This is a well-known issue and is simply due to the fact that many bio-active pigments absorb light at 440 nm, whereas only chlorophyll absorbs at 675 nm. Particularly, the relationship between a p h ( 440 ) and Chl-a and that between a p h ( 675 ) and Chl-a in spring were robust compared to those in other seasons, which suggests that phytoplankton flourishes in the spring. It should be noted that the coefficient of determination in summer was a maximum between a p h ( 675 ) and Chl-a, and a minimum between a p h ( 440 ) and Chl-a.

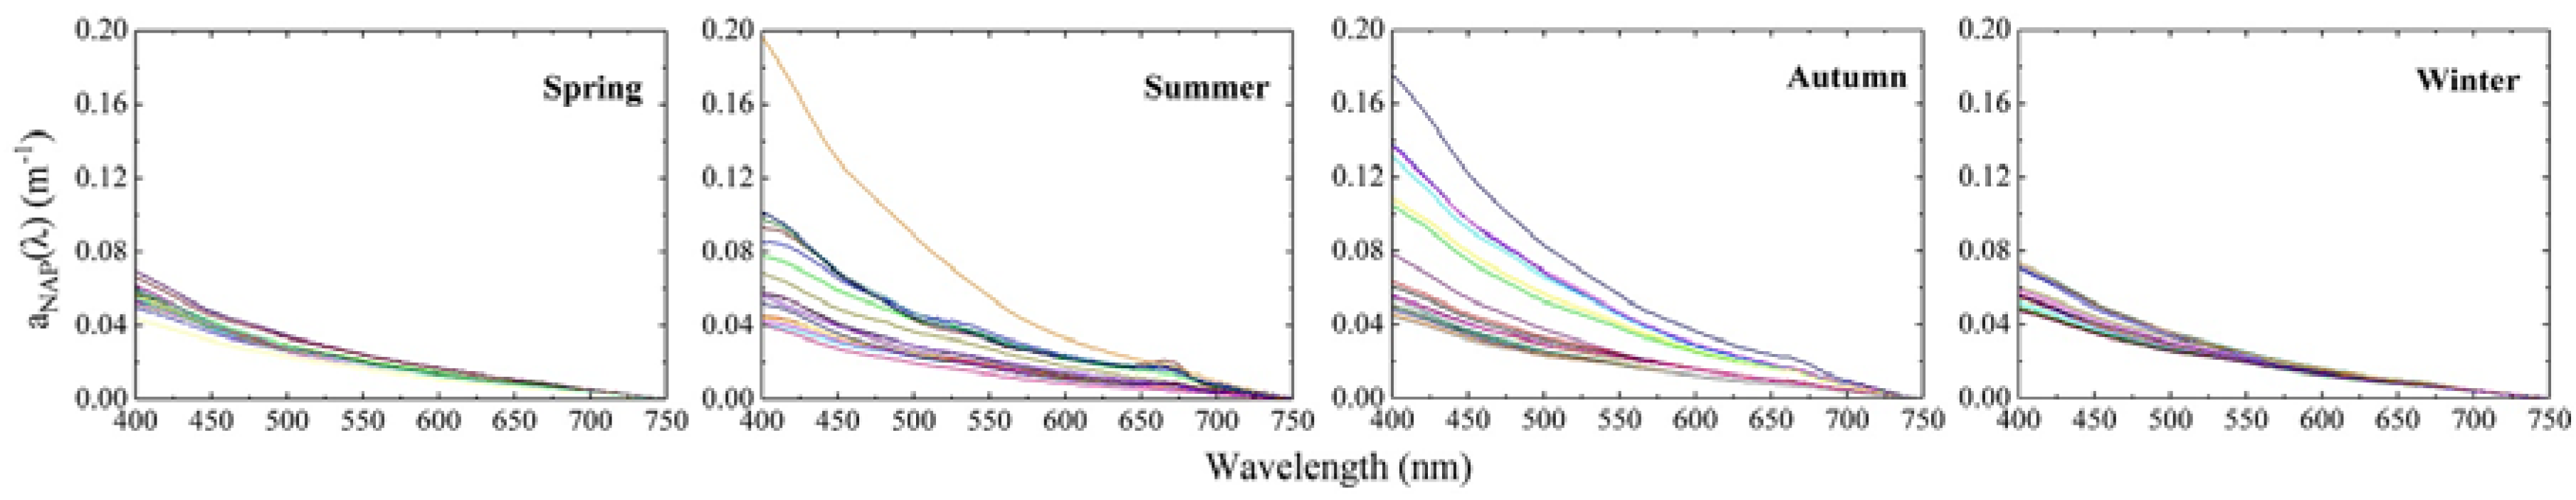
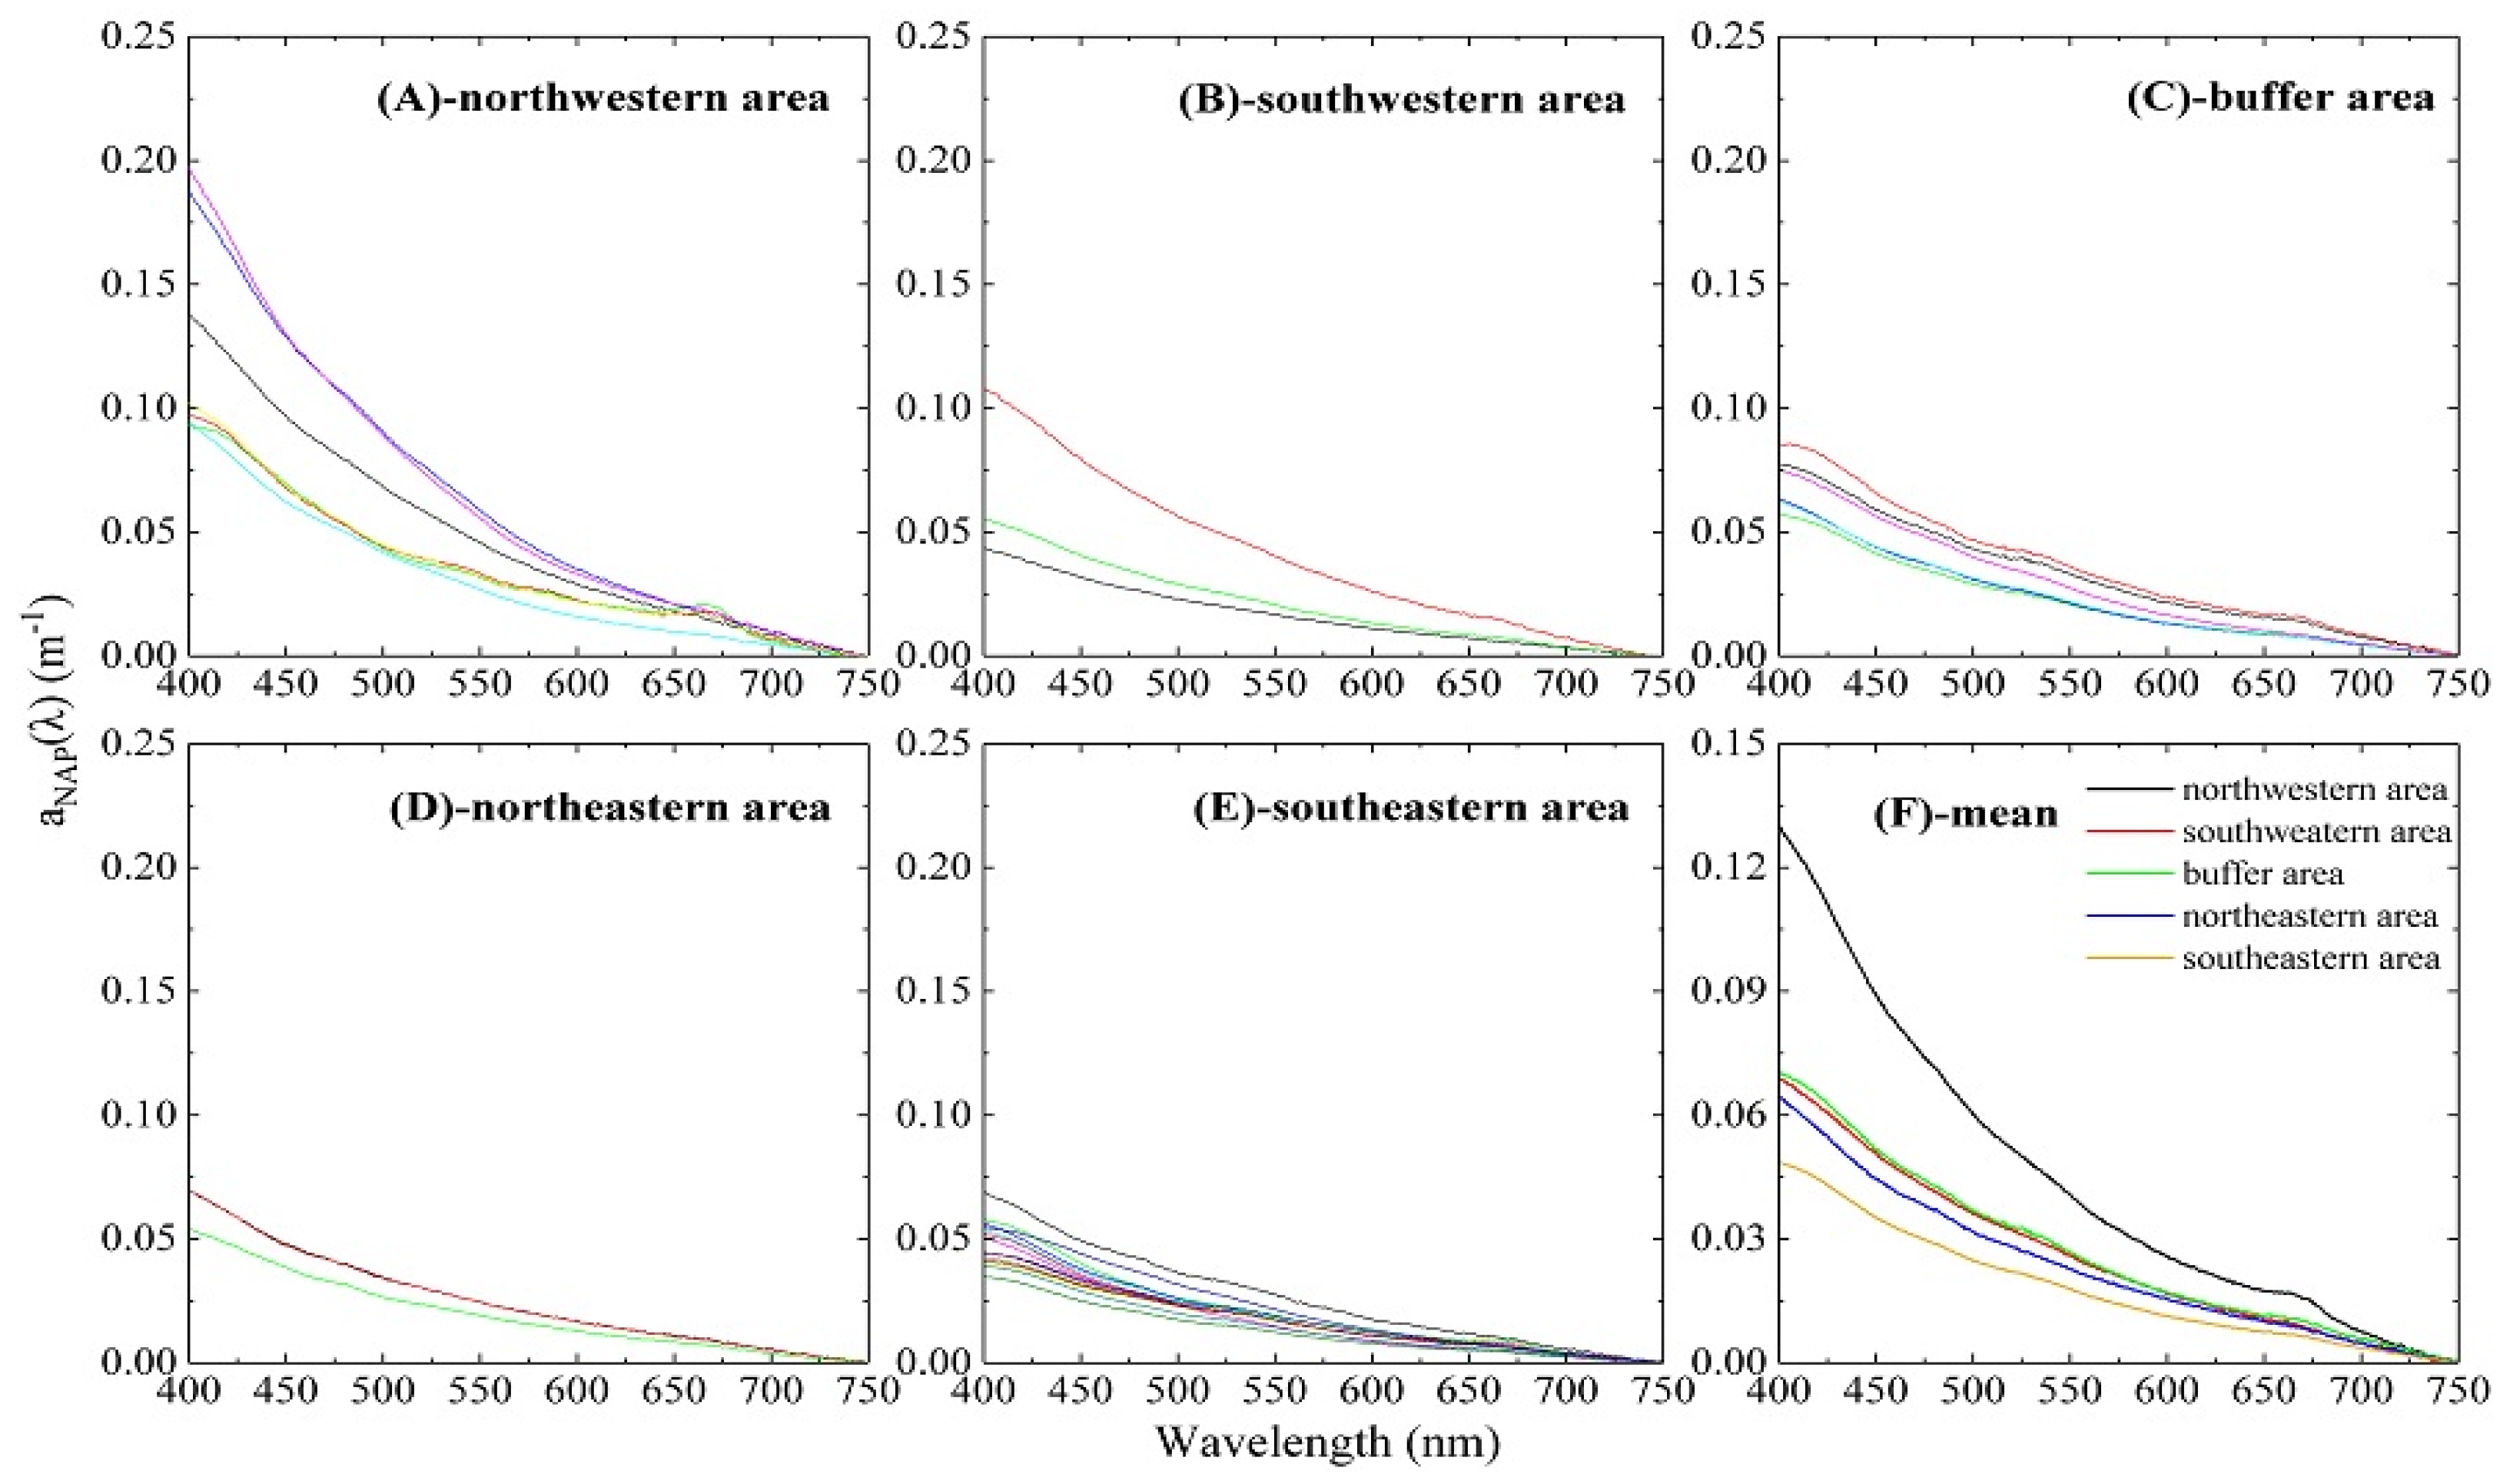
3.3. Absorption by NAP

The NAP absorption coefficient decreased with increasing wavelength in all seasons (Figure 11). In addition, as shown in Table 4, the mean value of a N A P ( 440 ) in summer and autumn is larger than its values in spring and winter, and the NAP absorption spectra became more volatile in summer and autumn than it did in winter and spring.
Many studies have illustrated that NAP has relatively stable absorption characteristics, which can be described using an exponential function [29,46,55]:
a N A P ( λ ) = a N A P ( 440 ) e ( S N A P ( λ 440 ) )
The variation of exponential slope value, S N A P , in the wavelength range 400–750 nm based on our data from the different seasons was relatively narrow, only ranging from 0.0050 to 0.0081 nm−1, with a mean value of 0.0065 nm−1 and a standard variation of 0.00076 nm−1. As shown in Figure 13 and Table 4, the NAP absorption coefficient of Lake Qiandaohu in different seasons can be generally divided into two similar categories, spring and winter with one pattern, and summer and autumn with another. Our results show that NAP absorption can be expressed by:
a N A P ( λ ) = a N A P ( 440 ) e ( 0.0071 ( λ 440 ) ) , ( s p r i n g , w i n t e r )
a N A P ( λ ) = a N A P ( 440 ) e ( 0.0063 ( λ 440 ) ) , ( s u m m e r , a u t u m n )
As expected, the NAP absorption has a similar spatial pattern to the total particle absorption in the summer as shown in Figure 14. NAP spectral absorption coefficients in the northwestern are larger than in other areas, and NAP absorption in the southeastern area is smaller than other areas (Figure 14F). Further, we perform a statistical analysis of the NAP absorption in different areas, and find mean value of a N A P ( 440 ) in the northwestern area is 0.097 ± 0.0317 m−1, in the southwestern area is 0.054 ± 0.0272 m−1, in buffer area is 0.056 ± 0.0108 m−1, in the northeastern is 0.048 ± 0.0058 m−1, and in the southeastern area is 0.038 ± 0.0067 m−1. These statistical results indicate that the concentration of inorganic compounds in the water body near the surface runoff inlet are higher than in other areas, which makes sense as waters in these areas are most affected by the input from the outer source.

3.4. Analysis on Contribution of Different Absorption

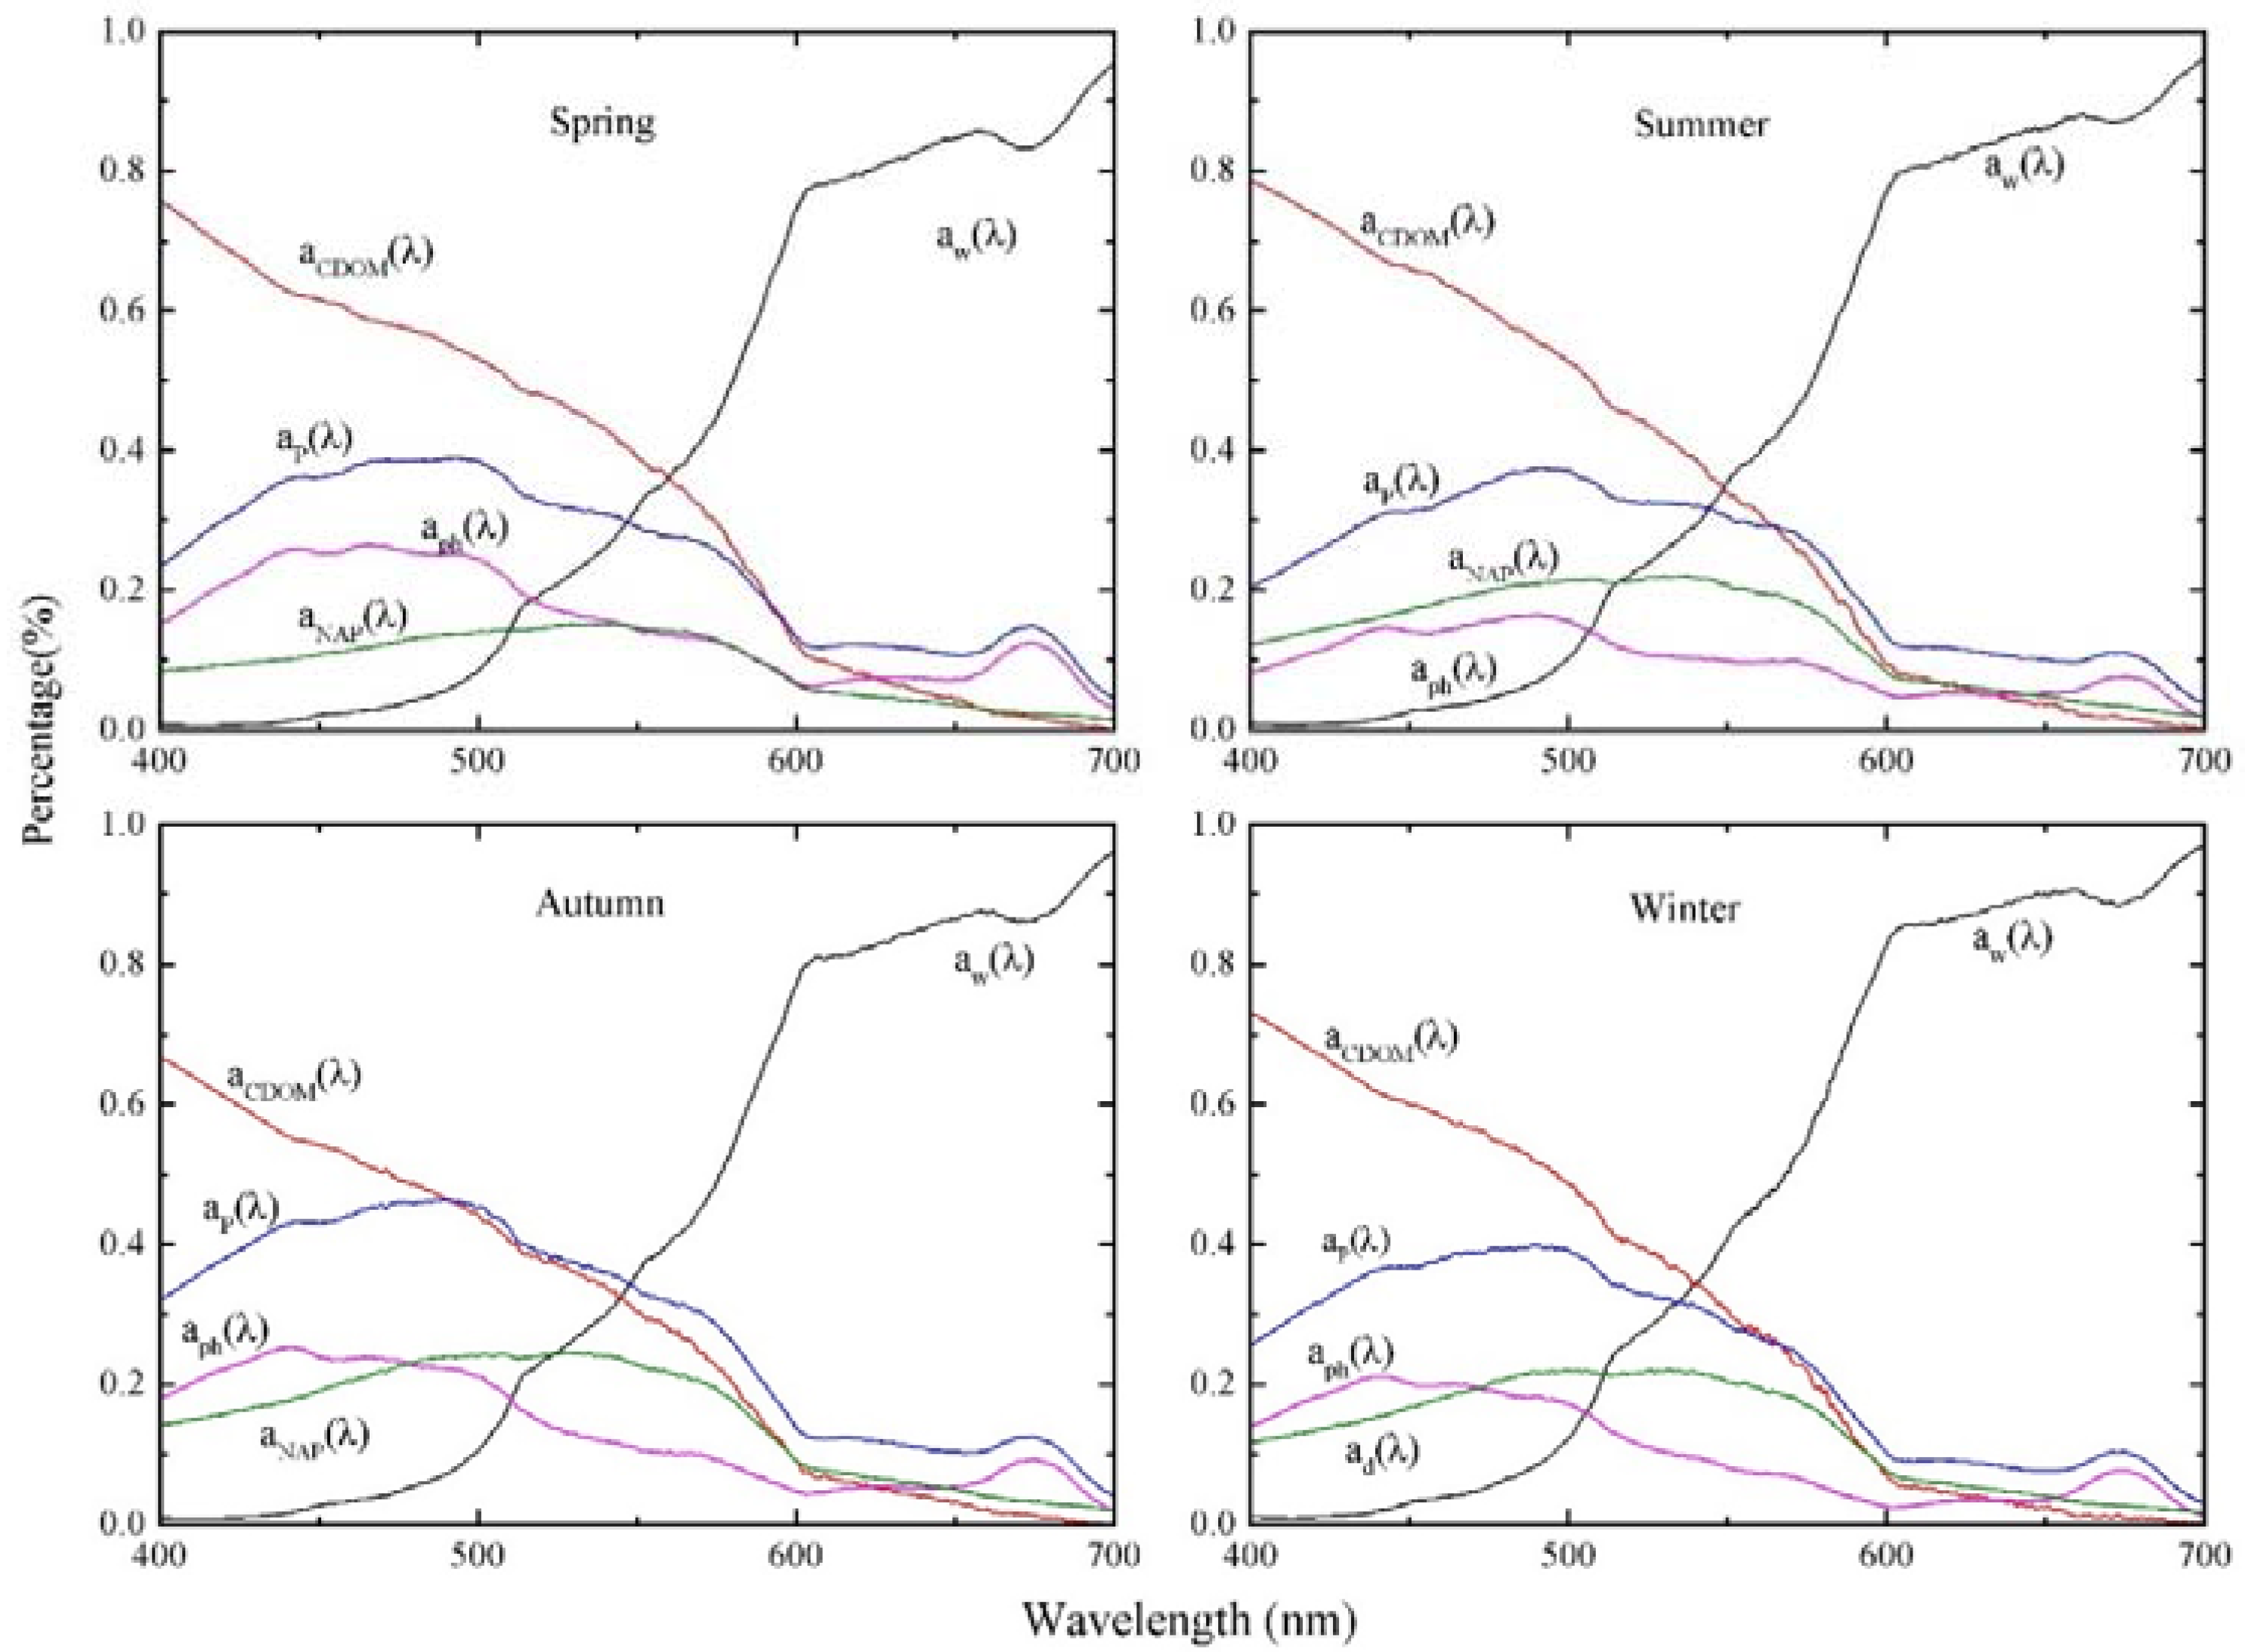
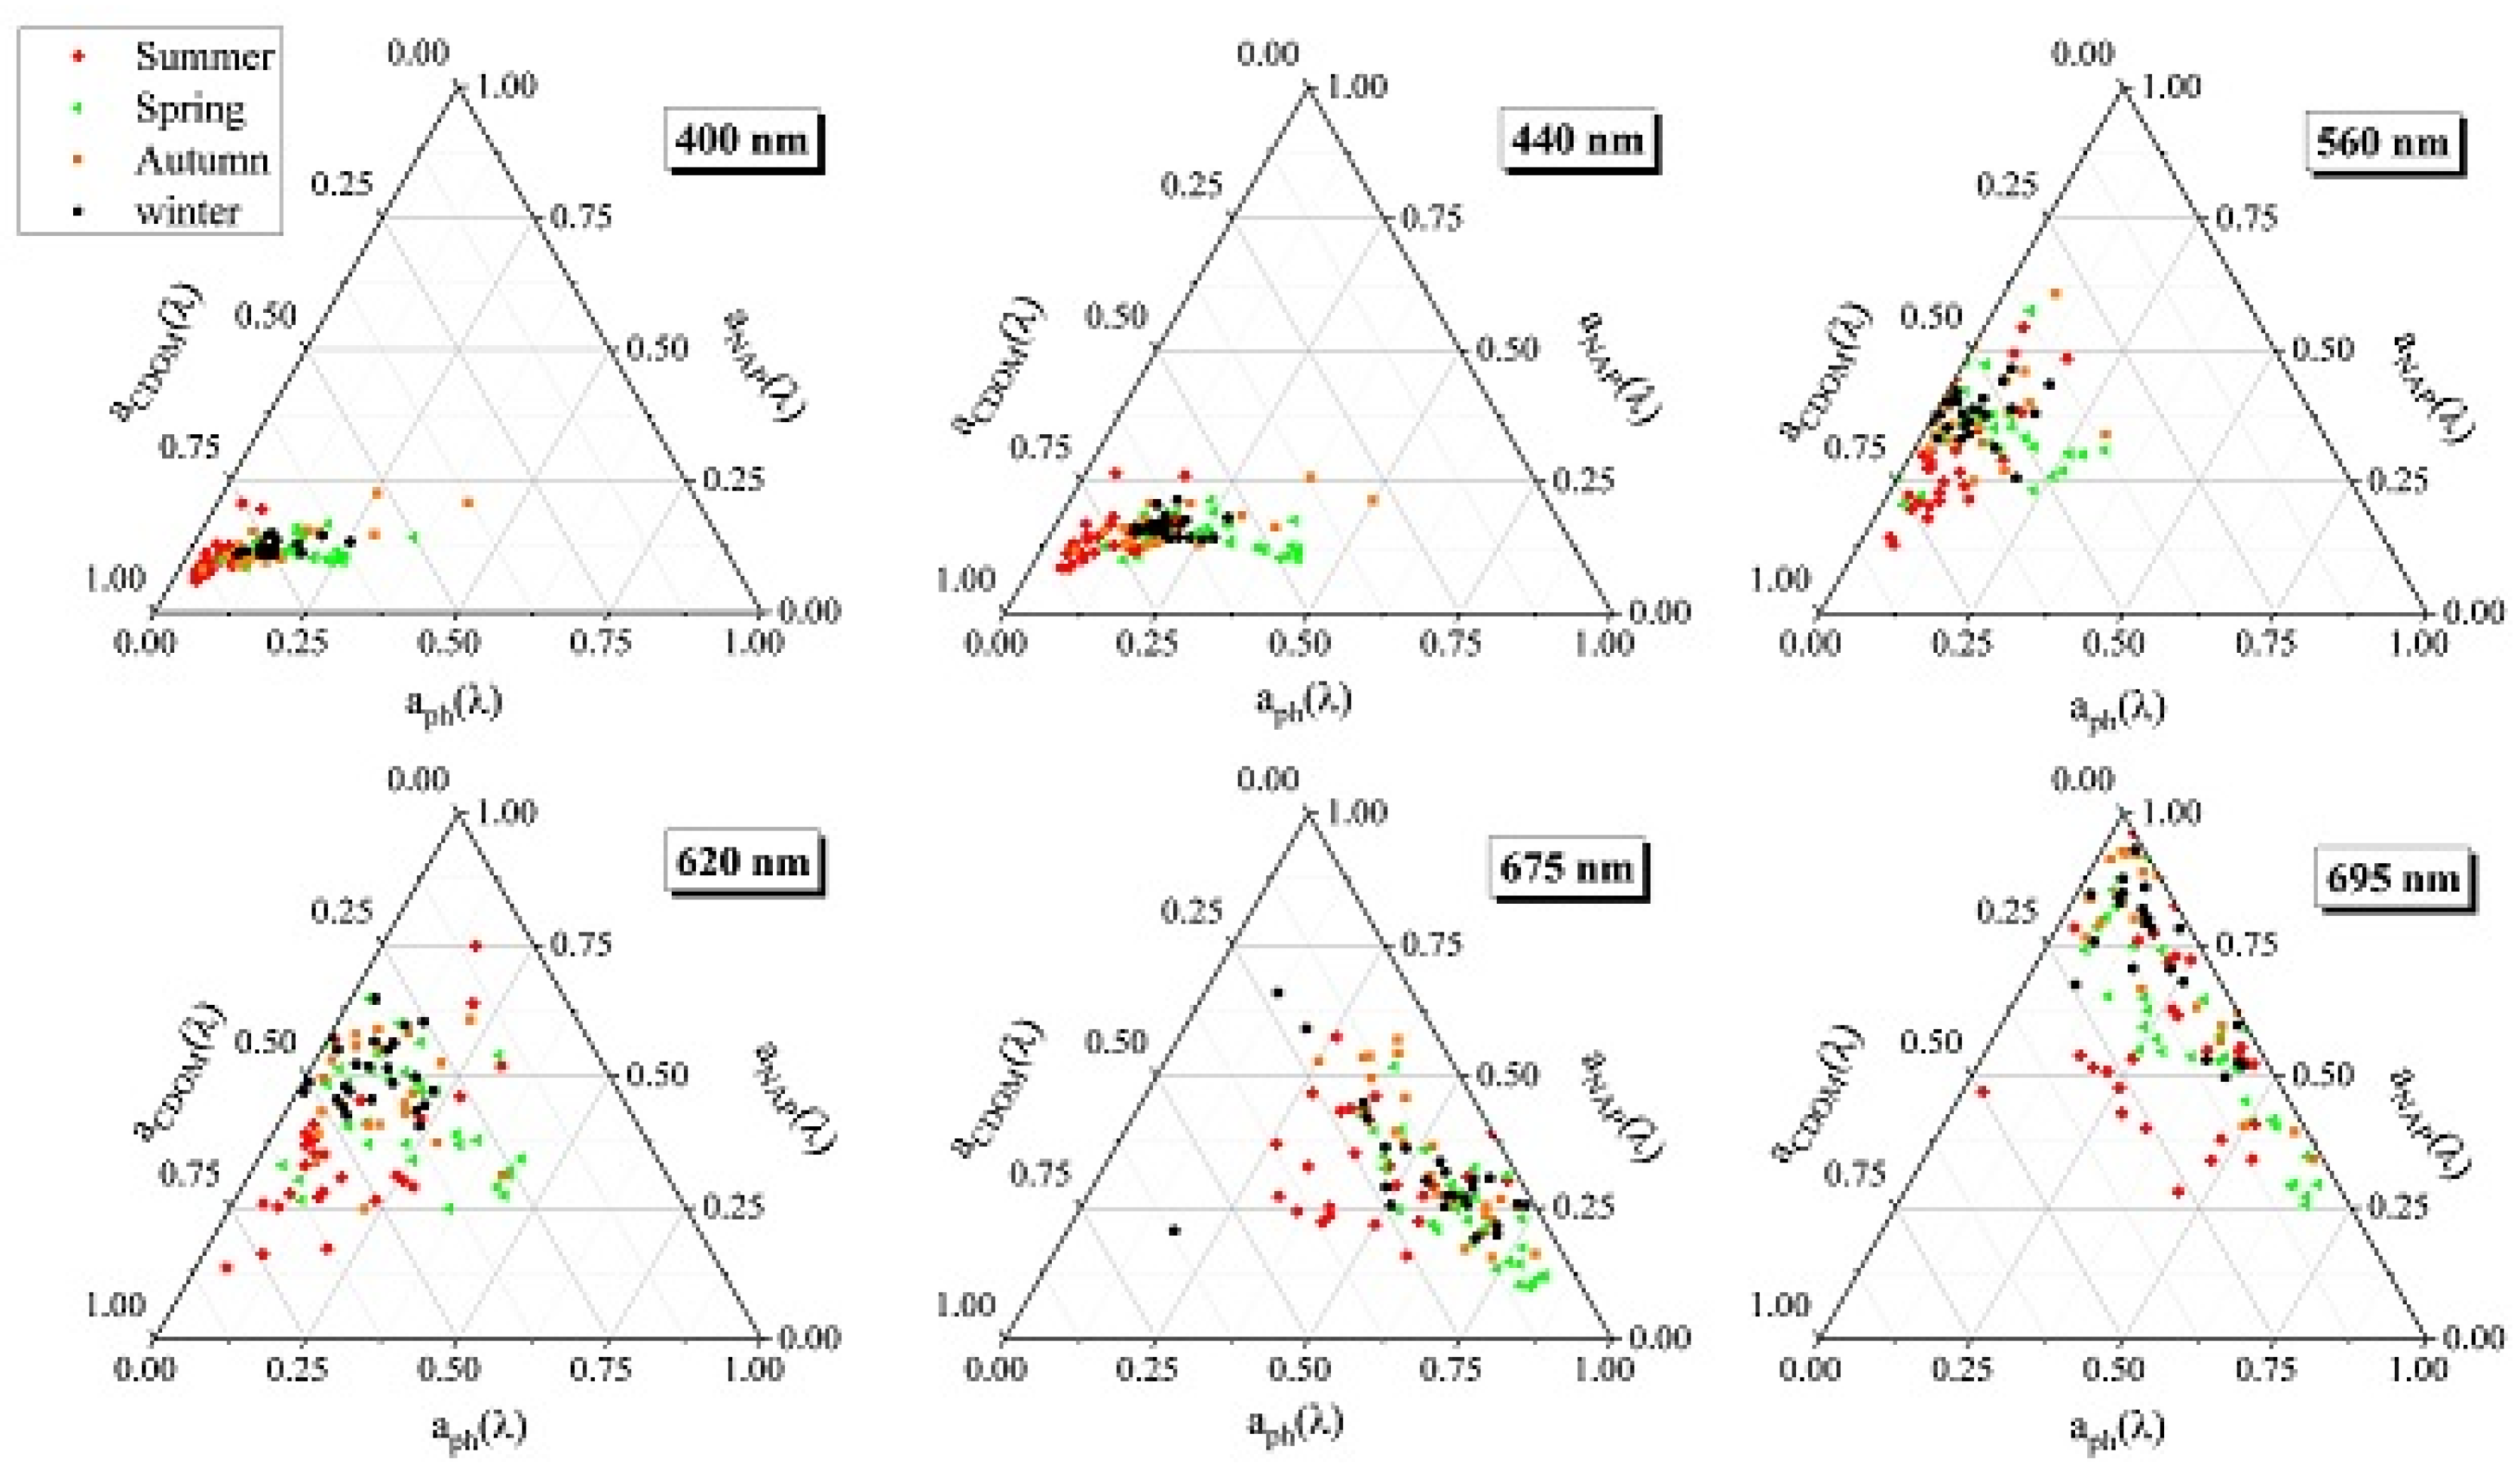
3.4.1. Relative Contribution of Different Absorption

The absorption of solar radiation in the water body can be partitioned into different absorbing components according to their relative contributions to the total absorption according to Equation (1). Therefore, the contributions of absorbing components to the total absorption are important for the capabilities of light utilization. In our study, the absorption coefficient of pure water, a w ( λ ) reported by Pope and Fry (1997) [56] was used. The percentage in contribution of an individual component to the total absorption average for all sites in the four seasons is shown in Figure 15. Overall, pure water generally contributed most to the total absorption at wavelengths larger than 550 nm (due to the strong absorption in red and near-infrared ranges), and its relative contribution increased rapidly for wavelengths larger than 500 nm due to the low concentration of OACs in Lake Qiandaohu. CDOM contributed most to the total absorption at wavelengths smaller than 550 nm, and phytoplankton had a maximum contribution to absorption from 650 to 700 nm (due to the strong absorption by Chl-a around 675 nm). Therefore, we can say that these components dominated the contribution to the total absorption with different ranges of wavelength in Lake Qiandaohu. However, there were some different characteristics among each panel in Figure 15: (1) particle absorption contributed almost the same as CDOM to the total absorption in autumn; (2) phytoplankton absorption dominated particle absorption in spring, mainly due to the growth of phytoplankton or regional spring bloom in Lake Qiandaohu during that period; and (3) NAP contributed most to particle absorption in summer because it is the rainy season in Lake Qiandaohu, thus there were increased NAP inputs from the outer source.

3.4.2. Absorption Budget

Figure 15 presents the relative amount that each component contributes to the total absorption over 400–700 nm wavelength band. However, we wish to explore the interaction of important components in different characteristic wavelength for the water body. Thirty years ago, Prieur and Sathyendranath (1981) [10] described an absorption budget using a statistical analysis of reflectance and K d , in which the absorption coefficient was partitioned into three components associated with phytoplankton, NAP and CDOM. They introduced the concept of a triangular classification of natural waters based on this budget. For Case-I samples, Prieur and Sathyendranath (1981) [10] found that phytoplankton absorption dominated the sum of a p ( λ ) , a N A P ( λ ) and a C D O M ( λ ) in the ternary diagram at 440 nm, and therefore most samples were systematically situated close to the phytoplankton apex of the ternary diagram. However, for Case-II waters, the absorption of samples were distributed more broadly across the ternary diagram because the relative proportions of the three absorptive components varied more widely in these waters.
Figure 16 illustrates the absorption budget derived from our data as a set of ternary plots at six different wavelengths, of 400, 440, 560, 620, 675, and 695 nm. Overall, our data show that the relative contributions to absorption had a centralized distribution at specific wavelength in the diagram. Particularly, at 400, 440 nm, most samples were located near the CDOM apex with values within the range (0.75 < a C D O M % < 1, 0 < a p h % < 0.375, 0 < a N A P % < 0.25) in the ternary plot, since absorption by CDOM dominated the three components in these wavelengths as expected. However, at 560 and 620 nm, there was a relatively dispersed distribution in these samples and the contribution from NAP had an obvious increase compared to the results at wavelengths shorter than 560 nm. At 675 nm, phytoplankton had a maximum contribution among the three components, as expected, due to the strong Chl-a absorption peak. It is worth noting that the contribution of NAP absorption reaches its highest level at 695 nm, which indicates that the absorption in the red to NIR by NAP is not negligible. The seasonal variation in the absorption budget had slight but perceptible trend. For phytoplankton, the absorption levels in spring were generally larger than those during the other seasons.
Our results show that use of ternary plots to display sampling data provides a useful approach to optically characterize natural waters optically. However, due to the co-variability of phytoplankton, NAP and CDOM, the partitioning of the absorption coefficient varied within a restricted range. The changes of distribution at a specific wavelength in the ternary plot reveal interesting, but largely expected, patterns. Thus, through the absorption budget, we can identify specific parts of the visible spectrum where any one of the three components may dominate the absorption of a p h ( λ ) + a N A P ( λ ) + a C D O M ( λ ) .

4. Conclusions

This study is the first attempt to investigate absorption properties of CDOM and particulates in Lake Qiandaohu providing a good insight into the natural variability of the coefficients required for the parameterization of the bio-optical models and the subsequent remote sensing algorithms for water bodies of this type. Our results showed that the CDOM absorption of Lake Qiandaohu in blue wavelength band is much lower than that in shallow lakes, such as Lake Taihu. Meanwhile, CDOM absorption is significantly higher in summer than in other seasons, which gives some evidence of allochthonous production of CDOM during this season. The slope of the exponential function fitting the CDOM absorption, S C D O M shows relatively small variability for the entire datasets sampled in different seasons. Although the observed NAP absorption showed some variability, such as a slight increase of NAP absorption in summer and autumn, which can be attributed to the fact that allochthonous particles have a relatively greater impact on optical properties during these two seasons. Phytoplankton had an obvious seasonal cycle, with an especially marked increase in phytoplankton absorption in spring, simultaneously resulting in an increase in contribution of phytoplankton absorption to the total particle absorption. Unlike the more typical eutrophic Lake Taihu in China, where sediment resuspension and algal blooms cause dramatic seasonal variation in particles and CDOM absorption [57], the proportions of the three kinds of OACs in Lake Qiandaohu were relatively stable and did not change dramatically over the seasons. Our study also gave an insight into the spatial differences in the summer in the optical characteristics, with the results indicating that optical properties are primarily influenced by allochthonous matters introduced into the lake from the northwestern and southwestern areas which are the two regions with significant surface runoff inlets and vulnerability to human activity. Moreover, vertical variability in the optical properties were detected from different seasons, which gives some evidence that optical properties of water column is vertically inhomogeneous with the fact that the vertical inhomogeneity in winter is less obvious than other seasons in the certain regions of Lake Qiandaohu.
Future work will attempt to develop regional algorithms for retrieving water quality parameters for Lake Qiandaohu using remote sensing. We also plan to study how the external environment, such as soil erosion and human activity in the upper reaches of the watershed, affects the water environment with Lake Qiandaohu.

Acknowledgments

This study is supported by the National Key Research and Development Program of China (2016YFC1400901), the High Resolution Earth Observation Systems of National Science and Technology Major Projects (41-Y20A31-9003-15/17), the Scientific Research Fund of the Second Institute of Oceanography, SOA (QNYC201602), and the National Science Foundation of China (41476156 and 41621064). We are grateful to ZuoMing Yu and Li Ma for critical assistance with field sample collection. We thank the staff of the Second institute of Oceanography for their analytical support in Laboratory. We also thank Zuojun Yu for constructive comments on the manuscript.

Author Contributions

Liangliang Shi and Zhihua Mao conceived the original outline for this study, and Yiwei Zhang and Zheng Wang designed the methodology. Liangliang Shi were responsible for the data processing and result analysis. Mingliang Liu helped perform the analysis with constructive discussions. All authors read and approved the final manuscript.

Conflicts of Interest

The authors declare no conflict of interest.

References

  1. Kirk, J.T.O. Light and Photosynthesis in Aquatic Ecosystems; Cambridge University Press: Cambridge, UK, 1994; ISSN 0025-3154. [Google Scholar]
  2. Sosik, H.M.; Mitchell, B.G. Light absorption by phytoplankton, photosynthetic pigments and detritus in the California Current System. Deep. Res. Part I 1995, 42, 1717–1748. [Google Scholar] [CrossRef]
  3. Laurion, I.; Ventura, M.; Catalan, J.; Psenner, R.; Sommaruga, R. Attenuation of ultraviolet radiation in mountain lakes: Factors controlling the among and within-lake variability. Limnol. Oceanogr. 2000, 45, 1274–1288. [Google Scholar] [CrossRef]
  4. Oliver, M.J.; Schofield, O.; Bergmann, T.; Glenn, S.; Orrico, C.; Moline, M. Deriving in situ phytoplankton absorption for bio-optical productivity models in turbid waters. J. Geophys. Res. C Ocean. 2004, 109. [Google Scholar] [CrossRef]
  5. Brando, V.E.; Dekker, A.G. Satellite hyperspectral remote sensing for estimating estuarine and coastal water quality. IEEE Trans. Geosci. Remote Sens. 2003, 41, 1378–1387. [Google Scholar] [CrossRef]
  6. Tilstone, G.H.; Smyth, T.J.; Gowen, R.J.; Martinez-Vicente, V.; Groom, S.B. Inherent optical properties of the Irish Sea and their effect on satellite primary production algorithms. J. Plankton Res. 2005, 27, 1127–1148. [Google Scholar] [CrossRef]
  7. Simis, S.G.; Ruiz-Verdú, A.; Domínguez-Gómez, J.A.; Peña-Martinez, R.; Peters, S.W.; Gons, H.J. Influence of phytoplankton pigment composition on remote sensing of cyanobacterial biomass. Remote Sens. Environ. 2007, 106, 414–427. [Google Scholar] [CrossRef]
  8. Xi, H.; Larouche, P.; Tang, S.; Michel, C. Seasonal variability of light absorption properties and water optical constituents in Hudson Bay, Canada. J. Geophys. Res. Oceans 2013, 118, 3087–3102. [Google Scholar] [CrossRef]
  9. Smith, R.C.; Baker, K.S. Optical properties of the clearest natural waters (200–800 nm). Appl. Opt. 1981, 20, 177–184. [Google Scholar] [CrossRef] [PubMed]
  10. Prieur, L.; Sathyendranath, S. An optical classification of coastal and oceanic waters based on the specific spectral absorption curves of phytoplankton pigments, dissolved organic matter, and other particulate materials. Limnol. Oceanogr. 1981, 26, 671–689. [Google Scholar] [CrossRef]
  11. Roesler, C.S.; Perry, M.J.; Carder, K.L. Modeling in situ phytoplankton absorption from total absorption spectra in productive inland marine waters. Limnol. Oceanogr. 1989, 34, 1510–1523. [Google Scholar] [CrossRef]
  12. Duntley, S.Q.; Austin, R.W.; Wilson, W.H.; Edgerton, C.F.; Moran, S.E. Ocean Color Analysis; No. SIO-Ref-74-10; Visibility Laboratory, Scripps Institution of Oceanography, University of California: San Diego, CA, USA, 1974. [Google Scholar]
  13. Morel, A. Optical properties of pure water and pure sea water. Opt. Asp. Oceanogr. 1974, 1, 1–24. [Google Scholar]
  14. Morel, A.; Prieur, L. Analysis of variations in ocean color. Limnol. Oceanogr. 1977, 22, 709–722. [Google Scholar] [CrossRef]
  15. Babin, M.; Stramski, D.; Ferrari, G.M.; Claustre, H.; Bricaud, A.; Obolensky, G.; Hoepffner, N. Variations in the light absorption coefficients of phytoplankton, nonalgal particles, and dissolved organic matter in coastal waters around Europe. J. Geophys. Res. Oceans 2003, 108. [Google Scholar] [CrossRef]
  16. Binding, C.E.; Jerome, J.H.; Bukata, R.P.; Booty, W.G. Spectral absorption properties of dissolved and particulate matter in Lake Erie. Remote Sens. Environ. 2008, 112, 1702–1711. [Google Scholar] [CrossRef]
  17. Bricaud, A.; Morel, A.; Prieur, L. Absorption by dissolved organic matter of the sea (yellow substance) in the UV and visible domains. Limnol. Oceanogr. 1981, 26, 43–53. [Google Scholar] [CrossRef]
  18. Smith, R.C.; Eppley, R.W.; Baker, K.S. Correlation of primary production as measured aboard ship in southern California coastal waters and as estimated from satellite chlorophyll images. Mar. Biol. 1982, 66, 281–288. [Google Scholar] [CrossRef]
  19. Platt, T.; Herman, A.W. Remote sensing of phytoplankton in the sea: Surface-layer chlorophyll as an estimate of water-column chlorophyll and primary production. Int. J. Remote Sens. 1983, 4, 343–351. [Google Scholar] [CrossRef]
  20. Platt, T.; Sathyendranath, S. Oceanic primary production: Estimation by remote sensing at local and regional scales. Science 1988, 241, 1613–1620. [Google Scholar] [CrossRef] [PubMed]
  21. Morel, A. Light and marine photosynthesis: A spectral model with geochemical and climatological implications. Prog. Oceanogr. 1991, 26, 263–306. [Google Scholar] [CrossRef]
  22. Antoine, D.; André, J.M.; Morel, A. Oceanic primary production: 2. Estimation at global scale from satellite (coastal zone color scanner) chlorophyll. Glob. Biochem. Cycles 1996, 10, 57–69. [Google Scholar] [CrossRef]
  23. Kameda, T. Studies on oceanic primary production using ocean color remote sensing data. Bull. Fish. Res. Agen. 2003, 9, 118–148. [Google Scholar]
  24. Carr, M.E.; Friedrichs, M.A.; Schmeltz, M.; Aita, M.N.; Antoine, D.; Arrigo, K.R.; Bidigare, R. A comparison of global estimates of marine primary production from ocean color. Deep Sea Res. Part II Top. Stud. Oceanogr. 2006, 53, 741–770. [Google Scholar] [CrossRef]
  25. Uitz, J.; Claustre, H.; Gentili, B.; Stramski, D. Phytoplankton class-specific primary production in the world’s oceans: Seasonal and interannual variability from satellite observations. Glob. Biogeochem. Cycles 2010, 24. [Google Scholar] [CrossRef]
  26. Morel, A. Optical modeling of the upper ocean in relation to its biogenous matter content (Case I waters). J. Geophys. Res. 1988, 93, 10749–10768. [Google Scholar] [CrossRef]
  27. Mitchell, B.G.; Kahru, M.; Wieland, J.; Stramska, M.; Mueller, J.L. Determination of spectral absorption coefficients of particles, dissolved material and phytoplankton for discrete water samples. In Ocean Optics Protocols for Satellite Ocean Color Sensor Validation; National Aeronautical and Space administration: Greenbelt, MD, USA, 2002; pp. 231–257. [Google Scholar]
  28. Bricaud, A.; Babin, M.; Morel, A.; Claustre, H. Variability in the chlorophyll-specific absorption coefficients of natural phytoplankton: Analysis and parameterization. J. Geophys. Res. Oceans 1995, 100, 13321–13332. [Google Scholar] [CrossRef]
  29. Bricaud, A.; Morel, A.; Babin, M.; Allali, K.; Claustre, H. Variations of light absorption by suspended particles with chlorophyll a concentration in oceanic (case 1) waters—Analysis and implications for bio-optical models. J. Geophys. Res. Oceans 1998, 103, 31033–31044. [Google Scholar] [CrossRef]
  30. Cleveland, J.S. Regional models for phytoplankton absorption as a function of chlorophyll a concentration. J. Geophys. Res. Oceans 1995, 100, 13333–13344. [Google Scholar] [CrossRef]
  31. Gordon, H.R.; Brown, O.B.; Evans, R.H.; Brown, J.W.; Smith, R.C.; Baker, K.S.; Clark, D.K. A semianalytic radiance model of ocean color. J. Geophys. Res. Atmos. 1988, 93, 10909–10924. [Google Scholar] [CrossRef]
  32. Morel, A.; Maritorena, S. Bio-optical properties of oceanic waters—A reappraisal. J. Geophys. Res. 2001, 106, 7163–7180. [Google Scholar] [CrossRef]
  33. Matsuoka, A.; Hill, V.; Huot, Y.; Babin, M.; Bricaud, A. Seasonal variability in the light absorption properties of western Arctic waters: Parameterization of the individual components of absorption for ocean color applications. J. Geophys. Res. Oceans 2011, 116. [Google Scholar] [CrossRef]
  34. Simis, S.G.; Peters, S.W.; Gons, H.J. Remote sensing of the cyanobacterial pigment phycocyanin in turbid inland water. Limnol. Oceanogr. 2005, 50, 237–245. [Google Scholar] [CrossRef]
  35. Xu, J.; Li, F.; Zhang, B.; Song, K.; Wang, Z.; Liu, D.; Zhang, G. Estimation of chlorophyll-a concentration using field spectral data: A case study in inland Case-II waters, North China. Environ. Monit. Assess. 2009, 158, 105–116. [Google Scholar] [CrossRef] [PubMed]
  36. Stramski, D.; Woźniak, S.B.; Flatau, P.J. Optical properties of Asian mineral dust suspended in seawater. Limnol. Oceanogr. 2004, 49, 749–755. [Google Scholar] [CrossRef]
  37. Bowers, D.G.; Binding, C.E. The optical properties of mineral suspended particles: A review and synthesis. Estuar. Coast. Shelf Sci. 2006, 67, 219–230. [Google Scholar] [CrossRef]
  38. Astoreca, R.; Doxaran, D.; Ruddick, K.; Rousseau, V.; Lancelot, C. Influence of suspended particle concentration, composition and size on the variability of inherent optical properties of the Southern North Sea. Cont. Shelf Res. 2012, 35, 117–128. [Google Scholar] [CrossRef]
  39. Twardowski, M.S.; Donaghay, P.L. Photobleaching of aquatic dissolved materials: Absorption removal, spectral alteration, and their interrelationship. J. Geophys. Res. Oceans 2002, 107. [Google Scholar] [CrossRef]
  40. Shank, G.C.; Zepp, R.G.; Whitehead, R.F.; Moran, M.A. Variations in the spectral properties of freshwater and estuarine CDOM caused by partitioning onto river and estuarine sediments. Estuar. Coast. Shelf Sci. 2005, 65, 289–301. [Google Scholar] [CrossRef]
  41. Matsuoka, A.; Hooker, S.B.; Bricaud, A.; Gentili, B.; Babin, M. Estimating absorption coefficients of colored dissolved organic matter (CDOM) using a semi-analytical algorithm for southern Beaufort Sea waters: Application to deriving concentrations of dissolved organic carbon from space. Biogeosciences 2013, 10, 917–927. [Google Scholar] [CrossRef]
  42. Gu, Q.; Zhang, Y.; Ma, L.; Li, J.; Wang, K.; Zheng, K.; Sheng, L. Assessment of reservoir water quality using multivariate statistical techniques: A case study of Lake Qiandaohu, China. Sustainability 2016, 8, 243. [Google Scholar] [CrossRef]
  43. Mueller, J.L.; Austin, R.W. Ocean optics protocols for SeaWiFS validation, revision 1. Oceanogr. Lit. Rev. 1995, 9, 805. [Google Scholar]
  44. Kishino, M.; Takahashi, M.; Okami, N.; Ichimura, S. Estimation of the spectral absorption coefficients of phytoplankton in the sea. Bull. Mar. Sci 1985, 37, 634–642. [Google Scholar]
  45. Tassan, S.; Ferrari, G.M. An alternative approach to absorption measurements of aquatic particles retained on filters. Limnol. Oceanogr. 1995, 40, 1358–1368. [Google Scholar] [CrossRef]
  46. Roesler, C.S. Theoretical and experimental approaches to improve the accuracy of particulate absorption coefficients derived from the quantitative filter technique. Limnol. Oceanogr. 1998, 43, 1649–1660. [Google Scholar] [CrossRef]
  47. Zhang, Y.; Zhang, B.; Wang, X.; Li, J.; Feng, S.; Zhao, Q.; Qin, B. A study of absorption characteristics of chromophoric dissolved organic matter and particles in Lake Taihu, China. Hydrobiologia 2007, 592, 105–120. [Google Scholar] [CrossRef]
  48. Zhang, Y.; Feng, L.; Li, J.; Luo, L.; Yin, Y.; Liu, M.; Li, Y. Seasonal-spatial variation and remote sensing of phytoplankton absorption in Lake Taihu, a large eutrophic and shallow lake in China. J. Plankton Res. 2010, 32, 1023–1037. [Google Scholar] [CrossRef]
  49. Dong, C.Y.; Yu, Z.M.; Wu, Z.X.; Wu, C.J. Study on seasonal characteristics of thermal stratification in lacustrine zone of Lake Qiandao. Environ. Sci. 2013, 34, 2574–2581. [Google Scholar] [PubMed]
  50. Zhang, Y.; Wu, Z.; Liu, M.; He, J.; Shi, K.; Wang, M.; Yu, Z. Thermal structure and response to long-term climatic changes in Lake Qiandaohu, a deep subtropical reservoir in China. Limnol. Oceanogr. 2014, 59, 1193–1202. [Google Scholar] [CrossRef]
  51. Wen, J.; Luo, D.Q.; Luo, X.B.; Tang, D.J.; Chen, S.P. Agriculture non-point source pollution and control measures of Qiandao Lake area. J. Soil Water Conserv. 2004, 18, 126–129. [Google Scholar]
  52. Ma, R.; Tang, J.; Dai, J.; Zhang, Y.; Song, Q. Absorption and scattering properties of water body in Taihu Lake, China: Absorption. Int. J. Remote Sens. 2006, 27, 4277–4304. [Google Scholar] [CrossRef]
  53. Carder, K.L.; Steward, R.G.; Harvey, G.R.; Ortner, P.B. Marine humic and fulvic acids: Their effects on remote sensing of ocean chlorophyll. Limnol. Oceanogr. 1989, 34, 68–81. [Google Scholar] [CrossRef]
  54. Zepp, R.G.; Schlotzhauer, P.F. Comparison of photochemical behavior of various humic substances in water: III. Spectroscopic properties of humic substances. Chemosphere 1981, 10, 479–486. [Google Scholar] [CrossRef]
  55. Hoejerslev, N.K.; Aas, E. Spectral light absorption by yellow substance (CDOM or “Gelbstoff”) in the Kattegat-Skagerrak (Denmark) area. Oceanologia 2001, 43, 39–60. [Google Scholar]
  56. Pope, R.M.; Fry, E.S. Absorption spectrum (380–700 nm) of pure water II Integrating cavity measurements. Appl. Opt. 1997, 36, 8710. [Google Scholar] [CrossRef] [PubMed]
  57. Zhang, Y.; Yin, Y.; Wang, M.; Liu, X. Effect of phytoplankton community composition and cell size on absorption properties in eutrophic shallow lakes: Field and experimental evidence. Opt. Express 2012, 20, 11882–11898. [Google Scholar] [CrossRef] [PubMed]
Figure 1. Map of Lake Qiandaohu and the locations of the seasonal sampling sites.
Water 09 00352 g001
Figure 2. Total particle spectral absorption coefficients, a p ( λ ) versus season.
Water 09 00352 g002
Figure 3. Three typical total particle absorption spectra in Lake Qiandaohu, demonstrating corresponding absorption characteristics for NAP and phytoplankton. (a) Phytoplankton are the dominant; (b) Neither phytoplankton nor NAP are the dominant (c) NAP are the dominant.
Water 09 00352 g003
Figure 4. (AE) Total particle absorption spectra in different regions of the summer season in Lake Qiandaohu; and (F) the average total particle absorption spectra from each area.
Water 09 00352 g004
Figure 5. Seasonal variability of the total particle absorption spectra at different depths for sampling sites JK, XJS and DB in Lake Qiandaohu (see Figure 1).
Water 09 00352 g005
Figure 6. Seasonal variation of the CDOM absorption spectra. The different colored lines in each panel represent different sampling sites.
Water 09 00352 g006
Figure 7. (a) Average CDOM absorption spectra of each season in Lake Qiandaohu and (b) frequency distribution of the slopes, S C D O M , of CDOM absorption spectra. The Gaussian curve is superimposed to illustrate the normal distribution corresponding to the average value of S C D O M (0.0164 nm−1), with standard deviation (0.00176 nm−1).
Water 09 00352 g007
Figure 8. (AE) CDOM absorption spectra in the different areas of the summer season in Lake Qiandaohu; and (F) the average CDOM absorption spectra for each area.
Water 09 00352 g008
Figure 9. Scatterplot of a C D O M ( 440 ) against S C D O M in different seasons.
Water 09 00352 g009
Figure 10. Scatterplot of a p h ( 440 ) against a C D O M ( 440 ) and the corresponding least-squares fitted line in different seasons.
Water 09 00352 g010
Figure 11. Phytoplankton absorption spectra in Lake Qiandaohu for each season. The curves with different colors in each panel represent different sampling sites.
Water 09 00352 g011
Figure 12. Correlations between a p h ( 440 ) and Chl-a concentration (ad); and between a p h ( 675 ) and Chl-a concentration (eh) for each season.
Water 09 00352 g012
Figure 13. NAP absorption spectra in each season. The curves with different colors in each panel represent the different sampling sites.
Water 09 00352 g013
Figure 14. (AE) NAP absorption spectra in different regions of the summer season in Lake Qiandaohu; and (F) the average NAP absorption spectra of each area.
Water 09 00352 g014
Figure 15. Fractional contribution of absorption coefficients of pure water [ a w ( λ ) ], CDOM [ a C D O M ( λ ) ], total particles [ a p ( λ ) ], phytoplankton [ a p h ( λ ) ], and NAP [ a N A P ( λ ) ] to the total absorption [ a t ( λ ) ] in the four seasons.
Water 09 00352 g015
Figure 16. Ternary plots for all samples used in this study at specific wavelengths showing the relative contributions of phytoplankton, NAP and CDOM. The relative proportion of a given absorption component x (scaled in 0 and 1) for a given sample is calculated as x/(x + y + z) where y and z are the two other components. The plot is triangular in shape because the three components are constrained to sum to 1.
Water 09 00352 g016
Table 1. The multiple depths of JK, XJS, and DB sampled in each season of Lake Qiandaohu.
SitesDepth (m)
SpringSummerAutumnWinter
JK0, 5, 10, 200, 5, 10, 20, 250, 5, 10, 20, 250, 5, 10, 25
XJS0, 5, 10, 20, 30, 400, 5, 10, 20, 30, 400, 5, 10, 20, 30, 400, 5, 10, 20, 30, 40
DB0, 5, 10, 20, 30, 40, 50, 700, 5, 10, 20, 30, 40, 50, 700, 5, 10, 20, 30, 40, 50, 700, 5, 10, 20, 30, 40, 50, 70
Table 2. The population parameter values measured in Lake Qiandaohu for all seasons.
ParametersChl-a (ug/L)TP (mg/L)TN (mg/L)SD (m)
Mean4.010.0251.0424.7
Min0.370.0120.8513.7
Max19.620.0441.2556.0
Table 3. Seasonal variation of a p ( 440 ) at sampling sites JK, XJS and DB.
Sampling Sitesap(440) (m−1)
ParametersSpringSummerAutumnWinter
JKmean0.1590.1210.2190.149
sd0.0960.0340.0480.026
XJSmean0.1800.1450.1210.107
sd0.0590.0330.0380.027
DBmean0.1800.1000.0710.092
sd0.0590.0380.0180.014
Table 4. Range and spectra variation of a N A P ( 440 ) in all seasons.
ParametersSpringSummerAutumnWinter
Min0.0340.0300.0350.038
Max0.0520.1420.1330.057
Mean0.0430.0580.0600.045
Sd0.0040.0270.0300.007

