
Soil Water and Phreatic Evaporation in Shallow Groundwater during a Freeze–Thaw Period


1
College of Water Resources and Engineering, Taiyuan University of Technology, Taiyuan 030024, China
2
The First Hydrogeology and Engineering Geology Team of Shanxi Province, Taiyuan 030024, China
3
Department of Earth Sciences, University of the Western Cape, Private Bag X17, Bellville, Cape Town 7535, South Africa
4
Taigu Water Balance Experimental Field, Bureau of Hydrology and Water Resources Survey of Shanxi Province, Taigu 030800, China
*
Author to whom correspondence should be addressed.
Water 2017, 9(6), 396; https://doi.org/10.3390/w9060396
Submission received: 12 March 2017
/
Revised: 8 May 2017
/
Accepted: 26 May 2017
/
Published: 2 June 2017
Abstract
:The exchange between shallow groundwater and soil water is unusually strong during freeze-thaw periods. The purpose of this study is to determine the effect of four different groundwater table depths (GTDs) and two soil textures on soil water moisture migration and phreatic evaporation during a freeze-thaw period using lysimeters. The results show that a high-moisture zone (HMZ) formed at a depth of 25–35 cm for sandy loam with a soil moisture content of 52%, while no obvious HMZ formed for fine sand when the GTD was 0.5 m. When the GTD was 2.0 m, a HMZ formed at a depth of 50–70 cm for sandy loam at the highest soil moisture content of 22%, while a HMZ formed at a depth of 60–80 cm for fine sand with a soil moisture content of 10%. The cumulative phreatic evaporation increased by a power function on freezing days during the freezing period. The total phreatic evaporation for sandy loam declined linearly with the increasing of GTD, and with the largest evaporation value of 73.6 mm for fine sand when the GTD was 1.0 m during the freeze-thaw period. The research would be significant for water resource assessment, the conversion of farmland water, and the prevention of saline land.
1. Introduction
The exchange between the vadow zone and shallow groundwater is an important process in a water cycle. In particular, phreatic evaporation is the major form of groundwater consumption. It is one of the main water sources of regional evapotranspiration in shallow groundwater areas [1], which can result in soil salinization [2,3,4], and can also affect the accuracy of water resource evaluation [5]. Groundwater behavior in permafrost dominated regimes is an understudied topic that will become increasingly important as permafrost is an effective barrier to recharge [6]. Due to the dynamic change of soil water and groundwater, the exchange between soil water and groundwater is bidirectional, that is, downward percolation of soil water recharges the groundwater. Alternately, upward migration from the groundwater, termed Phreatic Evaporation, recharges soil water where it may be more readily consumed by evaporation. For many years, many investigators in soil physics, hydrogeology, irrigation and drainage, and surface water and water source science have conducted a great deal of research on the mechanisms and laws of phreatic evaporation. The research methods are mainly field observations [7,8,9,10,11], theoretical analysis [12,13,14,15], and numerical simulation [16]. Due to the complexity of the soil water movement process, the theoretical analyses are conducted mostly for stable evaporation conditions. The concerns and scopes of application about phreatic evaporation are expanding constantly, and the relevant studies have made new progress; however, the research carried out has mainly focused on unfrozen soil. Generally, the factors which influence groundwater recharge for soil water are surface soil evaporation, plant transpiration [17], and meteorological factors [18] in a nonfreezing period. During freezing periods, the soil freezing and temperature gradients can result in phreatic evaporation and a higher soil water content.
Soil moisture availability is a crop development constraint [19,20,21,22], and soil moisture dynamics influence groundwater evaporation [23,24]. The investigation of soil moisture migration is difficult because of the complex nature of the transport of water and heat during the freeze-thaw period [25,26]. Many studies have used a variety of models to simulate soil water migration during the soil freeze-thaw process [27,28,29,30,31]. Some researchers have tried to take advantage of migrated water during the seasonal freeze/thaw to improve the spring soil moisture content of farmland [32], and to increase the survival rate or productivity of plantations. However, little attention has been paid to the transfer of soil water as part of the freeze-thaw process.
Musa et al. [33] determined the characteristics of soil water migration in dunes and interdune areas, and discussed its potential application through investigating the moisture content of shallow soil during the soil freeze-thaw period. Beldring et al. [34] investigated the spatial variation of soil moisture in an unsaturated zone with shallow groundwater, without considering the effect of freezing and thawing. In shallow groundwater areas, soil moisture in an unsaturated zone is affected by many factors during the process of soil freezing and thawing [35]; the most important factors are soil temperature [36], and GTD [37]. Many scholars have conducted laboratory and field studies on the influence of GTD on soil water migration in a nonfreezing period [38,39]. However, due to the constraints of field experiments, most studies on soil water above shallow groundwater during a freeze-thaw period have been conducted in a laboratory setting [40].
The driving force that makes unfrozen water migrate in frozen soil is the soil-water potential gradient. The soil liquid water gradually phases into ice when soil temperature declines, so that the soil-water potential of the frozen layer decreases [31,41]. So, the unfrozen soil water migrating to upper soil layers, driven by the soil-water potential gradient, results in the continuous inflowing from shallow groundwater to an unsaturated zone. An inadequate understanding of soil moisture in shallow groundwater and phreatic evaporation during a freeze-thaw period promoted this study. The research would be of great significance for water resource assessment, the conversion of farmland water, and the prevention of saline land.
The objective of this study is to: (1) investigate the effect of four different groundwater table depths (0.5, 1.0, 1.5, and 2.0 m) and two different soil textures (sandy loam and fine sand) on soil moisture migration during a freeze-thaw period; (2) reveal the effect of soil freezing on phreatic evaporation and determine the relationship between cumulative phreatic evaporation and freezing days during a freezing period; and (3) investigate the relationship between total phreatic evaporation and GTD during a freeze-thaw period using field-measured data.
2. Test Conditions and Methods
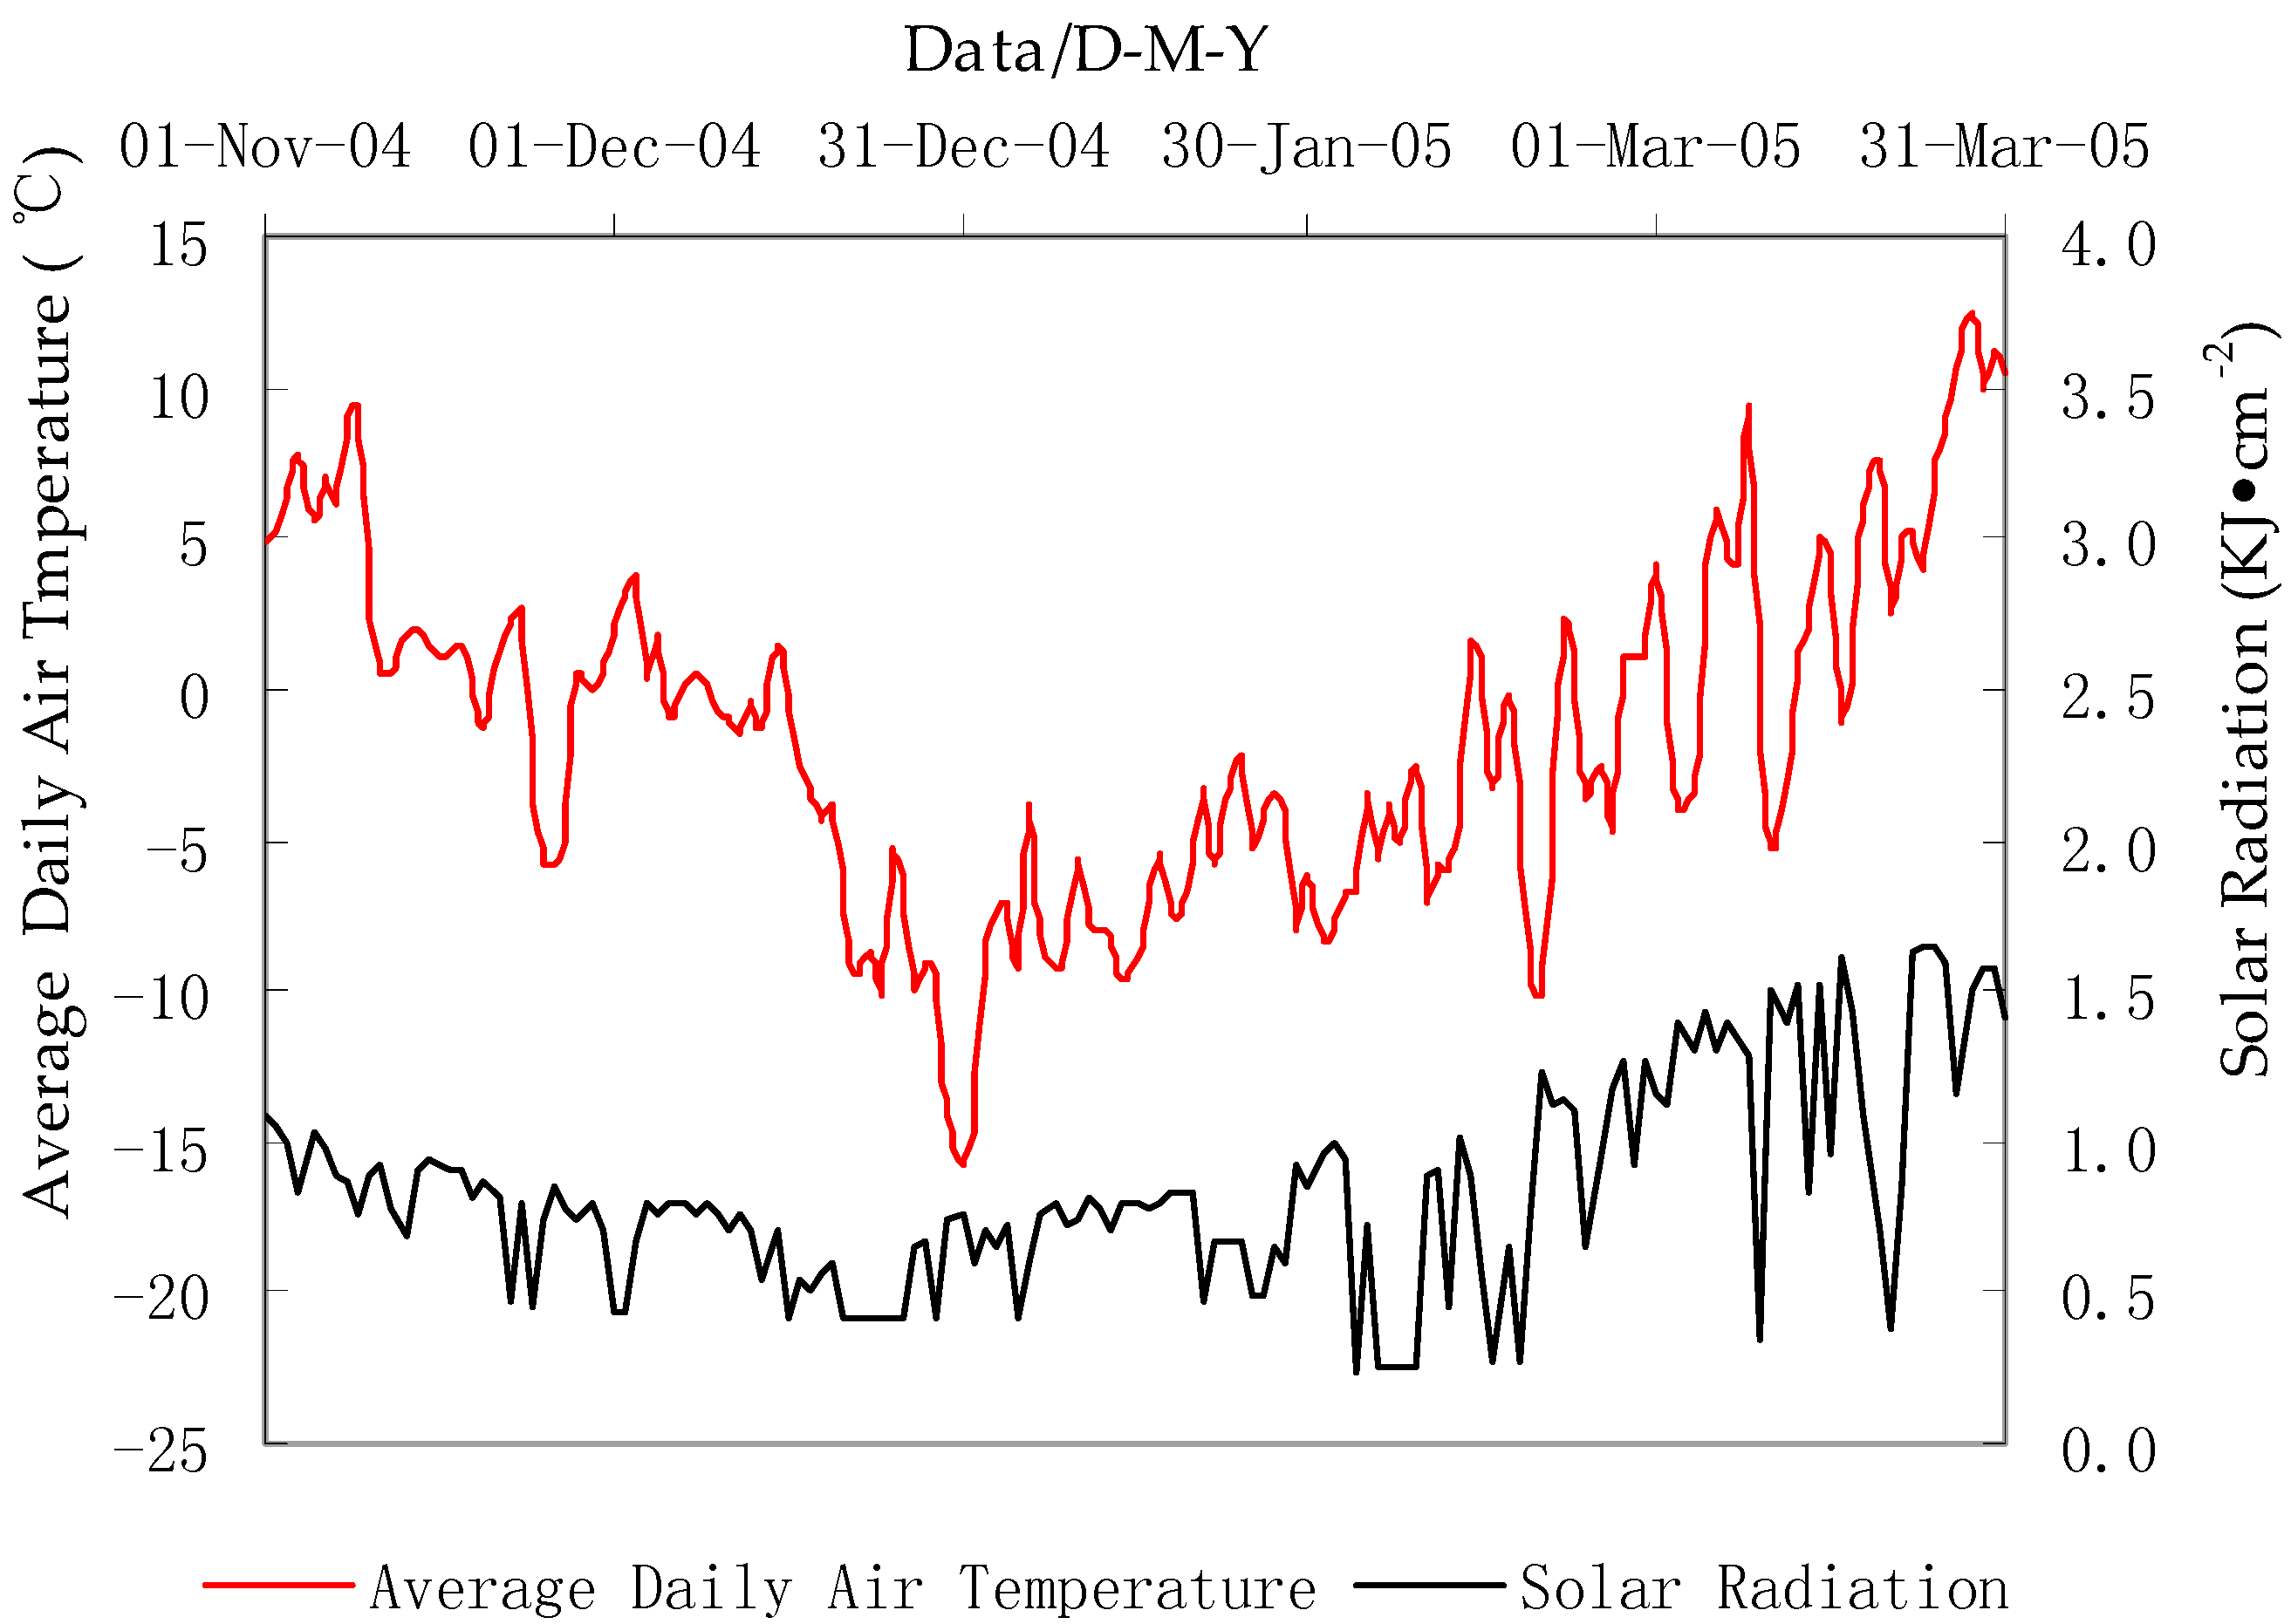
The experiments were conducted at the Taigu Water Balance Experimental Field, which is 60 km away from the south of Taiyuan, Shanxi Province, in China. It is located in the east of the Jinzhong basin at approximately 37°26′ N, 112°30′ E at an altitude of 777 m. The area is characterized by a continental semi-arid climate with GTD of 25.0 m. The climate is characterized by heavy wind and little rain in spring, heavily concentrated rainfall in summer, continuous rain in autumn, and cold with a little snow in winter. The annual average temperature is 9.9 °C. Average annual precipitation is 415 mm, which mainly occurs from June to September, and the annual water surface evaporation potential is 1642 mm. The average relative humidity has been 74% and the average wind speed 0.9 m·s−1 for many years. The annual average frost-free period is about 200 days, and the maximum observed soil frost depth was 92 cm in 1960. During the test period (from November 2004 to March 2005), the total solar radiation was 127.2 kJ·cm−2, and the lowest observed total solar radiation was 18.93 kJ·cm−2 in December. January was the coldest month, with a mean air temperature of −6.8 °C average daily; the minimum air temperature was −15.7 °C on 31 December 2004. The variation of solar radiation and the average daily temperature during the test period are shown in Figure 1.
The test equipment included lysimeters and neutron probes. There were eight lysimeters (Figure 2) with a circle cross-section of 0.5 m2 and installed at intervals of 0.5 m. The soil texture of the unsaturated zone in the lysimeters was sandy loam (four lysimeters with the same texture for four different GTDs) and fine sand (the other four lysimeters with the same texture), which are homogeneous and representative soils of the Jinzhong basin and the Taiyuan basin in China, respectively. The sandy loam has a specific yield of 0.08 m3·m−3 and prosity of 0.53 m3·m−3. The fine sand has a specific yield of 0.12 m3·m−3 and prosity of 0.45 m3·m−3. The physical characteristics of the soils are shown in Table 1.
The GTD within the lysimeters was set at 0.5, 1.0, 1.5, and 2.0 m respectively, and the surface was exposed to the atmospheric conditions during the experiment. The phreatic evaporation was monitored by lysimeters every day through a Mariotte bottle in the underground room. The frozen soils are characterized by the coexistence of liquid water and ice. Many methods have been used for measuring liquid water content, such as time-domain reflecometry (TDR) [42,43] and nuclear magnetic resonance (NMR) [44], as well as ice content, such as dielectric spectroscopy [45] and the heat pulse probe [46], in frozen soil. Some investigators have combined two methods together to infer the total water content in frozen soil; for example, gamma ray and TDR [47], and neutron probe and TDR [48]. However, TDR is not feasible for lysimeters because it will destroy the monitoring of evaporation and infiltration; the neutron probe has a low and variable degree of spatial resolution. The influence radius of a neutron probe is generally between 15 cm in wet soil to 70 cm in dry soil [49]. Therefore, the neutron probe is suitable for our field lysimeters with a radius of 40 cm. Low temperature and soil freezing has no apparent effect on neutron probe readings in frozen soils [50], and the readings should be insensitive to variations in liquid soil water content, but dependent on the total soil water content [51,52]. Therefore, for measuring total soil water content, we used a neutron probe (calibrated by the gravimetric method) and monitored intervals of 10 cm vertically every month on the 1st, 6th, 11th, 16th, 21st, and the 26th at 8:00 a.m. Further monitoring was conducted at 2:00 p.m. when a rapid increase in soil freezing depth was observed.
3. Results and Discussion
3.1. The Soil Freezing and Thawing Process at the ExperimentalStation
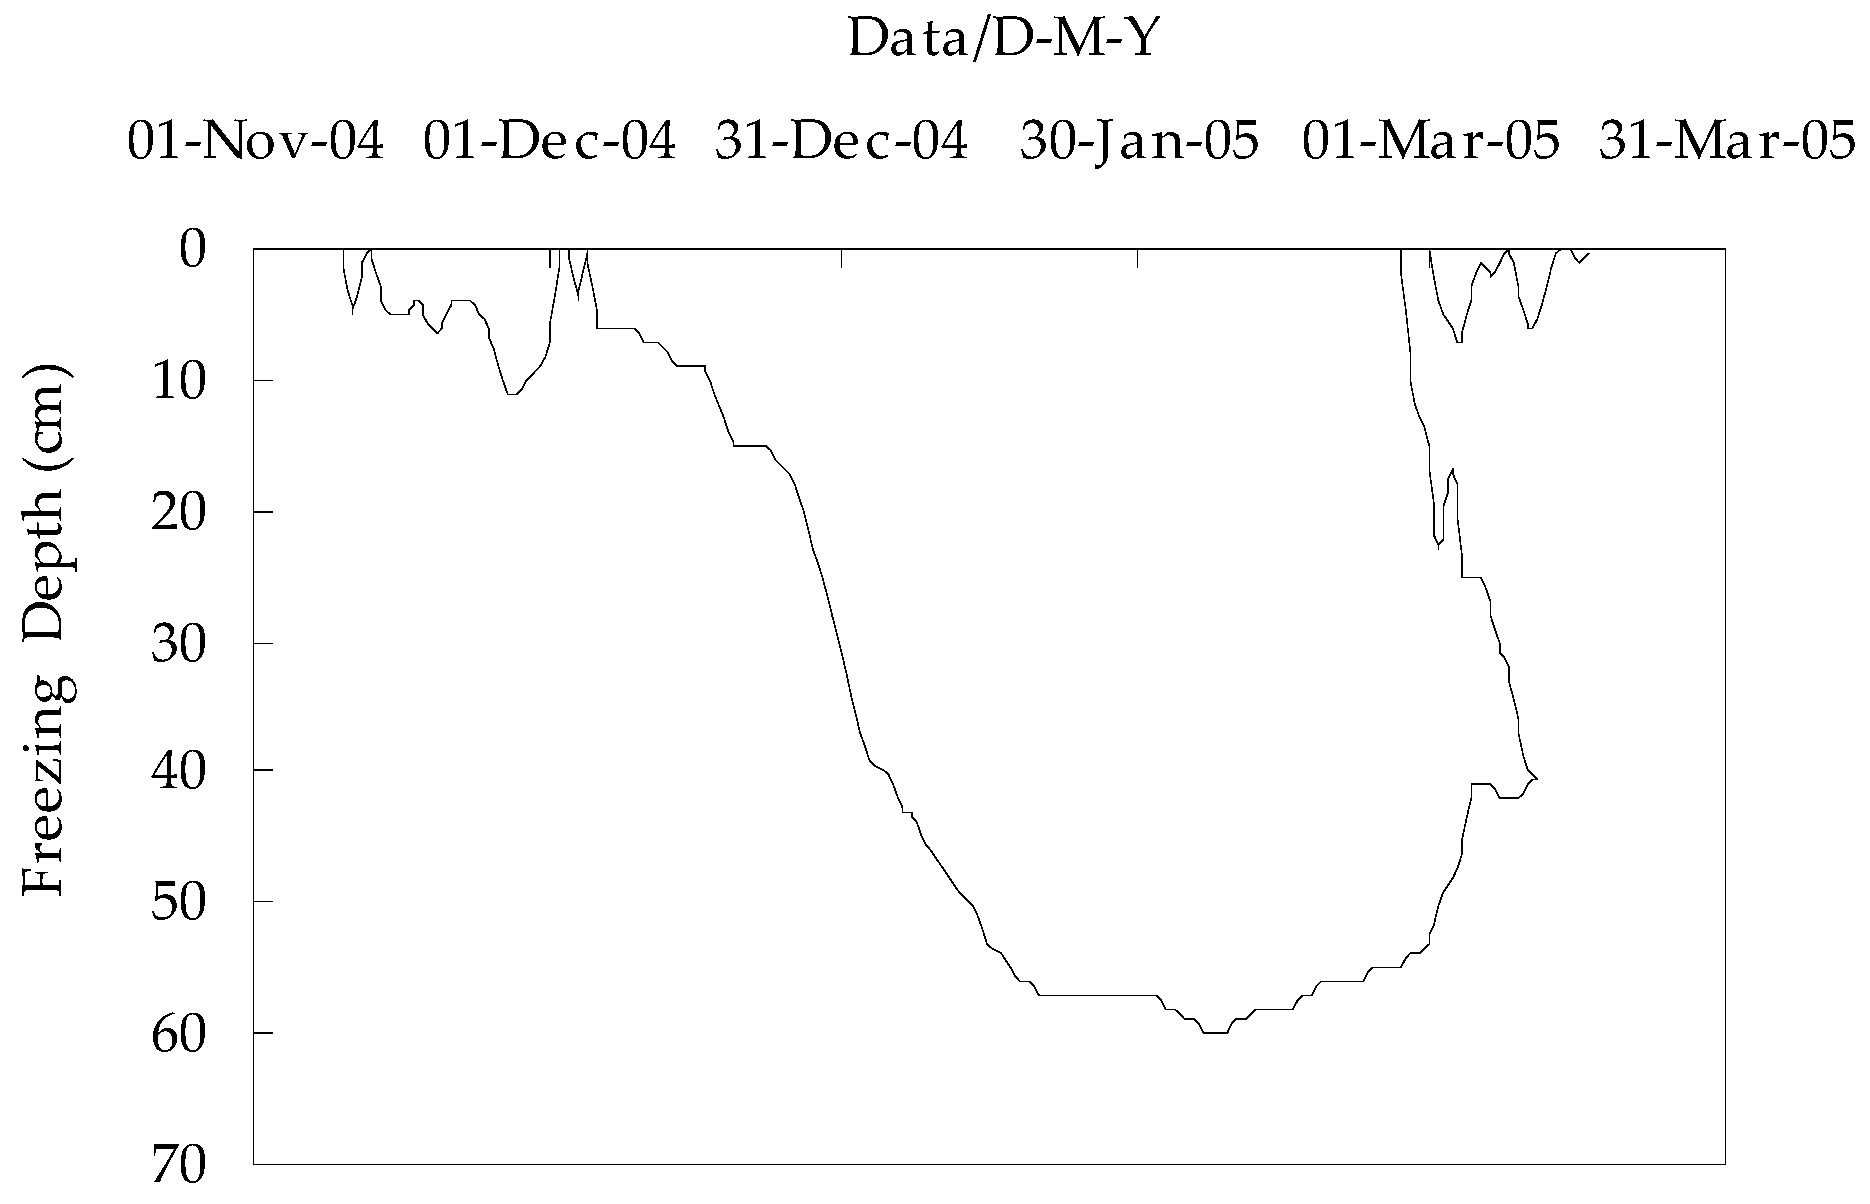
The soil freezing and thawing process at the experimental station can be divided into three main stages according to the characteristics of soil freezing and thawing [53,54,55]. These are: the unstable freezing stage (from 11 November to 24 December 2004), the stable freezing stage (from 25 December 2004 to 12 February 2005), and the thawing stage (from 13 February to 19 March 2005). The maximum depth of the frozen soil was 60 cm during the test period. The soil freezing and thawing process at the experimental station is shown in Figure 3.
The temperature and solar radiation decreased gradually after November, and the surface soils began to freeze on 11 November. The surface soil experienced several diurnal cycles (thawing during the day and freezing at night) during the unstable freezing stage, and the maximum depth of the soil frost was 11 cm. With the decline of air temperature and the accumulation of negative surface temperatures, the soil entered the stable freezing stage on 25 December, during which the frozen layer gradually developed downward. The maximum freezing rate was up to 3.0 cm per day, and the frozen layer reached a maximum of 60 cm on 6 February. During the thawing stage, as the air temperature rose, the frozen soil water began to thaw downward from the surface and upward from the maximum frozen front (referred to as bidirectional thawing), and the surface soil experienced several freeze-thaw cycles again.
3.2.The Characteristics of the Soil Moisture Distribution
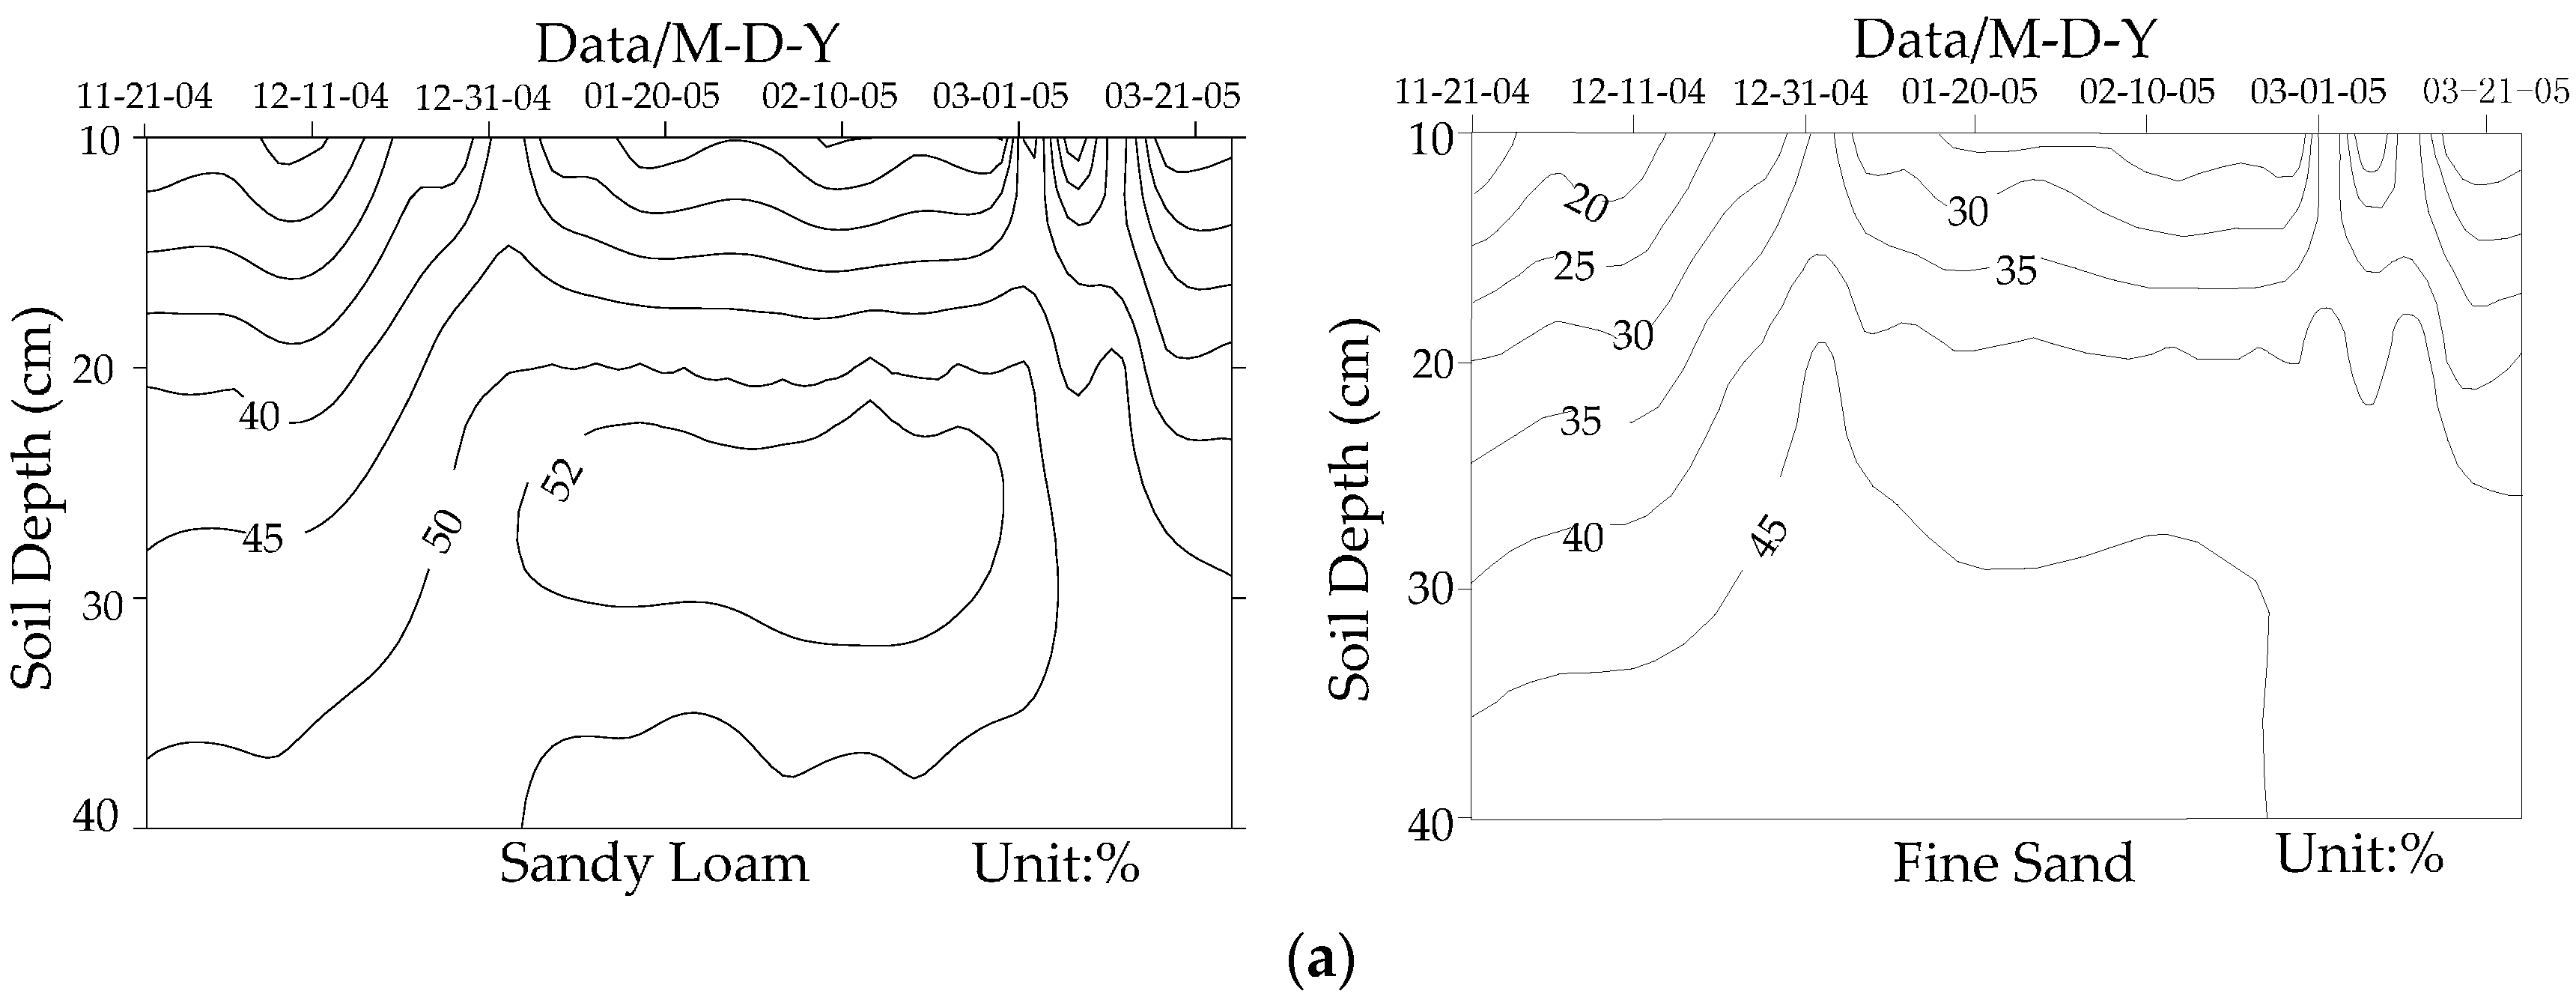
The freeze-thaw process affected the soil moisture content differently under different GTDs and soil textures. The soil moisture content contours of four different GTDs during the freeze-thaw period are shown in Figure 4. They indicate that the unsaturated zone generally experienced an increased, stabilized, and decreased soil moisture content during the freeze-thaw period. With the increase of GTD, the distance of water movement to the freezing front was increased. Accordingly, the time for profile moisture content began to increase for deeper GTDs lagged behind the shallower GTDs during the freeze-thaw period.
With the decrease of temperature and the increase of accumulated negative surface temperature during winter, the frozen layer formed and developed downward gradually, and the liquid soil water decreased in the frozen front. Thus, the soil water potential decreased and the soil water migrated to the frozen layer, influenced by the soil-water potential gradient. Therefore, soil moisture content increased and accumulated in the frozen layer [56], forming a high-moisture zone (HMZ). The solar radiation intensified and the air temperature rebounded slowly after January, and the increase of cumulative negative surface temperature slowed down. The downward progression of the frozen layer gradually stabilized, so the soil moisture content in the unsaturated zone remained stable. In early March, the HMZ disappeared gradually as frozen layer bidirectional thawing. Meanwhile, the soil water in the unsaturated zone recharged the groundwater. The surface soil moisture was lost to the outside by evaporation [37], and the moisture content decreased, but it generally remained higher than that at prefreezing.
With the soil freezing gradually and developing downward, the soil moisture began to increase at the end of November. It increased about 10% at a depth of 10–35 cm when the GTD was 0.5 m. A HMZ formed at a depth of 25–35 cm in the unsaturated zone with the sandy loam from early January to late February, and the soil moisture content was up to 52%. However, as shown in Figure 4a, the soil moisture content in the fine sand increased in early January and then remained stable until the end of February, and no obvious HMZ formed.
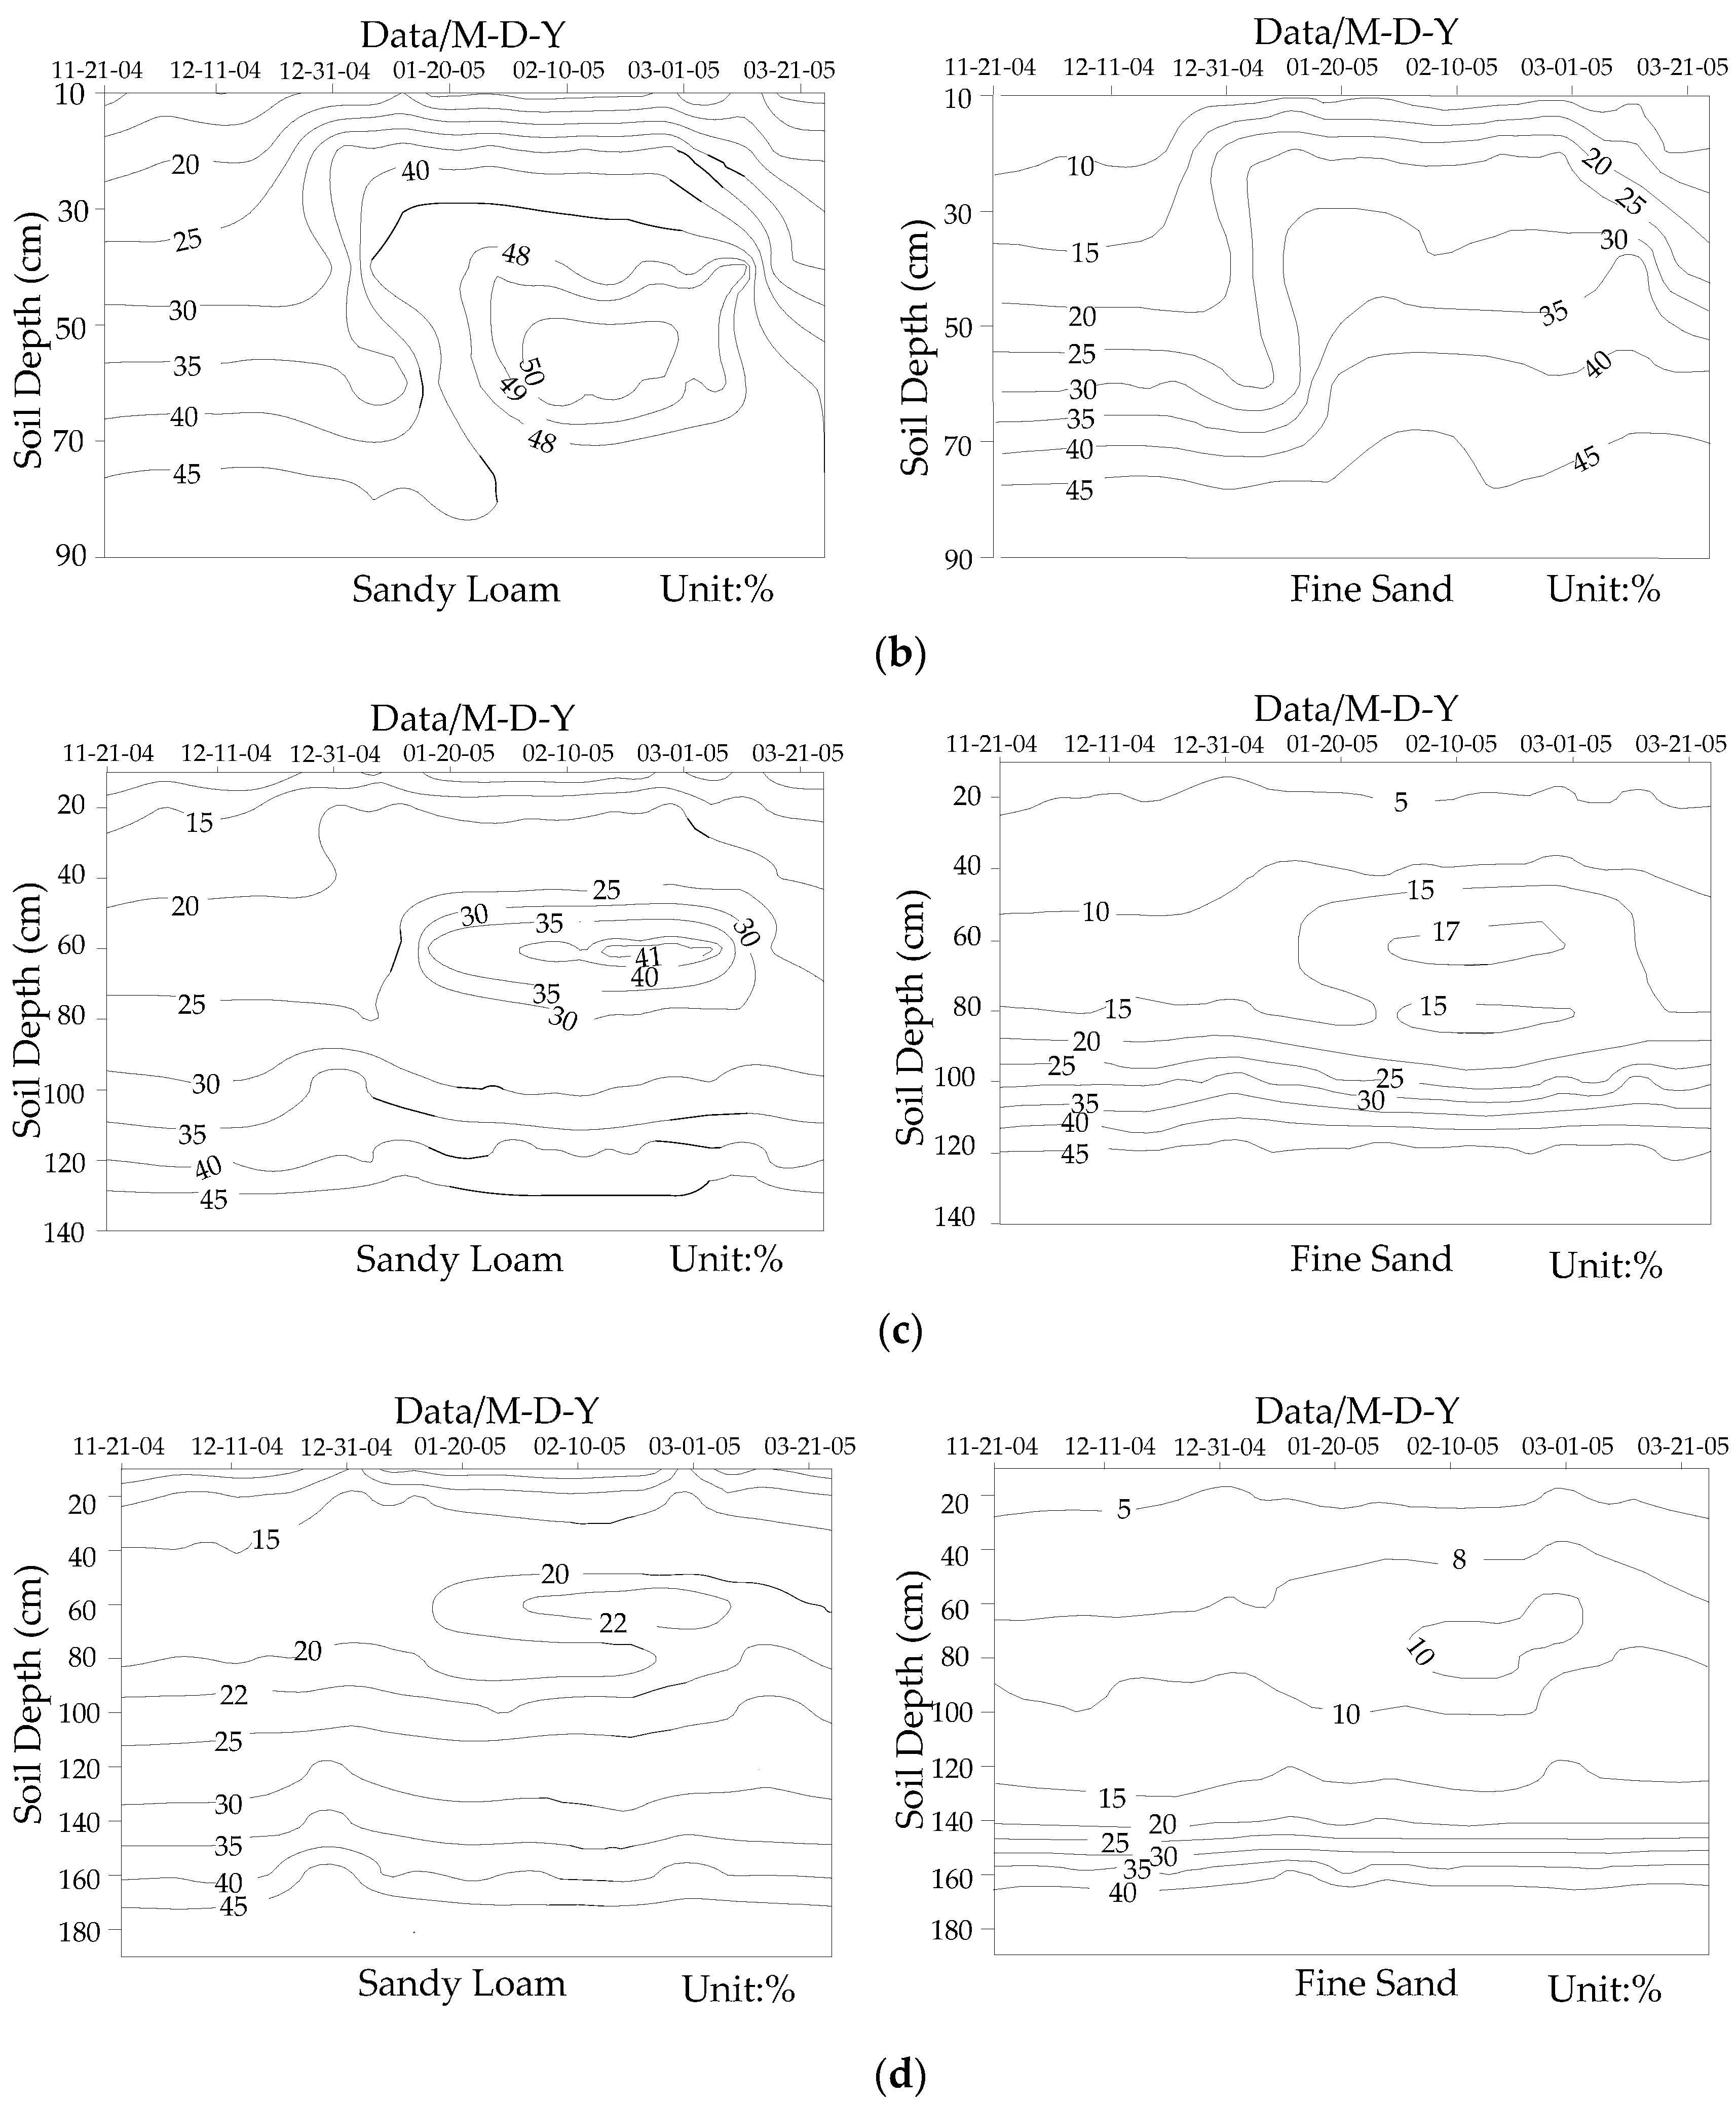
When the GTD was 1.0 m, the soil moisture at a depth of 10–30 cm increased in mid-December and stabilized from early January to late February. As the frozen layer developed gradually downward, the soil moisture of the unsaturated zone with sandy loam at 50 cm began to increase from 31% in late December to 51% in late January. However, as shown in Figure 4b, the soil moisture of the unsaturated zone with fine sand increased and remained stable until late February, and no HMZ formed.
When the GTD was 1.5 m, the soil moisture of the unsaturated zone with sandy loam changed more dramatically at a depth of 60 cm, and soil water gradually gathered in this layer in mid-January. The soil moisture content increased to 38% on 16 January and to 43% in late February. The soil did not freeze below 60 cm during the freeze-thaw period. However, soil moisture gathered at the depth of 60–70 cm and increased by 11–20%, influenced by water migrating upward to the freezing front from below. The soil moisture contours below 80 cm changed little. The soil moisture of the unsaturated zone with fine sand and sandy loam showed similar variation. However, the capillary force of the fine sand was weaker than that of the sandy loam due to the larger pore diameters of the fine sand. Thus, as shown in Figure 4c, the soil moisture content of the HMZ was only 17% for fine sand.
When the GTD was 2.0 m, the soil moisture changed little. The soil moisture in the sandy loam gathered at the depth of 50–70 cm in mid-January, and reached maximum in mid-February. With an increase in GTD, the distance between the soil freezing fronts to the water table becomes relatively longer and the upward recharging path lengthened, so the soil–water potential gradient is reduced. Therefore, the soil moisture content of the HMZ formed at 60–80 cm and it was only 22% for the sandy loam and 10% for the fine sand. As shown in Figure 4d, the soil moisture below 80 cm changed less than 10% during the freeze-thaw period. It was affected very little by soil freezing and upward groundwater migration.
3.3.Phreatic Evaporation
3.3.1. Phreatic Evaporation during Freezing Period
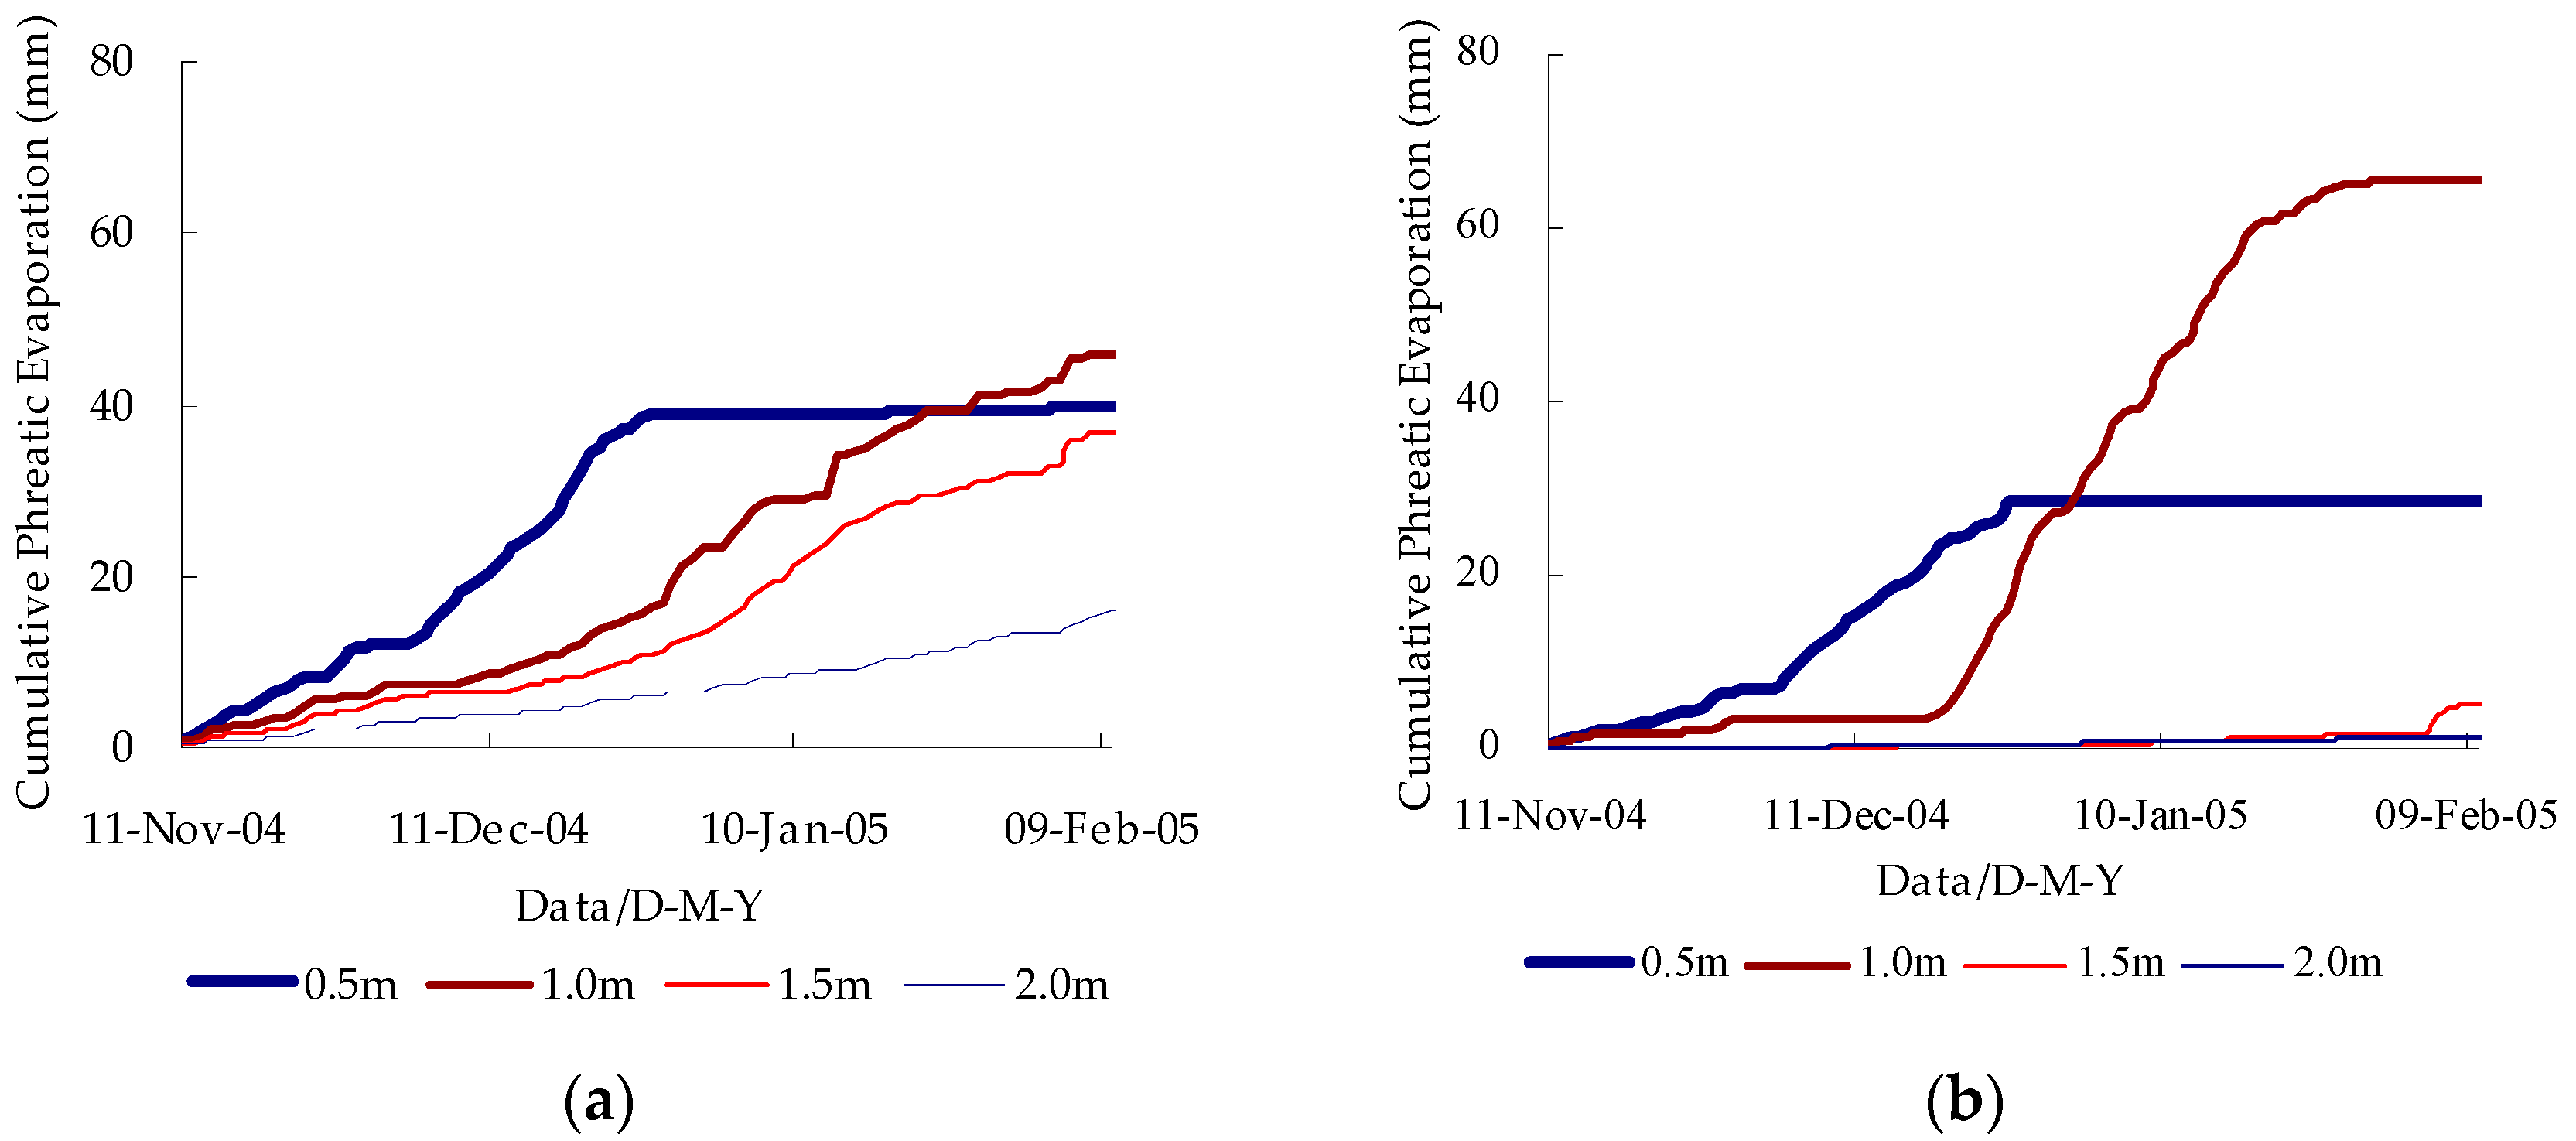
The soil moisture’s upward migration from shallow groundwater caused by soil freezing is also known as phreatic evaporation to the unsaturated zone during a freezing period. The cumulative phreatic evaporation for the different GTDs during the freezing period are shown in Figure 5. When the GTD was 0.5 m, phreatic evaporation was obviously affected by soil freezing. The cumulative phreatic evaporation was up to 39.1 mm for the sandy loam and 28.4 mm for the fine sand on 28 December. After that, the zone between the groundwater table and the soil surface was almost frozen. The concrete frozen layer had a small amount of liquid water [57], which was blocked by ice with very low permeability [58,59], so much less water could be transported directly from the groundwater to the soil surface. So, the soil moisture content remained unchanged, and the cumulative phreatic evaporation was almost stable. The total phreatic evaporation of the sandy loam and the fine sand was 39.7 and 28.5 mm, respectively, during the freezing period.
The rapid downward development of the freezing front had a great effect on phreatic evaporation when the GTD was 1.0 m. The phreatic evaporation rate of the fine sand was faster than that of the sandy loam due to the larger pore diameter of the fine sand. During the freezing period, the total phreatic evaporation amounts were 45.8 mm for the sandy loam and 65.7 mm for the fine sand. This was larger than when the GTD was 0.5 m due to large amounts of accumulated water at the freezing front.
As the distance between the soil freezing front and the GTD increased, the water potential gradient in the soil was less, so smaller amounts of groundwater recharged the soil water. Thus, the phreatic evaporation decreased and the total phreatic evaporation was reduced. However, the effect of the soil capillary force on phreatic evaporation was obvious in the sandy loam when compared with the fine sand. Due to the smaller pore diameter of the sandy loam and a strong capillary force, the phreatic evaporation was larger. When the GTD was 2.0 m, the total phreatic evaporation of the sandy loam and the fine sand was only 16.2 and 1.4 mm, respectively, during the freezing period.
The shallow groundwater migrated easily to the unsaturated zone during the freezing period. The total phreatic evaporation reached maximum when the GTD was 1.0 m. The fine sand with a relatively larger pore diameter had the largest total phreatic evaporation.
The data analysis of 94 days during the freezing period shows that the cumulative phreatic evaporation increased by a power function with freezing days during the freezing period, as shown as the following model:
where AE is the cumulative phreatic evaporation; Fd is the number of freezing days; and A and B are regression coefficients.
AE = A × Fd0.5 + B
The regression analysis results of different GTDs are listed in Table 2.
With the mentioned model transformed into a linear model Y = aX + b, the significance level α = 5% yields F0.05(p, n – p − 1) = F0.05(1,92) = 3.96. Table 2 shows the regression coefficient and significance test of the regression equation. All the regression results were significant with F > 3.96, which indicates that the regression equation is strongly significant, and the relationship between cumulative phreatic evaporation and freezing days can be expressed by the mentioned regression model.
3.3.2. Phreatic Evaporation during Thawing Period
During the soil thawing period, some thawed soil water from the frozen layer was lost to evaporation [37], and other thawed soil water recharged the shallow groundwater [6]. The soil moisture content at a depth of 10 cm was 35–40% when the GTD was 0.5 m. For the higher soil moisture content of the upper layer and surface results in the stronger evaporation rates, the phreatic evaporation amounts were 22.1 mm for the sandy loam and 26.1 mm for the fine sand. With the increase of the GTD, the surface soil moisture decreased, the soil moisture content at the depth of 10 cm was 10–15% when the GTD was 1.0 m, and soil evaporation weakened. In addition, the largest amount of phreatic evaporation occurred when the GTD was 1.0 m during the freezing period, and a large amount of thawed water recharged the groundwater during the thawing period, so the phreatic evaporation was reduced dramatically. The phreatic evaporation amounts were 0.1 mm for the sandy loam and 0.3 mm for the fine sand when the GTD was 1.5 m.
When the GTD was 2.0 m, the soil moisture of the unsaturated zone changed a little during the freezing period, and had no thawed water recharge the groundwater during the thawing period. Because the maximum capillary height of the sandy loam, which had a strong capillary force, was 185 cm, and it was only 15 cm from the ground, the phreatic evaporation was larger and reached 7.2 mm during the thawing period. The phreatic evaporation was 1.1 mm for the fine sand, which had a poor capillary force.
3.3.3. Relationship between the Total Phreatic Evaporation and the GTD during the Freeze-Thaw Period
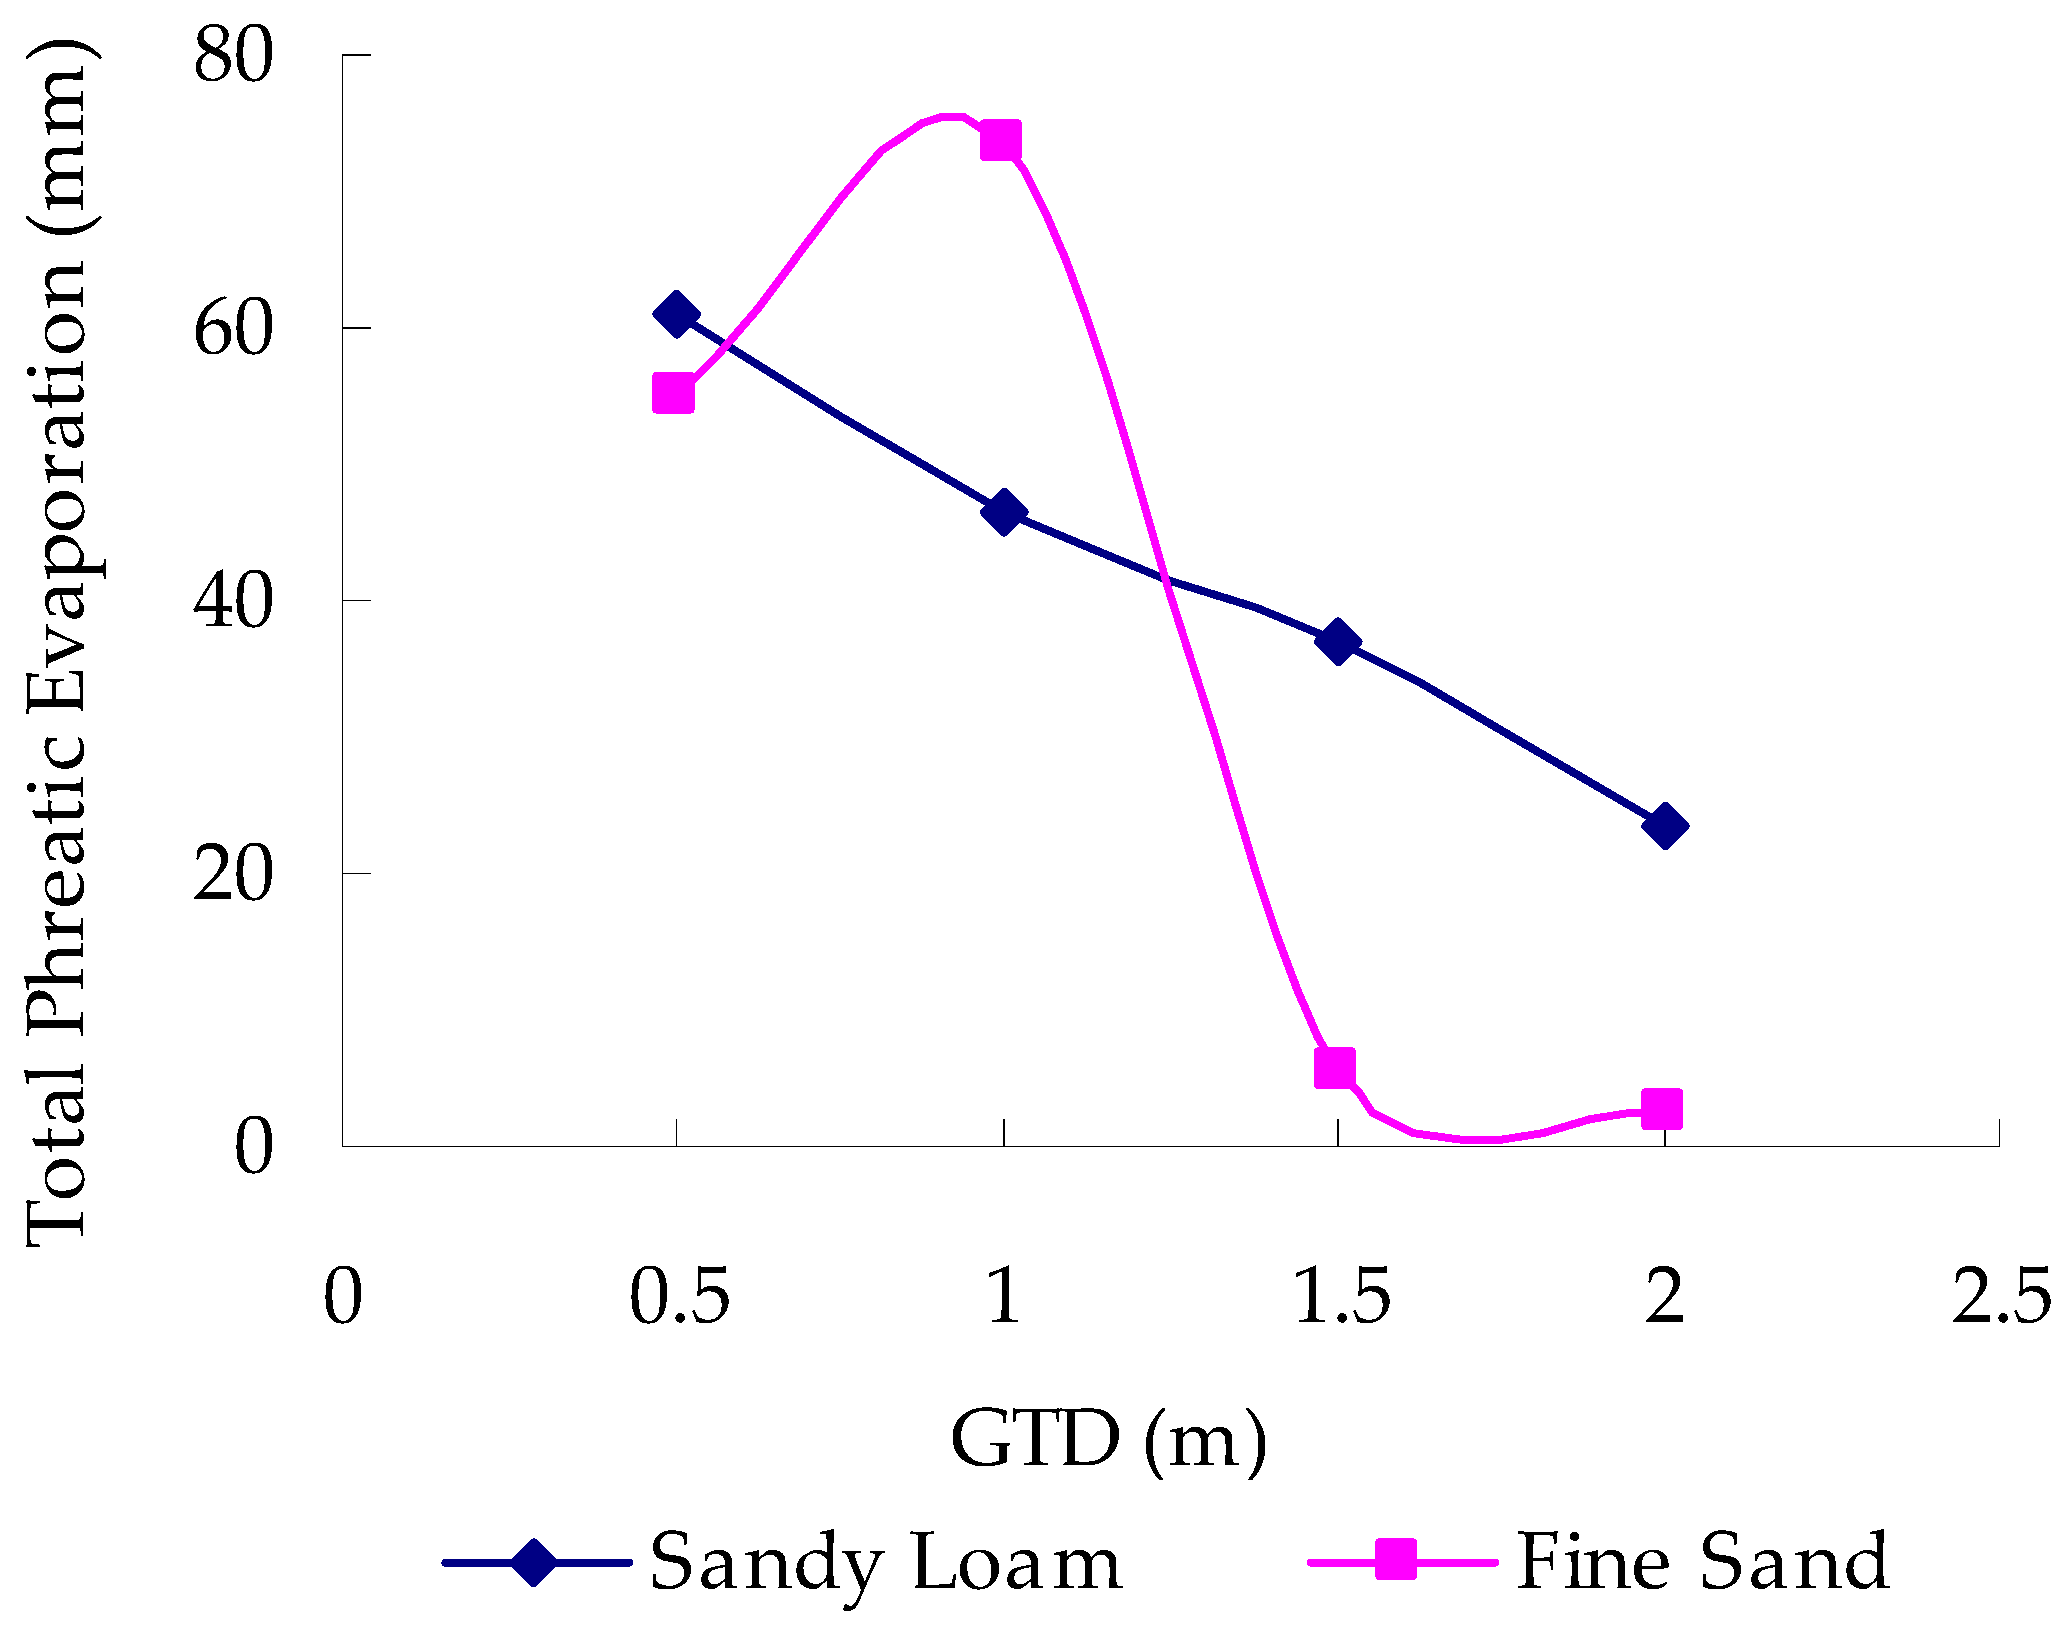
The total phreatic evaporation amounts for different GTDs during the freeze-thaw period are shown in Figure 6.
The analysis indicated that the total phreatic evaporation of the sandy loam declined almost linearly with the increasing of the GTD during the freeze-thaw period. This is well fitted by the following linear model with the correlation coefficient of 0.99:
TE = –24.58D + 72.75 (0.5 ≤ D ≤ 2.0).
In Equation (2), TE is the total phreatic evaporation during the freeze-thaw period (millimeters); and D is the GTD (meters).
The total phreatic evaporation for different GTDs with fine sand was more complex than that of the sandy loam, and there was no fixed relationship with the increase of GTD. The maximum capillary height of the fine sand was 77 cm, and the larger specific yield meant that the unsaturated zone could accommodate more water. So, the total phreatic evaporation reached the maximum, with the largest value of 73.6 mm when the GTD was 1.0 m. The total phreatic evaporation declined sharply when the GTD was greater than 1.5 m during the freeze-thaw period.
4. Conclusions
The soil moisture content in the unsaturated zone at different GTDs is quite different. The shallower the GTD was, the earlier a HMZ formed and with a higher soil moisture content. When the GTD was 0.5 m with sandy loam, a HMZ formed at a depth of 25–35 cm and the maximum soil moisture content was up to 52%; however, no obvious HMZ formed for the fine sand. An HMZ formed at a depth of 40–60 cm for sandy loam and the soil moisture content was up to 50%, but no HMZ formed for fine sand when the GTD was 1.0 m. When the GTD was 1.5 and 2.0 m, an HMZ formed at a depth of 50–70 cm and the highest moisture was 43% and 22%, respectively, for sandy loam, while an HMZ formed at the depth of 60–80 cm and the maximum moisture was 17% and 10%, respectively, for fine sand.
During the freezing period, the phreatic evaporation was larger when the GTD was 1.0 m, and the relatively larger pore diameter of the fine sand had the largest phreatic evaporation. The cumulative phreatic evaporation increased by a power function with freezing days during the freezing period. The surface evaporation had a great influence on the phreatic evaporation when the GTD was less than 1.0 m during the thawing period. The soil capillary height became the main factor affecting phreatic evaporation when the GTD was 2.0 m.
The total phreatic evaporation for sandy loam declined almost linearly with an increase in GTD during the freeze-thaw period, and with the largest evaporation value of 73.6 mm for the fine sand when the GTD was 1.0 m. The total phreatic evaporation decreased sharply when the GTD was greater than 1.5 m during the freeze-thaw period.
Acknowledgments
This research was supported by National Natural Science Foundation of China (Grant Nos. 41502243 and 41572239), Natural Science Youth Foundation of Shanxi province, China (Grant No. 2015021169). The authors thank Ming Sun, Xiaojun Yang and everyone else from the Taigu Water Balance Experimental Station for their assistance with the field work.
Author Contributions
Xiuqing Zheng and Yongbo Zhang conceived of and designed the field experiments. Junfeng Chen and Qi Du performed the field experiments. Chunyan Miao and Junfeng Chen analyzed the data and wrote the paper. Yongxin Xu has corrected the grammar errors and put forward some suggestions for improvement.
Conflicts of Interest
The authors declare no conflict of interest.
References
- Babajimopoulos, C.; Panoras, A.; Georgoussis, H.; Arampatzis, G.; Hatzigiannakis, E.; Papamichail, D. Contribution to irrigation from shallow water table under field conditions. Agric. Water Manag. 2007, 92, 205–210. [Google Scholar] [CrossRef]
- Brunner, P.; Li, H.T.; Kinzelbach, W.; Li, W.P.; Dong, X.G. Extracting phreatic evaporation from remotely sensed maps of evapotranspiration. Water Resour. Res. 2008, 44, 381–392. [Google Scholar] [CrossRef]
- Northey, J.E.; Christen, E.W.; Ayars, J.E.; Jankowski, J. Occurrence and measurement of salinity stratification in shallow groundwater in the Murrumbidgee Irrigation Area, south-eastern Australia. Agric. Water Manag. 2006, 81, 23–40. [Google Scholar] [CrossRef]
- Ibrahimi, M.K.; Miyazaki, T.; Nishimura, T.; Imoto, H. Contribution of shallow groundwater rapid fluctuation to soil salinization under arid and semiarid climate. Arab. J. Geosci. 2014, 7, 3901–3911. [Google Scholar] [CrossRef]
- Ren, J.; Wu, Q.; Zheng, X.; Xu, M. The studies of regional water circulation patterns in the Yerqiang River Basin. J. Ocean Univ. China 2006, 5, 357–362. [Google Scholar] [CrossRef]
- Walvoord, M.A.; Striegl, R.G. Increased groundwater to stream discharge from permafrost thawing in the Yukon River basin: Potential impacts on lateral export of carbon and nitrogen. Geophys. Res. Lett. 2007, 34, L12402. [Google Scholar] [CrossRef]
- Irvine, E.C.; Western, A.W.; Costelloe, J.F. Uncertainties around modelling of steady-state phreatic evaporation with field soil profiles of δ18O and chloride. J. Hydrol. 2014, 511, 229–241. [Google Scholar]
- Soppe, R.W.; Ayars, J.E. Characterizing ground water use by safflower using weighing lysimeters. Agric. Water Manag. 2003, 60, 59–71. [Google Scholar] [CrossRef]
- Li, H.; Wang, W.; Liu, B. The daily evaporation characteristics of deeply buried phreatic water in an extremely arid region. J. Hydrol. 2014, 514, 172–179. [Google Scholar] [CrossRef]
- Hurst, C.A.; Thorburn, P.J.; Lockington, D.; Bristow, K.L. Sugarcane water use from shallow water tables: Implications for improving irrigation water use efficiency. Agric. Water Manag. 2004, 65, 1–19. [Google Scholar] [CrossRef]
- Sepaskhah, A.R.; Kanooni, A.; Ghasemi, M.M. Estimating water table contributions to corn and sorghum water use. Agric. Water Manag. 2003, 58, 67–69. [Google Scholar] [CrossRef]
- Hu, S.; Tian, C.; Song, Y.; Chen, X.; Li, Y. Models for calculating phreatic water evaporation on bare and Tamarix-vegetated lands. Chin. Sci. Bull. 2006, 51, 43–50. [Google Scholar] [CrossRef]
- Hu, S.; Lei, J.; Xu, X.; Song, Y.; Tian, C.; Chen, X.; Li, X. Theoretical analysis of the limiting rate of phreatic evaporation for aeolian sandy soil in Taklimakan Desert. Chin. Sci. Bull. 2008, 53, 119–224. [Google Scholar] [CrossRef]
- Hu, S.; Zhao, R.; Tian, C.; Song, Y. Empirical models of calculating phreatic evaporation from bare soil in Tarim river basin, Xinjiang. Environ. Earth Sci. 2009, 377, 663–668. [Google Scholar] [CrossRef]
- Raes, D.; Deprost, P. Model to assess water movement from a shallow water table to the root zone. Agric. Water Manag. 2003, 62, 79–91. [Google Scholar] [CrossRef]
- Chen, X.; Ling, M.; Zhou, Q.; Zhang, Z.; Cheng, Q. Numerical modeling the role of rubber dams on groundwater recharge and phreatic evaporation loss in riparian zones. Environ. Earth Sci. 2012, 65, 345–352. [Google Scholar] [CrossRef]
- Zhu, Y.; Ren, L.; Lu, H. Effect of water table depth on growth and yield of soybean Yudou 16. J. Hydrol. Eng. 2013, 18, 1070–1076. [Google Scholar] [CrossRef]
- Li, H.; Wu, F.; Zhan, H.; Qiu, F.; Wang, W. The effect of precipitation pulses on evaporation of deeply buried phreatic water in extra-arid areas. Vadose Zone J. 2016, 15. [Google Scholar] [CrossRef]
- Kang, S.; Zhang, F.; Hu, X.; Zhang, J. Benefits of CO2 enrichment on crop plants are modified by soil water status. Plant Soil 2002, 238, 69–77. [Google Scholar] [CrossRef]
- Zwart, S.J.; Bastiaanssen, W.G. Review of measured crop water productivity values for irrigated wheat rice, cotton and maize. Agric. Water Manag. 2004, 69, 115–133. [Google Scholar] [CrossRef]
- Wang, H.; Vicente-serrano, S.M.; Tao, F.; Zhang, X.; Wang, P.; Zhang, C.; Chen, Y.; Zhu, D.; El Kenawy, A. Monitoring winter wheat drought threat in Northern China using multiple climate-based drought indices and soil moisture during 2000-2013. Agric. For. Meteorol. 2016, 228, 1–12. [Google Scholar] [CrossRef]
- Haghverdi, A.; Yonts, C.D.; Reichert, D.L.; Irmak, S. Impact of irrigation, surface residue cover and plant population on sugarbeet growth and yield, irrigation water use efficiency and soil water dynamics. Agric. Water Manag. 2017, 180, 1–12. [Google Scholar] [CrossRef]
- Wang, X.; Huo, Z.; Feng, S.; Guo, P.; Guan, H. Estimating groundwater evapotranspiration from irrigated cropland incorporating root zone soil texture and moisture dynamics. J. Hydrol. 2016, 543, 501–509. [Google Scholar] [CrossRef]
- Martinez, J.A.; Dominguez, F.; Miguez-Macho, G. Effects of a groundwater scheme on the simulation of soil moisture and evapotranspiration over Southern South America. J. Hydrometeorol. 2016, 17, 2941–2957. [Google Scholar] [CrossRef]
- Dall’Amico, M.; Endrizzi, S.; Gruber, S.; Rigon, R. A robust and energy-conserving model of freezing variably-saturated soil. Cryosphere 2011, 5, 469–484. [Google Scholar] [CrossRef]
- Jafarov, E.E.; Marchenko, S.S.; Romanovsky, V.E. Numerical modeling of permafrost dynamics in Alaska using a high spatial resolution dataset. Cryosphere 2012, 6, 613–624. [Google Scholar] [CrossRef]
- Harlan, R.L. Analysis of coupled heat-fluid transport in partially frozen soil. Water Resour. Res. 1973, 9, 1314–1323. [Google Scholar] [CrossRef]
- Jansson, P.E.; Halldin, S. Soil Water and Heat Model: Technical Description; Swedish Coniferous Forest Project. Tech. Rep. 26; Swedish University of Agricultural Sciences: Uppsala, Sweden, 1980. [Google Scholar]
- Flerchinger, G.N.; Saxton, K.E. Simultaneous heat and water model of freezing snow-residue-soil system II. Field verification. Trans. ASAE 1989, 32, 573–578. [Google Scholar] [CrossRef]
- Šimůnek, J.; van Genuchten, M.T.; Šejna, M. Recent developments and applications of the HYDRUS computer software packages. Vadose Zone J. 2016, 15. [Google Scholar] [CrossRef]
- Zhao, Y.; Si, B.C.; He, H.L.; Xu, J.H.; Peth, S.; Horn, R. Modeling of coupled water and heat transfer in freezing and thawing soils, Inner Mongolia. Water 2016, 8, 424. [Google Scholar] [CrossRef]
- Yi, F.H.; Wang, S.; Ye, R.H. Preliminary research of soil freezing on water movement in barley and wheat fields. Barley Sci. 1997, 53, 23–25. [Google Scholar]
- Musa, A.; Liu, Y.; Wang, A.; Niu, C. Characteristics of soil freeze-thaw cycles and their effects on water enrichment in the rhizosphere. Geoderma 2016, 264, 132–139. [Google Scholar] [CrossRef]
- Beldring, S.; Gottschalk, L.; Seibert, J.; Tallaksen, L.M. Distribution of soil moisture and groundwater levels at patch and catchment scales. Agric. For. Meteorol. 2000, 98–99, 305–324. [Google Scholar] [CrossRef]
- Iwata, Y.; Hirota, T.; Hayashi, M.; Suzuki, S.; Hasegawa, S. Effects of frozen soil and snow cover on cold-season soil water dynamics in Tokachi, Japan. Hydrol. Process. 2010, 24, 1755–1765. [Google Scholar] [CrossRef]
- Zhou, J.; Li, D. Numerical analysis of coupled water, heat and stress in saturated freezing soil. Cold Reg. Sci. Technol. 2012, 72, 43–49. [Google Scholar] [CrossRef]
- Wu, M.; Huang, J.; Wu, J.; Tan, X.; Jansson, P.E. Experimental study on evaporation from seasonally frozen soils under various water, solute and groundwater conditions in Inner Mongolia, China. J. Hydrol. 2016, 535, 46–53. [Google Scholar] [CrossRef]
- Chen, X.; Hu, Q. Groundwater influences on soil moisture and surface evaporation. J. Hydrol. 2004, 297, 285–300. [Google Scholar] [CrossRef]
- Kaplan, D.; Muñoz-Carpena, R. Complementary effects of surface water and groundwater on soil moisture dynamics in a degraded coastal floodplain forest. J. Hydrol. 2011, 398, 221–234. [Google Scholar] [CrossRef]
- Newman, G.P.; Wilson, G.W. Heat and mass transfer in unsaturated soils during soil freezing. Can. Geotech. J. 1997, 34, 63–70. [Google Scholar] [CrossRef]
- Li, R.; Shi, H.; Flerchinger, G.N.; Akae, T.; Wang, C. Simulation of freezing and thawing soils in Inner Mongolia Hetao irrigation district, China. Geoderma 2012, 173, 28–33. [Google Scholar] [CrossRef]
- Boike, J.; Roth, K. Time domain reflectometry as a field method for measuring water content and soil water electrical conductivity at a continuous permafrost site. Permafr. Periglac. Process. 1997, 8, 359–370. [Google Scholar] [CrossRef]
- He, H.L.; Dyck, M. Application of multiphase dielectric mixing models for understanding the effective dielectric permittivity of frozen soils. Vadose Zone J. 2013, 12, 1–22. [Google Scholar] [CrossRef]
- Watanabe, K.; Wake, T. Measurement of unfrozen water content and relative permittivity of frozen unsaturated soil using NMR and TDR. Cold Reg. Sci. Technol. 2011, 59, 34–41. [Google Scholar] [CrossRef]
- Bittelli, M.; Flury, M.; Roth, K. Use of dielectric spectroscopy to estimate ice content in frozen porous media. Water Resour. Res. 2004, 40, 1149–1155. [Google Scholar] [CrossRef]
- Liu, G.; Si, B.C. Soil ice content measurement using a heat pulse probe method. Can. J. Soil Sci. 2011, 91, 235–246. [Google Scholar] [CrossRef]
- Zhou, X.; Zhou, J.; Kinzelbach, W.; Stauffer, F. Simultaneous measurement of unfrozen water content and ice content in frozen soil using gamma ray attenuation and TDR. Water Resour. Res. 2014, 50, 9630–9655. [Google Scholar] [CrossRef]
- Hayhoe, H.; Bailey, W. Monitoring changes in total and unfrozen water content in seasonally frozen soil using time domain reflectometry and neutron moderation techniques. Water Resour. Res. 1985, 21, 1077–1084. [Google Scholar] [CrossRef]
- Gardner, W.H.; Klute, A. Water content. In Methods of Soil Analysis. Part 1. Physical and Mineralogical Methods; American Society of Agronomy: Madison, WI, USA, 1986; pp. 493–544. [Google Scholar]
- Sartz, R.S. Interpreting Neutron Probe Reading in Frozen Soil; Res. Note NC-77; U.S. Dept. of Agriculture, Forest Service, North Central Forest: Saint Paul, MN, USA, 1969. [Google Scholar]
- Willatt, S.T. Changes in water content in and under frozen soil in Iowa, USA. Geoderma 1979, 22, 323–331. [Google Scholar] [CrossRef]
- Sheppard, M.I.; Kay, B.D.; Loch, P.G. The coupled transport of water and heat in freezing soils: A field study. Can. J. Soil Sci. 1981, 61, 417–429. [Google Scholar] [CrossRef]
- Chen, J.; Zheng, X.; Zang, H.; Liu, P.; Sun, M. Numerical Simulation of Moisture and Heat Coupled Migration in Seasonal Freeze-thaw Soil Media. J. Pure Appl. Microbiol. 2013, 7, 151–158. [Google Scholar]
- Zheng, X.; Chen, J.; Xing, S. Soil infiltration capacity and infiltration parameters of freezing and thawing soil under different surface coverages. Trans. Chin. Soc. Agric. Eng. 2009, 25, 23–28. [Google Scholar]
- Zheng, X.; Flerchinger, G.N. Infiltration into freezing and thawing soils under different field management. J. Irrig. Drain. Eng. 2001, 127, 176–182. [Google Scholar]
- Zhang, X.; Sun, S. The impact of soil freezing/thawing process on water and energy balances. Adv. Atmos. Sci. 2011, 28, 169–177. [Google Scholar] [CrossRef]
- Cheng, Q.; Sun, Y.; Qin, Y.; Xue, X.; Cai, X.; Sheng, W.; Zhao, Y. In situ measuring soil ice content with a combined use of dielectric tube sensor and neutron moisture meter in a common access tube. Agric. For. Meteorol. 2013, 171, 249–255. [Google Scholar] [CrossRef]
- Seyfried, M.S.; Murdock, M.D. Use of air permeability to estimate infiltrability of frozen soil. J. Hydrol. 1997, 202, 95–107. [Google Scholar] [CrossRef]
- Hansson, K.; Šimůnek, J.; Mizoguchi, M.; Lundin, L.C.; van Genuchten, M.T. Water flow and heat transport in frozen soil: Numerical solution and freeze-thaw applications. Vadose Zone J. 2004, 3, 693–704. [Google Scholar] [CrossRef]
Figure 1.
Average daily air temperature and solar radiation curve during the test period.

Figure 2.
Schematic diagram of a field lysimeter.

Figure 3.
The soil freezing and thawing process at the experimental station from November 2004 to March 2005.
Figure 3.
The soil freezing and thawing process at the experimental station from November 2004 to March 2005.

Figure 4.
The soil profile moisture content (unit: m3·m−3 in percent) contours of four different groundwater table depths (GTDs) (a) GTD was 0.5 m; (b) GTD was 1.0 m; (c) GTD was 1.5 m; (d) GTD was 2.0 m.
Figure 4.
The soil profile moisture content (unit: m3·m−3 in percent) contours of four different groundwater table depths (GTDs) (a) GTD was 0.5 m; (b) GTD was 1.0 m; (c) GTD was 1.5 m; (d) GTD was 2.0 m.


Figure 5.
Cumulative phreatic evaporation during the freezing period (a) sandy loam; (b) fine sand.

Figure 6.
Relationship between total phreatic evaporation and GTD during the freeze-thaw period.


Table 1.
Properties of the soils in the lysimeters.
| Soil Texture | Mass Percentage of Different Soil Particle Diameter (%) | Maximum Capillary Height (cm) | Prosity (m3·m−3) | Specific Yield (m3·m−3) | Bulk Density (×103 kg·m−3) | ||||
|---|---|---|---|---|---|---|---|---|---|
| 0.5–2 mm | 0.25–0.5 mm | 0.1–0.25 mm | 0.05–0.1 mm | <0.05 mm | |||||
| Sandy Loam | 1.3 | 19.7 | 36.1 | 24.4 | 18.5 | 185 | 0.53 | 0.08 | 1.53 |
| Fine Sand | 1.6 | 22.4 | 45.7 | 24.5 | 5.8 | 77 | 0.45 | 0.12 | 1.61 |
Table 2.
The regression coefficient and significance test of the regression equation.
| Soil Texture | GTD (m) | Regression Coefficient | Significance Test of Regression Equation | |||||||||
|---|---|---|---|---|---|---|---|---|---|---|---|---|
| Deviation | Degrees of Freedom | Mean Square Deviation | F | |||||||||
| A | B | Qreg. | Qres. | Qtotal | p | n − p − 1 | n − 1 | Sreg. | Sres. | |||
| Sandy Loam | 0.5 | 5.801 | −9.714 | 16,076.46 | 1892.53 | 17,968.98 | 1 | 92 | 93 | 16,076.46 | 20.57 | 781.51 |
| 1.0 | 6.325 | −19.904 | 19,111.77 | 2591.78 | 21,703.55 | 1 | 92 | 93 | 19,111.77 | 28.17 | 678.41 | |
| 1.5 | 4.875 | −15.988 | 11,362.34 | 2006.63 | 13,358.97 | 1 | 92 | 93 | 11,362.34 | 21.81 | 520.94 | |
| 2.0 | 1.881 | −5.408 | 1689.37 | 198.68 | 1888.05 | 1 | 92 | 93 | 1689.37 | 2.16 | 782.27 | |
| Fine Sand | 0.5 | 4.395 | −8.680 | 9229.04 | 1211.46 | 10,440.50 | 1 | 92 | 93 | 9229.04 | 13.17 | 700.87 |
| 1.0 | 10.491 | −39.843 | 52,576.51 | 13,548.14 | 66,124.65 | 1 | 92 | 93 | 52,576.51 | 147.26 | 357.03 | |
| 1.5 | 0.373 | −1.560 | 66.58 | 74.66 | 141.24 | 1 | 92 | 93 | 66.58 | 0.81 | 82.04 | |
| 2.0 | 0.694 | −1.824 | 229.90 | 50.94 | 280.84 | 1 | 92 | 93 | 229.90 | 0.55 | 415.21 | |
© 2017 by the authors. Licensee MDPI, Basel, Switzerland. This article is an open access article distributed under the terms and conditions of the Creative Commons Attribution (CC BY) license (http://creativecommons.org/licenses/by/4.0/).
Share and Cite
MDPI and ACS Style
Miao, C.; Chen, J.; Zheng, X.; Zhang, Y.; Xu, Y.; Du, Q. Soil Water and Phreatic Evaporation in Shallow Groundwater during a Freeze–Thaw Period. Water 2017, 9, 396. https://doi.org/10.3390/w9060396
AMA Style
Miao C, Chen J, Zheng X, Zhang Y, Xu Y, Du Q. Soil Water and Phreatic Evaporation in Shallow Groundwater during a Freeze–Thaw Period. Water. 2017; 9(6):396. https://doi.org/10.3390/w9060396
Chicago/Turabian StyleMiao, Chunyan, Junfeng Chen, Xiuqing Zheng, Yongbo Zhang, Yongxin Xu, and Qi Du. 2017. "Soil Water and Phreatic Evaporation in Shallow Groundwater during a Freeze–Thaw Period" Water 9, no. 6: 396. https://doi.org/10.3390/w9060396
Note that from the first issue of 2016, this journal uses article numbers instead of page numbers. See further details here.