Article

Treated Greywater Reuse for Hydroponic Lettuce Production in a Green Wall System: Quantitative Health Risk Assessment

Faculty of Science and Technology, Norwegian University of Life Sciences (NMBU), P.O. Box 5003, NO-1432 Ås, Norway
*
Author to whom correspondence should be addressed.
Water 2017, 9(7), 454; https://doi.org/10.3390/w9070454
Submission received: 6 May 2017 / Revised: 4 June 2017 / Accepted: 19 June 2017 / Published: 23 June 2017

Abstract

:
The scarcity and pollution of freshwater are extremely crucial issues today, and the expansion of water reuse has been considered as an option to reduce its impact. This study aims to assess the efficiency of an integrated greywater treatment system and hydroponic lettuce production as a part of a green wall structure, and to evaluate the health risk associated with the production and consumption of lettuce through a quantitative microbial risk assessment (QMRA) and a chemical health risk assessment. The study was conducted based on the unique configuration of a source separation system; an on-site greywater treatment system; a green wall structure as a polishing step; and hydroponic lettuce production in the green wall structure. The final effluent from the system was used to grow three lettuce varieties by adding urine as a nutrient solution. Both water samples and plant biomass were collected and tested for Escherichia coli (E. coli) and heavy metals contamination. The system has gained a cumulative 5.1 log10 reduction of E. coli in the final effluent and no E. coli found in the plant biomass. The estimated annual infection risk for Cryptosporidium, Campylobacter, and Norovirus was 10−6–10−8, 10−8–10−10, and 10−10–10−11 respectively. These results indicate that the system attained the health-based targets, 10−6 disability adjusted life years (DALYs) per person per year. Similarly, the health risk index (HRI) and targeted hazard quotient (THQ) results did not exceed the permissible level, thus the chemical health risk concern was insignificant.

1. Introduction

Water scarcity and water pollution are causing serious health and environmental challenges around the world for a large proportion of the world’s population, either because the proper infrastructure is absent, or wastewater is discharged untreated to its recipients. The water, energy, and nutrients in wastewater also represent valuable resources, which are needed to supply a growing population. Future wastewater infrastructure should therefore serve as combined resource recovery factories and wastewater treatment facilities, established as decentralized, semi-centralized, centralized, or combined systems, depending on local needs and constraints. Some regions are facing water stress and groundwater depletion because of population growth, frequent drought occurrence (low rainfall), or in combination with the over exploitation of local groundwater and wastewater being transported far away from the point of water extraction/use. In those areas, local groundwater recharge and reduced water consumption is crucial, and this calls for decentralized or semi-centralized treatment and recovery systems. Systems that are based on source separation have been suggested as an efficient strategy for nutrient recovery and water reuse [1,2].
Source separation of domestic wastewater is a system that provides an opportunity to collect the toilet waste separately, which contains the majority of the nutrients and carbon, but also waterborne pathogens that may constitute a major risk factor unless handled properly. Simultaneously, the system collects greywater, which has a much lower concentration of pathogens than combined domestic wastewater, and constitutes most of the wastewater quantity in households’ wastewater. The source of greywater is kitchen and bathroom sinks, showers, and laundry; whereas blackwater consists of urine, faecal material, toilet paper, and flushing water from the toilet. In addition to the two broad classes, urine or urine with minimal flush water can be collected separately as yellow water [3,4,5,6]. Approximately 90% of the total nitrogen and 80–90% of the total phosphorus in domestic wastewater originates from the urine fraction, which constitutes only 2% of the wastewater volume. Greywater separation from blackwater offers chances to treat most of the wastewater easily using on-site treatment systems to a quality that can be discharged to local water recipients or reused for a non-potable purpose without negative effects on health and the environment if it is treated properly.
The major concern associated with water reuse is the quality of the wastewater in terms of microbial pathogens, heavy metals, organic pollutants, components in pharmaceutical residues, and personal care products, which threaten the public’s health when reused directly with insufficient treatment. This potential threat can be reduced through proper wastewater treatment technologies as well as through efficient utilization systems. One of the most promising strategies to raise the coverage of domestic wastewater reuse as well as to reduce the associated public health risk is the integration of a source separation system with appropriate wastewater treatment technologies and growth systems that are effective, simple to operate, able to consume less energy, environmentally friendly, and low cost (in terms of investment, operation, and maintenance) [7]. The system becomes more effective and robust when the regular treatment system is further integrated with polishing steps like granular filtration. Moreover, the selection and use of less risky irrigation methods for plant growth further reduces public health and environmental risks.
Treated greywater can be utilized for non-potable purposes such as agriculture, flushing toilets, landscaping, and aquifer recharge, thereby addressing the issue of an imbalance between water supply and demand in a given region [8]. Treated wastewater reuse for agriculture is widely applied in the arid and semi-arid areas around the world. Likewise, treated domestic wastewater reuse in urban areas is increasing, especially in large cities [9]. However, a health risk is one of the limitations of utilizing treated greywater for plant production. The health risk associated with treated wastewater reuse for vegetable production and non-potable consumption depends on factors such as the quality of the treated wastewater, the irrigation method used, the time interval between irrigation–harvest–consumption, and producer and consumer habits [10]. Treated domestic wastewater may contain limited amounts of essential nutrients for plant growth, and crop production using such treated wastewater has been challenged by an inadequate supply of nutrients, particularly nitrogen [9]. This could potentially be supplied by the use of source-separated urine as a nutrient solution. The application of an integrated system between treated greywater and source-separated urine for hydroponic crop production could increase the efficiency of the system in terms of utilizing nutrients from the wastewater, maximizing the water’s reuse potential, increasing control over the quality of the water, and reducing the risk of pathogen contamination.
A green wall, also known as a vertical garden, is a plant growth system attached to the walls of buildings that refers to all forms of vegetated wall surfaces. The advancement of green wall technologies provides a broad range of options for designers to realize multiple objectives, and to bring freestanding design features on the interior and exterior of buildings [11]. One of the options is to integrate a building’s infrastructure as a component of on-site greywater treatment, so at the same time green wall plants obtain water and nutrients from the system. The integration of such a treatment system with green wall technology provides many environmental and financial benefits. The green wall provides an additional layer with dual effects, as it acts as an insulator reducing the need for cooling energy during summer and heating energy during winter, respectively. It is also aesthetically appealing, and improves air quality by reducing the CO2 level and increasing oxygen. Moreover, a green wall designed for urban agriculture can bring various benefits, such as providing the basis for healthier community interaction (community gardening), and improving access to fresh food [11,12,13].
Greywater, however, may contain various microbial pathogens and hazardous chemicals depending on the nature of the raw greywater and the treatment’s efficiency. Irrigation with wastewater for vegetables and food crops may result in the bioaccumulation of heavy metals, and at the same time it may cause the contamination of plant products with microbial pathogens. Various health problems can occur and develop due to the consumption of contaminated vegetables and the consumption of food contaminated with heavy metals, and this may cause the disruption of various biological processes in the body, leading to a decreased immunological defence, growth retardation, disability associated with malnutrition, and cardiovascular, neurological, kidney, and bone diseases [14,15]. Quantitative microbial risk assessment (QMRA) models and chemical health risk assessment (CHRA) approaches will enable us to evaluate the adverse health effects of operational activities and the consumption of vegetables, and support risk management decisions.
Quantitative microbial risk assessment (QMRA) models have been used to evaluate the health risk associated with the treated wastewater irrigation of vegetables and food crops [10,16,17,18,19,20,21]. On the other hand, the health risk of heavy metals bioaccumulation in vegetables and food crops irrigated by untreated and treated wastewater has been evaluated in different studies [22,23,24,25,26]. This study was conducted in a unique configuration of an on-site greywater treatment system, granular filtration as part of a green wall structure, and a hydroponic lettuce production system using urine as a nutrient solution. The aim of this study is to assess the efficiency of an integrated system, and to evaluate the health risk associated with the production and consumption of lettuce through a quantitative microbial risk assessment (QMRA) and a chemical health risk assessment (CHRA) approach.

2. Materials and Methods

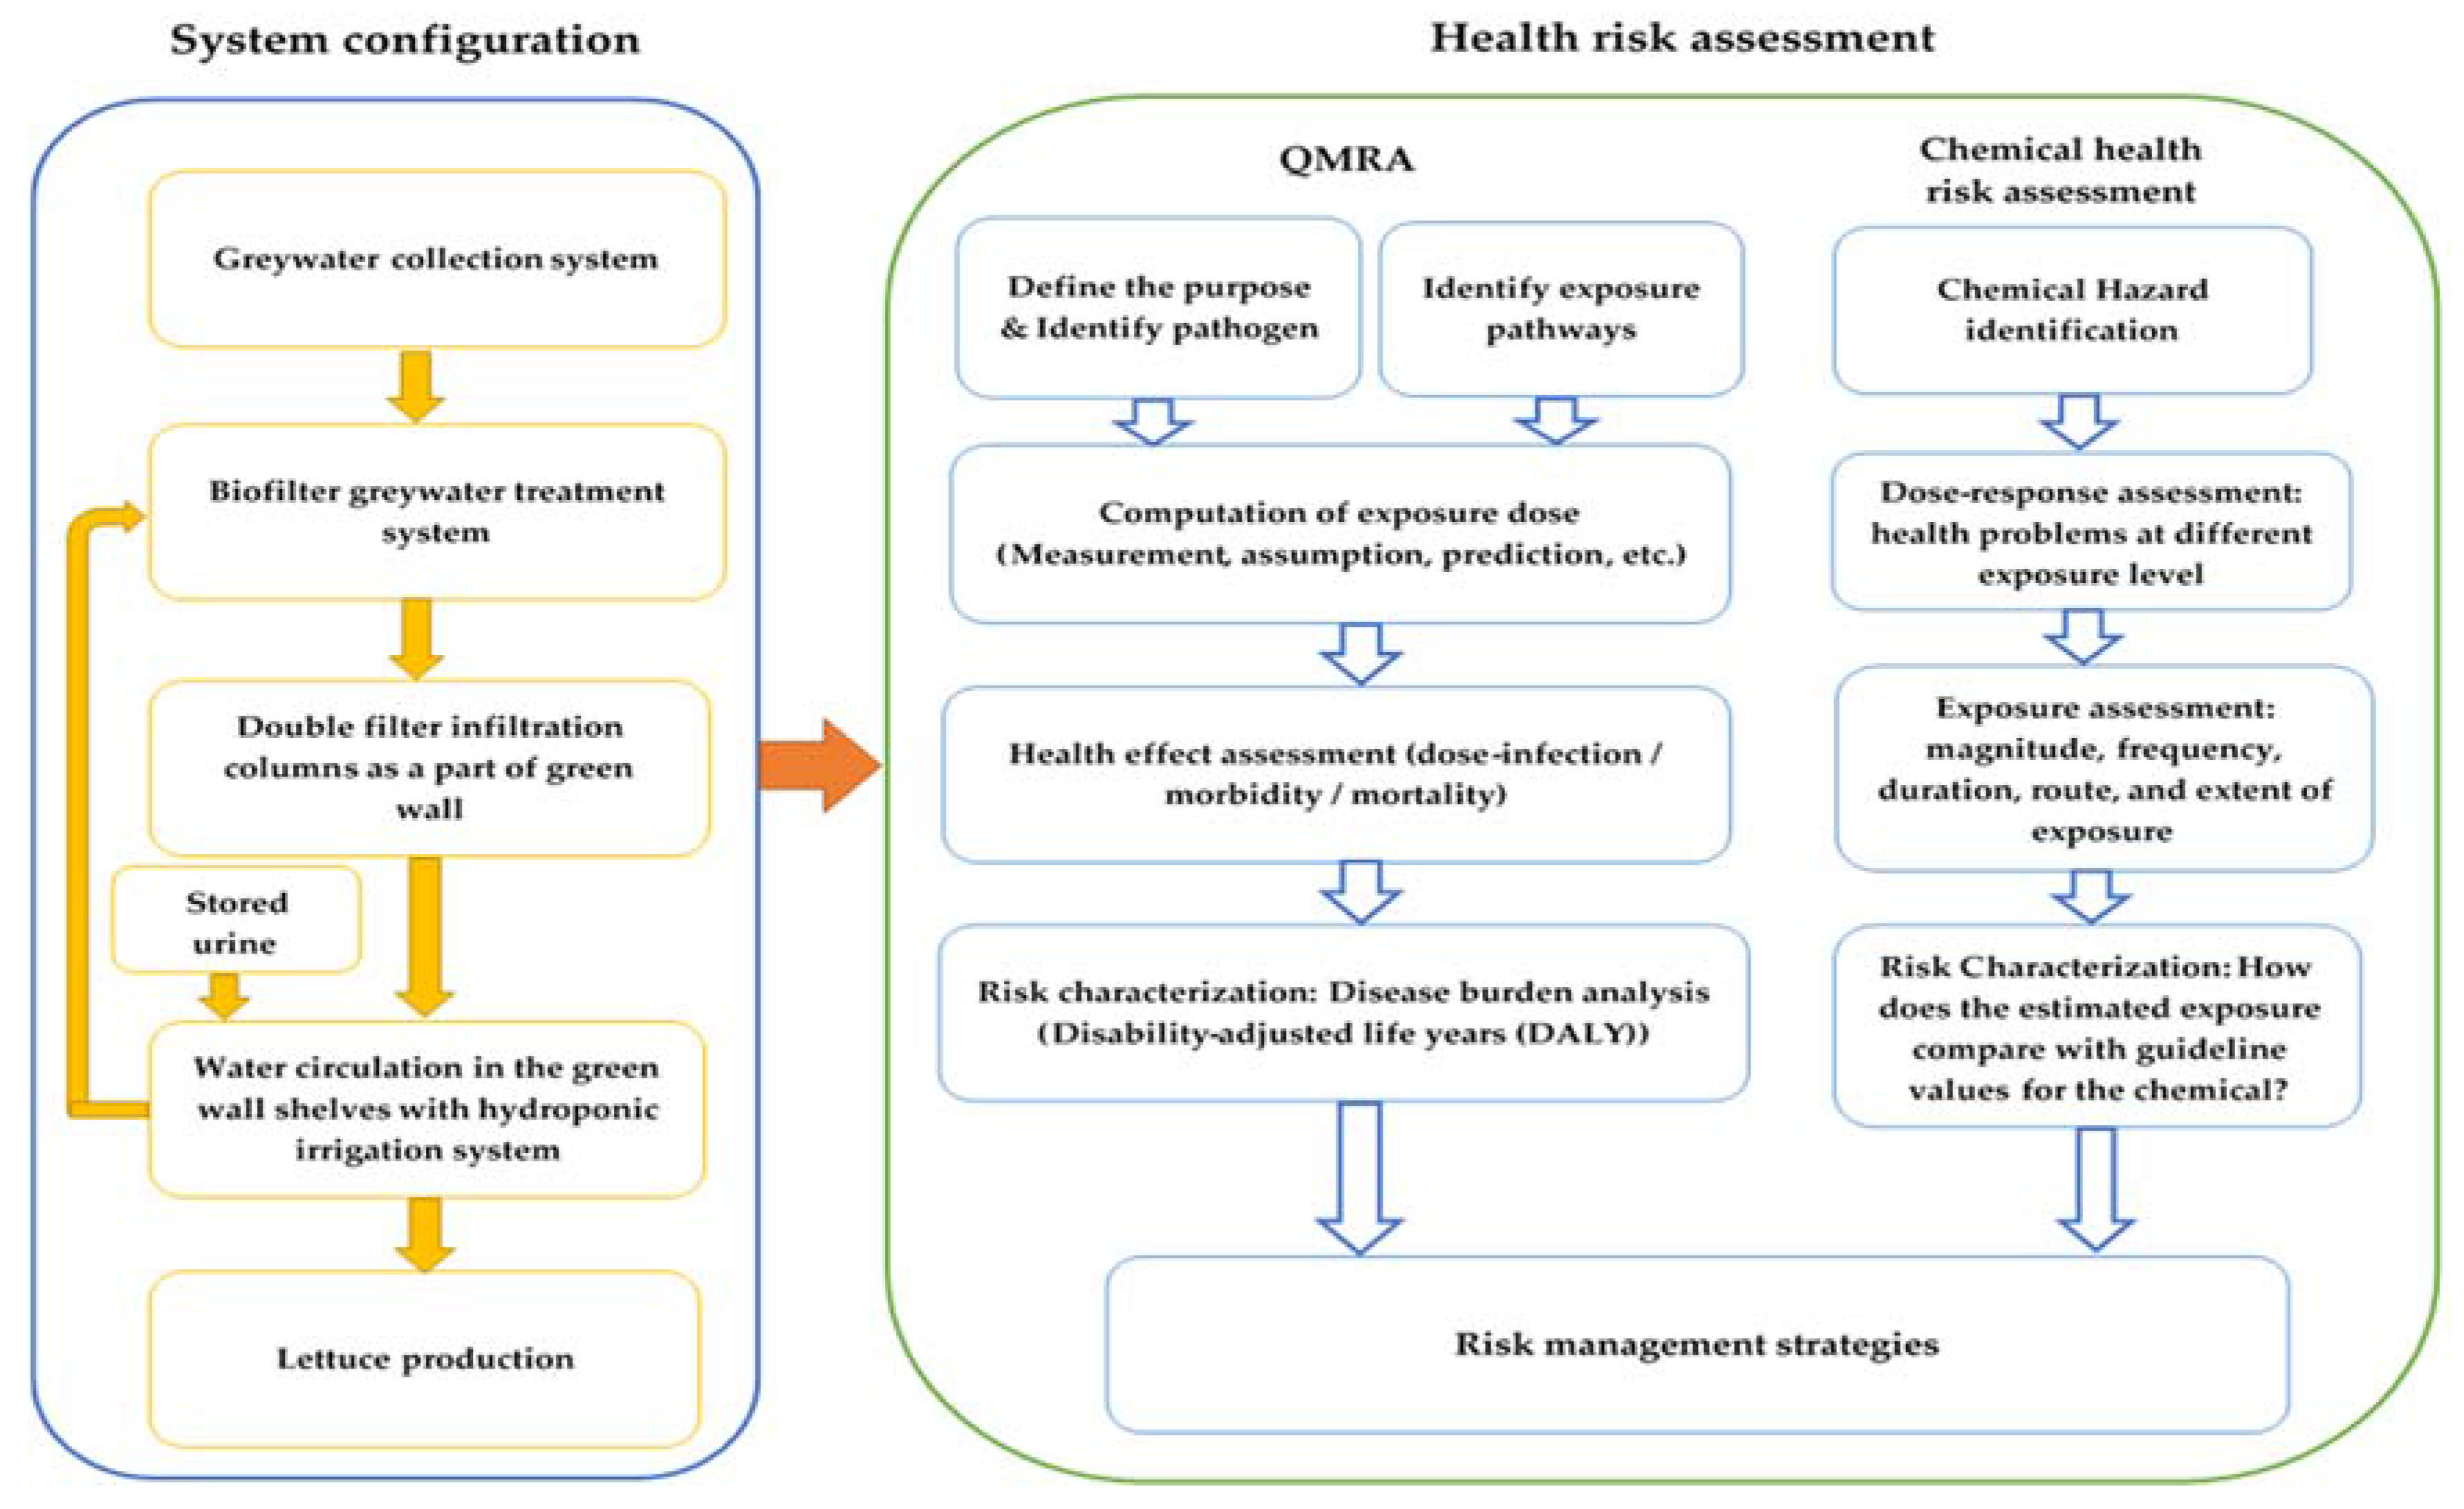
2.1. System Configuration

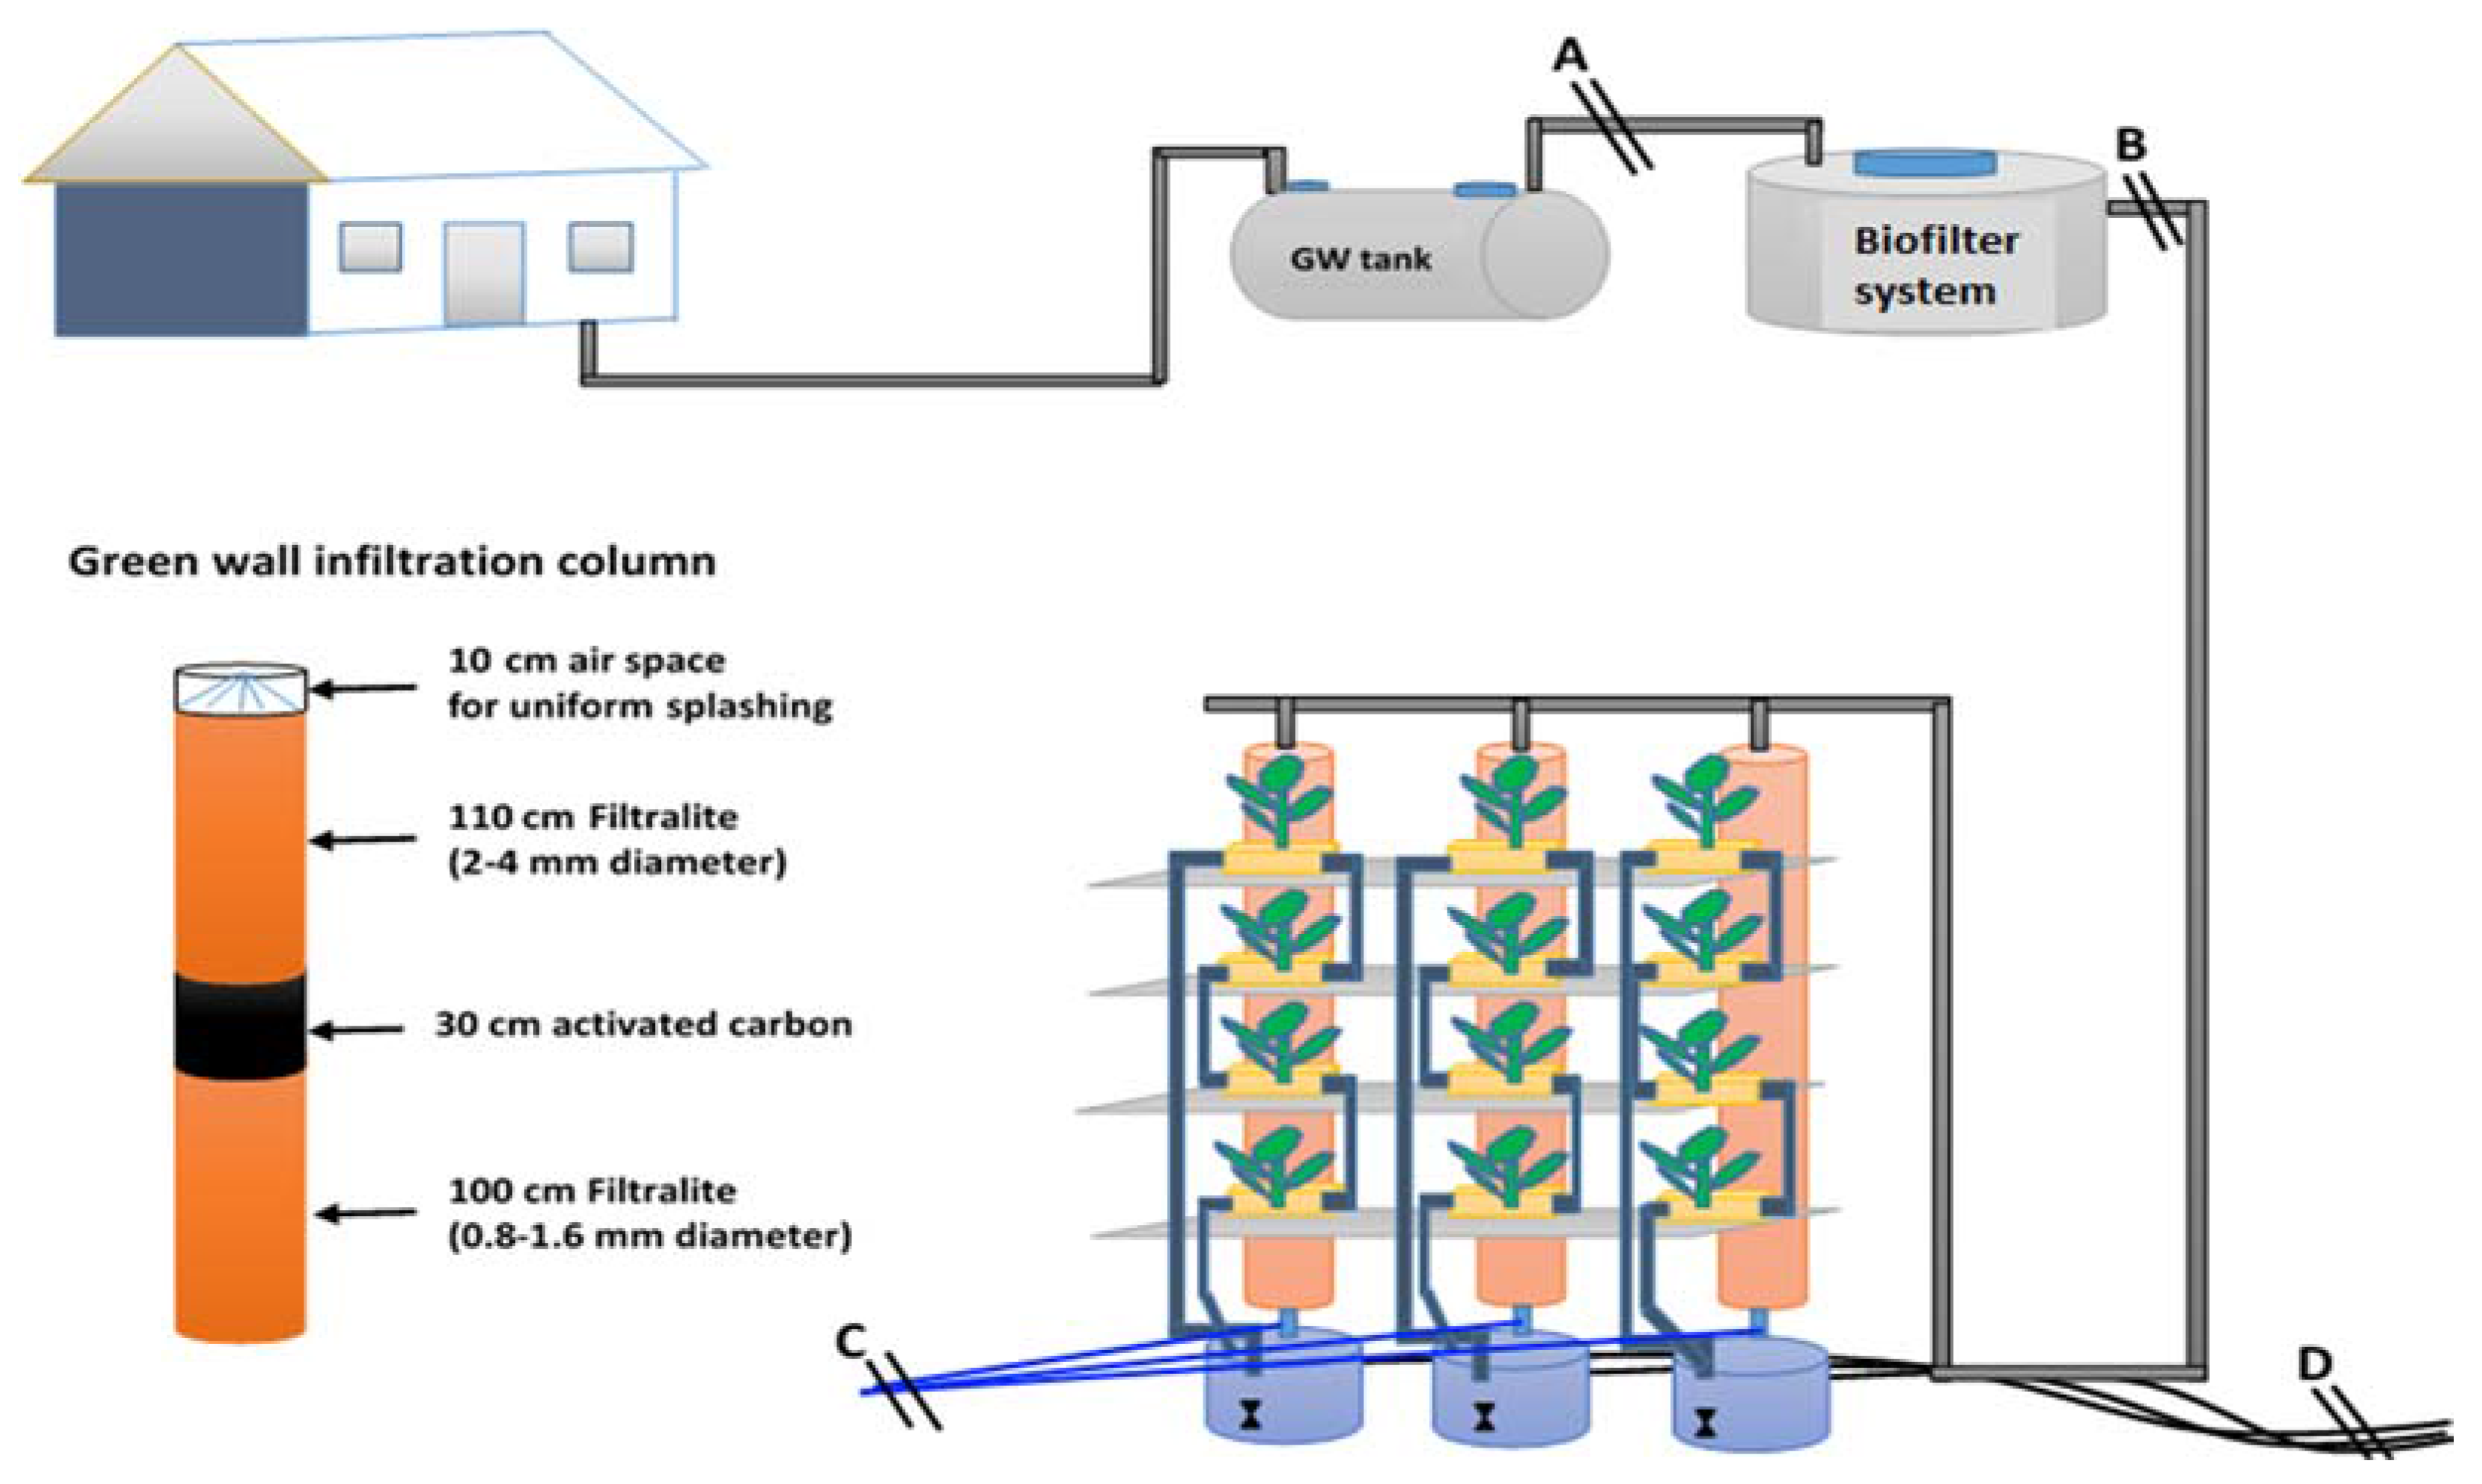
The source separation for wastewater management system was established in 1997 at the Norwegian University of Life Sciences’ (NMBU) student dormitory, which serves 48 students at Kaya, Ås, Norway. The greywater system collects wastewater from washbasins, showers, kitchen sink, and laundry, whereas the blackwater system collects toilet waste separately. Both systems are pumped into the laboratory (fløy 4) through a separate pipeline, for different experiments. This source separation system is described in detail in [27]. In this study, the greywater was first treated with a package greywater treatment plant (biofilter system), which encompasses a sequence of a primary settler, an unsaturated fixed-film biofilter, and a secondary clarifier. Furthermore, the effluent from the biofilter system was polished by an infiltration system. Three filtration columns (2.5 m in height and 31.5 cm in diameter) as a part of a green wall were constructed in order to polish the effluent discharged from the greywater treatment plant (GWTP). The filtration columns were constructed with three layers: the 1 m bottom layer is 0.8–1.6 mm diameter Filtralite, the 0.3 m in the middle consists of granular activated carbon, and the 1.1 m on top of the activated carbon is 2–4 mm diameter Filtralite. The top 10 cm is air space used to feed the water uniformly from the top of the column by using nozzles. The columns were run in parallel with similar intermittent loading rates of 2 min followed by a rest period of 8 h, and with a daily loading rate of 0.58 m3·m−2·d−1. The effluent from the filtration columns collected in the bucket at the bottom of the column was used to grow lettuce hydroponically by adding human urine—which was stored for three months—as a nutrient solution. The plantation pots were mounted on the green wall’s shelves, and irrigated with the treated greywater from the buckets by using small submersible pumps for circulation (Figure 1).

2.2. Lettuce Pots Alignment and Hydroponic System

A flush and drain hydroponic system was designed with perlite as a growth medium. Perlite is a volcanic porous lightweight and inert material, which is commonly used for hydroponic plant growth. Three lettuce varieties, namely: (a) Lactuca sativa ‘Lobjoits Green Cos’; (b) Lactuca sativa ‘Red Salad Bowl’ and (c) Lactuca sativa ‘Australische Gele’, were used for this study. Each plantation container holds eight pots, and each pot contained three lettuce plants. The three lettuce varieties were mounted on the top, middle, and bottom shelves respectively. The first green wall column’s effluent mixed with urine with the proportion of 0.3% for the first three weeks, and then increased to 0.6% until harvesting time. The second column’s effluent mixed with 0.15% of urine for the first three weeks, and then increased to 0.3% until harvesting time. The third column’s effluent directly irrigated from the treated greywater without urine. Each mix batch was circulated every 30 min using small-submerged pumps controlled by programmable logic controller (PLC). The desired urine concentration was added into the two columns every three days.

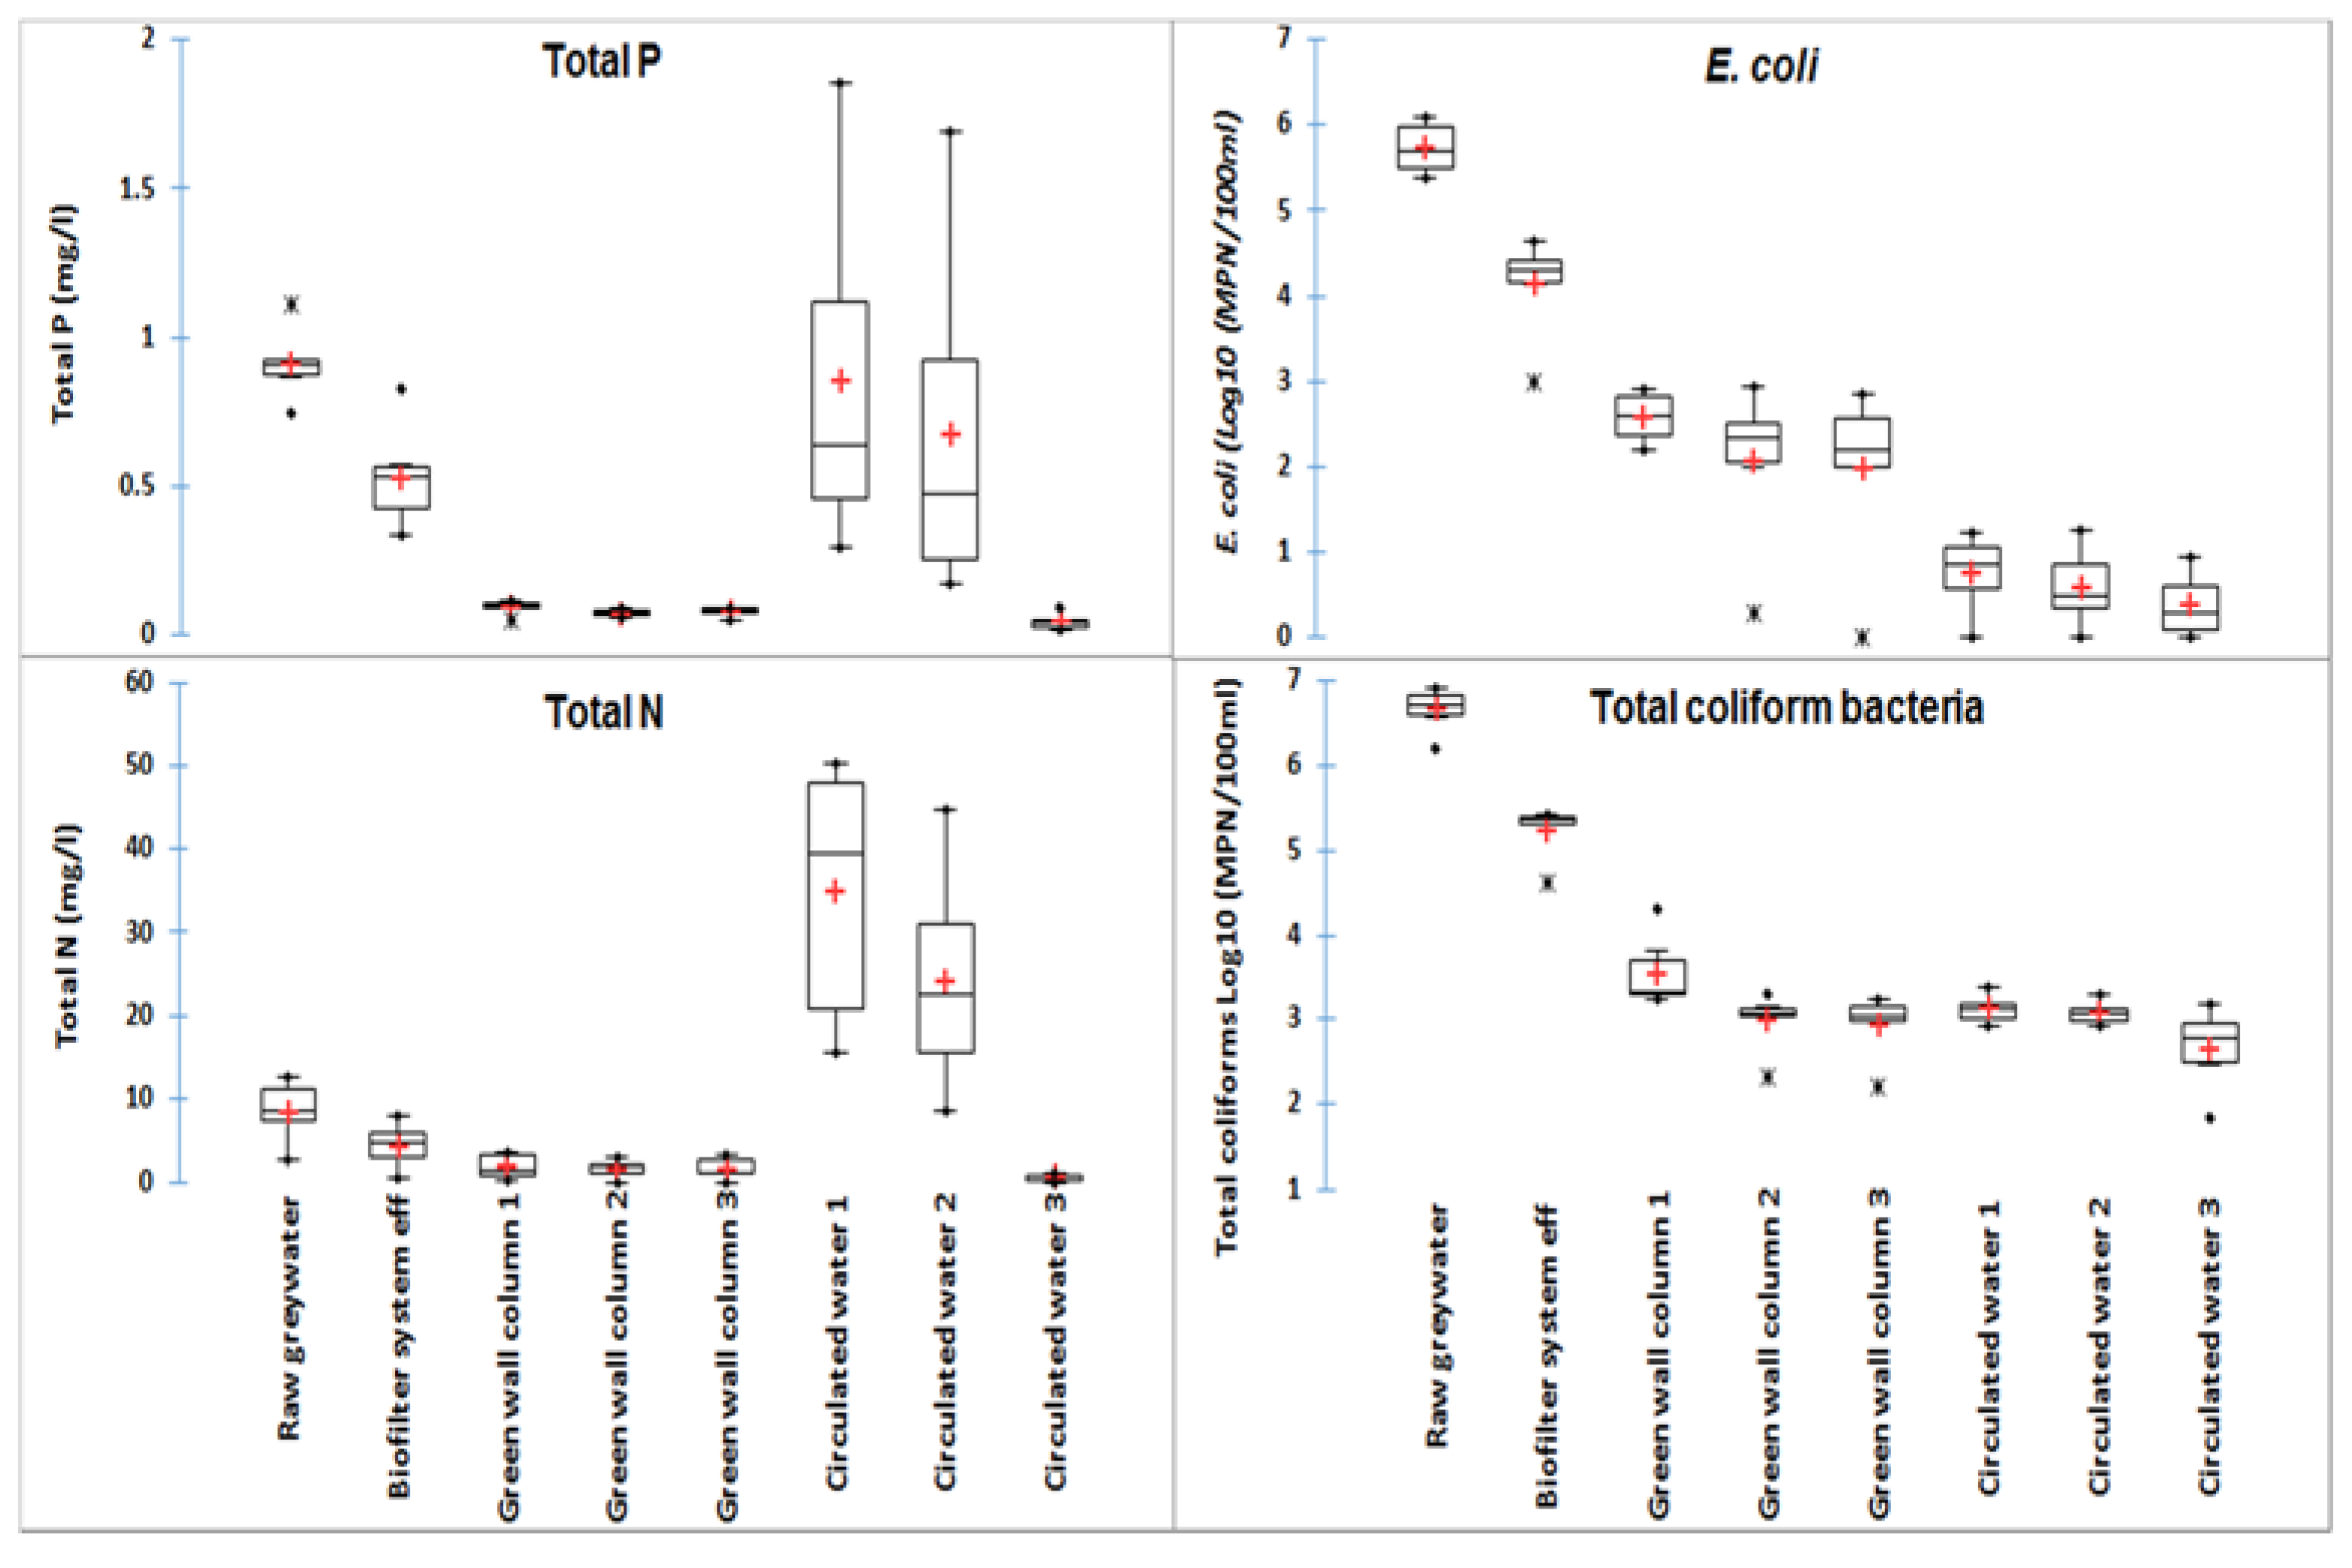
2.3. Water Sample Collection and Lab Analysis

Water samples were collected every two weeks from the raw greywater, the biofilter system’s effluent, the filtration column’s effluent (green wall), and the circulated irrigation water. The samples were collected in 1 L bottles and analyzed within an hour. The water samples were analyzed for total phosphorous (P) and total nitrogen (N) using spectrophotometric test kits (Hach-Lange, Düsseldorf, Germany); total coliforms (TC) and Escherichia coli were quantified using the most probable number method (MPN) with Colilert-18 (IDEXX, Westbrook, ME, USA) and Quantitray 2000 (IDEXX) according to ISO 9308-2:2012. In addition, grab samples were collected from the same position to analyze the heavy metals by using inductively coupled plasma mass spectrometry (ICP-MS, Oban, UK).

2.4. Plant Sample Collection and Lab Analysis

Seven to ten replicates of the lettuce plants, from each of the treatment plots, were collected for the plant growth examination and the heavy metal bioaccumulation analysis. For microbial assay, 25 g of composite lettuce samples from each of the treatment plots were collected and put into stomacher plastic bags containing 225 mL of sterile buffered peptone water (0.1%), homogenized by using a stomacher for 1 min. E. coli was enumerated from the homogenised supernatant using the most probable number method (MPN) with Colilert-18 (IDEXX) and Quantitray 2000 (IDEXX) according to ISO 9308-2:2012.

2.5. Hydroponic Nutrient Uptake and Lettuce Growth Analysis

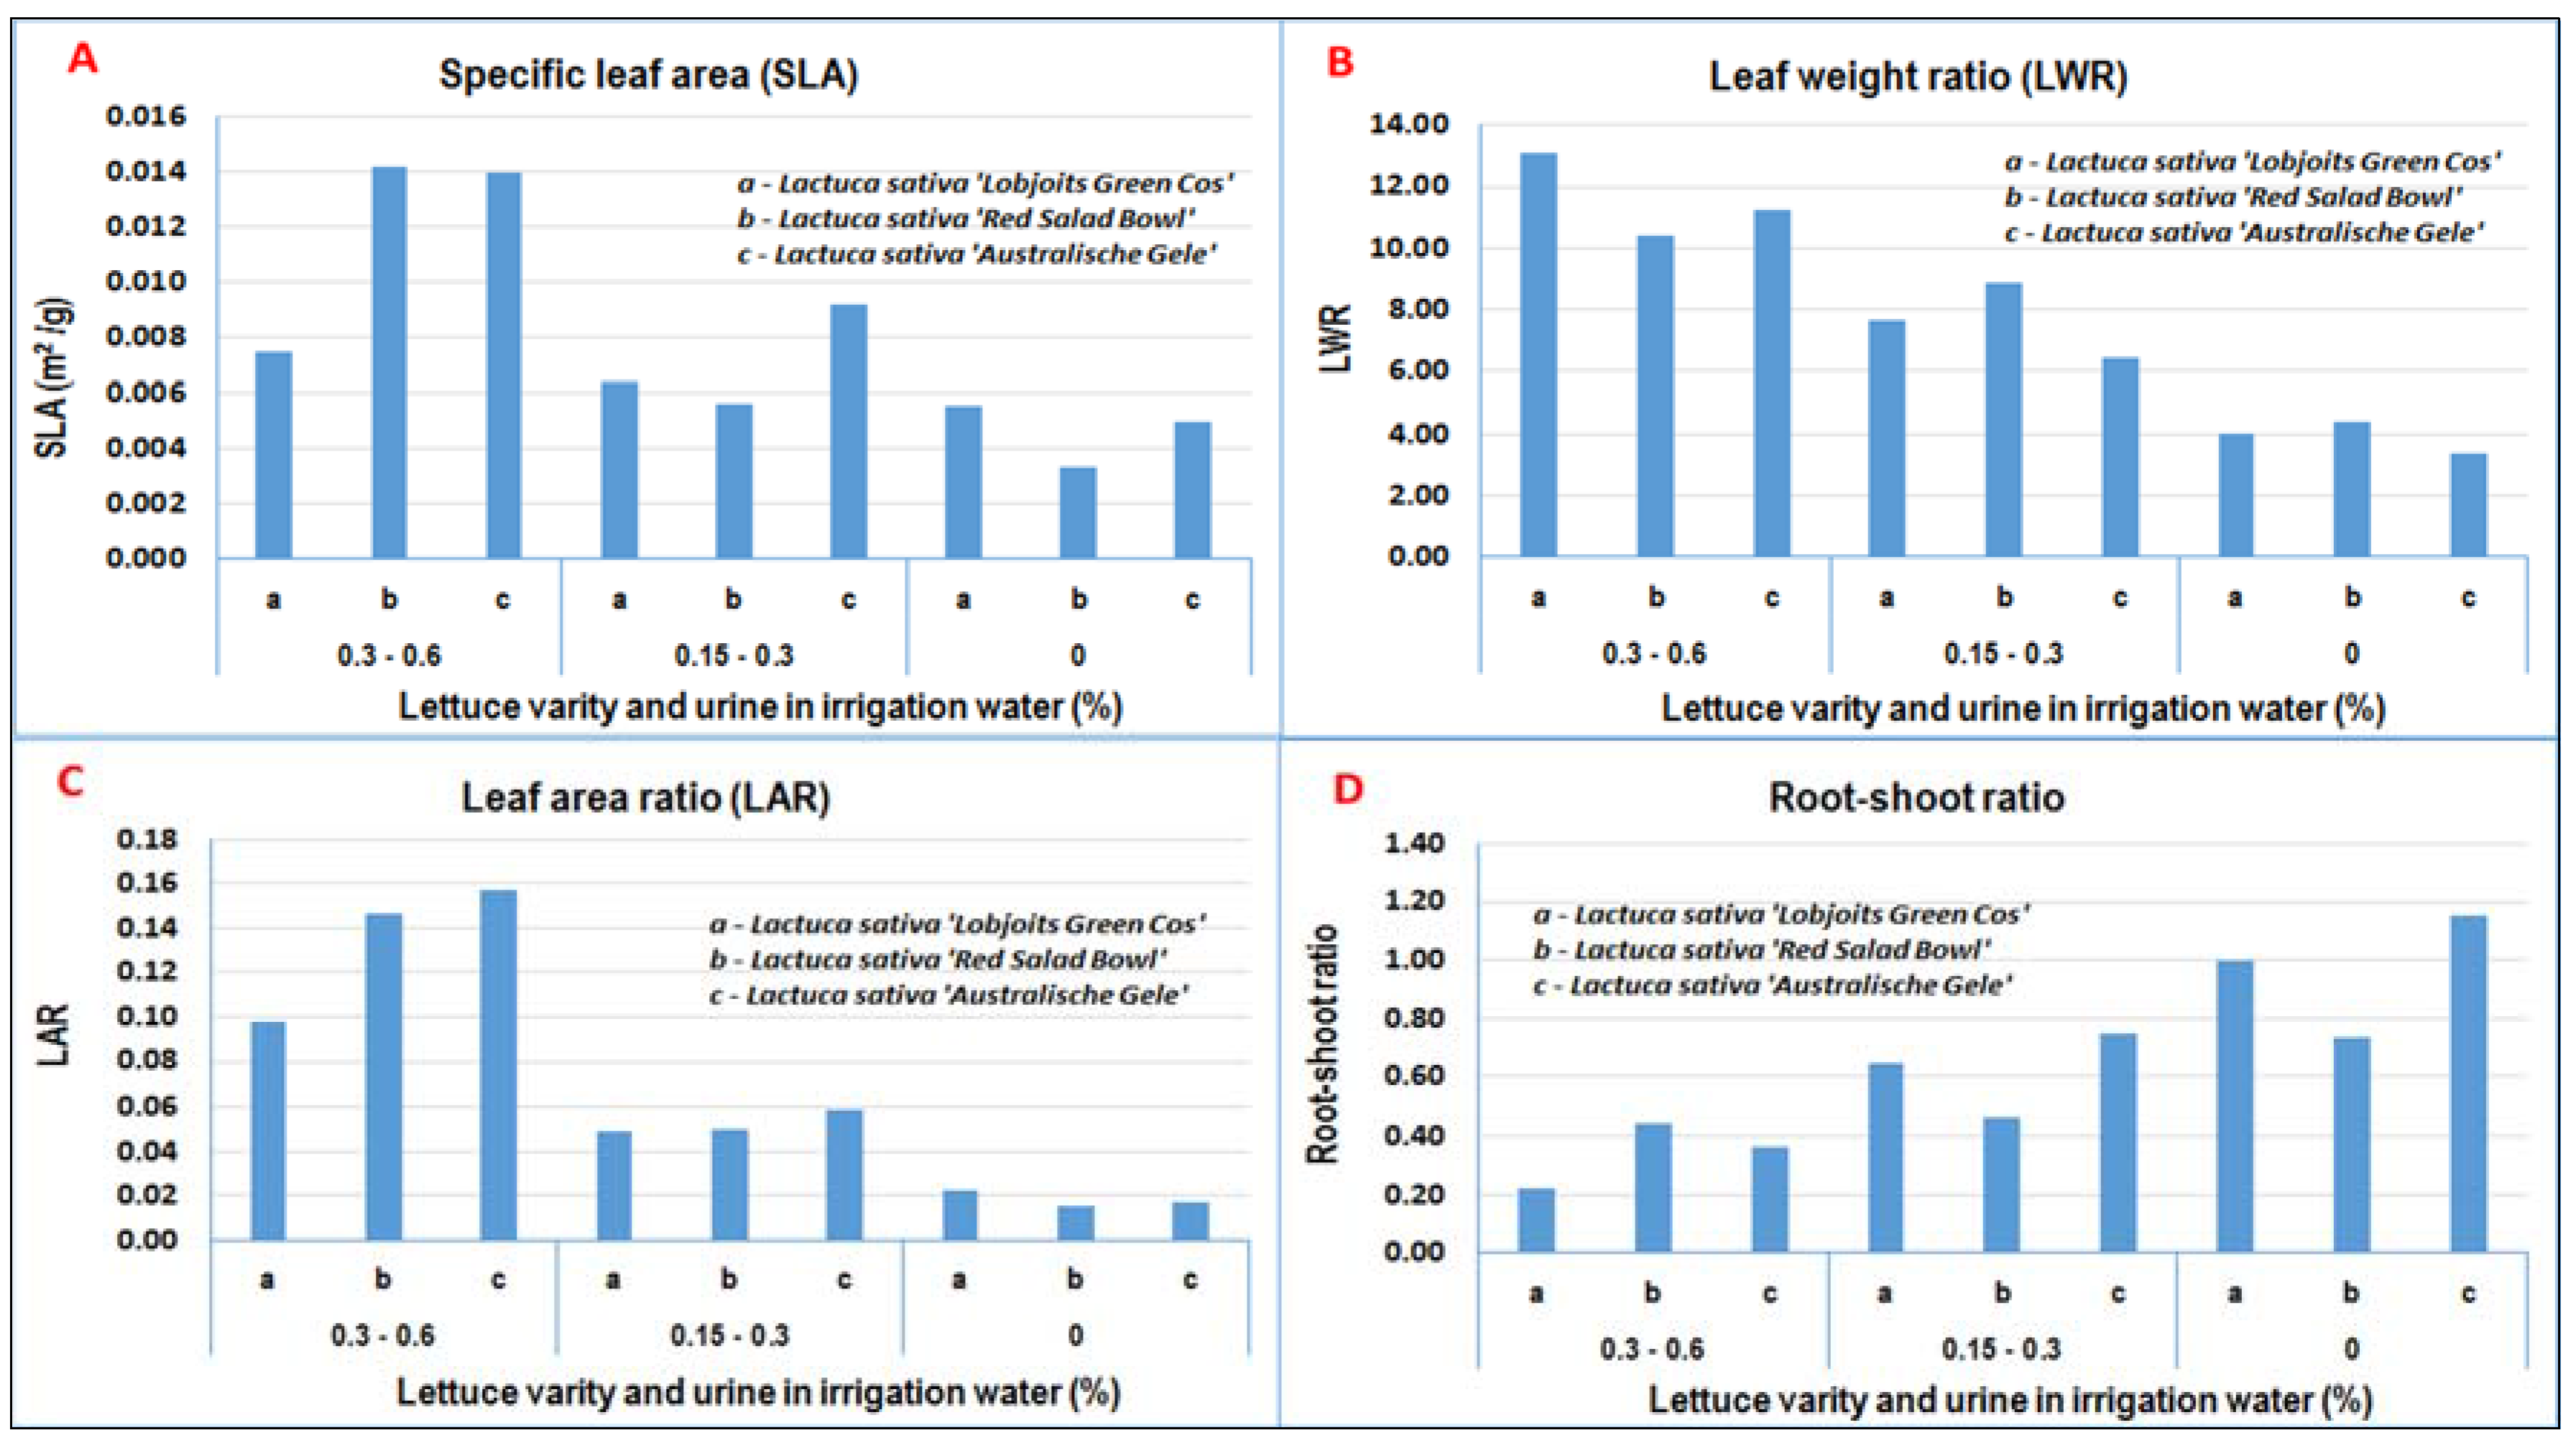
Nitrogen (N), phosphorus (P), and potassium (K) are essential elements in plant nutrition and their presence in the plant tissue was analyzed using inductively coupled plasma (ICP) spectrometry. Moreover, the lettuce growth analysis was performed using a plant growth index to describe the performance of the lettuce plant grown under this experimental set up. These plant growth indexes are:
(a)
Specific leaf area (SLA): the SLA is the surface area of a fresh leaf divided by its oven dry mass. It reflects an essential trade-off in plant functioning between a rapid production of biomass in the case of high SLA and an efficient conservation of nutrients in low SLA. Moreover, species in permanently or temporarily resource-rich environments tend to have a higher SLA than do those in resource-poor environments [28,29].
(b)
Leaf weight ratio (LWR): the LWR is the ratio of total leaf dry weight to the total dry weight of the plant. It describes the leafiness of the plant on a dry weight base, and measures the distribution of dry materials between the leaves and the rest of the plant [30].
(c)
Leaf area ratio (LAR): the LAR is computed from the photosynthetic surface area per unit dry weight of a plant. It is a measure of the efficiency with which a plant deploys its photosynthesis and respiration per unit of its biomass [30].
(d)
Root-shoot ratio: the root-shoot ratio is the ratio of the dry weights of the root system and aerial part of a plant. It is an index of plants’ response to their environment through a growth balance between the root and the shoot of the plant. When nutrient availability increases, plants allocate relatively less to their roots, which means that less effort is required to acquire this resource. An alternative view is that relatively greater root growth in response to shortages of nutrients or water could maximize a plant’s probability of capturing those resources [30,31].

2.6. Statstical Analysis

Two-way analysis of variance ANOVA was conducted to compare the means of shoot fresh biomass (as a growth performance indicator) at different levels of urine content in irrigation water and lettuce variety. Factors were considered significant when their p-values were below 0.05.

2.7. Health Risk Assessment

Both quantitative microbial risk assessment (QMRA) and chemical health risk assessment (CHRA) approaches were applied to evaluate the health risk of the microbial contamination and heavy metal bioaccumulation associated with reusing treated greywater for lettuce production (Figure 2).

2.7.1. Quantitative Microbial Risk Assessment (QMRA)

Given the probability of having a pathogen-infected person in the system, the study included a single reference pathogen from each group of enteric bacteria, viruses, and protozoa, and followed the water harmonized QMRA approach, which includes problem formulation, exposure assessment, health effect assessment, and risk characterizations.
Problem formulation: the main purpose of this study is to evaluate the health risk associated with the operational activities for lettuce production and consumption in terms of achieving health-based targets, which require that 10−6 disability adjusted life years (DALYs) per person per year is not exceeded. The study intended to address enteric pathogens that may be present in greywater. For this purpose, reference pathogens were selected from each of the three pathogen groups. For protozoa, Cryptosporidium was selected, as it has high infectivity, is resistant to disinfection units, and is one of the most important waterborne human pathogens. For bacteria, Campylobacter was selected, as it is the most common cause of bacterial gastroenteritis. For viruses, Norovirus was selected, which is a very contagious virus that can infect anyone and is found in abundance in sewage systems.
Exposure assessment: the main exposure pathway considered in this study is operational activities in relation to lettuce production and raw lettuce consumption. The operational activities in relation to lettuce production that can potentially expose the operator to microbial pathogens are routine ingestion and accidental ingestion, assumed to be 0.0001 liter per event and 0.001 liter per event, respectively. The exposure dose, on the other hand, depends on the microbial quality of the circulated irrigation water. Exposure from lettuce consumption was quantified using the equation:
E x p o s u r e   D = C × v × q
where exposure D is the mean dose per event; C is the concentration of pathogens in the circulated water applied to the plant through the hydroponic irrigation system (organism·L−1); v is the volume of irrigation water in contact with the lettuce (L·g−1), and the assumed value is based on observation during harvesting; and q is the quantity of lettuce consumed per event.
Health effects assessment: the two important pathogen-specific factors for the risk assessment are the dose-response relationship and the illness per infection, assuming that the health end-point in this study is illness. Therefore, the dose-response models recommended for the reference pathogens to assess the probability of infection are shown in Table 1. In addition, since the probability of illness is often viewed as independent of dose, given that infection has occurred the estimated values of the probability of illness for a given infection of Cryptosporidium, Campylobacter, and Norovirus are 0.39, 0.33, and 0.73, respectively [32,33,34].
Risk characterization: the final step in this risk assessment approach is to determine the magnitude of the risk by integrating information from the problem formulation, exposure assessment, and health effect assessment. In this study, the computed health risk was based on the cumulative greywater treatment efficiency, the volume of routine and accidental ingestion of treated greywater during operational activities, and the volume of consumed lettuce. The probability of infection per exposure event was taken from the dose-response relation and adjusted to reflect a yearly risk of infection and illness by estimating the frequency of exposure per year. The equations used for risk characterization in this study are listed in Table 2.

2.7.2. Heavy Metals Health Risk Assessment

Metal pollution: heavy metals bioaccumulation may differ in different crops depending on the environment they are produced in. In order to measure the combined effect of all of the expected heavy metals, the Metal Pollution Index (MPI) is commonly applied. In addition, the MPI was used to normalize and compare the total metal content between the different plant varieties and treatment levels as proposed by [35].
M P I = [ M 1 × M 2 × M 3 . M j ] 1 / n
where M is the mean concentration of metal j (mg/kg dry wt); and n represents the number of heavy metals in the examined crop.
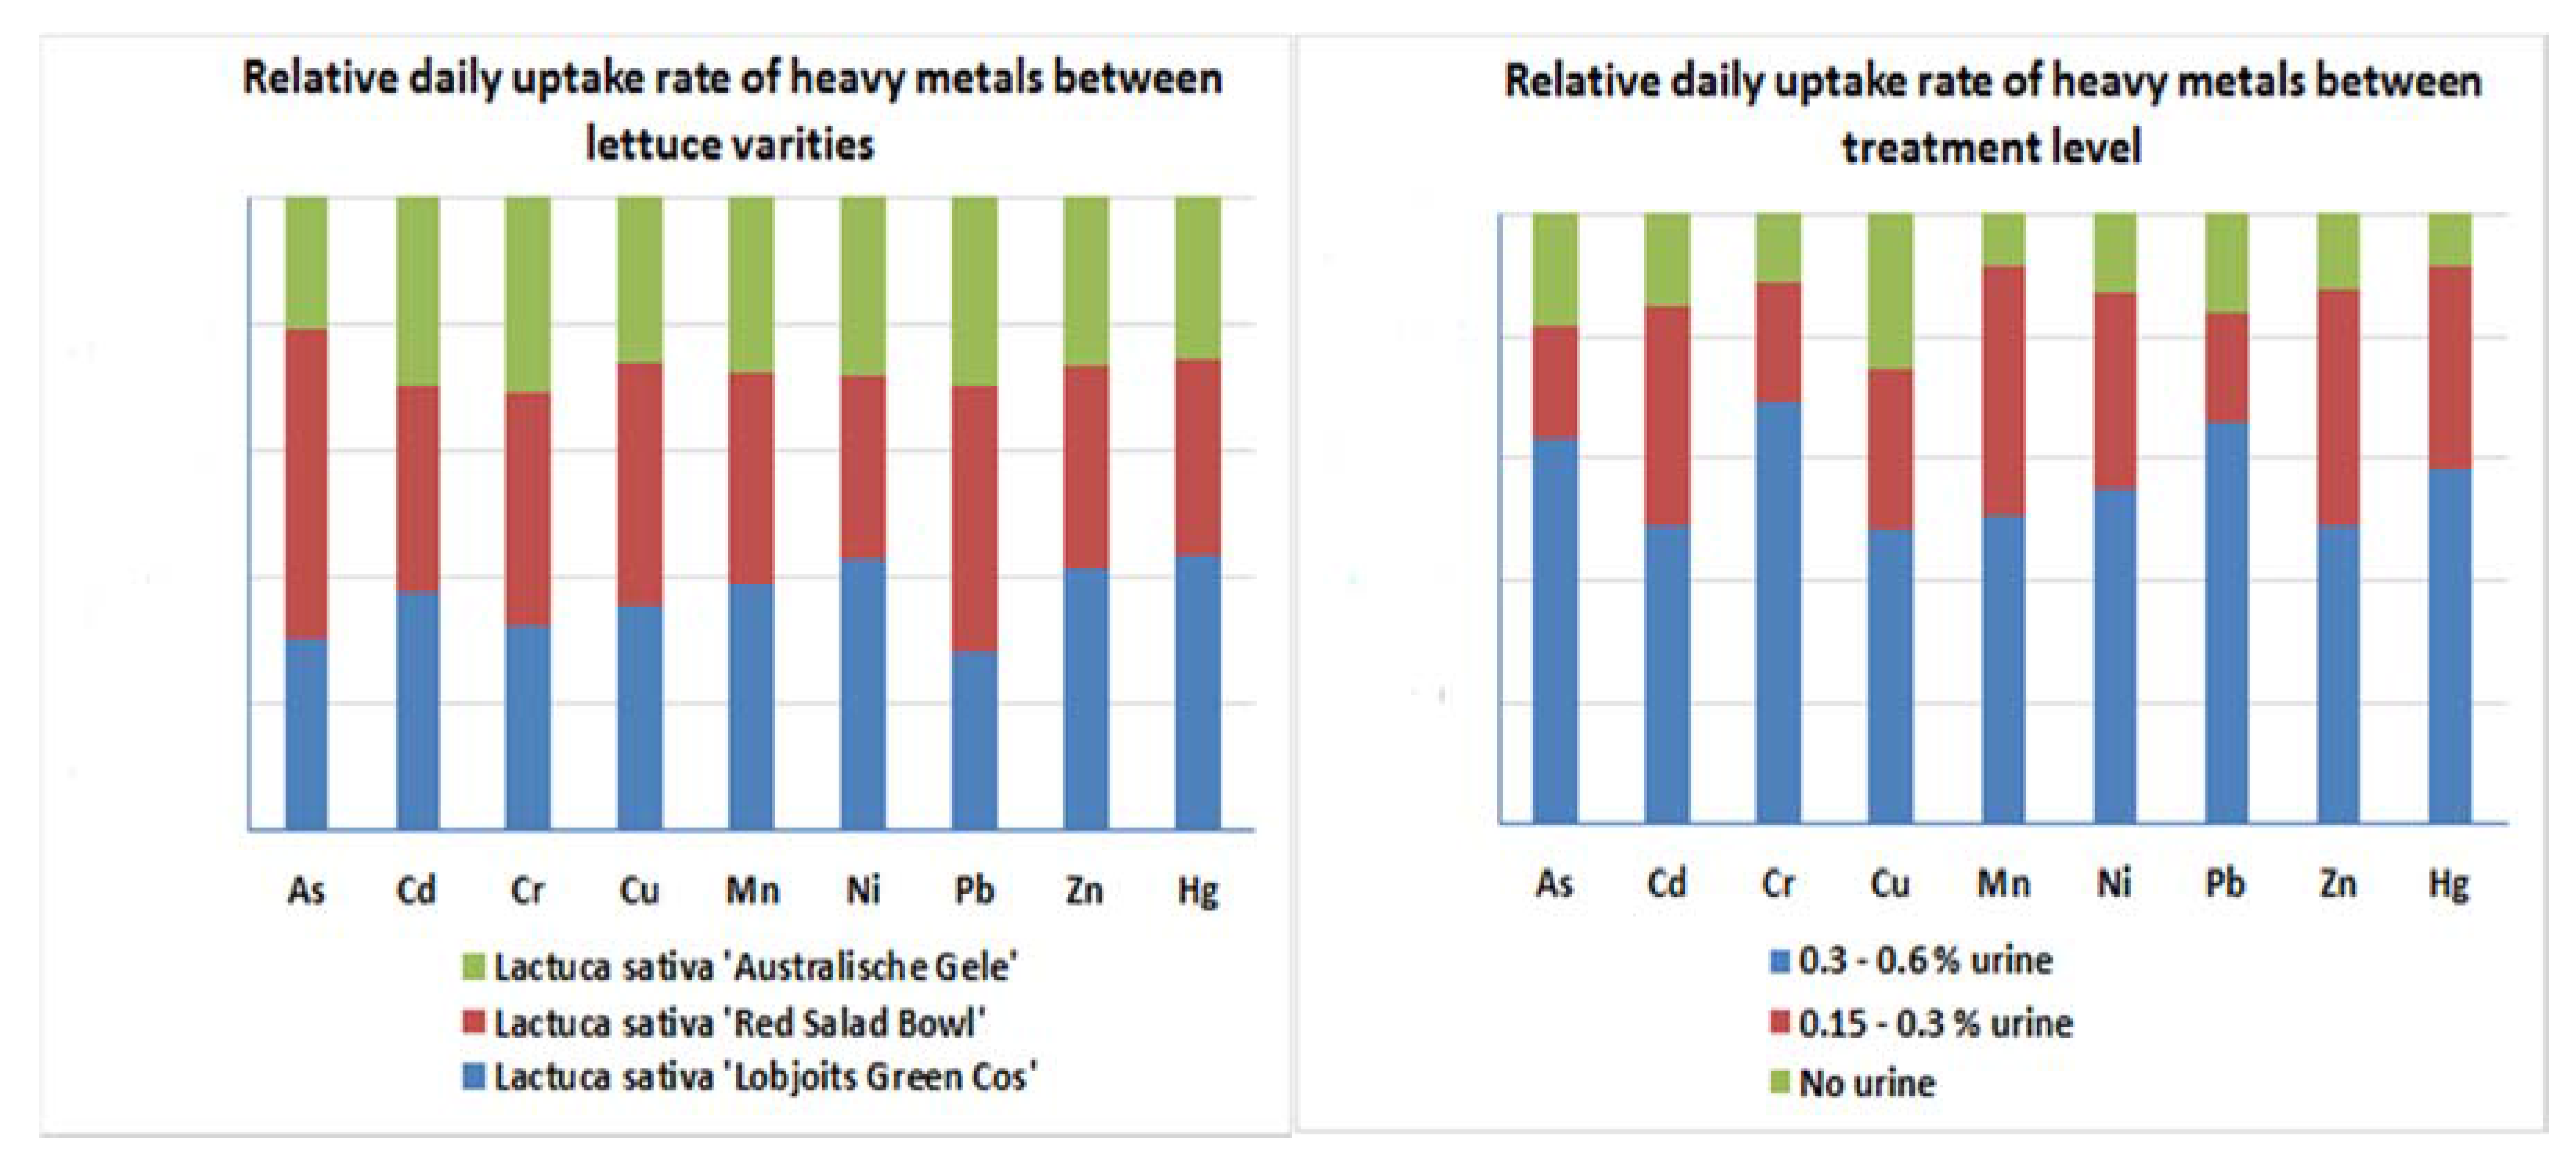
Plant uptake rate of heavy metals: a number of factors can affect a plant’s uptake mechanism for heavy metals. These factors are the plant’s species, properties of the plant’s growth medium, root growth, vegetative growth, the bioavailability of the metal in the water phase (which depends on the retention time of the metal), and the interaction with other elements and substances in the water [36]. The daily heavy metals uptake rate across the lettuce varieties for each treatment level was described by the equation:
D U R i = C m T × B M p
where D U R i is the average daily uptake rate of heavy metals, normalized by the dry biomass of lettuce variety i (µg/day); C m is the concentration of heavy metals in the lettuce tissue (µg/g); T is the total growth time (days); and B M p the dry plant biomass (g).
Daily intake rate (DIR): one of the exposure pathways of heavy metals is through the ingestion of vegetables, which was determined by using a daily intake rate (DIR) (mg/kg·day). The DIR estimates the average daily loading of metal into the body system of a specified body weight of a consumer. The daily intake of metals depends on both the heavy metals’ concentration and the amount of vegetables consumed. Moreover, its effect depends on the body weight of the consumer. The DIR is computed using the equation:
D I R = C m ×   C f   x   I R B W
where Cm is the heavy metal concentration in the vegetables (g/kg); Cf is the conversion factor that converts fresh lettuce weight to dry weight (our conversion factor is 0.065); IR is the daily intake of vegetables (g/day), assumed to be 0.05 kg/day; and BW is the average body weight, assumed to be 70 kg for this study.
Health risk index (HRI) is the ratio between the daily intake rate and the reference dose ( R f D ) mg/(kg·day) that expresses the health risk of non-carcinogenic effects [37], and is described by the equation:
H R I = D I R R f D
where DIR is the daily intake rate; and R f D is the reference dose expressed as an oral dose per kilogram of body weight, which is an estimate of the lowest daily human exposure that is likely to occur without an appreciable risk of toxicity for non-cancerous effects during a lifetime [38]. HRI < 1 indicates that the exposed population is safe from the health risk that comes from heavy metal consumption.
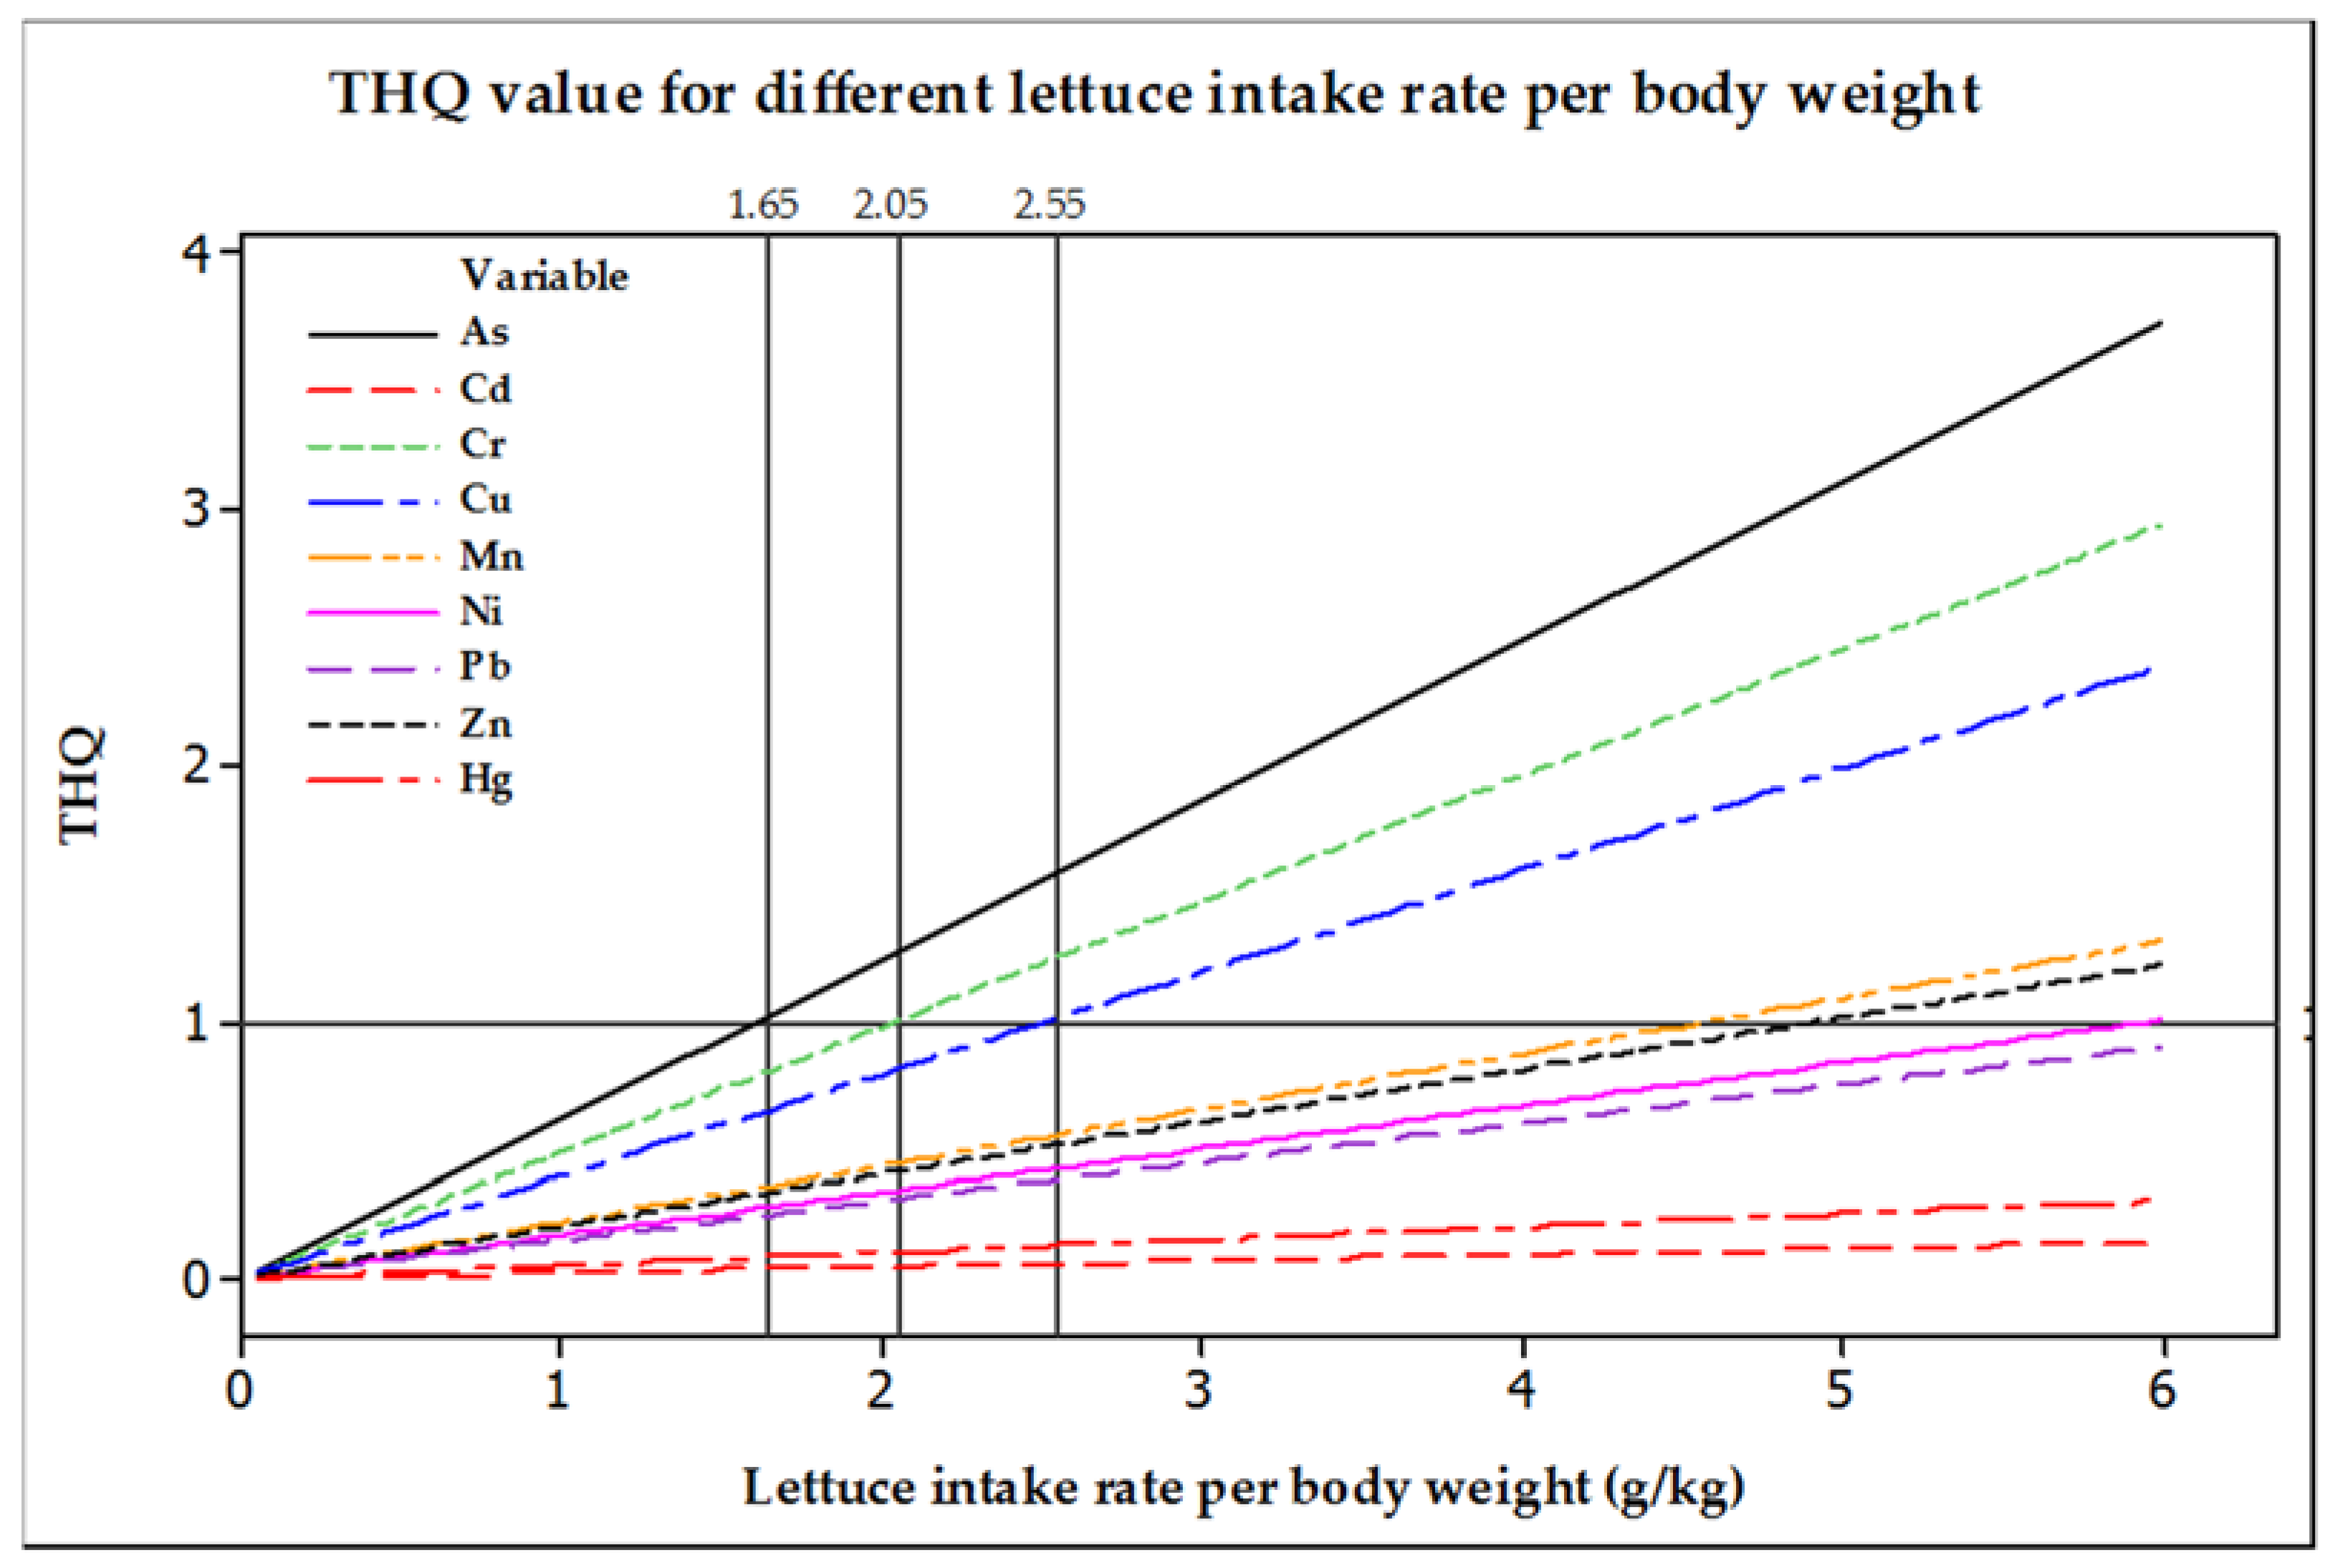
Targeted hazard quotient (THQ) is a ratio between heavy metal concentration and the oral reference dose, weighted by the duration and frequency of exposure, intake rate, and body weight [37]. The THQ parameter is a dimensionless index, and indicates a level of concern but does not measure the risk. THQ < 1 indicates that the exposed population to heavy metals through lettuce consumption is unlikely to experience visible adverse health effects. THQ values between 1 and 5 consider the exposed population to be at a certain level of health risk concern. The THQ is computed by the formula:
T H Q = E F × E D × I R × C × 10 3 R f D × B W × T A
where EF is exposure frequency (days per year); ED is the exposure duration (years, equivalent to an average lifetime); IR is the vegetable ingestion rate (g per person per day); C is the metal concentration in lettuce (mg·Kg−1); BW is the average body weight (kg); and TA is the average exposure time for non-carcinogens (days per year × exposure duration). The average body weight of a human is different from region to region, and for this study the average body weight of an adult was assumed to be 70 kg based on the literature [39], and also the daily lettuce consumption was assumed to be 50 g. In addition, the exposure frequency and duration were assumed to be 104 days per year and 70 years life expectancy, respectively.

3. Results

3.1. Irrigation Water Quality and Greywater Treatment Efficiency

The raw and treated greywater’s quality was monitored every other week, from the first day of the planting of the lettuce until harvesting, and the results are shown in Figure 3. Based on the microbial water quality monitoring, the greywater treatment efficiency of the barrier structures in the system varied. The reduction of E. coli in Log10 MPN/100 mL was 1.6, 1.9, and 1.6 for the biofilter system, green wall filtration column, and circulated irrigation water, respectively. Therefore, the system has gained a cumulative reduction of E. coli of about 5.1 log10 MPN/100 mL in the final effluent. In addition, the reduction of total coliform bacteria was 1.4, 2.1, and 0.2 Log10 MPN/100 mL for the biofilter system, green wall filtration column, and circulated irrigation water respectively, resulting in a 3.7 log10 reduction in the final effluent.
The average total phosphorus and total nitrogen in the raw greywater during this experimental period was 0.91 mg/L and 8.52 mg/L, respectively. It was reduced to 0.53 mg/L and 4.37 mg/L by the biofilter system and 0.08 mg/L and 1.73 mg/L by the green wall filtration column, respectively. When 3–6% urine was added to the effluent of infiltration column 1, and 1.5–3% urine was added to the effluent of infiltration column 2, the average total phosphorus and total nitrogen concentration rose to 0.85 mg/L and 34.97 mg/L in the first circulated water and 0.68 mg/L and 24.27 mg/L in the second circulated water, respectively.
On the other hand, the heavy metal analysis result based on the grab samples shows that the concentration of Zn and Cr was 87.3 µg/L and 20 µg/L, respectively, and was relatively higher in the raw greywater as compared to the concentration of other heavy metals. The heavy metals removal efficiency of the greywater treatment steps was different for each heavy metal element, and it was up to 82% for Cr in the case of the biofilter system. However, the concentration of some of the heavy metal elements increased in the treated gray water, such as Mn in the biofilter system effluent, and the levels of Cu, As, Cd, and Pb were increased in the effluent of the filtration columns (Table 3).

3.2. The Level of Microbial Contamination and Heavy Metal Bioaccumulation in the Lettuce

The lettuce biomass was subjected to an E. coli test, and the result shows that there was no positive sample in the case of all of the plots, and this indicates that the contamination of the lettuce from the irrigation water is very limited due to the hydroponic irrigation system. On the other hand, the heavy metal analysis result shows that the bioaccumulation of Zn, Mn, and Cu in the plant tissue was relatively high as compared with the other elements (Table 4).
Cu and As appear to have the highest concentrations in plant tissue when irrigated with urine-free irrigation water, despite the fact that urine contains higher concentrations of these metals. Moreover, the Zn and Mn concentrations in the plant tissue appear highest in the lower urine concentration (0.15–0.3%). The presence of heavy metals in irrigation water does not imply that they are available to plants. One of the most important factors governing metal speciation, solubility, transport, and the eventual bioavailability of metals is the pH of the irrigation water and the growth media. In addition, the abundance of other elements may reduce the bioavailability of the heavy metals. Therefore, the presence or absence of urine in the irrigation water may affect the bioavailability of heavy metals through changing the chemical properties of irrigation water [40,41].

3.3. Hydroponic Nutrient Uptake and Lettuce Growth Analysis

The two-way ANOVA gives F statistics 76.56, p < 0.001; 11.19, p < 0.001; and 5.00, p = 0.003 for urine content in irrigation water, lettuce variety, and their interaction, respectively. Therefore, both urine content in irrigation water and lettuce variety, as well as their interaction, explains the shoot fresh biomass.
The growth analysis of the lettuce was evaluated using four plant growth indexes and is presented in Figure 4. As we can see from the figure, the value of the specific leaf area (SLA) for each of the three lettuce species and the associated treatment level was different. The SLA value reduced with the reduction of urine in the irrigation water, and it was clearly observed in the case of Lactuca sativa ‘Red Salad Bowl’, which had an SLA value of 0.014 m2·g−1 in the case of 0.3–0.6% urine as compared to 0.003 m2·g−1 in the absence of urine. The average SLA value of all three lettuce varieties with the application of 0.3–0.6% urine and in the absence of urine as a treatment was 0.012 m2·g−1 and 0.005 m2·g−1, respectively. The computed leaf weight ratio (LWR) and leaf area ratio (LAR) for the three species is 11.57 and 0.13 in the application of 0.3–0.6% urine with the treated greywater irrigation and 3.93 and 0.02 in the absence of urine, respectively. The average root-shoot ratio of the lettuce irrigated with the 0.3–0.6% urine mix was 0.35, and was lowest (0.22) in the case of Lactuca sativa ‘Lobjoits Green Cos’, while that of the lettuce irrigated without urine was 0.96, and was highest (1.15) in the case of Lactuca sativa ‘Australische Gele’.

3.4. Quantitative Microbial Risk Assessment

3.4.1. Estimation of Reference Pathogens in Irrigation Water and Lettuce Biomass

The estimation of the reference pathogens at different greywater treatment steps and in a produced lettuce was based on E. coli concentration as an indication of microbial contamination. As shown in Table 5, the E. coli concentration decreased because of the different greywater treatment steps. The base for the estimate of reference pathogen concentration was the combination of information about E. coli at each treatment step with the concentration of the reference pathogens in the sewage system, which has been published in different studies. Moreover, with 1% of the sewage assumed to be mixed with the greywater system (Table S2), from the previous studies the average concentration of Cryptosporidium, Campylobacter, and Norovirus in the sewage system was estimated to be 678.1 oocysts/100 mL, 118 MPN/100 mL, and 5.1 × 10⁴ gene copies/100 mL, respectively [42,43,44]. The concentration of reference pathogens in the irrigation water was dependent on the efficiency of the greywater treatment steps of the system, which was based on E. coli removal efficiency. The final concentration of Cryptosporidium, Campylobacter, and Norovirus in the circulated irrigation water was 4.7 × 10⁻⁴ oocysts/100 mL, 8.2 × 10⁻⁶ MPN/100 mL, and 3.5 × 10⁻⁸ gene copies/100 mL, respectively (Table 5). The microbial contamination of the lettuce was assumed to be unintentional contact with the irrigation water during harvesting time.

3.4.2. Health Risk Assessment Computation

Routine ingestion and accidental ingestion are the two routes to exposure in the operation of lettuce production during irrigation and harvesting practices. Based on practical observation, routine ingestion was assumed to be 0.0001 L per event and occurred more frequently during the irrigation practices, whereas accidental ingestion was estimated to be about 0.001 L per event and occurred less frequently for both operational activities. The exposure dose during the operational activities of lettuce production was estimated to be from 4.7 × 10⁻⁷ to 4.7 × 10⁻⁸ for Cryptosporidium, 8.2 × 10⁻⁹ to 8.2 × 10⁻¹⁰ for Campylobacter, and 3.5 × 10⁻¹¹ to 3.5 × 10⁻¹² for Norovirus. The exposure dose due to lettuce consumption is dependent on the volume of irrigation water accidentally contaminating the lettuce and the amount of lettuce consumption. Moreover, the estimated exposure dose due to contaminated lettuce consumption was 2.35 × 10⁻⁹, 1.75 × 10⁻¹⁰, and 4.1 × 10⁻¹¹ in the case of Cryptosporidium, Campylobacter, and Norovirus, respectively (Table 6).
The computed health risk that accounts for lettuce production (irrigation and harvesting) and consumption, expressed in terms of the probability of infection for a single exposure, ranges from 2.8 × 10⁻⁸ in the case of the accidental ingestion of Cryptosporidium to 2.5 × 10⁻¹² in the case of the routine ingestion of Norovirus during the lettuce production process. On the other hand, the probability of infection due to lettuce consumption per single exposure was estimated to be 1.4 × 10⁻¹⁰, 7.8 × 10⁻¹³, and 1.3 × 10⁻¹⁰ in the case of Cryptosporidium, Campylobacter, and Norovirus, respectively (Table 7).

3.5. Heavy Metals Health Risk Assessment

The relative daily uptake rate of heavy metals between the lettuce varieties was different for different heavy metal elements (Figure 5). For example, the daily uptake rate of arsenic by Lactuca sativa ‘Red Salad Bowl’ was highest as compared to the other two varieties, whereas the daily uptake rate of nickel was relatively lowest. On the other hand, the relative daily uptake rate of heavy metals is also varied depending on the volume of urine mix in the irrigation water. For example, the relative daily uptake rate of chromium increases as the urine mix in the irrigation water increases, and is the same for all other cases.
The Metal Pollution Index (MPI) values for the three lettuce varieties and the associated treatments of urine mix with irrigation water are shown in Table 8. The MPI value of Lactuca sativa ‘Lobjoits Green Cos’ was lowest in all treatment cases as compared to the other varieties, and it was 0.91, 0.83, and 0.67 for the 0.3–0.6% urine mix, the 0.15–0.3% urine mix, and without urine, respectively. The MPI value of Lactuca sativa ‘Red Salad Bowl’ was highest: it was 1.26 in the case of the 0.3–0.6% urine mix treatment level (Table 8).
The health risks of heavy metal through lettuce consumption were evaluated based on the health risk index (HRI) and the target hazard quotient (THQ). For the computation of the health risk indexes, the daily intake rate is very crucial to estimating the level of exposure through a food chain (lettuce consumption). The daily intake rate of the heavy metals from the different varieties of lettuce along with the treatment level is presented in Table S3. The daily intake of Zn was found to be greater than the other heavy metals: it ranged from 3.5 × 10⁻³ to 7.2 × 10⁻³ µg/kg·day. In addition, the daily intake of Mn and Cu was also higher: it ranged from 1.2 × 10⁻³ to 4.6 × 10⁻³ µg/kg·day and 1.1 × 10⁻³ to 9.3 × 10⁻⁴ µg/kg·day, respectively.
The health risk index and the target hazard quotient are an indication of the health risk level of consuming lettuce that is produced in the system, and are computed using the reference dose ( R f D ) . The estimated values of the reference dose ( R f D ) of the heavy metals, which is an oral dose per km of body weight, were taken from the United States Environmental Protection Agency (US-EPA) web page and shown in Table 9. The computational result of the HRI shows that the highest value was obtained in the case of As: it was 0.062 in the case of the Lactuca sativa ‘Red Salad Bowl’ lettuce variety grown with 0.3–0.6% urine mix in the irrigation water. However, the value of the HRI for all of the lettuces and treatment levels was below 1, and it shows that the population is not at risk and the public health risk concern due to the lettuce’s consumption is very low for the given assumptions (Table 10). The THQ value for As and Cr are relatively higher, but still <1 in all cases (Table 11), and it implies that the concern level of a health risk is low for the given assumptions. The overall evaluation result shows that the lowest value of THQ was obtained in the case of Lactuca sativa ‘Lobjoits Green Cos’, and the highest value was obtained in the case of Lactuca sativa ‘Red Salad Bowl’.
The variation of THQ value due to the change in the input variable of lettuce intake rate per body weight was referred as the sensitivity of THQ for this particular input variable. The effect of the input on THQ were investigated by varying only this variable across its range of plausible values, while keeping all other inputs at their nominal values as it is described in the assumption for the other computations.
The consumption rate of vegetables varies from country to country depending on the culture, religion, availability, etc. Therefore, a sensitivity analysis based on intake rate versus THQ value for the different heavy metals provides an opportunity to notice the effect of a wide range of heavy metals intake rate per body weight (Figure 6). The results were presented graphically to visualize how an output was sensitive to the change in inputs with respect to its critical value. As we can see from the graph, the THQ value was above the critical value when the value of lettuce intake rate per body weight of As, Cr, and Cu was above 1.65 g/kg, 2.05 g/kg, and 2.55 g/kg, respectively. It must be noted that the THQ value computed here only signifies the contribution from the specific lettuce produced in our system, whereas the contribution of heavy metals from other daily diets will potentially increase the risk.

4. Discussion

The lettuce growth analysis showed that the performance of urine treated lettuce (0.3 to 0.6%) was better than a lettuce plant produced with little urine (0.15 to 0.3%) and without urine in terms of appearance, height, and number of leaves (Figure S1). The overall better performance of urine treated lettuce was attributed to the adequate provision of essential nutrients for plant growth, and it confirms the potential of urine for fertilizing in a hydroponic system. Different plants may require different proportions of urine in the irrigation water, depending on the plant’s type and its growth stage. It has been observed that the application of 0.15 to 0.3% urine mix in the irrigation water was not optimal, as lettuce is a leafy plant that requires a higher nitrogen concentration for its vegetative growth; however, 0.3 to 0.6% gives the impression that it is the optimal level, but further assessment is required.
A two-way ANOVA found significant difference between the mean values of shoot fresh biomass (an indicator for growth performance) with the factor of urine content in irrigation water and lettuce variety (p < 0.001). A significance in the interaction of the variables (p = 0.003) also shows shoot fresh biomass changes for urine content in irrigation water depending on lettuce variety. This indicates the synergistic effect of applied urine and lettuce variety on lettuce growth.
The lettuce growth analysis within the natural development cycle may enable us to evaluate the adaptive feature of the plant. In order to evaluate lettuce growth in quantitative terms, the specific leaf area (SLA), leaf weight ratio (LWR), leaf area ratio (LAR), and root-shoot ratio were assessed. SLA is a measure of the thickness of leaves relative to area, which is associated with the availability of sufficient plant nutrients.The high specific leaf area (SLA) associated with the application of 0.3 to 0.6% urine in treated greywater irrigation, and low SLA in the absence of urine, demonstrates the challenge of the reuse of treated greywater alone for plant biomass production. The insufficient plant nutrient in the case of irrigation without urine significantly constrained plant growth in all of the three varieties. LWR is a measure of biomass allocation to leaves, and the highest LWR in the case of 0.3 to 0.6% urine mix in the irrigation water was associated with the highest leaf biomass production, whereas the lowest LWR in the absence of urine linked with the lowest leaf biomass production. Leaf area ratio is a measure of leafiness or photosynthetic area relative to respiratory mass of the plant that characterizes the plant–atmosphere interaction where most of the energy fluxes exchange through photosynthesis and respiration. The highest LAR (0.16) in the urine treated irrigation compared to the lowest LAR (0.01) in the absence of urine was reflected the value of urine as a nutrient solution for the growth performance of the lettuce in this system. The average root-shoot ratio varied widely between lettuce varieties of the same treatment. A relatively high root-shoot ratio was found in the case of lettuce grown without urine as a response to the shortage of nutrients.
In order to utilize treated greywater for an irrigation purpose, it is important to select greywater treatment steps that reduce microbial pathogens and at the same time retain the nutrients. However, it is often difficult to find treatment processes that perform the two demands simultaneously. Therefore, stored human urine was mixed with the final effluent of the greywater treatment system as a nutrient solution for this system. A significant reduction of E. coli was observed in the final effluent of the greywater treatment step. No E. coli were observed in any of the plant samples collected from each of the treatment plots. The results of this study point out that the greywater treatment system efficiently removed E. coli. The integrated hydroponic system has shown to produce lettuce using recycled greywater and urine without exceeding target risk thresholds. Therefore, this study confirmed that the type of irrigation plays an important role in terms of reducing the risk of contamination.
Quantitative microbiological risk assessment (QMRA) is the process of estimating the risk from exposure to microorganisms. With the intention of determining whether the production and consumption of treated greywater irrigated lettuce has a health risk, a quantitative microbial risk assessment (QMRA) model was developed. The E. coli concentration in the final effluent of the greywater treatment system has been considered as a base for the level of microbial contamination of the irrigation water. The average concentration of reference pathogens (Cryptosporidium, Campylobacter, and Norovirus) in our system was derived from the pathogen load of the municipal sewer system. The volume of water retained by the lettuce leaves and ingested with the lettuce is assumed to be very low (1.0 × 10⁻⁷ L/g), because of the limited accidental contact with irrigation water during harvesting. On the other hand, the volume of water ingestion either accidentally or routinely in production activities during irrigation and harvesting was determined from practical observation and expert opinion; we assumed that it was very little in a closed hydroponic system.
The two major activities for lettuce production that expose the operator to microbial contamination are irrigation and harvesting. Most of these activities are often carried out manually, and the probability of hand contamination is high. Pathogen transmission through the consumption of food with contaminated hands and the accidental splashing of irrigation water into the mouth were considered the most likely routes of exposure for this study. Considering the routes of exposure and other assumptions, the computed QMRA result showed that the infection risk of Cryptosporidium, Campylobacter, and Norovirus due to a lettuce consumption event were very low: 1.4 × 10⁻¹⁰, 7.8 × 10⁻¹³, and 1.3 × 10⁻¹⁰, respectively. The health risk of both lettuce consumption and production activities based on the corresponding assumptions and scenarios were below World Health Organisation (WHO) health-based targets, which is 10−6 DALYs per person per year. Most of the pathogen load studies in the sewage system as well as in the influent of wastewater treatment plants cannot capture the peak concentration of a pathogen, but rather capture the average load, and such information is important for QMRA studies. In the case of a household greywater treatment system, the peak load could appear when one of the family members becomes sick, and the expected risk could be much higher as compared with the average load in the municipal sewer system. Therefore, the conversion of E. coli concentration into reference pathogens based on the average pathogen load of the sewer system could give us a clue about the average risk of our system, but it will undermine the peak risk when the incidence of pathogens is elevated at a household level, and eventually in the greywater system.
The health risk of lettuce production as well as consumption in our system was relatively very low as compared with other studies using raw or partially treated wastewater for irrigating. For example, a rotavirus infection estimation from consuming crops that have been irrigated with effluents from stabilization ponds was 10−3 and 10−4 [45], and the median annual probability of infection from the consumption of vegetables that have been irrigated with wastewater using an overhead sprinkler also ranged from 10−3 to 10−4 per year [46]. The daily probability of illness from eating raw unwashed vegetables irrigated with untreated wastewater the Bogotá river receives from the city and towns ranged between 0.62 and 0.85 [47]. Compared with these studies, the treatment level in combination with the hydroponic irrigation scheme of our system reduced the health risk substantially.
The chemical health risk due to lettuce consumption was expressed in terms of a health risk index (HRI) and targeted hazard quotient (HQ), which are commonly used to evaluate non-carcinogenic health effects. The exposed population will experience a risk if the value of both indexes are greater than one, which means if the exposed dose is greater than the reference dose. The major risk contributor elements due to lettuce consumption were As and Cr, whereas the lowest risk contributor element in the system was Cd. However, the value of both the HRI and THQ indexes was less than one for all of the lettuce varieties and treatment levels, for the given assumptions. This result shows that the heavy metals health risk from the consumption of lettuce produced in this system was not significant. On the other hand, the heavy metals’ bioaccumulation potential varied substantially among the different lettuce varieties. Thus, Lactuca sativa ‘Australische Gele’ has a relatively lower THQ value as compared with the other lettuce varieties, and this indicates the opportunity to reduce the health risk caused by heavy metals through the proper selection of plant varieties.

5. Conclusions

The configuration of greywater treatment systems and hydroponic lettuce production as a part of a green wall structure that makes use of urine as a nutrient solution was the unique feature of this study. Considering its distinctive arrangement, this study provides key information about the health risk associated with treated greywater reuse for lettuce production. The integration of a greywater treatment system with green wall technology provides additional environmental benefits through aesthetic appeal and an improved air quality by increasing the oxygen level. Moreover, a green wall may also act as an urban and semi-urban agriculture that can bring various economic and social benefits, including the generation of additional household income, the provision of a good opportunity for healthier community interaction, and the improvement of access to fresh food.
Performing both a microbial and heavy metal health risk assessment on the same subject enable us to observe the most critical risks to prioritize mitigation measures, and at the same time to perceive the health risk in different directions. The results of the QMRA demonstrate the importance of microbial removal to the efficiency of an integrated greywater treatment system and hydroponic irrigation scheme to minimize the health risk below the health-based targets, 10–6 DALYs per person per year. Different studies have linked wastewater reuse with the excessive bioaccumulation of heavy metals in the produced crops that could potentially pose both short- and long-term health risks. Contrary to these studies, the heavy metals risk assessment based on the HRI and THQ indexes did not exceed the permissible level (one), and as a result the health risk concern of consuming lettuce was insignificant. The heavy metal uptake rate of the plant varieties is different: this study reveals that the heavy metal uptake rate of Lactuca sativa ‘Australische Gele’ was relatively low, and the result highlights the importance of having selected plant varieties that uptake a minimum amount of heavy metals in order to reduce the health risk. Therefore, the selection of potential varieties should be considered in future studies.
By considering all of the the benefits that may arise from this scheme, this study points out some vital health risk minimizing strategies that may potentially further reduce health risks, and these include: (1) improving the microbial and heavy metal removal efficiency of greywater treatment systems through appropriate research approaches; (2) growing plant varieties that have the potential for reduced heavy metal bioaccumulation; and (3) taking regulatory measures on consumable goods that can potentially release heavy metals at a household level.

Supplementary Materials

The following are available online at www.mdpi.com/2073-4441/9/7/454/s1, Figure S1: The appearance of lettuce at different growth stages, A. after three weeks of planting, B. after six weeks of planting, and C. after eight weeks of planting. The left column is treated greywater with (0.3–0.6% urine), the middle column is with (0.15–0.3% urine), and the right column is without urine for each growth stage, Table S1: The average concentration of pathogens in the sewage system assuming 1% of sewage present in the greywater considering E. coli as a surrogate for faecal contamination, Table S2: The proportion of essential plant nutrient uptake by lettuce variety, Table S3: Daily Intake rate (DIR) (mg/Kg·day) of heavy metals in different varieties of lettuce.

Acknowledgments

The authors gratefully acknowledge the financial support from the Faculty of Science and Technology, at the Norwegian University of Life Sciences (NMBU). Special thanks are extended to Solfrid Lohne (Faculty of environmental sciences and natural resource management, NMBU), who analyzed the heavy metals in the plant tissue and water samples. The authors gratefully acknowledge Vegard Nilsen (Faculty of science and technology, NMBU) for useful discussions during data analysis.

Author Contributions

Arve Heistad and Fasil Ejigu Eregno conceived and designed the experiments; Fasil Ejigu Eregno and Melesse Eshetu Moges performed the experiment and collected the data; Fasil Ejigu Eregno analyzed the data and drafted the manuscript, which was critically commented by Arve Heistad and Melesse Eshetu Moges. All authors read and approved the final manuscript.

Conflicts of Interest

The authors declare no conflict of interest.

References

  1. Haruvy, N. Agricultural reuse of wastewater: Nation-wide cost-benefit analysis. Agric. Ecosyst. Environ. 1997, 66, 113–119. [Google Scholar] [CrossRef]
  2. Angelakis, A.N.; Marecos Do Monte, M.H.F.; Bontoux, L.; Asano, T. The status of wastewater reuse practice in the mediterranean basin: Need for guidelines. Water Res. 1999, 33, 2201–2217. [Google Scholar] [CrossRef]
  3. Larsen, T.A.; Alder, A.C.; Eggen, R.I.L.; Maurer, M.; Lienert, J. Source separation: Will we see a paradigm shift in wastewater handling? Environ. Sci. Technol. 2009, 43, 6121–6125. [Google Scholar] [CrossRef] [PubMed]
  4. Jönsson, H. Urine separation—Swedish experiences. EcoEng Newsl. 2001, 1, 1–7. [Google Scholar]
  5. Otterpohl, R.; Grottker, M.; Lange, J. Sustainable water and waste management in urban areas. Water Sci. Technol. 1997, 35, 121–133. [Google Scholar] [CrossRef]
  6. Nelson, K.L.; Murray, A. Sanitation for unserved populations: Technologies, implementation challenges, and opportunities. Annu. Rev. Environ. Resour. 2008, 33, 119–151. [Google Scholar] [CrossRef]
  7. Jhansi, S.C.; Mishra, S.K. Wastewater treatment and reuse: Sustainability options. Cons. J. Sustain. Dev. 2013, 10, 1–15. [Google Scholar]
  8. Allen, L.; Christian-Smith, J.; Palaniappan, M. Overview of Greywater Reuse: The Potential of Greywater Systems to Aid Sustainable Water Management; Pacific Institute: Oakland, CA, USA, 2010; Volume 654. [Google Scholar]
  9. Oyama, N. Hydroponics System for Wastewater Treatment and Reuse in Horticulture; Murdoch University: Perth, Australia, 2008. [Google Scholar]
  10. Ginneken, M.; Oron, G. Risk assessment of consuming agricultural products irrigated with reclaimed wastewater: An exposure model. Water Resour. Res. 2000, 36, 2691–2699. [Google Scholar] [CrossRef]
  11. Timur, Ö.B.; Karaca, E. Vertical gardens. In Advances in Landscape Architecture; Intech: Rijeka, Croatia, 2013. [Google Scholar]
  12. Pearen, B.; Wilson, C. Feasibility Study for Green Roof Application on Queen’s University Campus. Queen’s Phys. Plant Serv. 2006. [Google Scholar]
  13. Feng, H. Lifecycle Based Energy Assessment of Green Roofs and Walls. Ph.D. Thesis, University of British Columbia, Vancouver, BC, Canada, 2013. [Google Scholar]
  14. Järup, L. Hazards of heavy metal contamination. Br. Med. Bull. 2003, 68, 167–182. [Google Scholar] [CrossRef] [PubMed]
  15. Orisakwe, O.E.; Nduka, J.K.; Amadi, C.N.; Dike, D.O.; Bede, O. Heavy metals health risk assessment for population via consumption of food crops and fruits in Owerri, South Eastern, Nigeria. Chem. Cent. J. 2012, 6, 77. [Google Scholar] [CrossRef] [PubMed]
  16. Shuval, H.; Lampert, Y.; Fattal, B. Development of a risk assessment approach for evaluating wastewater reuse standards for agriculture. Water Sci. Technol. 1997, 35, 15–20. [Google Scholar] [CrossRef]
  17. Tanaka, H.; Asano, T.; Schroeder, E.D.; Tchobanoglous, G. Estimating the safety of wastewater reclamation and reuse using enteric virus monitoring data. Water Environ. Res. 1998, 70, 39–51. [Google Scholar] [CrossRef]
  18. Petterson, S.R.; Ashbolt, N.J.; Sharma, A. Discussion of: Microbial risks from wastewater irrigation of salad crops: A screening-level risk assessment. Water Environ. Res. 2002, 74, 411. [Google Scholar] [CrossRef] [PubMed]
  19. Petterson, S.R.; Ashbolt, N.J.; Sharma, A. Microbial risks from wastewater irrigation of salad crops: A screening-level risk assessment. Water Environ. Res. 2001, 73, 667–672. [Google Scholar] [CrossRef] [PubMed]
  20. Oyama, N.; Nair, J.; Ho, G. Recycling of treated domestic effluent from an on-site wastewater treatment system for hydroponics. Water Sci. Technol. 2005, 51, 211–219. [Google Scholar] [PubMed]
  21. Jackson, S.; Rodda, N.; Salukazana, L. Microbiological assessment of food crops irrigated with domestic greywater. Water SA 2006, 32, 700–704. [Google Scholar] [CrossRef]
  22. Drechsel, P.; Keraita, B.; Seidu, R.; Abaidoo, R. Human Health Risks from Wastewater-Irrigated Vegetable Farming; International Water Management Institute (IWMI): Colombo, Sri Lanka, 2014; pp. 104–115. [Google Scholar]
  23. Gupta, N.; Khan, D.; Santra, S. An assessment of heavy metal contamination in vegetables grown in wastewater-irrigated areas of titagarh, west bengal, india. Bull. Environ. Contam. Toxicol. 2008, 80, 115–118. [Google Scholar] [CrossRef] [PubMed]
  24. Likuku, A.S.; Obuseng, G. Health Risk Assessment of Heavy Metals Via Dietary Intake of Vegetables Irrigated with Treated Wastewater around Gaborone, Botswana. In Proceedings of the International Conference on Plant, Marine and Environmental Sciences (PMES-2015), Kuala Lumpur, Malaysia, 1–2 January 2015; pp. 32–37. [Google Scholar]
  25. Hossain, M.S.; Ahmed, F.; Abdullah, A.T.M.; Akbor, M.A.; Ahsan, M.A. Public health risk assessment of heavy metal uptake by vegetables grown at a waste-water-irrigated site in dhaka, bangladesh. J. Health Pollut. 2015, 5, 78–85. [Google Scholar] [CrossRef]
  26. Khan, S.A.; Liu, X.; Shah, B.R.; Fan, W.; Li, H.; Khan, S.B.; Ahmad, Z. Metals uptake by wastewater irrigated vegetables and their daily dietary intake in peshawar, pakistan/pobieranie metali przez warzywa nawadniane ściekami i ich dzienne stężenie w diecie ludności peszawaru, pakistan. Ecol. Chem. Eng. S 2015, 22, 125–139. [Google Scholar] [CrossRef]
  27. Todt, D.; Heistad, A.; Jenssen, P.D. Load and distribution of organic matter and nutrients in a separated household wastewater stream. Environ. Technol. 2015, 36, 1584–1593. [Google Scholar] [CrossRef] [PubMed]
  28. Garnier, E.; Shipley, B.; Roumet, C.; Laurent, G. A standardized protocol for the determination of specific leaf area and leaf dry matter content. Funct. Ecol. 2001, 15, 688–695. [Google Scholar] [CrossRef]
  29. Westoby, M.; Falster, D.S.; Moles, A.T.; Vesk, P.A.; Wright, I.J. Plant ecological strategies: Some leading dimensions of variation between species. Annu. Rev. Ecol. Syst. 2002, 125–159. [Google Scholar] [CrossRef]
  30. Benjamin, L.R. Growth and development|growth analysis, crops a2—Thomas, brian. In Encyclopedia of Applied Plant Sciences; Elsevier: Oxford, UK, 2003; pp. 588–595. [Google Scholar]
  31. Ågren, G.I.; Franklin, O. Root: Shoot ratios, optimization and nitrogen productivity. Ann. Bot. 2003, 92, 795–800. [Google Scholar] [CrossRef] [PubMed]
  32. DuPont, H.L.; Chappell, C.L.; Sterling, C.R.; Okhuysen, P.C.; Rose, J.B.; Jakubowski, W. The infectivity of cryptosporidium parvum in healthy volunteers. N. Engl. J. Med. 1995, 332, 855–859. [Google Scholar] [CrossRef] [PubMed]
  33. Megraud, F.; Brassens-Rabbe, M.; Denis, F.; Belbouri, A.; Hoa, D.Q. Seroepidemiology of campylobacter pylori infection in various populations. J. Clin. Microbiol. 1989, 27, 1870–1873. [Google Scholar] [PubMed]
  34. Hall, A.J.; Lopman, B.A.; Payne, D.C.; Patel, M.M.; Gastañaduy, P.A.; Vinjé, J.; Parashar, U.D. Norovirus disease in the united states. Emerg. Infect. Dis. 2013, 19, 1198–1205. [Google Scholar] [CrossRef] [PubMed]
  35. Usero, J.; Gonzalez-Regalado, E.; Gracia, I. Trace metals in the bivalve molluscs ruditapes decussatus and ruditapes philippinarum from the atlantic coast of southern spain. Environ. Int. 1997, 23, 291–298. [Google Scholar] [CrossRef]
  36. Tangahu, B.V.; Sheikh Abdullah, S.R.; Basri, H.; Idris, M.; Anuar, N.; Mukhlisin, M. A review on heavy metals (As, Pb, and Hg) uptake by plants through phytoremediation. Int. J. Chem. Eng. 2011, 2011, 939161. [Google Scholar] [CrossRef]
  37. Hope, B.; Stock, M. Guidance for Use of Probabilistic Analysis in Human Health Risk Assessments; Oregon Department of Environmental Quality: Portland, OR, USA, 1998.
  38. United States Environmental Protection Agency (US-EPA). Integrated Risk Information System. Available online: https://www.epa.gov/iris (accessed on 14 January 2017).
  39. Walpole, S.C.; Prieto-Merino, D.; Edwards, P.; Cleland, J.; Stevens, G.; Roberts, I. The weight of nations: An estimation of adult human biomass. BMC Public Health 2012, 12, 439. [Google Scholar] [CrossRef] [PubMed]
  40. Chojnacka, K.; Chojnacki, A.; Gorecka, H.; Górecki, H. Bioavailability of heavy metals from polluted soils to plants. Sci. Total Environ. 2005, 337, 175–182. [Google Scholar] [CrossRef] [PubMed]
  41. Agrawal, S.; Singh, A.; Sharma, R.; Agrawal, M. Bioaccumulation of heavy metals in vegetables: A threat to human health. Terr. Aquat. Environ. Toxicol. 2007, 1, 13–23. [Google Scholar]
  42. Eregno, F.E.; Tryland, I.; Tjomsland, T.; Myrmel, M.; Robertson, L.; Heistad, A. Quantitative microbial risk assessment combined with hydrodynamic modelling to estimate the public health risk associated with bathing after rainfall events. Sci. Total Environ. 2016, 548–549, 270–279. [Google Scholar] [CrossRef] [PubMed]
  43. Robertson, L.J.; Hermansen, L.; Gjerde, B.K. Occurrence of cryptosporidium oocysts and giardia cysts in sewage in norway. Appl. Environ. Microbiol. 2006, 72, 5297–5303. [Google Scholar] [CrossRef] [PubMed]
  44. Myrmel, M.; Lange, H.; Rimstad, E. A 1-year quantitative survey of noro-, adeno-, human boca-, and hepatitis E viruses in raw and secondarily treated sewage from two plants in norway. Food Environ. Virol. 2015, 7, 213–223. [Google Scholar] [CrossRef] [PubMed]
  45. Pavione, D.; Bastos, R.; Bevilacqua, P. Quantitative microbial risk assessment applied to irrigation of salad crops with waste stabilization pond effluents. Water Sci. Technol. 2013, 67, 1208–1215. [Google Scholar] [CrossRef] [PubMed]
  46. Mok, H.F.; Hamilton, A.J. Exposure factors for wastewater-irrigated asian vegetables and a probabilistic rotavirus disease burden model for their consumption. Risk Anal. 2014, 34, 602–613. [Google Scholar] [CrossRef] [PubMed]
  47. Henao-Herreno, L.X.; Lopez-Tamayo, A.M.; Ramos-Bonilla, J.P.; Haas, C.N.; Husserl, J. Risk of illness with salmonella due to consumption of raw unwashed vegetables irrigated with water from the bogota river. Risk Anal. 2017, 37, 733–743. [Google Scholar] [CrossRef] [PubMed]
Figure 1. Greywater treatment steps, green wall, and lettuce production configuration (GW tank: greywater tank).
Water 09 00454 g001
Figure 2. System configuration and health risk assessment procedures.
Water 09 00454 g002
Figure 3. Water quality at different treatment steps of the system.
Water 09 00454 g003
Figure 4. Growth indexes result for different lettuce varieties and treatment levels (A) specific leaf area; (B) leaf weight ratio; (C) leaf area ratio; and (D) root-shoot ratio.
Water 09 00454 g004
Figure 5. Relative daily uptake rate of heavy metals for the lettuce plants.
Water 09 00454 g005
Figure 6. The sensitivity of calculated THQ for lettuce intake rate for a given body weight.
Water 09 00454 g006
Table 1. Dose-response relationships for reference organisms.
Organism TypeDistributionModelParameters
NorovirusBeta-PoissonPinf = 1 − (1 + D/β)−αα = 0.04
β = 0.055
CampylobacterBeta-PoissonPinf = 1 − (1 + D/β)−αα = 0.145
β = 7.58
CryptosporidiumExponentialPinf = 1 – exp(−rD)r = 0.059
Table 2. Health risk characterizing computational equations.
Risk CharacteristicsComputational Equations
Yearly probability of infection (assuming frequency per year) P inff / year = 1 ( 1 P inff / event ) fr
Risk of illness from a single exposure P i ll / exp = P i ll / inff × P inff
Yearly risk of illness (assuming x exposure frequency per year) P ill / year = 1 ( 1 P ill / exp ) fr
Note: fr is frequency per year.
Table 3. Heavy metal concentration (µg/L) in greywater and different treatment steps.
Sampling PointsCrMnNiCuZnAsCdHgPb
Raw greywater20.012.717.010.787.3<0.26<0.01<0.020.6
Biofilter system effluent3.615.79.65.634.7<0.26<0.01<0.020.2
Filtration column effluent<2.53.43.68.0<210.670.036<0.020.25
Human Urine8173.914600300.2<0.020.4
Table 4. Heavy metal concentration in three varieties of lettuce for different treatment.
Urine in Irrigation Water (%)Lettuce TypeHeavy Metals Concentration (mg/kg)
AsCdCrCuMnNiPbZnHg
0.3–0.6a0.130.021.4311.0027.003.300.3851.250.02
b0.400.022.5013.0032.003.500.9659.000.02
c0.110.022.5012.3330.333.730.6655.000.01
0.15–0.3a0.090.021.0012.0036.004.100.2678.000.02
b0.110.031.2010.0043.002.700.3075.000.02
c0.130.040.8612.0049.003.500.3974.000.02
0a0.220.020.769.9013.002.200.4238.000.01
b0.220.031.2043.0027.003.100.6355.000.01
c0.270.021.8020.0018.004.000.7363.000.01
Notes: a—Lactuca sativa ‘Lobjoits Green Cos’; b—Lactuca sativa ‘Red Salad Bowl’; c—Lactuca sativa ‘Australische Gele’.
Table 5. Estimated reference pathogens’ concentration at different treatment steps.
PathogensVariablesAn Average Value
CryptosporidiumConcentration (C) in raw greywater (L−1)6.8 × 101
Biofilter system log10 reduction1.59
Concentration in biofilter system effluent (L−1)1.7 × 10
Infiltration column log10 reduction1.93
Concentration in infiltration column effluent (L−1)2.1 × 10⁻²
Circulated irrigation water log10 reduction1.64
Concentration in circulated irrigation water (L−1)4.7 × 10⁻⁴
CampylobacterConcentration (C) in raw greywater (L−1)1.2 × 10
Biofilter system log10 reduction1.59
Concentration in biofilter system effluent (L−1)3.0 × 10⁻²
Infiltration column log10 reduction1.93
Concentration in infiltration column effluent (L−1)3.6 × 10⁻⁴
Circulated irrigation water log10 reduction1.64
Concentration in circulated irrigation water (L−1)8.2 × 10⁻⁶
NorovirusConcentration (C) in raw greywater (L−1)5.1 × 10
Biofilter system log10 reduction1.59
Concentration in biofilter system effluent (L−1)1.3 × 10⁻¹
Infiltration column log10 reduction1.93
Concentration in infiltration column effluent (L−1)1.5 × 10⁻³
Circulated irrigation water log10 reduction1.64
Concentration in circulated irrigation water (L−1)3.5 × 10⁻⁵
Treatment efficiency based on E. coli Log10 reduction in the system.
Table 6. Estimation of exposure dose (D) and exposure frequency for reference pathogens during lettuce production and consumption.
PathogensActivitiesRoute of ExposureConcentration (C)Volume (L) Per EventExposure Dose (D) Per EventFrequency/Person/Year
CryptosporidiumHydroponic irrigationRoutine ingestion4.7 × 10−41.0 × 10−44.7 × 10−8365
Accidental ingestion4.7 × 10−41.0 × 10−34.7 × 10−710
Lettuce harvestRoutine ingestion4.7 × 10−41.0 × 10−44.7 × 10−830
Accidental ingestion4.7 × 10−41.0 × 10−34.7 × 10−75
Lettuce consumptionDeliberate ingestion4.7 × 10−45.0 × 10−62.35 × 10−9104
CampylobacterHydroponic irrigationRoutine ingestion8.2 × 10−61.0 × 10−48.2 × 10−10365
Accidental ingestion8.2 × 10−61.0 × 10−38.2 × 10−910
Lettuce harvestRoutine ingestion8.2 × 10−61.0 × 10−48.2 × 10−1030
Accidental ingestion8.2 × 10−61.0 × 10−38.2 × 10−95
Lettuce consumptionDeliberate ingestion8.2 × 10−65.0 × 10−64.1 × 10−11104
NorovirusHydroponic irrigationRoutine ingestion3.5 × 10−81.0 × 10−43.5 × 10−12365
Accidental ingestion3.5 × 10−81.0 × 10−33.5 × 10−1110
Lettuce harvestRoutine ingestion3.5 × 10−81.0 × 10−43.5 × 10−1230
Accidental ingestion3.5 × 10−81.0 × 10−33.5 × 10−115
Lettuce consumptionDeliberate ingestion3.5 × 10−85.0 × 10−61.8 × 10−10104
Table 7. The health risk of lettuce production and consumption.
PathogensRoute of ExposureActivitiesPinf/eventPinff/yearPill/expoPill/year
CryptosporidiumHydroponic irrigationRoutine ingestion2.8 × 10−91.0 × 10−61.1 × 10−93.9 × 10⁻⁷
Accidental ingestion2.8 × 10−82.8 × 10−71.1 × 10−81.1 × 10⁻⁷
Lettuce harvestRoutine ingestion2.8 × 10−98.3 × 10−81.1 × 10−93.2 × 10⁻⁸
Accidental ingestion2.8 × 10−81.4 × 10−71.1 × 10−85.4 × 10⁻⁸
Lettuce consumptionDeliberate ingestion1.4 × 10−101.4 × 10−85.4 × 10−115.6 × 10⁻⁹
CampylobacterHydroponic irrigationRoutine ingestion1.6 × 10−115.7 × 10−95.2 × 10−121.9 × 10⁻⁹
Accidental ingestion1.6 × 10−101.6 × 10−95.2 × 10−115.2 × 10⁻¹⁰
Lettuce harvestRoutine ingestion1.6 × 10−114.7 × 10−105.2 × 10−121.6 × 10⁻¹⁰
Accidental ingestion1.6 × 10−107.8 × 10−105.2 × 10−112.6 × 10⁻¹⁰
Lettuce consumptionDeliberate ingestion7.8 × 10−138.2 × 10−112.6 × 10−132.7 × 10⁻¹¹
NorovirusHydroponic irrigationRoutine ingestion2.5 × 10−129.3 × 10−101.9 × 10−126.8 × 10⁻¹⁰
Accidental ingestion2.5 × 10−112.5 × 10−101.9 × 10−111.9 × 10⁻¹⁰
Lettuce harvestRoutine ingestion2.5 × 10−127.6 × 10−111.9 × 10−125.6 × 10⁻¹¹
Accidental ingestion2.5 × 10−111.3 × 10−101.9 × 10−119.3 × 10⁻¹¹
Lettuce consumptionDeliberate ingestion1.3 × 10−101.3 × 10−89.3 × 10−119.7 × 10⁻⁹
Table 8. Metal pollution index for lettuce varieties.
Urine in Irrigation Water (%)Lettuce TypeMetal Pollution Index (MPI)
0.3–0.6a—Lactuca sativa ‘Lobjoits Green Cos’0.91
b—Lactuca sativa ‘Red Salad Bowl’1.26
c—Lactuca sativa ‘Australische Gele’0.99
0.15–0.3a—Lactuca sativa ‘Lobjoits Green Cos’0.83
b—Lactuca sativa ‘Red Salad Bowl’0.87
c—Lactuca sativa ‘Australische Gele’1.02
0a—Lactuca sativa ‘Lobjoits Green Cos’0.67
b—Lactuca sativa ‘Red Salad Bowl’1.13
c—Lactuca sativa ‘Australische Gele’1.10
Table 9. Reference dose (RfD) of heavy metals (mg/kg/day).
ParameterHeavy Metals
AsCdCrCuMnNiPbZnHg
Reference dose (RfD)0.00030.0010.0030.040.140.020.00350.30.0003
Table 10. Health risk index (HRI) of heavy metals caused by the consumption of lettuce.
Urine in Irrigation Water (%)Lettuce TypeAsCdCrCuMnNiPbZnHg
0.3–0.6a0.0210.0010.0220.0130.0090.0080.0050.0080.003
b0.0620.0010.0390.0150.0110.0080.0130.0090.003
c0.0170.0010.0390.0140.0100.0090.0090.0090.002
0.15–0.3a0.0140.0010.0150.0140.0120.0100.0030.0120.002
b0.0170.0010.0190.0120.0140.0060.0040.0120.003
c0.0200.0020.0130.0140.0160.0080.0050.0110.003
0a0.0340.0010.0120.0110.0040.0050.0060.0060.001
b0.0340.0010.0190.0500.0090.0070.0080.0090.002
c0.0420.0010.0280.0230.0060.0090.0100.0100.002
Notes: a—Lactuca sativa ‘Lobjoits Green Cos’; b—Lactuca sativa ‘Red Salad Bowl’; c—Lactuca sativa ‘Australische Gele’.
Table 11. Calculated target hazard quotient (THQ) for heavy metals in in different varieties of lettuce.
Urine in Irrigation Water (%)Lettuce TypeAsCdCrCuMnNiPbZnHg
0.3–0.6a0.320.010.340.200.140.120.080.120.05
b0.950.010.600.230.160.130.200.140.04
c0.260.020.600.220.150.130.140.130.03
0.15-0.3a0.210.010.240.210.180.150.050.190.04
b0.260.020.290.180.220.100.060.180.04
c0.310.030.200.210.250.130.080.180.05
0a0.520.010.180.180.070.080.090.090.02
b0.520.020.290.770.140.110.130.130.03
c0.640.020.430.360.090.140.150.150.03
Notes: a—Lactuca sativa ‘Lobjoits Green Cos’; b—Lactuca sativa ‘Red Salad Bowl’; c—Lactuca sativa ‘Australische Gele’.

