End-User Cost-Benefit Prioritization for Selecting Rainwater Harvesting and Greywater Reuse in Social Housing
by

Isabel Domínguez
1, 
Sarah Ward
2,*,
Jose Gabriel Mendoza
1,
Carlos Iván Rincón
1 and
Edgar Ricardo Oviedo-Ocaña
1 1
Grupo de Investigación en Recursos Hídricos y Saneamiento Ambiental (GPH), Escuela de Ingeniería Civil, Facultad de Ingenierías Físico-Mecánicas, Universidad Industrial de Santander, Carrera 27 Calle 9, Bucaramanga 680002, Colombia
2
Centre for Water Systems, College of Engineering, Physical Sciences and Mathematics, University of Exeter, Kay Building, North Park Road, Exeter EX4 4QF, UK
*
Author to whom correspondence should be addressed.
Water 2017, 9(7), 516; https://doi.org/10.3390/w9070516
Submission received: 26 May 2017
/
Revised: 1 July 2017
/
Accepted: 6 July 2017
/
Published: 12 July 2017
(This article belongs to the Special Issue Development of Alternative Water Sources in the Urban Sector)
Abstract
:Rainwater harvesting (RWH) and greywater reuse (GWR) are increasingly being considered at the building-level to achieve multiple goals. Cost-benefit assessments facilitate decision-making; however, most are focused on large-scale systems with limited information available for households from developing countries. To better understand the prioritization of costs and benefits by potential end-users in this context, this paper presents an assessment of an RWH/GWR system in low income, low consumption households in a social housing development in Colombia. From an initial household consultation, preferences related to the use of RWH/GWR were identified and three alternatives were proposed and designed. In a follow-up consultation, potential end-users were engaged with the cost-benefit of the proposed alternatives. Potential end-users prioritized the selection of the system with potable water savings of 25%, a payback period of 30 years, an internal return rate of 4.7%, and a Benefit/Cost ratio of 1.3. Of the three alternatives, this system had the median payback period, highest investment, and highest maintenance cost, but also the highest volumetric water saving and highest water and sewerage bill savings. In contrast to findings from developed countries, this indicates that minimising the cost may not be the primary decision making criteria in some developing country contexts, where perhaps a greater value is placed on conserving water resources.

1. Introduction
Pressures on present and future water resources availability from climate change, urbanization, and population growth are well documented. Despite the revised Sustainable Development Goals, which prioritize efficient water use and water conservation [1], these pressures can be particularly prominent in developing country contexts where access to safe water may be hampered by water scarcity, as well as other socioeconomic factors and infrastructure challenges [2].
Whilst only accounting for 12% of the global demand (compared to 69% for agriculture and 19% for industry), municipal water use has received wide-spread attention, particularly due to the reaching of the tipping point for the percentage of the world’s population now residing in cities [3,4].
Over the last twenty years, urban water governance has been influenced by a range of approaches from integrated urban water management to water sensitive urban design [5]. At the building scale, these include rainwater harvesting (RWH) and greywater reuse (GWR).
Rainwater is a natural resource that can be easily collected and used in a variety of applications, where non-potable [6] and potable use are required [7]. Water saving efficiencies associated with RWH have been reported to range from 0.27% to 100%, depending on the rainfall intensity, per capita water consumption, household size, roof properties, economic capability of the household, and design period [7]. GW includes the wastewater produced in a household excluding that from toilets [8], and the domestic activities where this source can be potentially used can represent 50% to 80% of the total in-house water demand [9,10].
Several authors [7,10,11] agree that a high proportion of domestic water use does not require strictly drinking water quality (e.g., toilet flushing, house cleaning, and garden irrigation). Thus, it is possible to use water with a lower quality for such uses. In Colombia, the amount of water for residential use that does not require drinking water quality could be approximately 71% [12].
According to Friedler and Hadari [9], the use of alternative water sources has benefits that can be classified into those for the individual consumer and those for the general public. Benefits to the individual consumer are money savings in water supply and drainage bills. Benefits to the general public include: postponing the need to develop new water sources and facilities, and reducing the resources required for water and wastewater management such as conveyance and treatment (energy, chemicals). These systems can also reduce stormwater runoff impacts on surface waters [13]. A number of studies have investigated the financial and economic feasibility of RWH and GWR, which were previously summarized by the authors [14].
Despite all the above mentioned benefits, there are factors that limit the adoption and scaling-up of RWH systems at the household level, including: (i) use of low-quality materials in roofs; (ii) high investment costs for acquisition, installation, and maintenance; (iii) lack of funding and regulation; (iv) space requirements at households; and (v) deficient quality of rainwater [15]. With regards to GWR, the main barriers for implementation are the perceived risks to human health, and the perceived capital and operation and maintenance costs [8].
Several studies have addressed the technical and financial feasibility of RWH and or greywater reuse in different building configurations and contexts [9,16,17,18,19,20,21]. In Colombia, research on rainwater harvesting for residential purposes has addressed issues of quality [22,23]. Therefore, there remains limited knowledge on decision-making at the household scale, particularly in developing countries [14,24].
In contributing to closing this knowledge gap for Colombia Oviedo-Ocaña, Dominguez [14] presented the financial feasibility of end-user designed RWH and GWR systems for a high water consumption household (203 liters per capita per day), classified as stratum six (i.e., strata one and six represent the lowest and highest socioeconomic level, respectively). They asked potential end users through a household survey to identify their acceptability towards alternative water sources to be included in the financial assessment in order to indicate the types of microcomponents and system configurations that would be acceptable to end-users. However, Colombia stratum six represents only 1.2% of the population [25]. Households in this stratum display a high water consumption (28.5 m3/household/month) [26]. In contrast, 63.5% of the population belongs to a low socioeconomic stratum (1 and 2) [25], with low water consumption levels (17.5 m3/household/month) [26]. Consequently, there is significant scope for urban water savings if potable water is supplemented with RWH or GWR.
This paper builds on the methodology presented by Oviedo-Ocaña, Dominguez [14] to understand the prioritization of costs and benefits by end-users through a financial assessment of RWH and GWR in the context of low income, low consumption households and proceeds as follows. The Method section provides an overview of the study context, summarizes the main steps of the original assessment method, and provides additional detail on recent developments, including the use of household consultations and the Benefit-Cost Ratio (to result in an “Improved Method”), comparing the proposed RWH/GWR systems with a conventional system (i.e., without RWH/GWR). The Results and Discussion present the main findings of the calculations and an examination of end-user prioritization, and the Conclusion reiterates the findings in the context of potential wider implications.
2. Materials and Methods
This section describes the study context and the improved method for assessing a number of RWH/GWR system configurations taking into account end-user prioritization. This is based on householder consultation, system components, treatment technologies, design parameters, and financial assessment criteria such as the payback period (PP), net present value (NPV), internal rate of return (IRR), and benefit-cost ratio (B/C).
2.1. Study Context
The households under consideration are located in a residential social housing complex with 1593 units in the metropolitan area of Bucaramanga. In Colombia, social housing programs are promoted by the government to ensure the right to housing for the low income population [27]. Households in this area are classified as stratum one. Each household was located in a 48 m2 plot, of which 24 m2 was built on to create a residential structure. The structure consisted of one bedroom, one bathroom, one living room, a kitchen, and a laundry area. The remaining 24 m2 is for future extensions that include two bedrooms and two bathrooms. The household had a mortar floor, walls without plastering and painting, and an asbestos-cement roof. The study area has water supply, sewage and solid waste collection services. The average annual rainfall in the last 25 years was 974 mm and the average temperature 25 °C [28].
2.2. Original Assessment Method
Oviedo-Ocaña, Dominguez [14] set out a detailed method for the formulation of alternative RWH/GWR system designs with an integrated financial assessment. The steps in the method are:
- User acceptability derived through a questionnaire-based survey with householders in the study area;
- Water quality for RWH and GWR systems;
- Proposed alternatives:
- Dimensioning of storage tanks (rainwater and greywater)
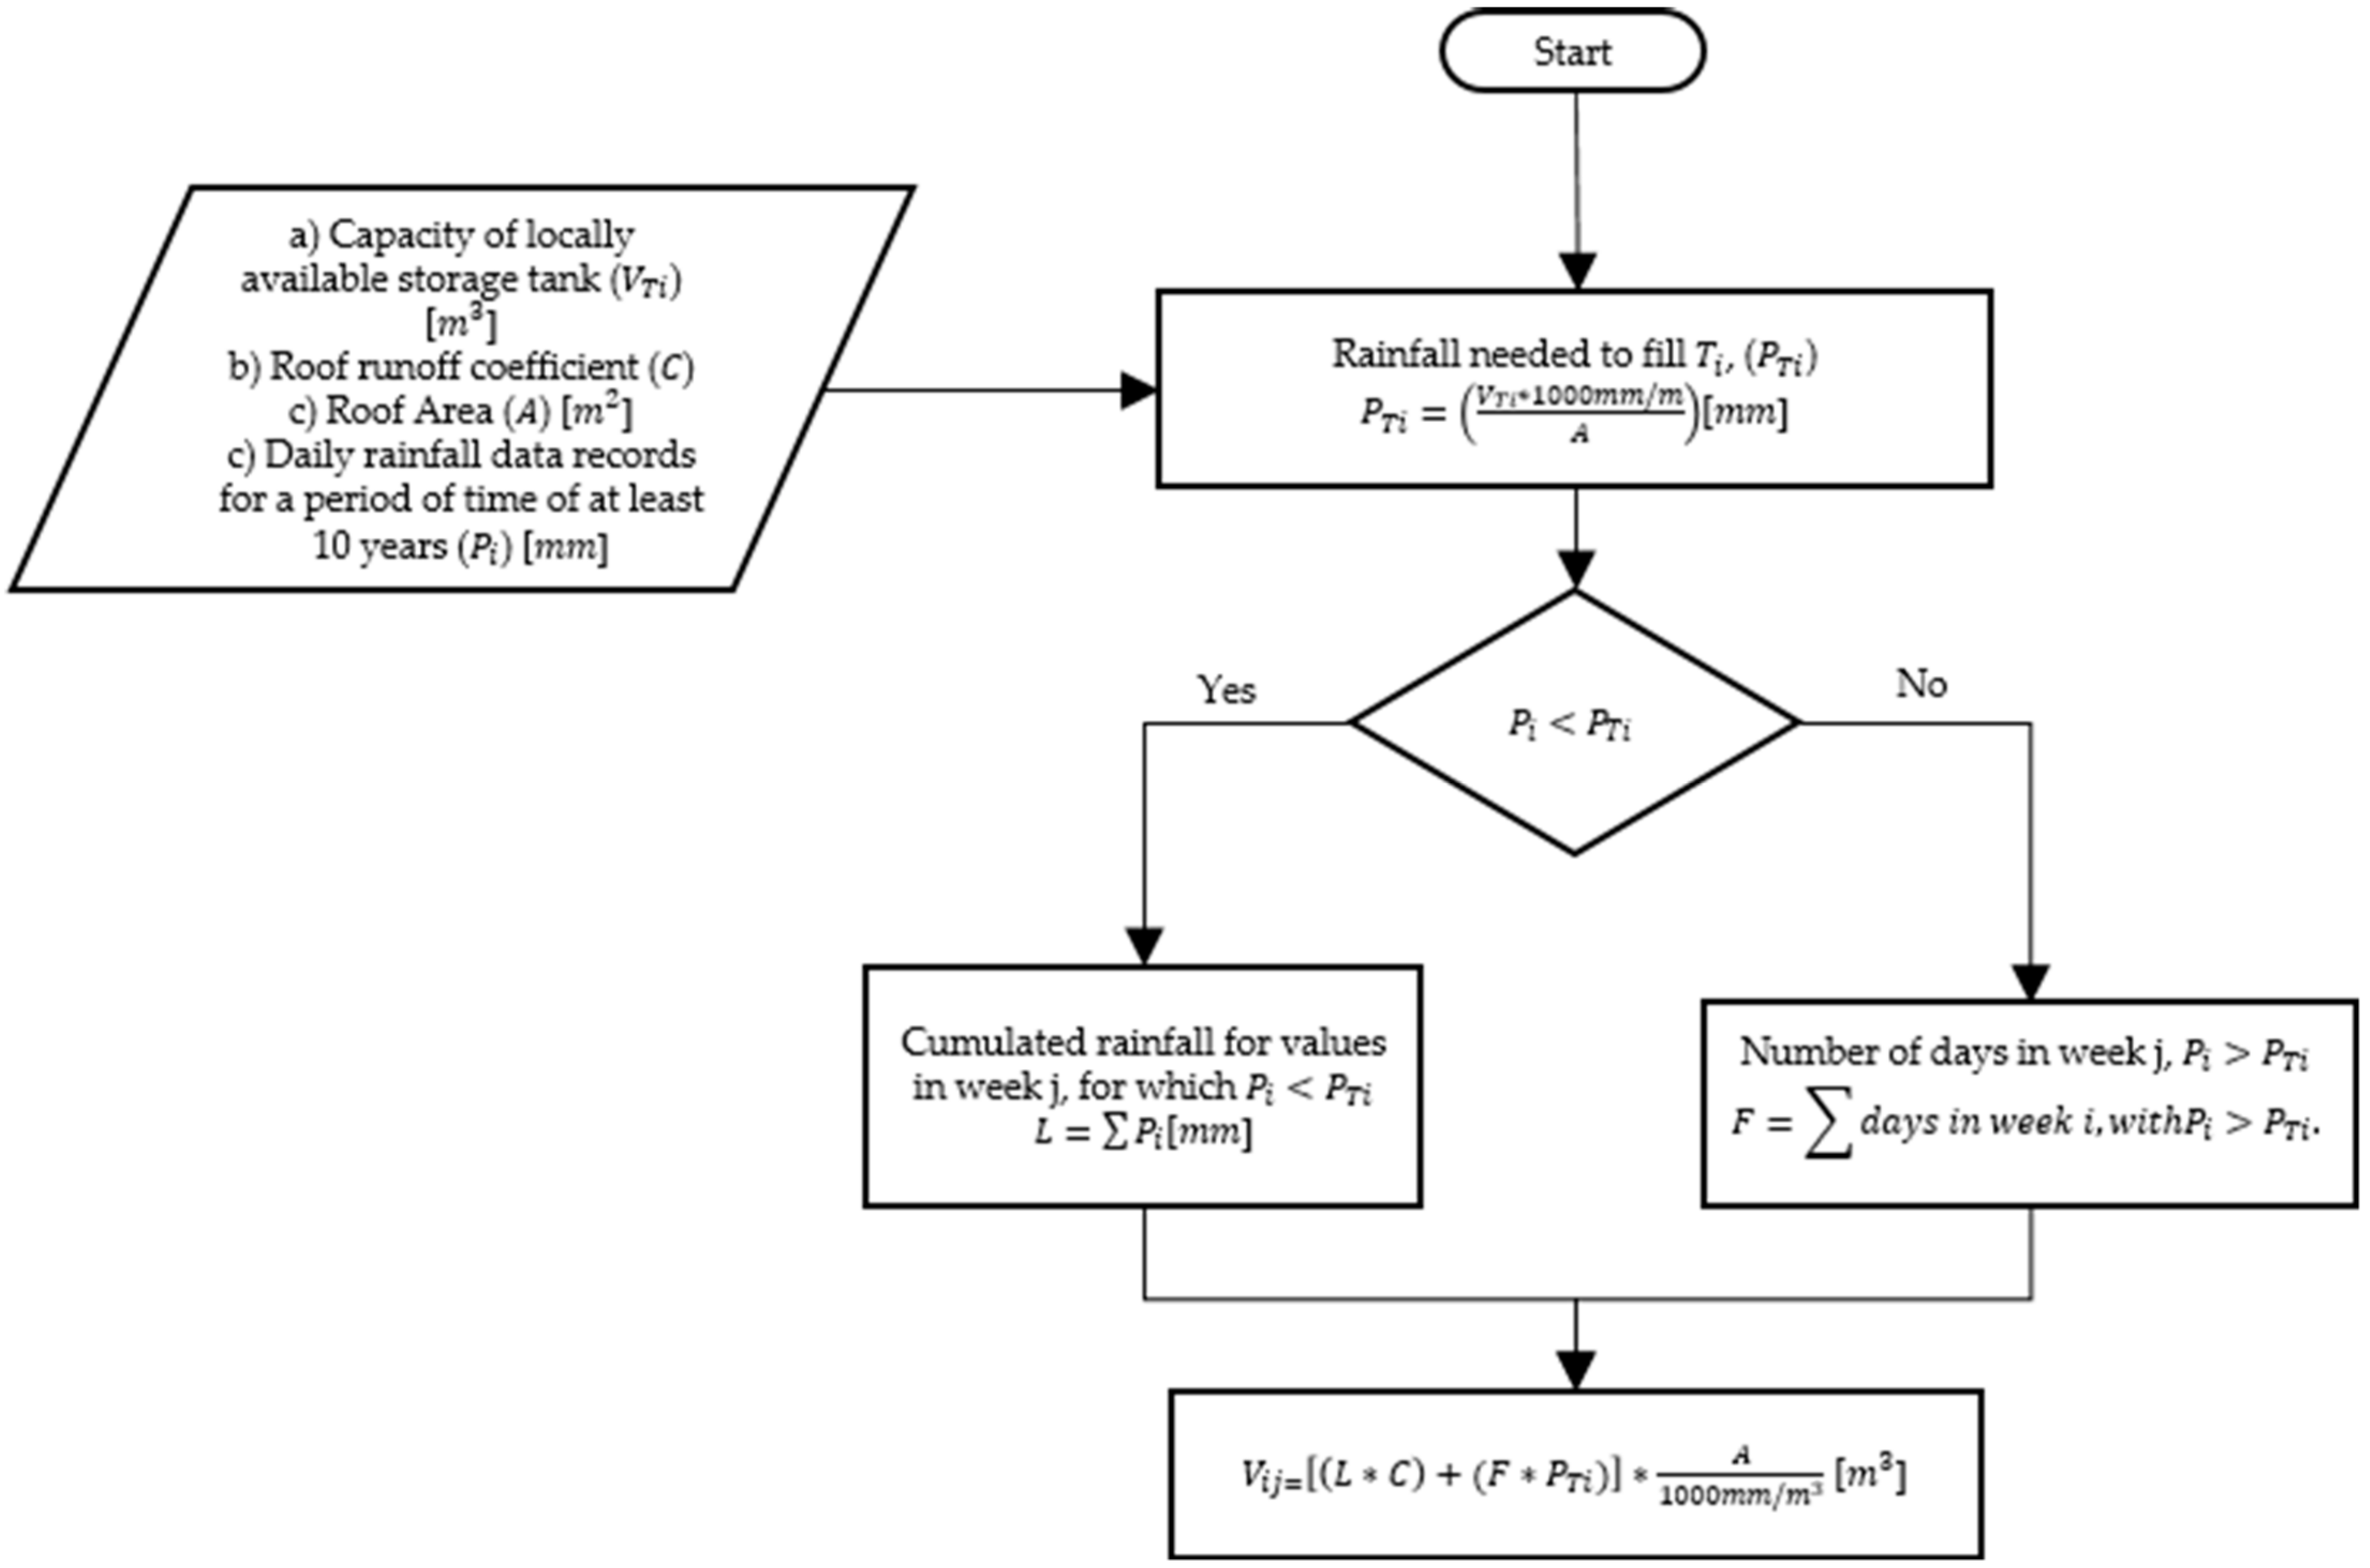
- Rainwater storage tank: Tanks for use in single-family houses, which were commercially available, were selected for analysis. For each tank size to be analyzed, a rainwater supply per week was calculated, as shown in Figure 1.The calculated water volumes for week j of tank i ( of each year were averaged. Subsequently, these averages were added to obtain the total annual rainwater supply.
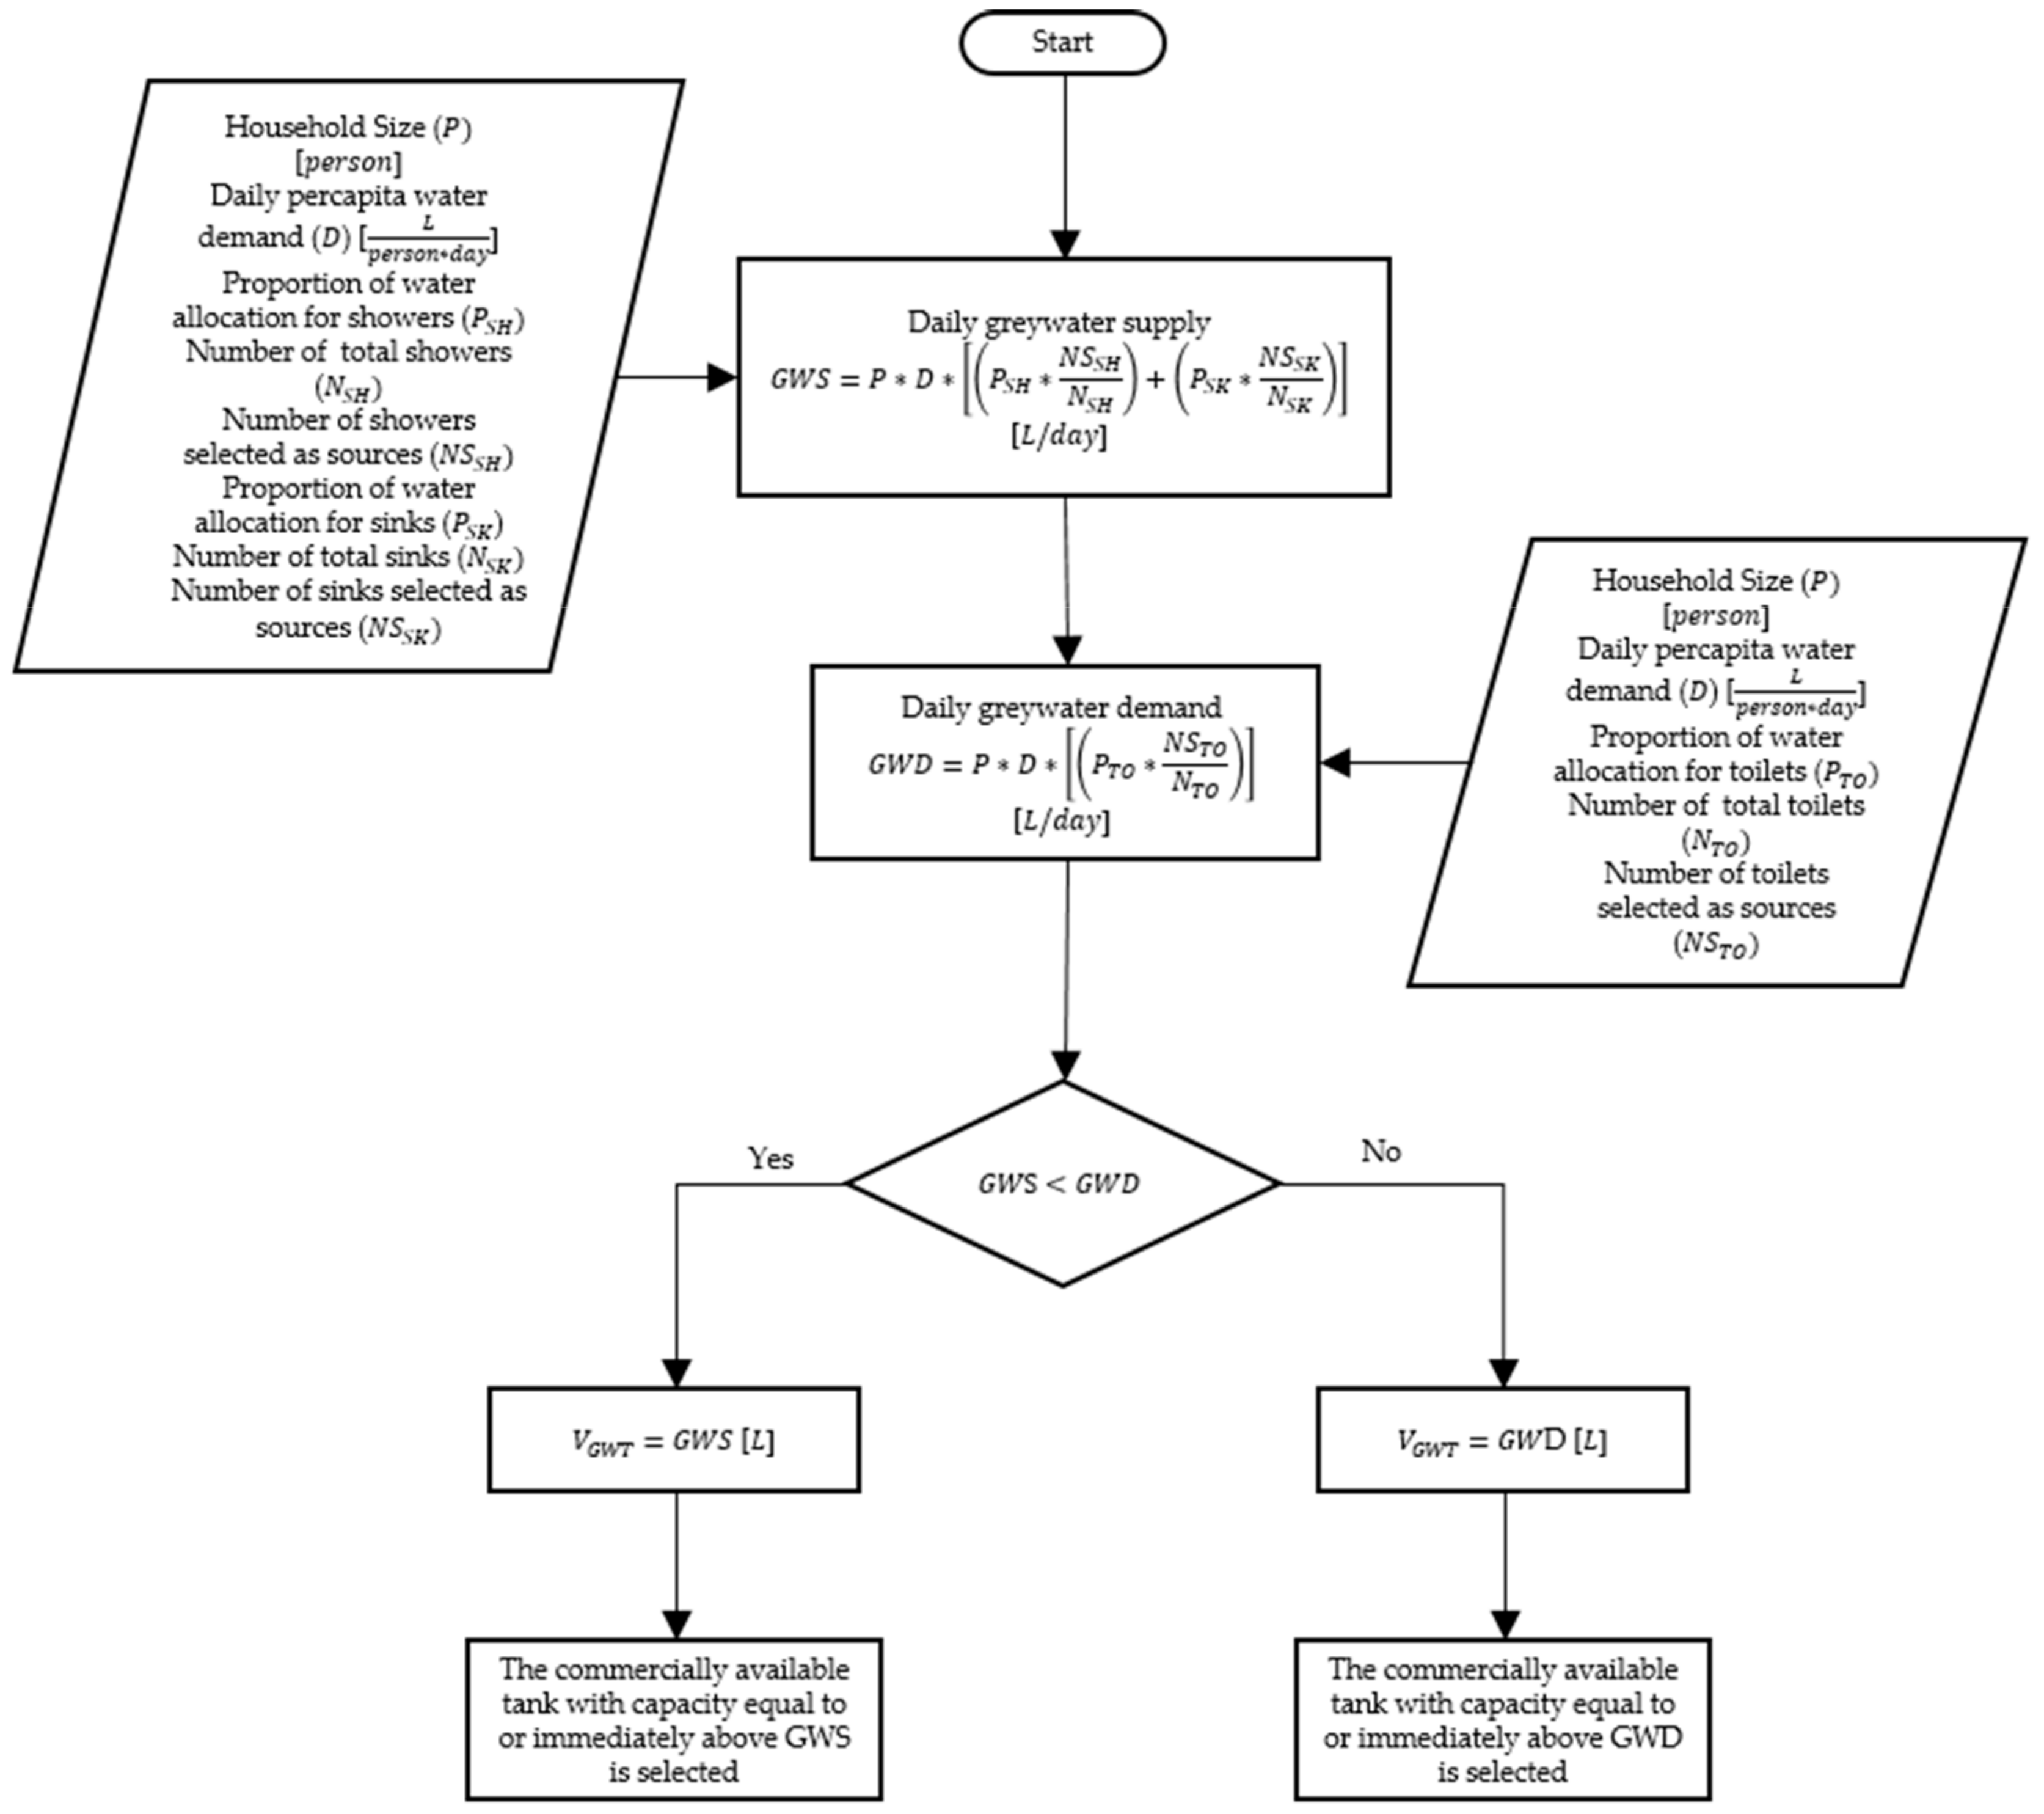
- Greywater storage tank: The dimensioning of the GW tank was done taking into account the lowest value between the GW daily demand and supply, for a reuse cycle of one day. The supply was GW from selected sources and the demand was based on the accepted uses obtained from the household survey. Figure 2 shows a detailed procedure for this dimensioning.
- Initial assessment:
- Drinking water savings:Drinking water savings due to RW were computed based on the difference between the weekly supply and demand when including the accumulation from the previous week (if available). Supply was considered variable and estimated as explained in point 3.a of this section. Demand was established considering the proportion of water consumed by each end-use and the total water consumption in the household. This demand was calculated for each week, considering the water quantity for each of the proposed alternatives, based on the total water consumption in the household and the consumption in the selected end-uses. The weekly supply was estimated for each week, based on the calculations previously described in Figure 1. The difference between supply and demand was calculated for each week of the year, in each year of the study period. When the difference between supply and demand was positive, the exceeding volume was added to the supply for the next week. When the difference between supply and demand was negative, the supply was considered insufficient for the demand in the tank option (Ti). Drinking water savings due to RW were established considering the higher value between supply and demand for each week. This was calculated for each year and each alternative. It was considered that if at the end of a week there was rainwater surplus, only an amount equal to or less than the tank volume could be stored. Drinking water savings were estimated for each year in the study period and finally, an average of the annual water savings of each alternative was calculated.With regards to potable water savings due to GW, those were calculated taking into account GW supply and demand. GW supply was determined from the total water demand of a house affected by factors associated with GW production from sources that were socially accepted by users for this particular case. The factors were values reported by the literature for Colombia. For the calculation of the GW demand, the proportion of total water demand corresponding to uses where people agreed to reuse greywater was taken into account. The same literature references were used. The drinking water savings associated with GW correspond to the lower value between GW supply and GW demand (Figure 2);
- Energy consumption:Volume of water pumped (Not taken into account in this study, due to the absence of pumping devices within the proposed alternatives);
- Selection of an alternative RWH/GWR configuration;
- Design of the selected alternative;
- Collection and distribution network layout—drinking, wastewater, collected greywater;
- Treatment system (rainwater and greywater)—filters, UV, primary, secondary.
- Financial feasibility of the selected alternative;
- Cost analysis—net construction cost (difference between the conventional system and system with RWH/GWR) including the total system cost, labour, maintenance, depreciation;
- Annual monetary savings:After estimating the drinking water savings from the proposed alternatives, the savings for water supply and sewage bills were estimated. This estimation took into account the bills charged by the water supply and sewage companies serving the study area, projected with an inflation rate.
- Financial feasibility:Financial feasibility was determined using financial indicators such as the cash flow (obtained from annual savings in water and sewage bills), payback period (PP) (Equation (1)), Net Present Value (NPV) (Equation (2)), and Internal Rate of Return (IRR) (Numerical methods from Excel software).where
- : number of years after the initial investment at which the last negative value of cumulative cash flow occurs
- : value of cumulative cash flow at which the last negative value of cumulative cash flow occurs
- : value of cash flow at which the first positive value of cumulative cash flow occurs
where- : net cash flow
- : discount rate
- : time of the cash flow
- : Total number of periods
It is beyond the scope of this paper to repeat in detail all of the steps of this method and so readers are referred to the original paper for detail. Instead, presented here are the parameter values that differ between the two studies, as well as additional steps that were added to improve the method.
2.3. Parameters for Financial Assessment of RWH/GWR Systems in Low Income, Low Consumption Households
The following revised parameters were used in the present study:
- Tank capacities—revised and reduced due to a lower daily consumption to include T1: 250 L, T2: 500 L, T3: 1000 L, T4: 1500 L, T5: 2000 L;
- Rainfall records for a twenty-five-year period (1985–2010) (excluding the year 1997, in which there was no rainfall data);
- Roof area—30.5 m2;
- Runoff coefficient—0.9;
- Potable water demand—65 households were assessed using water utility data and revealed an average occupancy of five, resulting in a total water consumption (650 L/day) and consumption for selected end-uses (126.1 L/day or 882.7 L/week—2.6% watering plants, 4.8% house cleaning, and 12% laundry, for a total daily consumption of 19.4%). In this research, the sample size of 65 households was calculated (Equation (3)) from a total population of 1593 households in the study area, with a confidence level of 90% and 10% error, using the equation for finite populations [29]. Households were selected using a completely randomized design [30]. Face to face interviews were carried out with the occupants of the selected households.
- n: sample size
- N: Total population
- Z: Value associated with a gauss distribution (1.645)
- p: expected prevalence (p = 0.5)
- q: 1 − p
- d: maximum error accepted
- GWR in Colombia: 26.7% laundry, 19.7% flushing toilets, 21.0% shower, 15.7% dishwashing, 4.8% house cleaning, 3.7% drinking, 4.0% hand washing, 1.8% vehicle washing, and 3.0% watering plants, adapted based on values from Ángel, Rozo [26].
- Bills charged for water supply (Ruitoque E.S.P. S.A.) and sewage (EMPAS S.A. E.S.P.), projected with an inflation of 4.16%, according to the change in the Consumer Price Index for the past 10 years in Colombia;
- NPV and Benefit/Cost (B/C) ratio—a discount rate of 3.51% was adopted as recommended for environmental projects in Colombia evaluated at medium term (between 26 and 75 years) [31].
In addition to these revised parameters, two steps were added to the original method resulting in the development of an improved method.
2.4. Improved Assessment Method
In order to examine the prioritization of benefits and costs amongst the householders, two additional steps were required to be added to the original method:
- 7.
- Benefit-cost ratio calculation;
- 8.
- Prioritization consultation with householders.
2.4.1. Benefit-Cost Ratio Calculation
In the original method, the overall results were presented in a profitability table, which summarized the PP and other statistics; however, a full benefit-cost ratio (B/C ratio) or Profitability Index Rate was not calculated. To include an indicator used in the formal discipline of cost-benefit analysis, the B/C ratio was added to summarize the overall value for the money of a system. For the B/C ratio to be calculated, all benefits and costs should be expressed in discounted present values (hence the inclusion of 3.51% in the present study).
2.4.2. Prioritization Consultation with Householders
In the original method, potential users participated in a household survey in order to capture the acceptability of different end-uses for RWH/GWR in different microcomponents. In order to gain insight into the prioritization preferences of householders, it was necessary to add in an additional follow-up consultation phase to engage them in the process of exploring tradeoffs between system costs and benefits such as the water volume and bill savings. In this follow-up consultation, the householders received: (i) sketches with the main features of the alternative configurations; (ii) costs of each alternative (initial investment and operation and maintenance); (iii) potable water savings; (iv) bill savings; and (v) payback period (PP). Based on the information of those five items, participants weighed up their preferences and selected one of the three proposed alternatives or the conventional option (no RWH/GWR).
The following section summarizes the results of the assessment and the consultation applied through the improved method.
3. Results and Discussion
To enable the prioritization preferences of the householders to be examined, the formulation of alternative RWH/GWR system designs with an integrated financial assessment was undertaken, as per the steps presented in the previous section. The results of the first five steps are presented together to aid continuity and the results of the final two steps are then presented.
3.1. Formulation and Integrated Financial Assessment of Alternative RWH/GWR System Designs
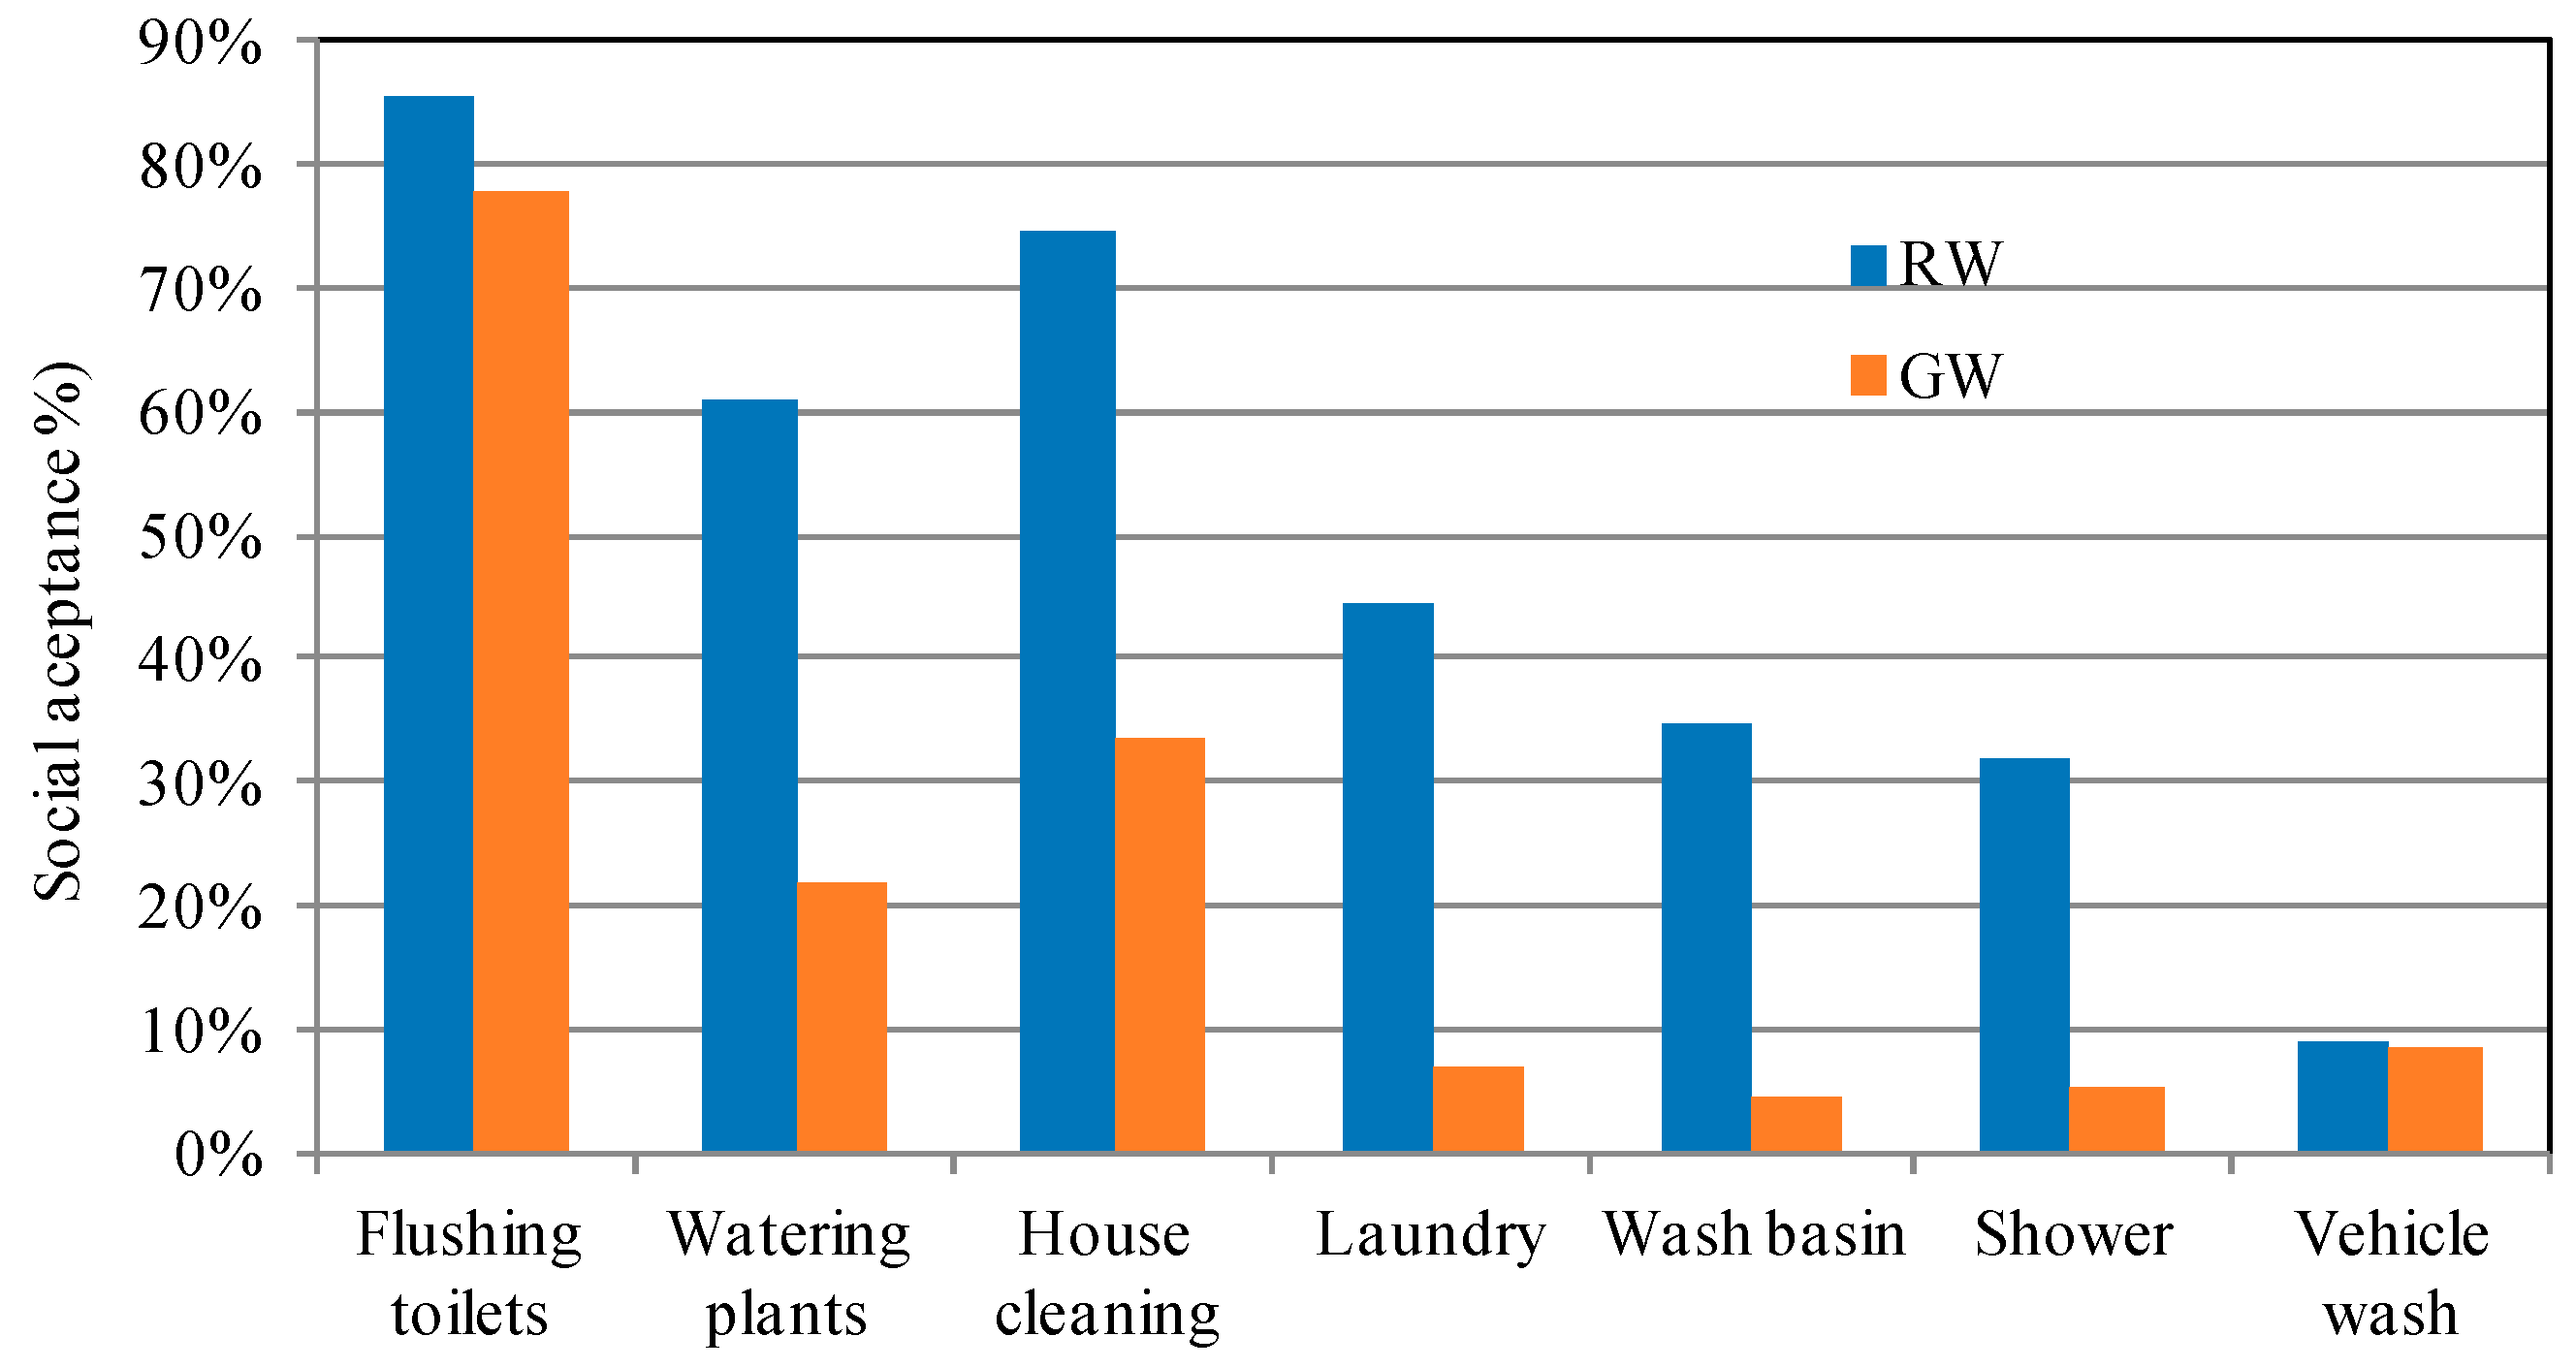
For the sample of householders from the study context, the end-user acceptability for GWR and RWH was 78% and 91%, respectively (Figure 3), which aligns with the findings of Oviedo-Ocaña, Dominguez [14] (86% and 97%, respectively), in households from a higher socioeconomic stratum (stratum six) in Bucaramanga. This is also in line with other international studies such as for the UK [32] (64 and 93%, respectively), and in Oman, where the GWR acceptability was 87% [33]. In relation to RWH, participants indicated that they were willing to use it in: (i) flushing toilets (86%), (ii) house cleaning (75%), (iii) watering plants (61%), and (iv) laundry (45%). Reasons stated for RWH were environmental concern (66%) and saving money (61%). Participants not willing to use RWH justified their decision based on hygiene concerns. With regards to GWR, participants stated that they were willing to reuse it in: flushing toilets (78%), house cleaning (34%), and watering plants (22%). This aligns with other studies where the willingness to use GWR for toilet flushing, the irrigation of gardens, house cleaning, and external applications has been demonstrated [34]. Reasons stated for accepting GWR included: environmental concern (70%) and saving money (56%), whilst water saving was the main reason for acceptability in water scarce regions such as Spain and Jordan [8]. The rejection of GWR was 20.6% based on hygiene concerns. In a study from Spain, the perception of health risks from GWR showed a high influence on acceptability. Concerning the willingness to undertake operation and maintenance activities, 86% of participants were willing to perform these activities fortnightly, 69% twice a week, and 33% daily, coinciding with findings from previous studies [14].
The average water consumption was 130 + 61 litres per capita per day (lpcd) with a coefficient of variation (CV) of 47%. This consumption is similar to that reported in Colombia for stratum one households by Ángel, Rozo [26] (124 lpcd), and considerably lower than that reported by Oviedo-Ocaña, Dominguez [14] in stratum six households in the study area (203 lpcd). This value is also within the range of the indoor domestic water demand (excluding garden irrigation and other external uses) reported by Friedler and Hadari [9] and Londra, Theocharis [35] in developed countries. The high value of the CV can be associated with the existence of small-scale commercial activities in the surveyed households (e.g., selling food), in line with the reported presence of subsistence activities that depend on water in poor urban areas [36]. Alternatively, this high variation could also be associated with potential irregularities in the flow measurement, since some households had water consumption levels well below the average (e.g., 25, 33, 39, and 44 lpcd), which seemed unreasonable in relation to the reported household occupancy (average of five occupants).
To assess the water quality, no empirical testing of microbiological or physicochemical parameters was undertaken for households in the study area. However, a literature review identified a range of results for the Colombian context, which are summarised in Table 1 and Table 2. Table 1 shows the harvested rainwater quality reported by different authors in Colombia and international regulations. Table 2 shows the results from physicochemical characteristics of domestic collected greywater and international regulations. As shown in Table 1 and Table 2, both RWH and GWR have concentrations of TSS and BOD5 exceeding limits established by Bastian and Murray [37] for the urban non-potable reuse of GWR and RWH. The most critical values are for GWR, which can be associated with the inclusion of dishwashing greywaters that may have a high concentration of organic matter, increasing the value of parameters such as BOD5, TSS, turbidity, and Total Coliforms. GW may contain a variety of microbial pathogens that can cause diseases, thus posing a risk to public health [38]. The risks are associated with accidental ingestion, inhalation, and contact with greywater [39]. The types and number pathogens vary with the source, storage time, and background levels in the community source [39]. However, a review on the safe on-site use of greywater suggested that reusing greywater from a single house system is much safer than reusing greywater from a neighbourhood-scale system [38]. Based on these considerations, the use of GWR from the kitchen was discarded and only greywaters from showers and washbasins were used for toilet flushing. As a consequence and in line with the reviewed literature [40,41,42], GWR treatment was limited to the appropriate selection of source water and filtration. Although membrane filtration is more effective to achieve the required level of certain parameters, these systems have higher energy and maintenance requirements, which limit their implementation in the context under study. Untreated wastewater was tested in Australia, which revealed that up to 28% of participants of a survey were reusing GW without treatment [43]. Since waste from toilets and water from kitchens were not included in this study as GW, it is expected that faecal contamination should be minimal, possibly from activities such as washing faecally contaminated laundry, childcare, and showering. Several studies have shown that the quality of raw GW deteriorates after 24 to 48 h of storage for parameters such as dissolved oxygen, ammonia, nitrogen, and suspended solids, in addition to the proliferation of indicators such as E. coli and Enterocci and pathogens such as Salmonella [39]. Thus, recommendations for handling untreated GW include excluding kitchen effluents as they may introduce third party pathogens, washing hands after use, avoid using it when household occupants are sick, and limiting storage for a period from 24 to 48 h [38]. After 24 h, one should remove unused GW from greywater tanks. In this study, the use of untreated GWR was selected with a reuse cycle of 24 h. For RWH, the focus was on simple systems that could be implemented in low-income households, for example, using first-flush devices that improve microbial quality but have a low impact on system costs (around 5%) [44]. Silva Vieira, Weeber [45] indicate that simple devices such as self-cleaning filters contribute to reducing turbidity and TSS levels. These systems are characterized for a lower user participation in operation and maintenance and are low cost (around $60). Consequently, given the potential contact with harvested rainwater in this case, RWH treatment included the protection of gutters and downpipes with an anti-pest mesh, self-cleaning leaves filter, self-cleaning filter to remove turbidity and SS, and a first-flush diversion device, similar to that proposed by Oviedo-Ocaña, Dominguez [14].
It was considered that in social housing, the water savings per household may be low compared to households from higher socioeconomic strata and that simple and economic systems not generating impacts (i.e., solid or liquid waste) or requiring electromechanical equipment (i.e., pumping systems) were needed. Based on these assumptions and end-user, water consumption, and water treatment criteria, three alternative GWR and RWH systems were designed:
- (i)
- Alt 1—GWR: collecting GWR water from showers and sinks from the second floor, conveyance to an elevated storage tank, and distribution to the toilet cistern on the first floor, where all GWR would be used;
- (ii)
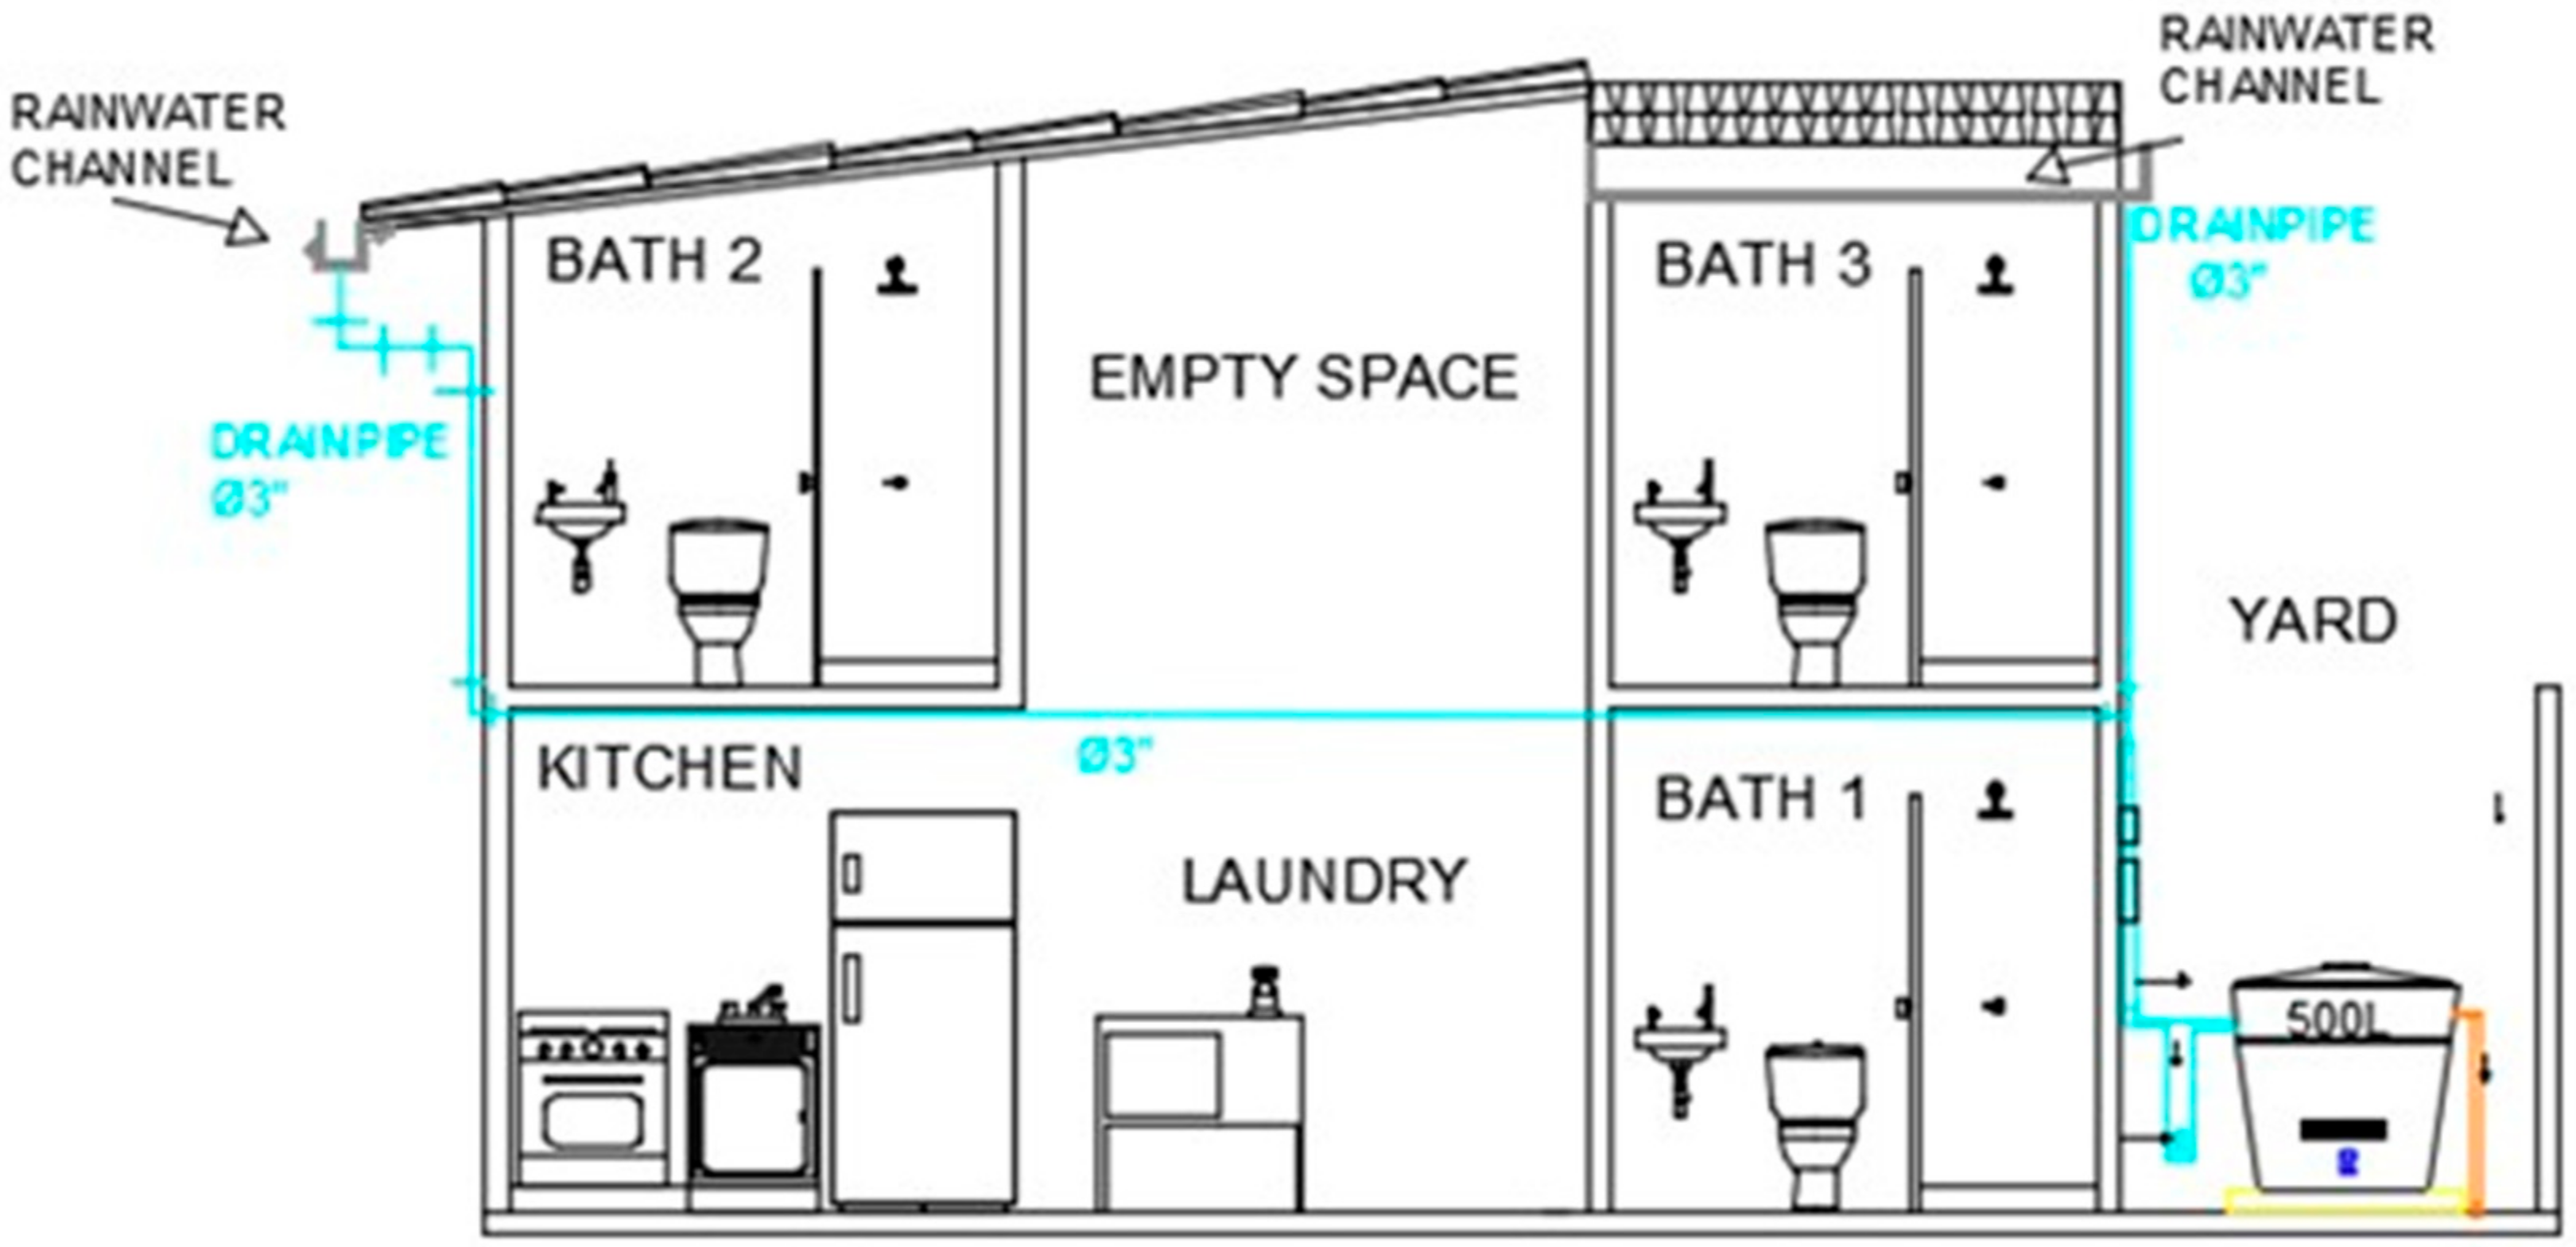
- Alt 2—RWH: collecting RW from the rooftop, draining to gutters and downpipes, and conveyance to a storage tank located on a concrete base 20 cm above the patio level. A tap near the base of the storage tank enabling end-uses to be fulfilled: watering plants, household cleaning, and in some cases, laundry. In this alternative, the end-user needs to carry the harvested rainwater from the storage tank to the point of use using containers to reduce costs from pumping and retrofitting pipework;
- (iii)
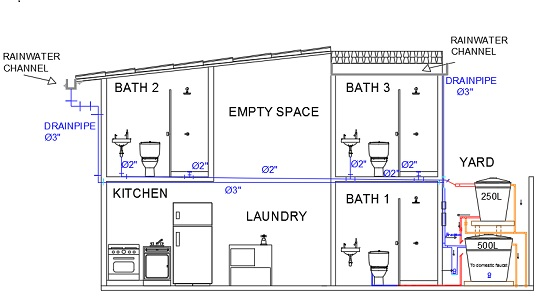
- Alt 3—GWR and RWH: combination of Alt 1 and 2.
Figure 4, Figure 5 and Figure 6 present conceptual schemes of the house with the layout of systems for Alt 1 to 3.
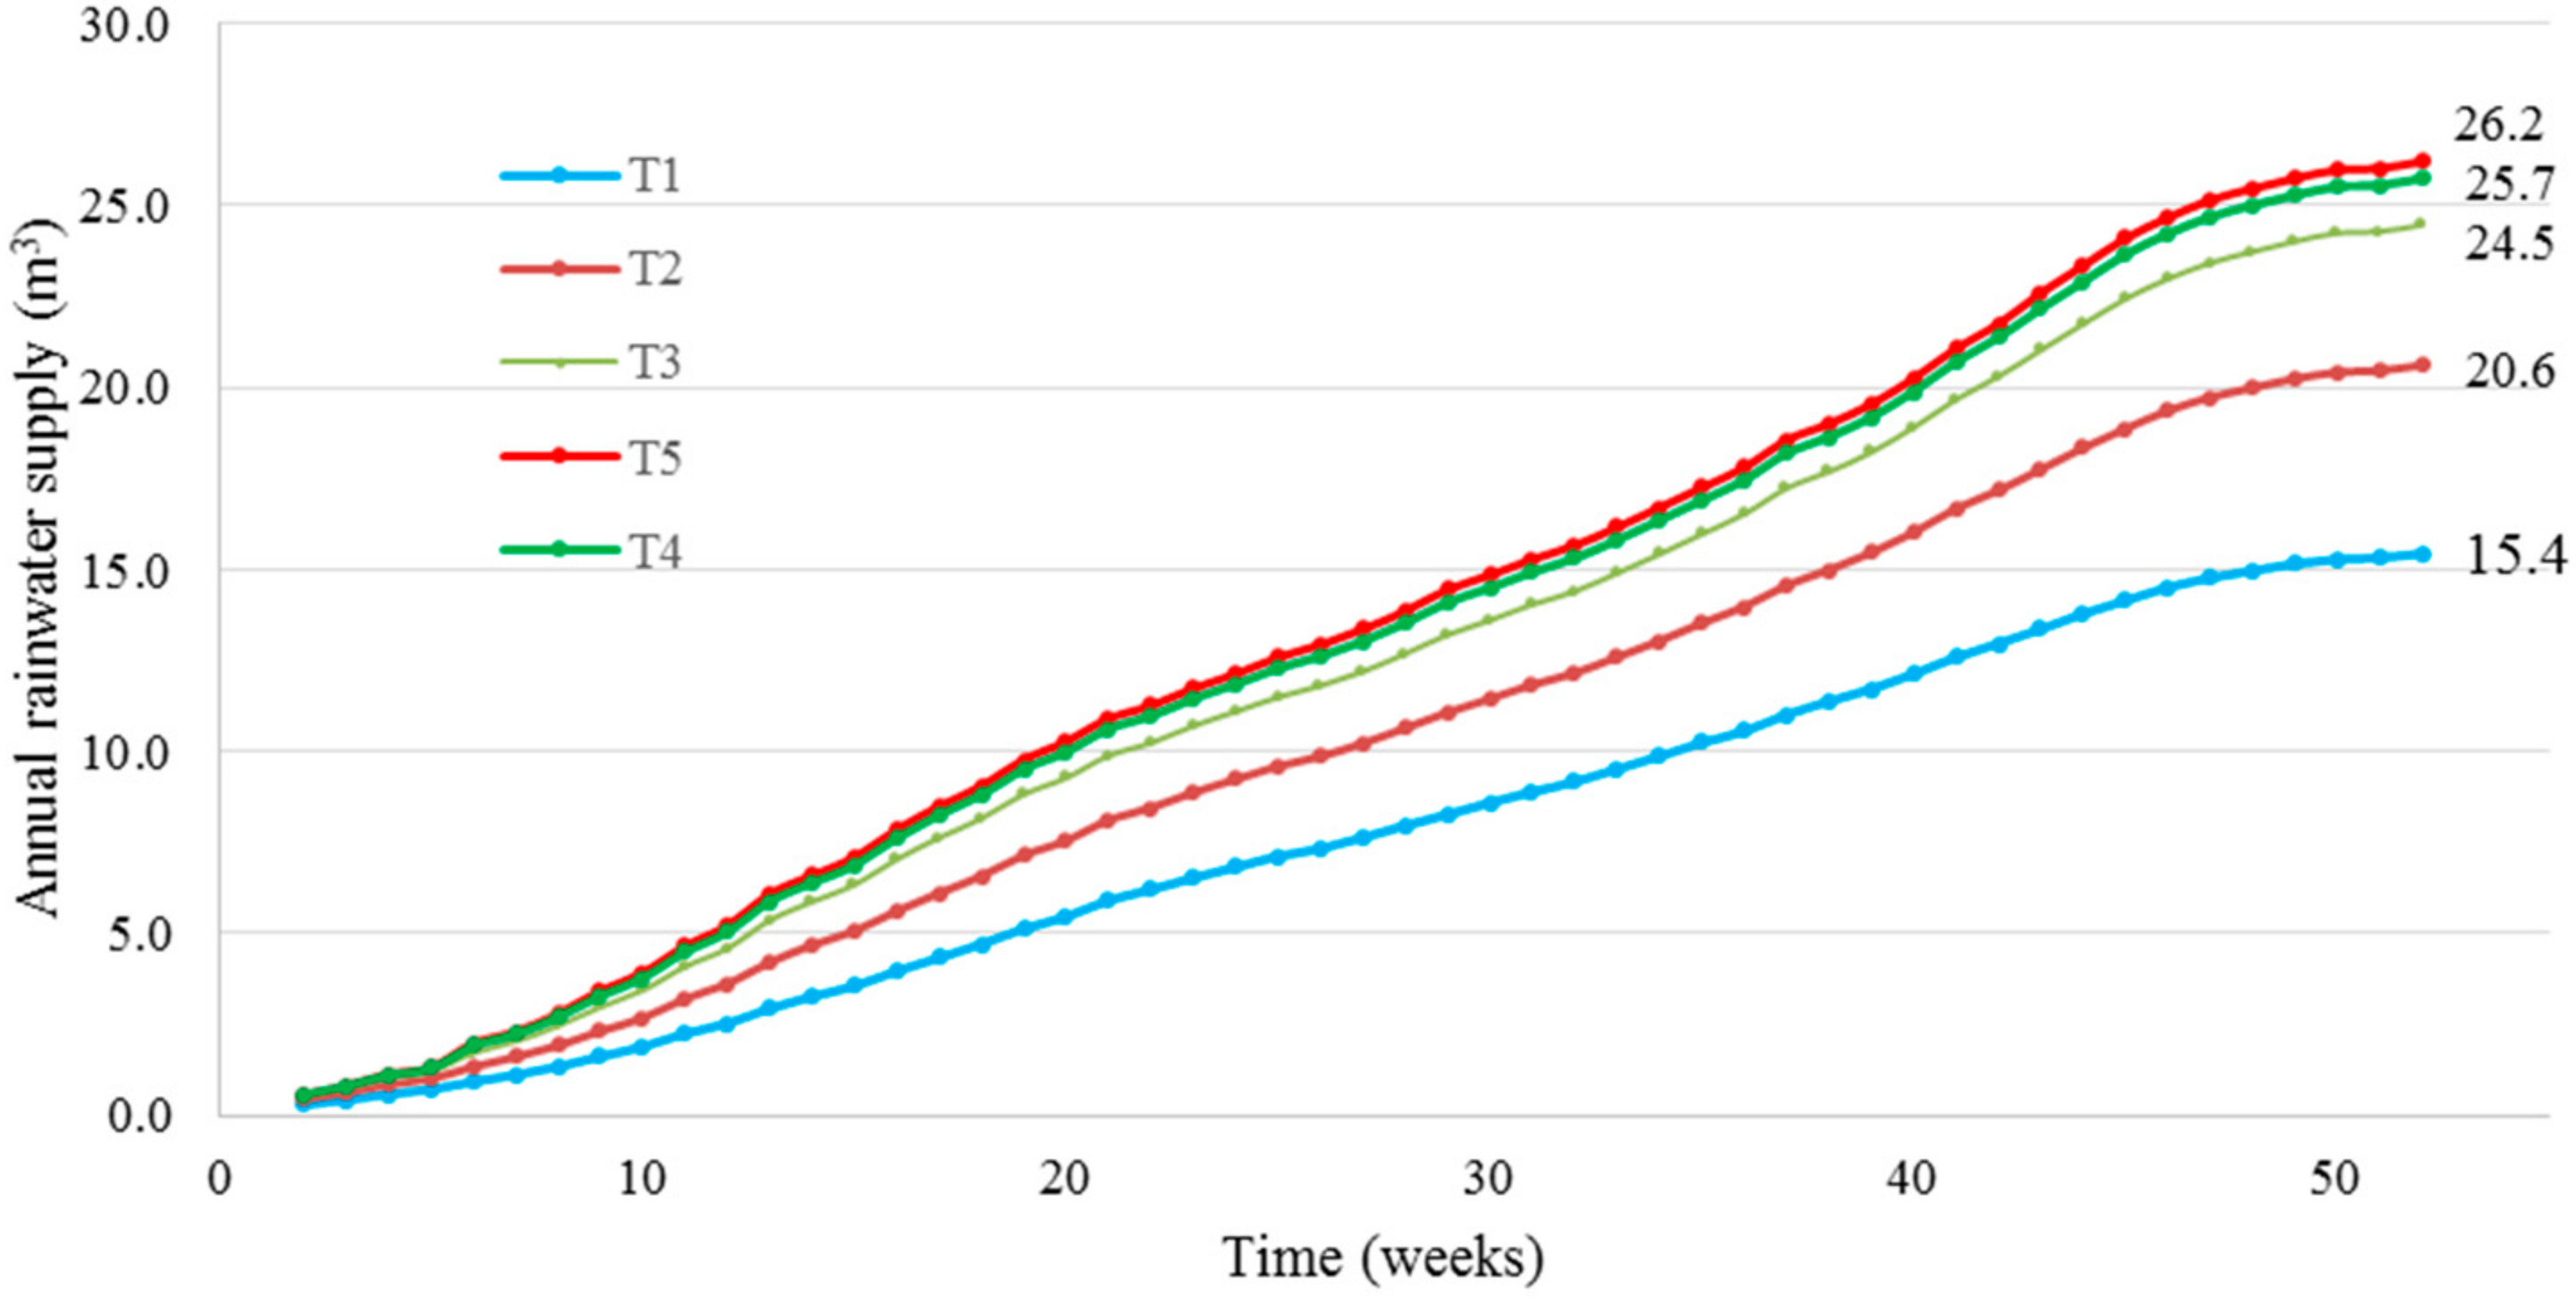
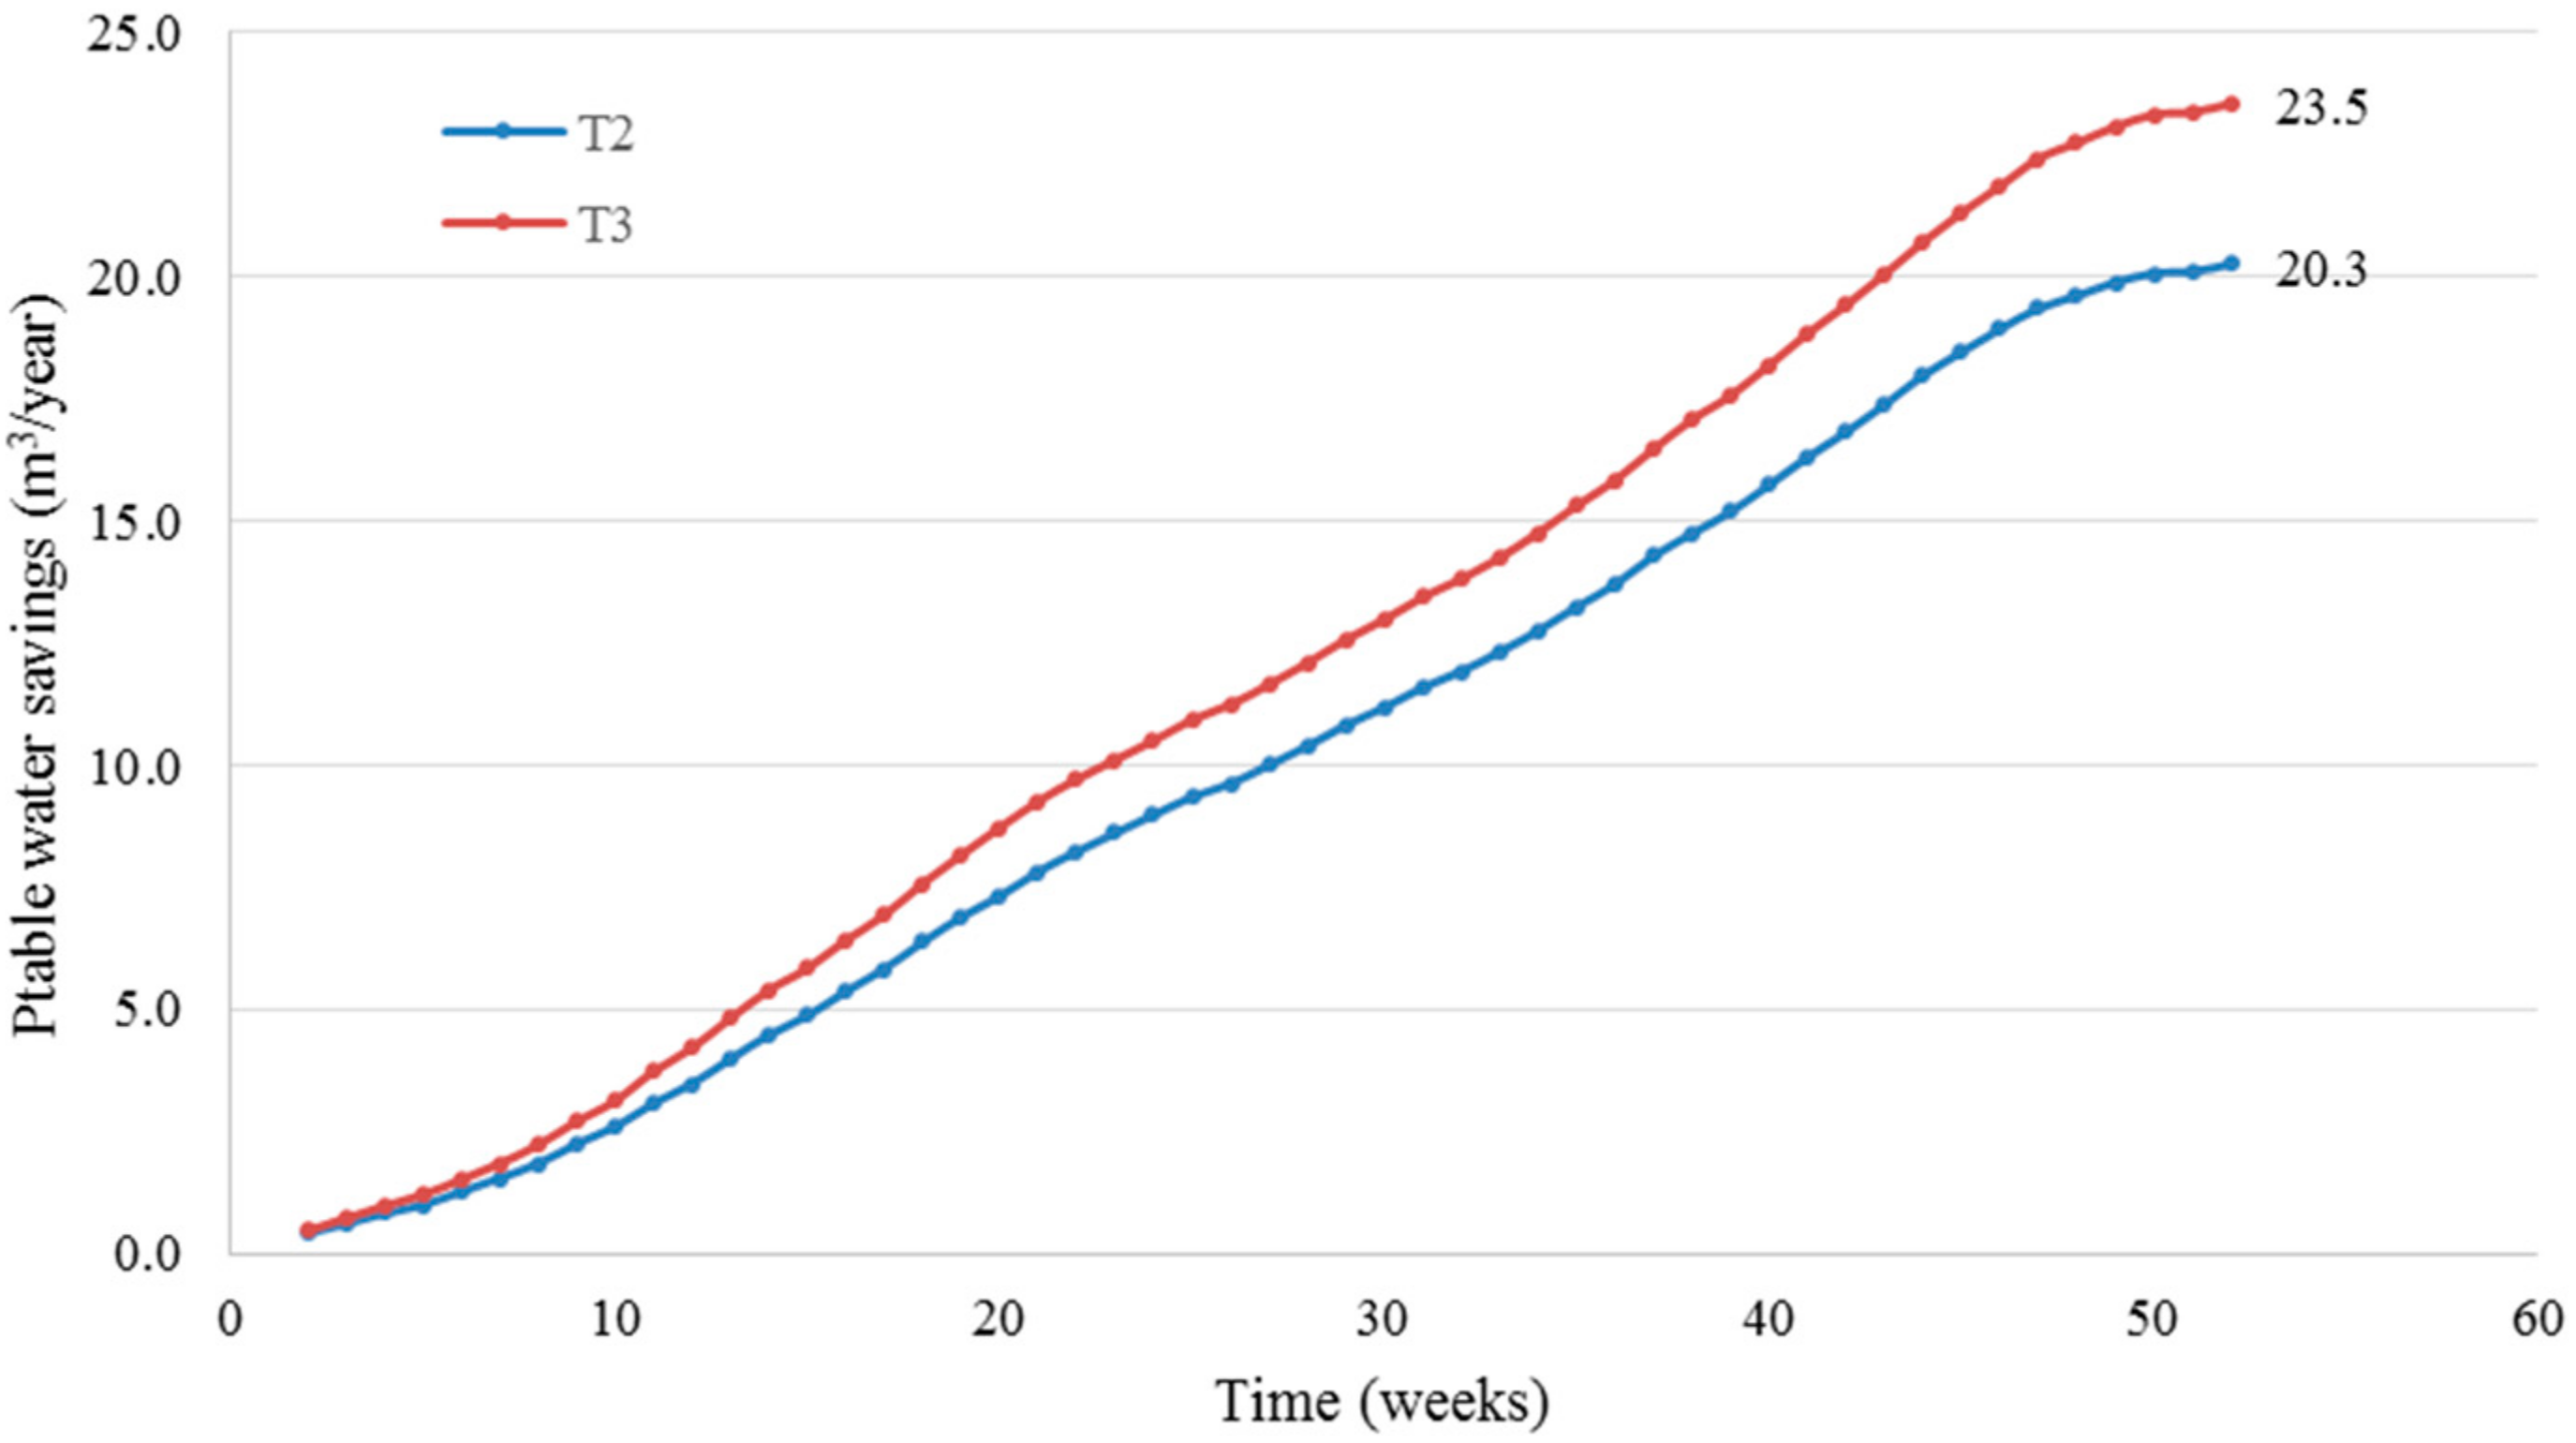
Collection and conveyance networks were kept simple and for GWR, a ¾′′ diameter was selected taking into account the physicochemical characteristics of greywater. For the RWH network, a diameter of 3′′ was obtained for all the elements: gutters, downpipes, and horizontal pipes. For GWR storage, it was estimated that the demand (126.1 L) was greater than the supply (108.3 L) and therefore storage was minimal, but due to commercial availability, a 250 L tank was selected and located at 1.7 m from the floor to ensure the required head pressure and comply with Colombian Plumbing Code NTC1500 [53]. For RWH storage tank sizing analysis, shown in Figure 7, as the tank size increased, the difference between the cumulative supply from tanks of consecutive sizes was smaller. Therefore, the increase in the supply of a larger tank is not offset by the higher investment cost. For example, by the end of the year, T5 and T4 offer a greater rainwater supply (26.2 and 25.7 m3) compared to that from T3 (24.5 m3). However, the difference in the annual accumulated supply between the tanks is low (T5 − T3 = 1.7 m3 and T4 − T3 = 1.2 m3) compared to their investment costs (T5 − T3 = US$ 78.3, and T4 − T3 = US$ 56.9). T1 was discarded due to the low rainwater supply it would provide (15.4 m3). Therefore, T2 and T3 were selected for further analysis, since they provided a potential annual rainwater supply of 20.6 and 24.5 m3, respectively. Annual potable water savings were estimated for T2 and T3 and Figure 8 shows that the potable water savings are 20.3 m3 (T2) and 23.5 m3 (T3). The difference in potable water savings between these tanks is 3.2 m3/year, equivalent to monetary savings of US$ 2.4/year. Based on these results, a storage tank of 500 L was selected, since the 1000 L tank represented a difference in investment costs of US$ 33.5 (compared to the difference in savings of US$ 2.4/year), but the additional quantity of RWH that could be collected was not substantial and demanded a larger space in the household. In general, the space occupied for both the RWH and GWR systems is less than 2 m2.
Regarding costs, the initial investment costs are summarised in Table 3 for the three proposed alternatives. Alt 3 has the higher initial investment cost (US$ 1041), compared to Alt 1 (US$ 524) and Alt 2 (US$ 533). For maintenance, costs relate to the cleaning of tanks and gutters. As shown in Table 4, Alt 3 has the higher maintenance costs.
In terms of volumetric savings, the total volume of potable water that could be saved annually with the implementation of Alt 2 is 20.31 m3 (i.e., 8.5% of the of the household annual water consumption). The potable water saving due to Alt 1 is 39.5 m3/year (16.6% of the of the household annual water consumption). Therefore, the total saving of potable water in a year for Alt 3 is 59.8 m3 (25.2% of the of the household annual water consumption). This equates to a monetary saving due to water supply and sewerage services in the first year of operation, as summarised in Table 5. In 2016, the water bill for stratum one was 0.31 US$/m3 [54], and the sewage bill was 0.22 US$/m3 [55].
3.2. Benefit-Cost Ratio and Prioritization Consultation
Based on the costs and benefits summarized in the previous section, the IRR, NPV, PP, and B/C ratio were calculated. Table 6 shows the results from a cash flow for 50 years for the three proposed alternatives. From these results, it is observed that Alt 1 and Alt 3 have an IRR higher than the discount rate, an NPV higher than zero, and a B/C ratio higher than one. Therefore, considering all these indicators, Alt 1 and Alt 3 are financially feasible. With regards to Alt 2, although it does not appear to be financially feasible, a more comprehensive economic assessment that quantifies the externalities resulting from the implementation of this system could change this result.
Results from research in this area have obtained similar results to those reported here (refer to Table 7). Oviedo-Ocaña, Dominguez [14], Ghisi and Mengotti de Oliveira [56], and Domnech and Saurí [8] obtained similar PPs of 22, 29, and 37 years, respectively. These results are comparable to the findings from Alt 1 and Alt 3 (23.3 and 29.8 years, respectively). With regards to IRR, Oviedo-Ocaña, Dominguez [14] reported a value of 6.80% compared to 6.67% and 4.69% for Alt 1 and Alt 3 in this case study. For systems in buildings [57] and offices [58], given the economies of scale, the PP value was 11 years, which is significantly lower than the results for individual households obtained here.
In the present study, to calculate NPV and the B/C ratio, a discount rate of 3.51% was adopted, as recommended for environmental projects in Colombia [31]. Even though a discount rate for NPV typically used by other authors to analyze the financial performance of RWH systems in other countries is 5% [56,61,62], the lower value adopted in this study can be justified by the present analysis only including the direct costs and benefits for the homeowner—it lacks a broader study of the costs and benefits that the implementation of alternative water source systems represents for the society as a whole. Therefore, the results of this study should be complemented by evaluating the externalities of this type of project in the social and environmental dimensions. This type of analysis should include not only the individual consumer, but also the entire society from the city or region, which under the current circumstances, does not assume any cost but enjoys a wide range of benefits with the implementation of alternative water sources systems [9]. Future studies should include aspects such as those suggested by Liang and van Dijk [63], for example: (i) social awareness towards water availability and protection; (ii) noise pollution; (iii) avoided water pollution; (iv) avoided aquifer overexploitation; (v) chemical and biological risks associated with wastewater reuse; and (vi) avoided treatment water costs. Incorporating these relevant externalities could have a significant impact on the results of economic feasibility. Similarly, environmental criteria are increasingly been considered more rigorously in these analyses, by complementing the financial evaluation with life cycle analysis (LCA), environmental impact assessment (EIA) [61], or energy indicators [64].
The final step in the assessment was to engage potential end-users with the financial and B/C ratio results in order to examine their prioritization preferences. Table 8 synthesizes the summary presented to potential the end-users during a follow-up consultation.
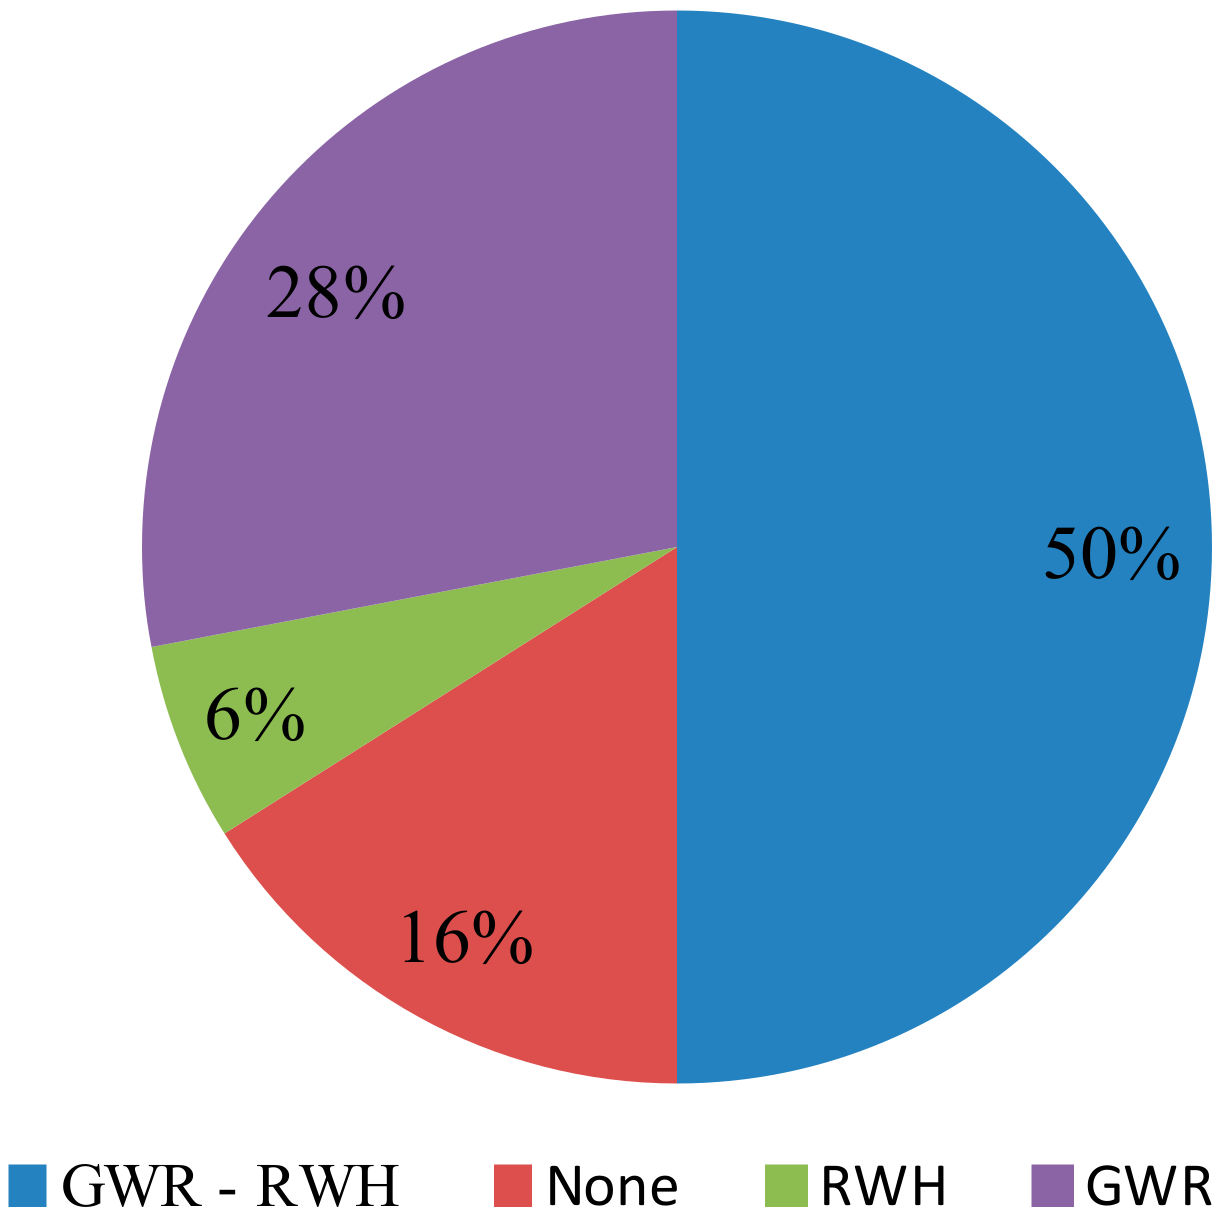
Results from the follow-up consultation indicated that 100% of participants were interested in saving potable water and as shown in Figure 9, 84% were willing to invest in the implementation of one of the three proposed alternatives.
Although Alt 3 had the higher initial investment costs, it had the greatest acceptability among participants (50%), who prioritised saving a larger water quantity over minimising costs. A total of 28% of participants prioritised using the GWR system, considering it had the better potable water savings and costs ratio. Only 6% prioritized the RWH system due to the rejection of using GWR. End-users who indicated they would not implement any of the three alternatives (16%) argued that there was a lack of resources for investment, despite their interest in saving water and money. That most potential end-users selected the most expensive alternative, which generated the greatest water savings, is a counterintuitive result for a low-income community, but is in line with results suggesting that the main reason for public support for the use of alternative sources in some contexts is the awareness towards water conservation [8,9]. The reasons for the selection of the other alternatives expressed by the participants, such as public health risk and investment costs, have also been widely identified in the literature on the subject [34].
4. Conclusions
In response to the increasing water scarcity and to assist in the scaling up of alternative water supply systems, insights into the prioritization preferences of end-users is of key importance. This paper evaluated the social, technical, and financial feasibility of a water supply system using alternative water sources (rainwater and greywater) in low-income housing (stratum one) with low water consumption (130 lpcd) in a city from a developing country (Bucaramanga—Colombia). An improved method for the formulation, assessment, and prioritization of RWH and GWR systems was presented and applied to households in a study area of Bucaramanga. Two financially feasible alternatives were identified: using only greywater from showers and washbasins to be used for flushing toilets (Alt 1) and the use of greywater combined with the use of rainwater for washing clothes, watering plants, and house cleaning (Alt 3). The alternative of using only rainwater for washing clothes, watering plants, and house cleaning (Alt 2) was not financially viable. For Alt 1, the IRR was 6.67%, the NPV was US$ 526, the B/C was 2.04, and PP was 23.3 years. For Alt 3, the IRR was 4.69%, the NPV was US$ 337, the B/C was 1.34, and the PP was 29.8 (30) years. These results are less attractive compared to those reported for multifamily/large buildings, but this may be offset by the greater social acceptance of alternative sources, especially greywater, in single-family housing systems. In a follow-up consultation with potential end-users to determine their prioritization preference for these options, Alt 3 was selected by the majority, despite having higher initial investment costs (US$ 1041) than the other alternatives, due to the better potable water savings offered (59.80 m3/year). This result indicates that in this study, despite their low-income capacity, potential end-users privilege water conservation criteria over investment criteria during decision-making. However, further real-world studies are needed to determine whether end-users would follow through and actually invest in line with their intentions.
Acknowledgments
The authors thank Universidad Industrial de Santander for the support received while writing this paper.
Author Contributions
Isabel Domínguez and Edgar Ricardo Oviedo-Ocaña conceived and designed the experiments; Jose Gabriel Mendoza and Carlos Iván Rincón performed the experiments and analyzed the data; Isabel Domínguez, Edgar Ricardo Oviedo-Ocaña, and Sarah Ward checked the analysis and Isabel Domínguez, Sarah Ward, and Edgar Ricardo Oviedo-Ocaña wrote the paper, which was checked by all other authors.
Conflicts of Interest
The authors declare no conflict of interest.
References
- United Nations. Transforming Our World: The 2030 Agenda for Sustainable Development; Department of Economic and Social Affairs: New York, NY, USA, 2015. [Google Scholar]
- Owusu, K.; Teye, J.K. Supplementing urban water supply with rainwater harvesting in Accra, Ghana. Int. J. Water Resour. Dev. 2015, 31, 630–639. [Google Scholar] [CrossRef]
- International Monetary Fund. IMF Survey: World Reaches Urban Tipping Point. Available online: https://www.imf.org/en/News/Articles/2015/09/28/04/53/sores104a (accessed on 12 July 2017).
- The United Nations World Water Assessment Programme. The United Nations World Water Development Report 2015: Water for a Sustainable World; United Nations World Water Assessment Programme (WWAP): Paris, France, 2015. [Google Scholar]
- Fletcher, T.D.; Shuster, W.; Hunt, W.F.; Ashley, R.; Butler, D.; Arthur, S.; Trowsdale, S.; Barraud, S.; Semadeni-Davies, A.; Bertrand-Krajewski, J. SUDS, LID, BMPs, WSUD and more—The evolution and application of terminology surrounding urban drainage. Urban Water J. 2015, 12, 525–542. [Google Scholar] [CrossRef]
- Sanches Fernandes, L.F.; Terêncio, D.P.; Pacheco, F.A. Rainwater harvesting systems for low demanding applications. Sci. Total Environ. 2015, 529, 91–100. [Google Scholar] [CrossRef] [PubMed]
- Silva, C.M.; Sousa, V.; Carvalho, N.V. Evaluation of rainwater harvesting in Portugal: Application to single-family residences. Resour. Conserv. Recycl. 2015, 94, 21–34. [Google Scholar] [CrossRef]
- Domnech, L.; Saurí, D. Socio-technical transitions in water scarcity contexts: Public acceptance of greywater reuse technologies in the Metropolitan Area of Barcelona. Resour. Conserv. Recycl. 2010, 55, 53–62. [Google Scholar] [CrossRef]
- Friedler, E.; Hadari, M. Economic feasibility of on-site greywater reuse in multi-storey buildings. Desalination 2006, 190, 221–234. [Google Scholar] [CrossRef]
- Li, F.; Wichmann, K.; Otterpohl, R. Review of the technological approaches for grey water treatment and reuses. Sci. Total Environ. 2009, 407, 3439–3449. [Google Scholar] [CrossRef] [PubMed]
- Mourad, K.A.; Berndtsson, J.C.; Berndtsson, R. Potential fresh water saving using greywater in toilet flushing in Syria. J. Environ. Manag. 2011, 92, 2447–2453. [Google Scholar] [CrossRef] [PubMed]
- Suarez, B.; García, M.; Galarza, R. Sistemas de aprovechamiento de agua lluvia para vivienda urbana. In Proceedings of the VI Serea-Seminario Iberoamericano Sobre Sistemas de Abastecimiento Urbano de Agua, João Pessoa, Brasil, 5–7 June 2006. [Google Scholar]
- Sojka, S.; Younos, T.; Crawford, D. Modern Urban Rainwater Harvesting Systems: Design, Case Studies, and Impacts. In Sustainable Water Management in Urban Environments; Springer: Basel, Switzerland, 2016; pp. 209–234. [Google Scholar]
- Oviedo-Ocaña, E.R.; Dominguez, I.; Ward, S.; Rivera-Sanchez, M.L.; Zaraza-Peña, J.M. Financial feasibility of end-user designed rainwater harvesting and greywater reuse systems for high water use households. Environ. Sci. Pollut. Res. 2017. [Google Scholar] [CrossRef] [PubMed]
- Balogun, I.; Sojobi, A.; Oyedepo, O. Assessment of rainfall variability, rainwater harvesting potential and storage requirements in Odeda Local Government Area of Ogun State in South-western Nigeria. Cogent Environ. Sci. 2016, 2, 1138597. [Google Scholar] [CrossRef]
- Friedler, E. The water saving potential and the socio-economic feasibility of greywater reuse within the urban sector—Israel as a case study. Int. J. Environ. Stud. 2008, 65, 57–69. [Google Scholar] [CrossRef]
- Godfrey, S.; Labhasetwar, P.; Wate, S. Greywater reuse in residential schools in Madhya Pradesh, India—A case study of cost-benefit analysis. Resour. Conserv. Recycl. 2009, 53, 287–293. [Google Scholar] [CrossRef]
- Ilemobade, A.; Olanrewaju, O.; Griffioen, M. Greywater reuse for toilet flushing at a university academic and residential building. Water SA 2013, 39, 351–360. [Google Scholar] [CrossRef]
- Juan, Y.; Chen, Y.; Lin, J. Greywater reuse system design and economic analysis for residential buildings in Taiwan. Water 2016, 8. [Google Scholar] [CrossRef]
- Melville-Shreeve, P.; Ward, S.; Butler, D. Rainwater harvesting typologies for UK houses: A multi criteria analysis of system configurations. Water 2016, 8. [Google Scholar] [CrossRef]
- Mohamed, N.M.; Ali, S.S. Economic study for greywater reuse to achieve the sustainability in Egypt. Aust. J. Basic Appl. Sci. 2012, 6, 655–665. [Google Scholar]
- Morales-Pinzón, T.; García-Serna, M.I.; Flórez-Calderón, M.T. Quality of rainwater harvesting in urban systems: Case study in Colombia. Water Pract. Technol. 2015, 10, 424–431. [Google Scholar] [CrossRef]
- Torres, A.; Méndez-Fajardo, S.; Torres, A.P.G.; Sandoval, S. Quality of rainwater runoff on roofs and its relation to uses and rain characteristics in the Villa Alexandra and Acacias neighborhoods of Kennedy, Bogota, Colombia. J. Environ. Eng. (U.S.) 2013, 139, 1273–1278. [Google Scholar] [CrossRef]
- Campisano, A.; Butler, D.; Ward, S.; Burns, M.J.; Friedler, E.; DeBusk, K.; Fisher-Jeffes, L.N.; Ghisi, E.; Rahman, A.; Furumai, H.; et al. Urban rainwater harvesting systems: Research, implementation and future perspectives. Water Res. 2017, 115, 195–209. [Google Scholar]
- Departamento Nacional de Planeación. Documento Conpes 3386: Plan de Acción para la Focalización de los Subsidios para Servicios Públicos Domiciliarios; Consejo Nacional de Política Económica y Social (Conpes) y Departamento Nacional de Planeación (DNP): Bogotá, Colombia, 2005.
- Ángel, J.; Rozo, J.; Hernández, L.; Valderrama, D. Estimación del consumo básico de agua potable en Colombia. Revista de Regulación-CRA 2001, 7, 15–42. [Google Scholar]
- Ministerio de Vivienda, Ciudad y Territorio. Decreto 75 de 2013; Diario Oficial: Bogotá, Colombia, 2013.
- Instituto de Hidrología, Meteorologia y Estudios Ambientales. Precipitation Data. Available online: http://www.ideam.gov.co/web/tiempo-y-clima/precipitacion-en-el-contexto-historico (accessed on 12 July 2017).
- Fernández, P. Determinación del tamaño muestral. Cad Aten Primaria 1996, 3, 138–141. [Google Scholar]
- Casal, J.; Mateu, E. Tipos de muestreo. Rev. Epidem. Med. Prev. 2003, 1, 3–7. [Google Scholar]
- Correa, F. Tasa de descuento ambiental Gamma: Una aplicación para Colombia. Lecturas de Economía 2009, 69, 141–162. [Google Scholar]
- Ward, S.; Barr, S.; Memon, F.; Butler, D. Rainwater harvesting in the UK: Exploring water-user perceptions. Urban Water J. 2013, 10, 112–126. [Google Scholar] [CrossRef]
- Jamrah, A.; Al-Futaisi, A.; Prathapar, S.; Harrasi, A.A. Evaluating greywater reuse potential for sustainable water resources management in Oman. Environ. Monit. Assess. 2008, 137, 315–327. [Google Scholar] [CrossRef] [PubMed]
- Mankad, A.; Tapsuwan, S. Review of socio-economic drivers of community acceptance and adoption of decentralised water systems. J. Environ. Manag. 2011, 92, 380–391. [Google Scholar] [CrossRef] [PubMed]
- Londra, P.A.; Theocharis, A.T.; Baltas, E.; Tsihrintzis, V.Α. Optimal Sizing of Rainwater Harvesting Tanks for Domestic Use in Greece. Water Resour. Manag. 2015, 29, 4357–4377. [Google Scholar] [CrossRef]
- Smits, S.; Van Koppen, B.; Moriarty, P.; Butterworth, J. Multiple-use services as an alternative to rural water supply services: A characterisation of the approach. Water Altern. 2010, 3, 102–121. [Google Scholar]
- Bastian, R.; Murray, D. Guidelines for Water Reuse, EPA/600/R-12/618; Environmental Protection Agency, Municipal Support Division Office of Wastewater Management Office of Water: Washington, DC, USA; Agency for International Development: Washington, DC, USA; Cincinnati, OH, USA, 2012. [Google Scholar]
- Maimon, A.; Tal, A.; Friedler, E.; Gross, A. Safe on-site reuse of greywater for irrigation—A critical review of current guidelines. Environ. Sci. Technol. 2010, 44, 3213–3220. [Google Scholar] [CrossRef] [PubMed]
- Benami, M.; Gillor, O.; Gross, A. Potential microbial hazards from graywater reuse and associated matrices: A review. Water Res. 2016, 106, 183–195. [Google Scholar] [CrossRef] [PubMed]
- AQUA-ESPAÑA. Guía Técnica Española de Recomendaciones para el Reciclaje de Aguas Grises en Edificio; AQUA-ESPAÑA: Barcelona, Spain, 2011. [Google Scholar]
- Dixon, A.; Butler, D.; Fewkes, A.; Robinson, M. Measurement and modelling of quality changes in stored untreated grey water. Urban Water 2000, 1, 293–306. [Google Scholar] [CrossRef]
- Li, Z.; Boyle, F.; Reynolds, A. Rainwater harvesting and greywater treatment systems for domestic application in Ireland. Desalination 2010, 260, 1–8. [Google Scholar] [CrossRef]
- Pinto, U.; Maheshwari, B.L. Reuse of greywater for irrigation around homes in Australia: Understanding community views, issues and practices. Urban Water J. 2010, 7, 141–153. [Google Scholar] [CrossRef]
- Ntale, H.; Moses, N. Improving quality of harvested rainwater by using first flush interceptors/retainers. In Proceedings of the 11th International Conference on Rainwater Catchment Systems, Texcoco, Mexico, 22–26 September 2003. [Google Scholar]
- Silva Vieira, A.; Weeber, M.; Ghisi, E. Self-cleaning filtration: A novel concept for rainwater harvesting systems. Resour. Conserv. Recycl. 2013, 78, 67–73. [Google Scholar] [CrossRef]
- Sánchez, L.; Caicedo, E. Uso del agua de lluvia en la Bocana-Buenaventura. In Proceedings of the AGUA 2003 International Conference: Usos Múltiples del Agua, para la Vida y el Desarrollo Sostenible, Cartagena de Indias, Colombia, 29 September–3 October 2003. [Google Scholar]
- Ospina-Zúñiga, O.; Ramírez-Arcila, H. Evaluación de la calidad del agua de lluvia para su aprovechamiento y uso doméstico en la ciudad de Ibagué, Tolima, Colombia. Ingeniería Solidaria 2014, 10, 125–137. [Google Scholar]
- Parra, D.; Carrillo, L.; Velandia, E. Estudio de alternativas para el aprovechamiento y reuso del agua doméstica. Epsilon 2015, 24, 123–142. [Google Scholar]
- Ardila-Galvis, M. Viabilidad técnica y económica del aprovechamiento de aguas grises domésticas. In Facultad de Ingeniería—Departamento de Ingeniería Química; Universidad Nacional de Colombia: Bogotá, Colombia, 2013. [Google Scholar]
- Moreno, T.; Quintero, D. Reutilización de agua en construcciones verticales. In Ingeniería Civil; Universidad Católica de Colombia: Bogotá, Colombia, 2014. [Google Scholar]
- Canada Mortgage and Housing Corporation. Collecting and Using Rainwater at Home: A GUIDE for Homeowners; Canada Mortgage and Housing Corporation: Ottawa, ON, Canada, 2013. [Google Scholar]
- Victoria-EPA. Guidelines for Environmental Management: Use of Reclaimed Water; Victoria-EPA: Victoria, Australia, 2003. [Google Scholar]
- Instituto Colombiano de Normas Técnicas y Certificación. Norma Técnica Colombiana: NTC 1500, in Código Colombiano de Fontanería; Instituto Colombiano de Normas Técnicas y Certificación (Icontec): Bogotá, Colombia, 2004. [Google Scholar]
- RUITOQUE E.S.P. Tarifas de Acueducto 2015. Available online: http://www.ruitoqueesp.com/web/index.php/tarifas-vigentes-de-aa (accessed on 12 July 2017).
- EMPAS S.A.E.S.P. Tarifas de Alcantarillado 2015. Available online: http://www.empas.gov.co/mod_documentos/elfinder/files/Informacion%20Financiera%20y%20Contable/Tarifas/Tarifas%202016/Tarifas%202016%20Act24Feb2016.pdf (accessed on 12 July 2017).
- Ghisi, E.; De Oliveira, S.M. Potential for potable water savings by combining the use of rainwater and greywater in houses in southern Brazil. Build. Environ. 2007, 42, 1731–1742. [Google Scholar] [CrossRef]
- Galvis, A.; Zambrano, D.A.; Van der Steen, N.P.; Gijzen, H.J. Evaluation of pollution prevention options in the municipal water cycle. J. Clean. Prod. 2014, 66, 599–609. [Google Scholar] [CrossRef]
- Ward, S.; Memon, F.A.; Butler, D. Performance of a large building rainwater harvesting system. Water Res. 2012, 46, 5127–5134. [Google Scholar] [CrossRef] [PubMed]
- Estupiñán, J.; Zapata, H. Requerimientos de Infraestructura para el Aprovechamiento Sostenible del agua Lluvia en el Campus de la Pontificia Universidad Javeriana, sede Bogotá; Facultad de Ingeniería: Bogotá, Colombia, 2011. [Google Scholar]
- Morales-Pinzón, T.; Lurueña, R.; Gabarrell, X.; Gasol, C.M.; Rieradevall, J. Financial and environmental modelling of water hardness—Implications for utilising harvested rainwater in washing machines. Sci. Total Environ. 2014, 470, 1257–1271. [Google Scholar] [CrossRef] [PubMed]
- Morales-Pinzón, T.; Lurueña, R.; Rieradevall, J.; Durany, X.G. Financial feasibility and environmental analysis of potential rainwater harvesting systems: A case study in Spain. Resour. Conserv. Recycl. 2012, 69, 130–140. [Google Scholar] [CrossRef]
- Roebuck, R.M.; Oltean-Dumbrava, C.; Tait, S. Whole life cost performance of domestic rainwater harvesting systems in the United Kingdom. Water Environ. J. 2011, 25, 355–365. [Google Scholar] [CrossRef]
- Liang, X.; van Dijk, M.P. Financial and economic feasibility of decentralized wastewater reuse systems in Beijing. Water Sci. Technol. 2010, 61, 1965–1973. [Google Scholar] [CrossRef] [PubMed]
- Ghisi, E.; Rupp, R.F.; Triska, Y. Comparing indicators to rank strategies to save potable water in buildings. Resour. Conserv. Recycl. 2014, 87, 137–144. [Google Scholar] [CrossRef]
Figure 1.
Procedure for dimensioning the rainwater storage tank.

Figure 2.
Procedure for dimensioning the greywater storage tank.

Figure 3.
End-uses accepted for RWH and GWR expressed by the participants.

Figure 4.
Scheme for alternative 1: GWR.
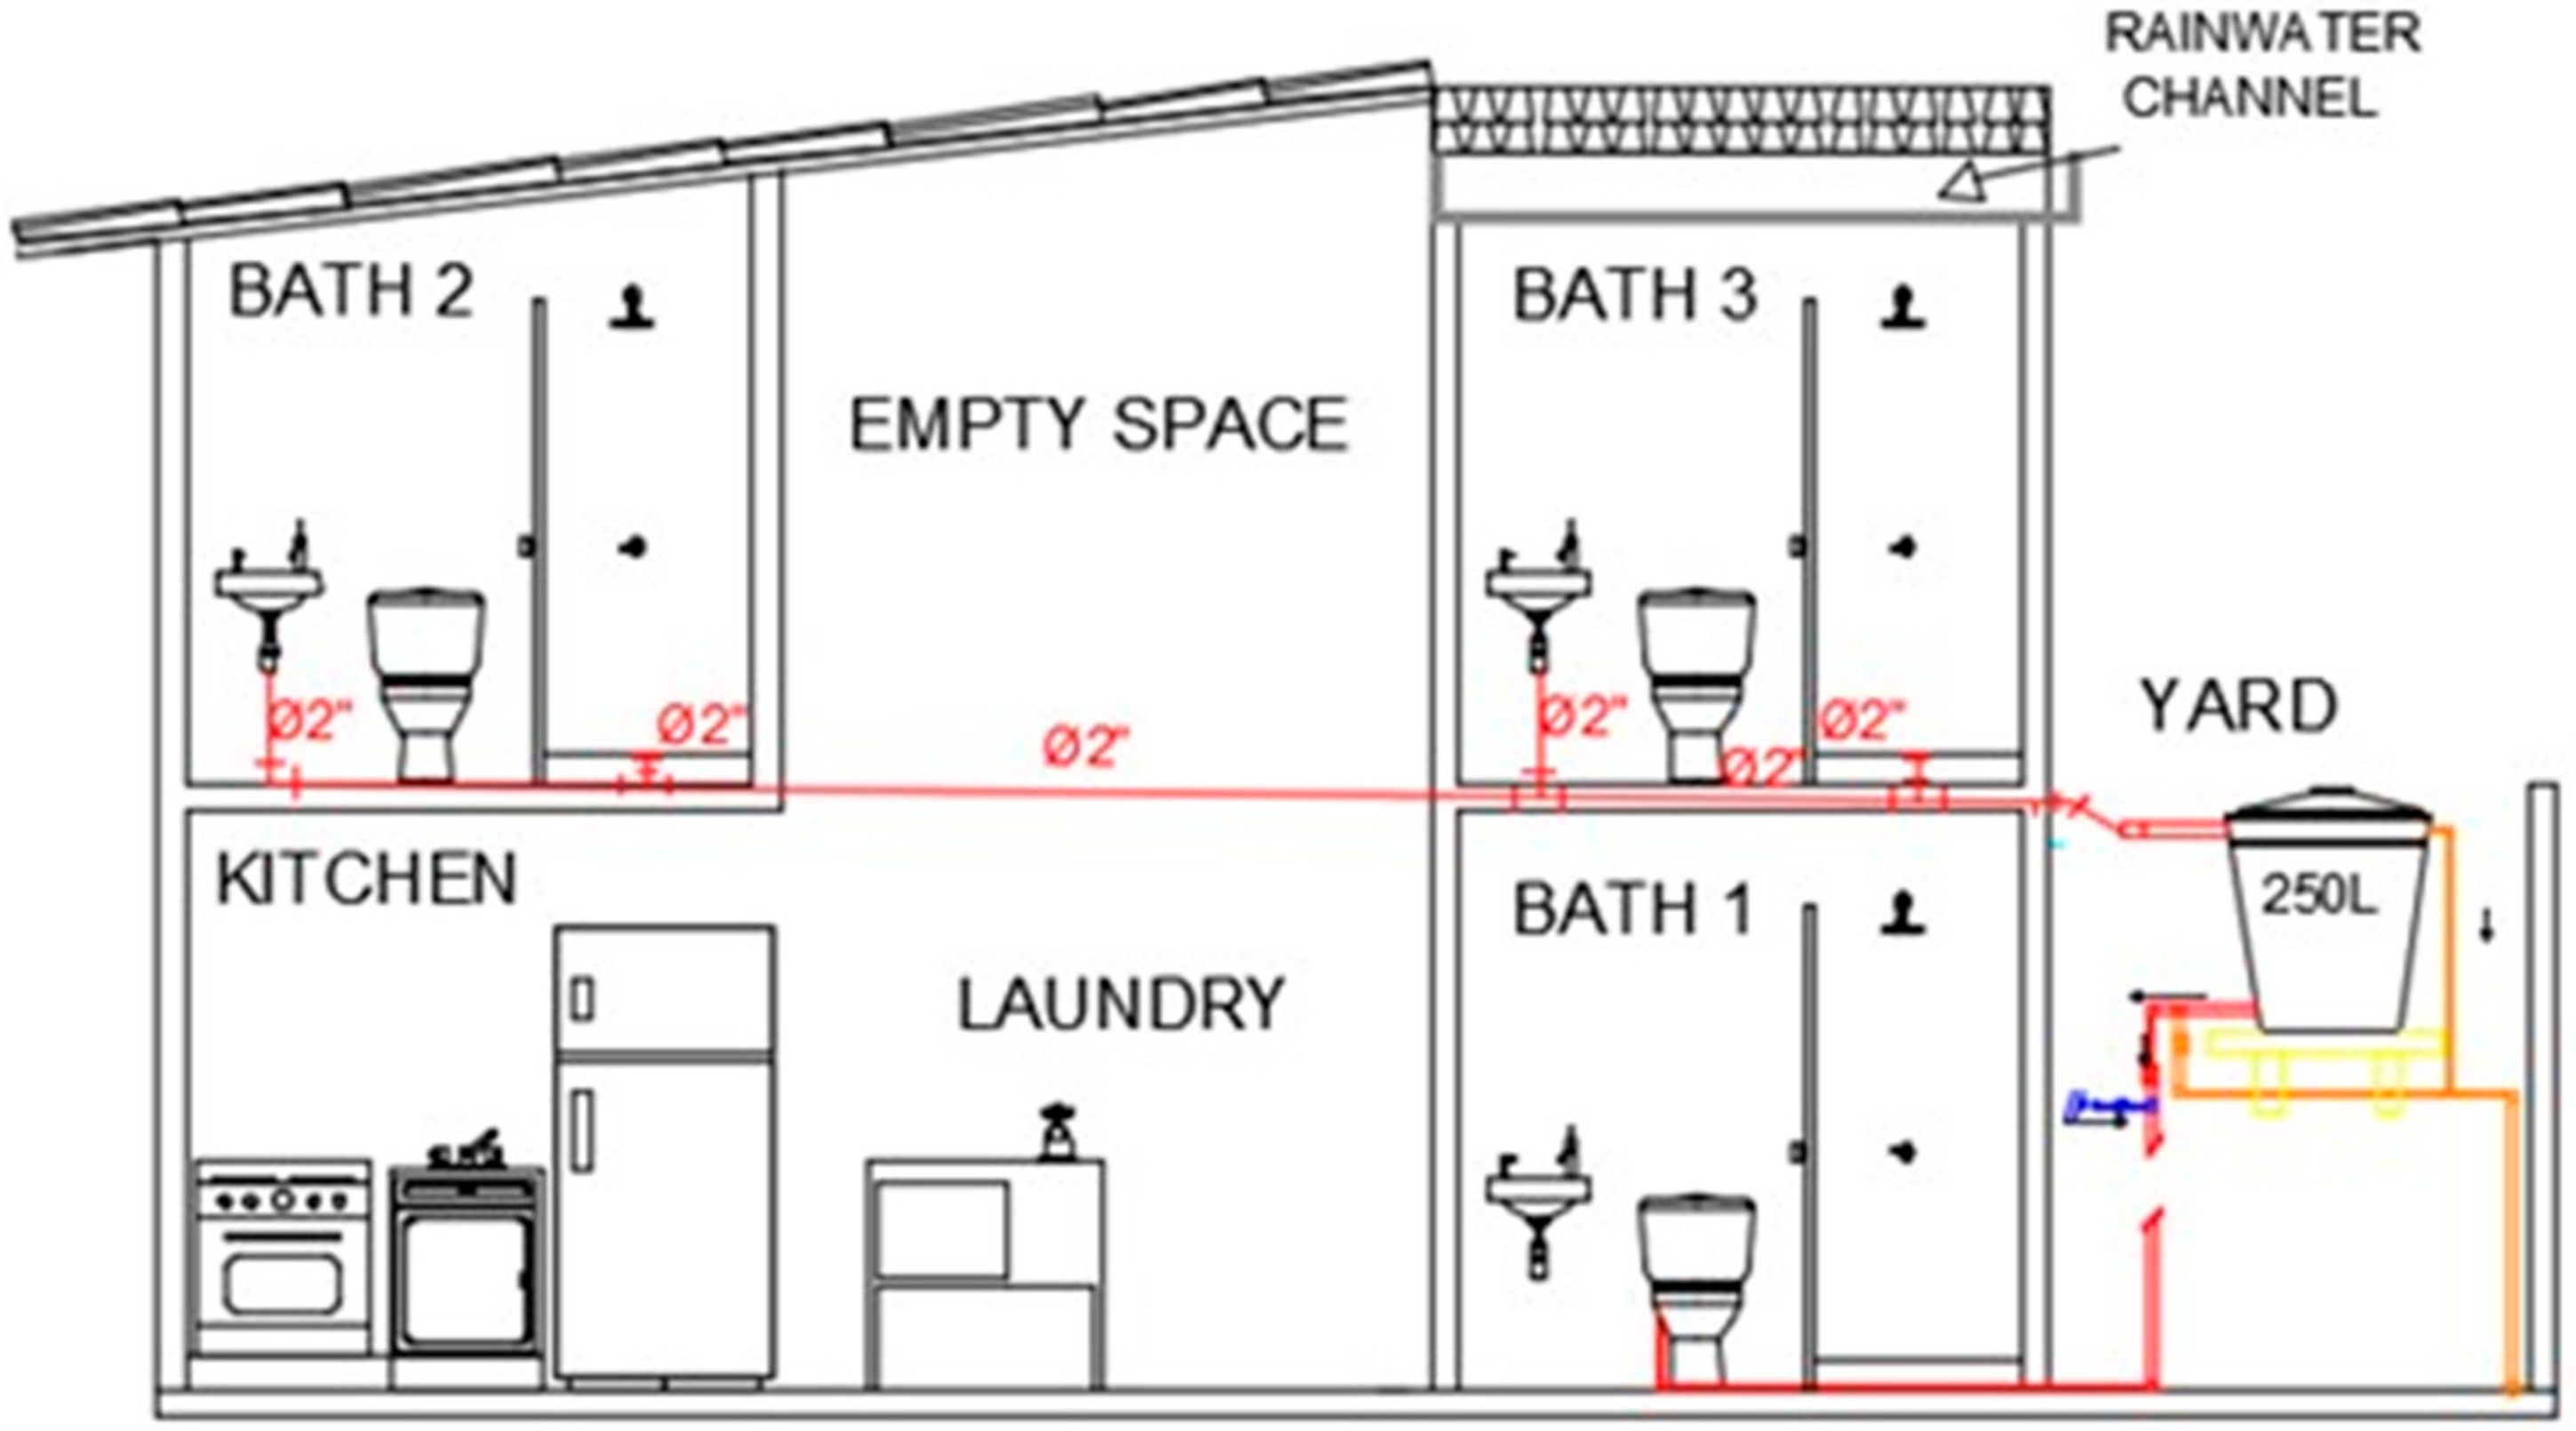
Figure 5.
Scheme for alternative 2: RWH.

Figure 6.
Scheme for alternative 3: GWR and RWH.
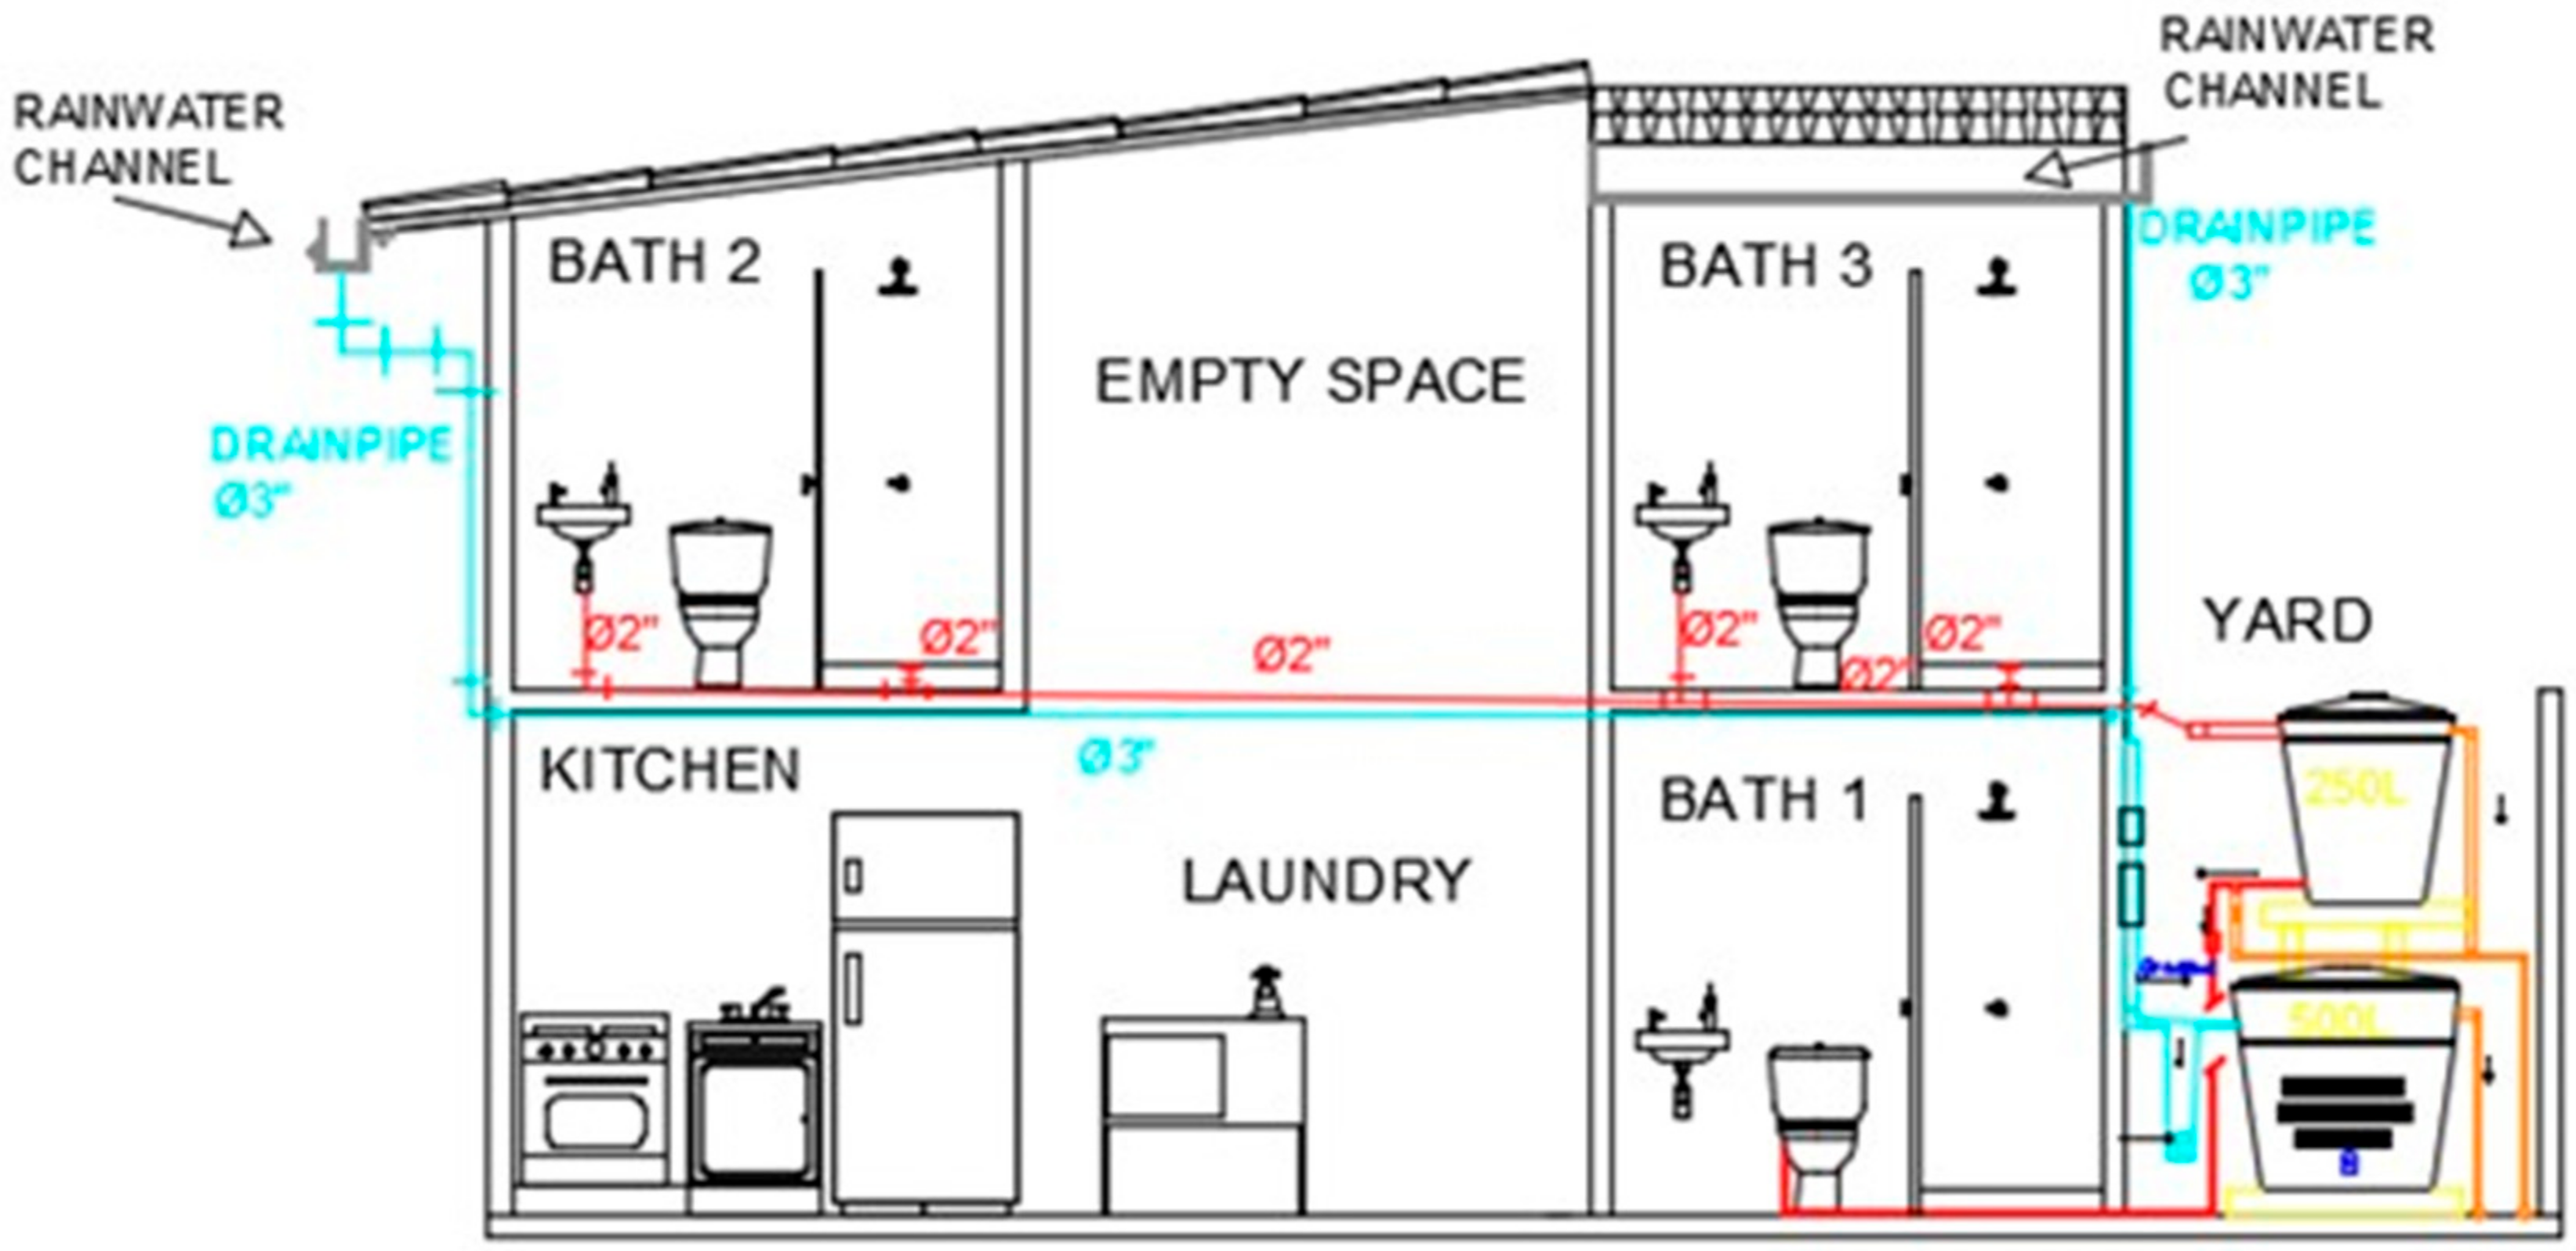
Figure 7.
Cumulative rainwater supply for different RWH tank sizes.

Figure 8.
Annual potable water savings (volume) for various tank sizes and system alternatives (T2, T3, Alt 2, Alt 3).
Figure 8.
Annual potable water savings (volume) for various tank sizes and system alternatives (T2, T3, Alt 2, Alt 3).

Figure 9.
Selection of alternative water supply systems by potential end-users.


Table 1.
Quality of harvested rainwater reported in several studies in Colombia and international regulations.
Table 1.
Quality of harvested rainwater reported in several studies in Colombia and international regulations.
| Studies | pH | TSS (mg/L) | Turbidity (NTU) | BOD5 (mg/L) | TC (CFU/100 mL) |
|---|---|---|---|---|---|
| Clean rainwater (Buenaventura) 1 | 6.8 | N | 1.2 | N | 0 |
| Rainwater from the roof (Buenaventura) 1 | 7.0 | N | 1.2 | N | 44 |
| Rainwater from the roof (asbestos cement roof) (Bogotá) 2 | 8.3 | 104 | 24.0 | N | N |
| Rainwater from the roof (Bogotá) 2 | 7.4 | 149 | 17.0 | N | N |
| Rainwater from the roof (Bogotá) 2 | 8.0 | 124 | 21.0 | 20 | N |
| Rainwater from the floor (Ibague) 3 | 5.7 | N | 2.2 | N | 132 |
| Regulations for urban non-potable reuse (United States) 4 | 6–9 | - | <2 | <10 | 0 |
Table 2.
Quality of collected greywater reported in studies from Colombia and international regulations.
Table 2.
Quality of collected greywater reported in studies from Colombia and international regulations.
| GW Source and Quality Standards | pH | SS (mg/L) | TSS (mg/L) | Turbidity (UNT) | BOD5 (mgO2/L) | TC (UFC/100 mL) | RC (mg/L) |
|---|---|---|---|---|---|---|---|
| SH, SK, WM, DW 1 | 6.99 | 398 | 850 | 150 | 936 | N | - |
| SH, SK, WM 2 | 7 | 88.4 | N | 130 | N | N | - |
| SH, SK, WM, DW 3 | 7.5 | 244 | 2380 | 167 | N | 155,000 | - |
| Average | 7 | 243 | 1615 | 149 | 936 | 155,000 | - |
| United States regulation 4 | 6–9 | - | - | <2 | <10 | 0 | >0.5 |
| Canadian regulation 5 | - | - | <10 | <2 | <10 | <1 | - |
| Australian regulation 6 | 6–9 | <5 | - | <2 | <10 | <10 | >1 |
Notes: SS: Suspended Solids, TSS: Total Suspended Solids, BOD5: Biochemical Oxygen Demand, TC: Total Coliforms. RC: Residual Chlorine. N: Unmeasured Parameter. SH: Shower, SK: Sink, WM: Washing machine, DW: Dishwashing. Source: 1 Parra, Carrillo [48], 2 Ardila-Galvis [49], 3 Moreno and Quintero [50], 4 Bastian and Murray [37], 5 Canada Mortgage and Housing Corporation [51], 6 Victoria-EPA [52].
Table 3.
Initial investment costs of the proposed alternatives.
| No. | Description | Alt 1 (US$) | Alt 2 (US$) | Alt 3 (US$) | |||
|---|---|---|---|---|---|---|---|
| New Network | Original Network | New Network | Original Network | New Network | Original Network | ||
| 1 | Location and setting-out on site | 94 | 92 | 94 | 92 | 96 | 92 |
| 2 | Sanitary network | 528 | 437 | 437 | 437 | 528 | 437 |
| 3 | Potable network | 123 | 114 | 123 | 114 | 123 | 114 |
| 4 | GW network (reuse) | 36 | - | - | - | 36 | - |
| 5 | RW network | - | - | 463 | 241 | 463 | 241 |
| 6 | Storage | 180 | - | 94 | - | 268 | - |
| 7 | System design | 502 | 335 | 502 | 335 | 669 | 335 |
| TOTAL | 1463 | 978 | 1713 | 1220 | 2183 | 1220 | |
| Additional fees (8%) | 117 | 78 | 137 | 98 | 175 | 98 | |
| Capital investment | 1580 | 1056 | 1850 | 1317 | 2358 | 1317 | |
| Difference | 524 | 533 | 1041 | ||||
Table 4.
Maintenance costs of the proposed systems.
| Alt | Description | Unit Value ($) | Frequency/Year | Quantity/Year | Value ($/Year) |
|---|---|---|---|---|---|
| 1 | Cleaning of the 250 L GW tank | 2.0 | 1 | 1 | 2.0 |
| Total | 2.0 | ||||
| 2 | Cleaning of the 500 L RW tank | 3.3 | 2 | 0.5 | 1.7 |
| Cleaning of gutters | 3.3 | 1 | 1 | 3.3 | |
| Total | 5.0 | ||||
| 3 | Cleaning of the 500 L RW tank | 3.3 | 2 | 0.5 | 1.7 |
| Cleaning of the 250 L GW tank | 2.0 | 1 | 1 | 2.0 | |
| Cleaning of gutters | 3.3 | 1 | 1 | 3.3 | |
| Total | 7.0 |
Table 5.
Annual monetary savings on water supply and sewage bills for the three proposed systems.
| Alternative | Water Supply (US$/Year) | Sewerage (US$/Year) | Total (US$/Year) |
|---|---|---|---|
| 1 | 12.4 | 8.5 | 20.9 |
| 2 | 6.4 | 4.4 | 10.7 |
| 3 | 18.7 | 12.9 | 31.6 |
Table 6.
Results from the financial assessment of the proposed alternatives.
| Alternative | IRR (%) | NPV (US$) | B/C | PP (Years) |
|---|---|---|---|---|
| 1 | 6.67 | 526 | 2.04 | 23.3 |
| 2 | 1.71 | −203 | 0.61 | 44.3 |
| 3 | 4.69 | 337 | 1.34 | 29.8 |
Table 7.
Results of financial assessments from different research.
| Country 1 | Reference | Scale 2 | Occupancy | System | Description 3 | Results 4 |
|---|---|---|---|---|---|---|
| CO | Galvis, Zambrano [57] | R | 300 households, 4 occupants/house | GWR | T: Multiple filtration steps, flocculator | PP: 11 years, IRR (15): 5.75% |
| CO | Estupiñán and Zapata [59] | U | Roofs and courts | RWH | T: filtration, decantation, activated carbon, RS: 435 m3 | PP: 22 years, IRR (33): 3.7% |
| BR | Ghisi and Mengotti de Oliveira [56] | SH | One household, 3 occupants | GWR & RWH | T: wetland, RS: 750 L, RA: 202 m2, use: to & wm | PP: 29 years |
| SP | Morales-Pinzón, Lurueña [60] | GH | Two households, 4 occupants/house | RWH | T: no, RS: 3 m3, RA: 80 m2, use: wm | PP: 44 years, IRR (50): −0.4% |
| SP | Domnech and Saurí [8] | GH | One household, 3 occupants | RWH | T: no, RS: 5 m3, RA: 80 m2, use: to & wm | PP:37 years |
| EN | Ward, Memon [58] | O | 300 occupants (actual: 111) | RWH | T: no, RS: 25 m3, RA: 1500 m2, use: to | PP: 11 years |
| CO | Oviedo-Ocaña, Dominguez [14] | SH | One house, 4 occupants | GWR & RWH | T: slow filtration, grease trap, RS: 2 m3, RA: 102 m2; GWS: 0.30 m3, use: to, wm, snk, et, it | PP: 22 years, IRR (50): 6.80% |
| CO | This study | SH | One house, 5 occupants | GWR & RWH | T: SF, RS: 0.5 m3, RA: 30.5 m2; GWS: 0.25 m3, use: to, wm, et | PP: 30 years, IRR (50): 4.69% |
| CO | This study | SH | One house, 5 occupants | GWR | T: none, use: to | PP: 23 years, IRR (50): 6.67% |
Notes: 1 CO: Colombia; BR: Brazil; SP: Spain; EN: England; 2 R: Residential building; U: University; SH: Single house; GH: Group of houses; O: Office building. 3 T: Treatment system; RS: Rainwater storage; RA: Roof area; SF: self-cleaning filter; GWS: greywater storage; to: toilet; wm: washing machine; snk: sink; et: external tap; it: interior tap.
Table 8.
Synthesis of the financial information on alternative RWH/GWR systems presented to end-users.
Table 8.
Synthesis of the financial information on alternative RWH/GWR systems presented to end-users.
| Feature | Alt 1 | Alt 2 | Alt 3 |
|---|---|---|---|
| Potable water savings (m3/year) | 39.5 1 | 20.3 2 | 59.8 3 |
| Initial investment costs ($) | 524 | 533 | 1041 |
| Savings in water and sewage bills ($/year) | 20.9 | 10.7 | 31.6 |
| Maintenance costs ($/year) | 2.0 | 5.0 | 7.0 |
| PP (years) | 23.3 | 44.3 | 29.8 |
Notes: 1 16.6% from total consumption; 2 8.5% from total consumption; 3 25.2% from total consumption.
© 2017 by the authors. Licensee MDPI, Basel, Switzerland. This article is an open access article distributed under the terms and conditions of the Creative Commons Attribution (CC BY) license (http://creativecommons.org/licenses/by/4.0/).
Share and Cite
MDPI and ACS Style
Domínguez, I.; Ward, S.; Mendoza, J.G.; Rincón, C.I.; Oviedo-Ocaña, E.R. End-User Cost-Benefit Prioritization for Selecting Rainwater Harvesting and Greywater Reuse in Social Housing. Water 2017, 9, 516. https://doi.org/10.3390/w9070516
AMA Style
Domínguez I, Ward S, Mendoza JG, Rincón CI, Oviedo-Ocaña ER. End-User Cost-Benefit Prioritization for Selecting Rainwater Harvesting and Greywater Reuse in Social Housing. Water. 2017; 9(7):516. https://doi.org/10.3390/w9070516
Chicago/Turabian StyleDomínguez, Isabel, Sarah Ward, Jose Gabriel Mendoza, Carlos Iván Rincón, and Edgar Ricardo Oviedo-Ocaña. 2017. "End-User Cost-Benefit Prioritization for Selecting Rainwater Harvesting and Greywater Reuse in Social Housing" Water 9, no. 7: 516. https://doi.org/10.3390/w9070516
Note that from the first issue of 2016, this journal uses article numbers instead of page numbers. See further details here.