
Commercial Classification and Location Modelling: Integrating Different Perspectives on Commercial Location and Structure


CERIS—Civil Engineering Research and Innovation for Sustainability, Department of Civil Engineering, Architecture and Georesources (DECivil), Instituto Superior Técnico, Universidade de Lisboa, Av. Rovisco Pais, 1049-001 Lisboa, Portugal
*
Author to whom correspondence should be addressed.
Land 2021, 10(6), 567; https://doi.org/10.3390/land10060567
Submission received: 20 April 2021
/
Revised: 26 May 2021
/
Accepted: 27 May 2021
/
Published: 28 May 2021
(This article belongs to the Special Issue New Approaches to Land Use/Land Cover Change Modeling)
Abstract
:Commercial classification is essential to describe and compare the spatial patterns of commercial activity. Most classification systems consider a large set of dimensions that include detailed features such as store ownership or development type. Since new business models are continually being developed, the need to revise classification systems is constant. This makes generalisation hard, thus hindering the comparison of commercial structures in different places and periods. Recent studies have focused on cluster analysis and a smaller number of variables to gain insights into commercial structures, directly addressing this issue. Systematic bottom-up classification generates comparable structures, which is essential to contrast policy results in different situations. Furthermore, since form or accessibility are usually considered in classifications, cluster membership is precluded from most retail location models, often relying on the latter as an explanatory variable. Hence, a new classification system is proposed, based on cluster analysis (k-means) and a minimal set of variables: density, diversity, and clustering. This classification was implemented in 1995, 2002, and 2010 in Lisbon. Cross-sectional analysis of the commercial structures shows the system accurately describes commercial location and change, suggesting it can be generalised as a classification system. Since the minimal dataset also allows for cluster membership to be used on location models, the relationship between commercial classification and location modelling could be strengthened, reinforcing the role of commercial studies in urban planning and policymaking.
1. Introduction
Retail has been considered a driver of sustainable communities since at least the 1960s [1]. The high-street promotes social interaction and adds to the centres’ multi-functionality, generating urbanisation economies from which innovation stems [2,3]. The presence of retail also stimulates local employment, encourages walking instead of driving, and fosters safety [4]. Since one can find people in the street at any given moment of the day, the feeling of belonging to a place is enhanced [5], which ultimately promotes urbanity.
The image of the communal high-street [3], though, has become increasingly disconnected from reality. Already in the 1960s, urban sprawl, along with social and demographic changes (such as women entering the labour force), presented the first significant threat to the high-street [6,7]. New ways of doing business (shopping malls, big-box retail), reinforced by the spread of neoliberal principles in the 1980s, would eventually lead to the decline of city centres in the 1990s [8,9]. Although extensive funding has since been directed to promote town centre revival [10,11,12], the high-street continues to suffer intense competition from other business models. In 2009, online shopping was already considered to have the potential to replace in-store shopping [13], and in 2019, online purchases represented 14.1% of the total retail worldwide sales [14].
Commercial classification first emerged in 1937 [15] as a way to describe retail structures, being essentially an adaptation of Central Place Theory (CPT) [16] to an intraurban context. This first classification showed that the commercial structure indeed followed a CPT-like structure in various cities in the USA. Different centres relied on specific features (such as proximity to residential areas or access to transit) to attract customers. Classification has since been used to describe and compare different commercial centres within a city, but also to compare different cities and periods [17], hence guiding policymaking. Recently, the use of commercial classification in location modelling has also been discussed [18]. Zonal effects are common explanatory variables in firm location models [19,20,21], but are usually limited by administrative boundaries. The possibility of using better fitted zonal units is worth exploring and will be addressed in this paper.
Commercial classifications have conventionally been proposed from a qualitative perspective, based on the systematic observation of local case studies. Through this line of research, retail structures can be described in great detail [17,22,23,24]. For example, Guy [17] considers that at least 10 dimensions can be used in retail classification (e.g., size of the store, development history, development type). However, since each dimension has several possible categories, a classification can become overly detailed, rendering the comparison of different cities and periods difficult. This issue hinders generalisation, and most systems have been criticised for being rigid since new business models cannot fit into pre-existing classifications [17,24].
From a more quantitative perspective, researchers have primarily focused on explaining the location phenomena that lead to the emergence of different commercial centres. Some conclusions are that competitive clustering accounts for the clustering of activities of the same type [25,26,27], while urbanisation economies and multipurpose shopping explain the clustering of activities of any type [2,28], and increasing returns to scale [29,30] support the (ever growing) density of centres. Density, diversity, and clustering can be translated into mathematical expressions and generalised to different centres. The drawback is that these conclusions are harder to communicate to policymakers and public sector practitioners, eventually explaining a more generalised use of qualitative studies in urban planning.
Overall, most existing classification systems rely on highly detailed analysis of local case studies that are difficult to generalise and need to be permanently updated to include new business models. Quantitative analysis, on the other hand, has focused essentially on explaining firm location, with results that are harder to communicate. The possibility of using commercial classification to obtain better zonal variables for location models has also been, in general, disregarded. To the best of our knowledge, no classification has been explicitly proposed to be subsequently used in location models while being thorough and easy enough to generalise to different cities and periods.
Hence, the purpose of this paper is to devise a classification system that, while providing insights comparable to qualitative methods, may afterwards be used in location modelling. The classification is implemented using a minimal set of variables with a strong quantitative component and a method that can be consistently implemented in different situations. Thus, the classification will be suited for generalisation, while specific aspects of location can be explored later through location modelling.
The method is cluster analysis, a statistical technique to group objects based on their characteristics described by a set of variables [31]. In this paper, those variables rely on density, diversity, and clustering concepts. Density is simply the number of commercial points per unit of analysis (a city block). Diversity is assessed considering the number of commercial categories and their concentration. Clustering is based on the number of commercial units in the neighbouring blocks. The method and variables are described in Section 3.3 but are as simple and straightforward as possible. This approach is intended to deal with the issue of communicating results found in more quantitative research.
The classification was implemented in Lisbon, considering data from 1995, 2002, and 2010. These three years correspond to retail censuses collecting business establishments disaggregated at point level [32]. Moreover, for the 1995–2010 period, there is now sufficient research to help support our discussion. For example, the rise of shopping malls against city centre decline [8], changing consumers’ habits [33,34], and gentrification [35] have all been addressed in that period. Hence, previous research may support the cross-sectional comparison of commercial structures, which would ultimately validate the classification itself by showing it can be used to arrive at similar conclusions. Additionally, these three years are close to the national housing and population censuses (1991, 2001 and 2011); census data may later be used to address cluster classification in location models.
The paper is organised as follows: Section 2 presents the literature review, from classic functional analyses to recent classification systems based on state-of-the-art methods. Section 3 introduces the data and methodology, along with the case study, Lisbon. The results are displayed in Section 4, with discussion following in Section 5. The conclusions are presented in Section 6, along with possible lines of research that may be pursued in further developments of the present analysis.
2. Literature Review
The first systematic description of retail structures can eventually be attributed to Proudfoot [15]. Based on the analysis of nine cities in the USA, and essentially considering types of goods sold, the concentration of activities, and characteristics of the catchment areas, the author found that most cities presented a similar structure, consisting of (1) a CBD, (2) an outlying business centre or centres, (3) a principal business thoroughfare, (4) neighbourhood business streets and (5) isolated store clusters (isolated stores are also mentioned). The CBD concentrated most of the retail, both in quantity and diversity, with the outlying business districts being miniature versions. The principal business thoroughfare was the main artery leading to the CBD, relying upon through traffic and visibility. Neighbourhood business streets and isolated store clusters catered for local customers and were located at walking distance in residential areas, and so were isolated stores. This classification is still relevant because of its seminal character and because a CPT-like structure can still be found in different cities, especially in Europe and in the USA [36,37,38].
The classification system of Berry [22,39] proposes that, in any city, a set of nested nucleations can be found, moving down from the metropolitan CBD to small convenience centres, eventually connected by ribbon structures developed around streets or highways. These ribbons draw patronage from through traffic. Specialised areas such as entertainment districts exist where the type of business demands a specific location that does not fit the proposed hierarchical structure. The influence of the CPT is evident on the classification system, which can be attributed to Berry’s previous work [40,41]. The classification had an immediate practical application in Chicago’s community renewal plan, proving that classification-based analysis could support policymaking. Although it would later be criticised [17,24,42], mainly because of the strict hierarchical structure it imposed, this classification system was extensively used, e.g., in Lisbon [43].
Davies and Bennison [23] suggest that there are essentially three conformations of retail structures: nucleated facilities, ribbon developments, and specialised functional areas. Nucleated facilities are central to a body of consumers (general accessibility); ribbon developments rely upon through traffic (arterial accessibility), and specialised functional areas occupy areas of prestige or, in general, possess some distinct attribute (special accessibility). Since they occur because of their intended patronage, they do not need to be mutually exclusive [23]: different conformations may be superimposed. The resulting classification system is not clearly hierarchical. Instead, an explicitly post-hierarchical classification is assumed by Brown [24], based on form and function. The post-hierarchical classification is designed to fit a wider range of scenarios: function is divided into general, specialist, and ancillary, while form is separated into cluster (unplanned), cluster (planned), linear and isolated.
Guy [17] presents a comprehensive analysis of retail classification methods and the variables used to classify different centres. Even though no classification is proposed, this thorough review is relevant for anyone who wishes to build upon the existing classification methods. The author examines several dimensions used in retail classification (e.g., size of the store, development history, development type) while also discussing hierarchical and non-hierarchical methods. Ultimately, it is recommended that any classification should result from “a compromise between comprehensiveness and simplicity (…) too many categories make analysis and interpretation difficult; too few can obscure essential insights” [17] (p. 263).
After 2000, the unprecedented availability of data, along with technological advancements, allowed for innovative approaches to identifying commercial centres, relying on a more robust quantitative component. Thurstain-Goodwin and Unwin [44] first proposed using density surfaces to visualise morphological and functional dimensions of urban centres, such as the presence of retail, since density surfaces make it easier to relate them. Density surfaces have since been used to assess the multifunctional character of cities (density and diversity), considering the presence of economic activities [45]. Retail has been integrated with graph-like measures of accessibility [38,46] and related to street integration using fractal analysis [47]. Big data is also being progressively used to interpret retail location [48].
A renewed interest in classification studies relies also on strong quantitative analysis. Araldi and Fusco [18] propose a Retail Fabric Assessment (RFA) in the French Riviera, using Bayesian clustering, classic variables (such as anchor store category prevalence), and sophisticated geometry indicators based on fractal analysis. Carpio Pinedo and Gutiérrez [37] search for a metropolitan geography of commercial spaces in Madrid, using k-means cluster analysis and variables such as the number of commercial units and total floorspace, but also big data (social network data). Saraiva et al. [49] devise an analysis of multi-diversity clusters of commercial activities in Porto, relying on density estimation to obtain commercial densities and on Multiple Correspondence Analysis to obtain the clusters. Recent analyses build on classic theory by taking advantage of new materials and methods, hence providing insights that were unattainable just some decades ago. The cluster analysis “bottom-up approach” allows for consistent comparisons to be made between different cities and periods.
Finally, several strategies have been adopted considering the issue of categorising establishments, which is necessary to estimate diversity. Separating goods into search and experience goods [50] is sufficient for comparisons of online shopping adoption [51,52] but is insufficient to estimate diversity. An adaptation of Potts’ algorithm can be used to reach five categories that closely match the U.S. Department of Labour Standard Industrial Classification [53], but is a complex process, which may be a deterrent for its generalised use. Sevtsuk [4] uses the three-digit NAICS (North American Industry Classification System) system, resulting in 13 individual categories of establishments, which is sufficient for a thorough analysis of the commercial structure of Cambridge, Massachusetts. We find that the latter approach may also be suited to our study. Hence, and considering the classification used by the Lisbon City Council [54], which is itself an adaptation of the official Portuguese Classification of Economic Activities (“Classificação das Atividades Económicas” (CAE)) [55], we grouped commercial activities into nine categories that are similar to the three-digit NAICS.
Pertaining to the literature up to this point, a relationship with our analysis may be established considering the following. A CPT-like structure is expected to be found in Lisbon since hierarchy is still relevant in shaping cities and territories [36,37,38]. Since we will not be relying on geometry (form) indicators to perform the cluster analysis, a structure where retail conformations are not mutually exclusive [23] is also likely to emerge. If that happens, the interpretation is that clusters with different forms are similar, considering density, diversity, and clustering. In that case, one should look eventually for other explanatory variables apart from accessibility (associated with form) to explain commercial location. The parsimonious set of variables will allow us to explore cluster membership on a location model afterwards. This intention precluded the use of big data and other variables that have recently been applied in classification [37,48]. Density estimation was considered to calculate density [44,49] but discarded for the reasons explained in Section 3.3. We reviewed the available data and the potential methods for calculating the variables and obtaining a classification system. The system must be relatively easy to implement and maintain while offering generalisation and the use of cluster membership in location models as potential advantages. What was found was that a bottom-up approach considering a cluster analysis might be appropriate, along with a small number of variables that can be obtained straightforwardly. This process is explained in the following section.
3. Materials and Methods
3.1. Case Study
The case study is Lisbon, the capital and largest city in Portugal. Lisbon occupies 100.05 km2 [56], with a population of 662,572 inhabitants in 1991 and 547,733 in 2011 [57]. It lies strategically on the river Tagus estuary, with its historic districts being located adjacently to the river, which, for centuries, was the main support for goods transport. Commercial activity has been present in the historical CBD since the 15th century, when the Portuguese Maritime Exploration gave Lisbon a global mercantile dimension [43,58]. Lisbon’s geographic location has since made it a desirable business and services location, ranking high amongst other European cities [59]. As expected, it presents a rich retail structure, which other authors have analysed. A seminal classification of the commercial structure is included in the work of Gaspar [43], using Berry’s terminology [22,39]. This work has subsequently been extended and updated [60,61]. Brown’s non-hierarchical classification has also been applied to Lisbon [34]. Since these analyses have been based on classic commercial classification methods, the stronger quantitative component that was found in recent classification studies [18,37,49] is, in general, absent.
3.2. Data and Variables
A geo-referenced database of establishments was used for the analysis, containing 14,046 commercial locations (establishments) in 1995, 16,378 locations in 2002, and 16,005 locations in 2010 [32]. The choice of these three years is based essentially on two points: data availability and the possibility of assessing commercial location and change in a period that has been explored in previous research. For example, the rise of shopping malls against city centre decline [8], changing consumers’ habits [33,34], and gentrification [35] have all been addressed in Lisbon, and in general, in that period. Hence, if the cross-sectional comparison of commercial structures can be closely related to previous research, our classification will be validated to some extent. Additionally, national housing and population censuses were implemented around the same time (1991, 2001, and 2011), allowing for census data to be used afterwards in location models.
Commercial establishments (retail, and restaurants, cafes, and bars) were grouped into nine categories, based on the Lisbon City Council’s classification [54], which is itself an adaptation of the Portuguese Classification of Economic Activities (“Classificação das Atividades Económicas” (CAE)) [55]. These nine categories correspond to Foodstuffs (supermarkets, bakeries, groceries, and similar establishments), Personal Use Items (mainly clothing, clothing accessories, and shoes), Household Articles (mostly furniture, home appliances, and home decoration items), Health and Hygiene (essentially pharmacies and optical shops, perfumes and cosmetics), Leisure items (sporting goods, bookshops, music stores, etc.), Other items (all other items not included in the remaining categories), Restaurants and similar establishments, Cafes and similar establishments, and Bars and similar establishments.
Having access to data at point level provides several possibilities for estimating the variables used in the cluster analysis, but the Modifiable Areal Unit Problem (MAUP) [62] must be considered. The MAUP points to the potential bias introduced in statistical analysis using areal units larger than the individual observation. The solution would be to use the individual observations. Araldi and Fusco [18] use indicators where all data is reported to points (commercial establishments), using several radii. However, the radii, too, imply areal limits. Other authors have used density surfaces [44,45,47] or square grids of polygons [37] to address the MAUP. All methods ultimately require the definition of areal limits. An alternative solution is also found in Openshaw [62] when addressing the MAUP, since it is noted that the areal units should be meaningful to the purpose of the study. Hence, we explore several approaches to establish the best areal unit suited to our goal with minimum information loss.
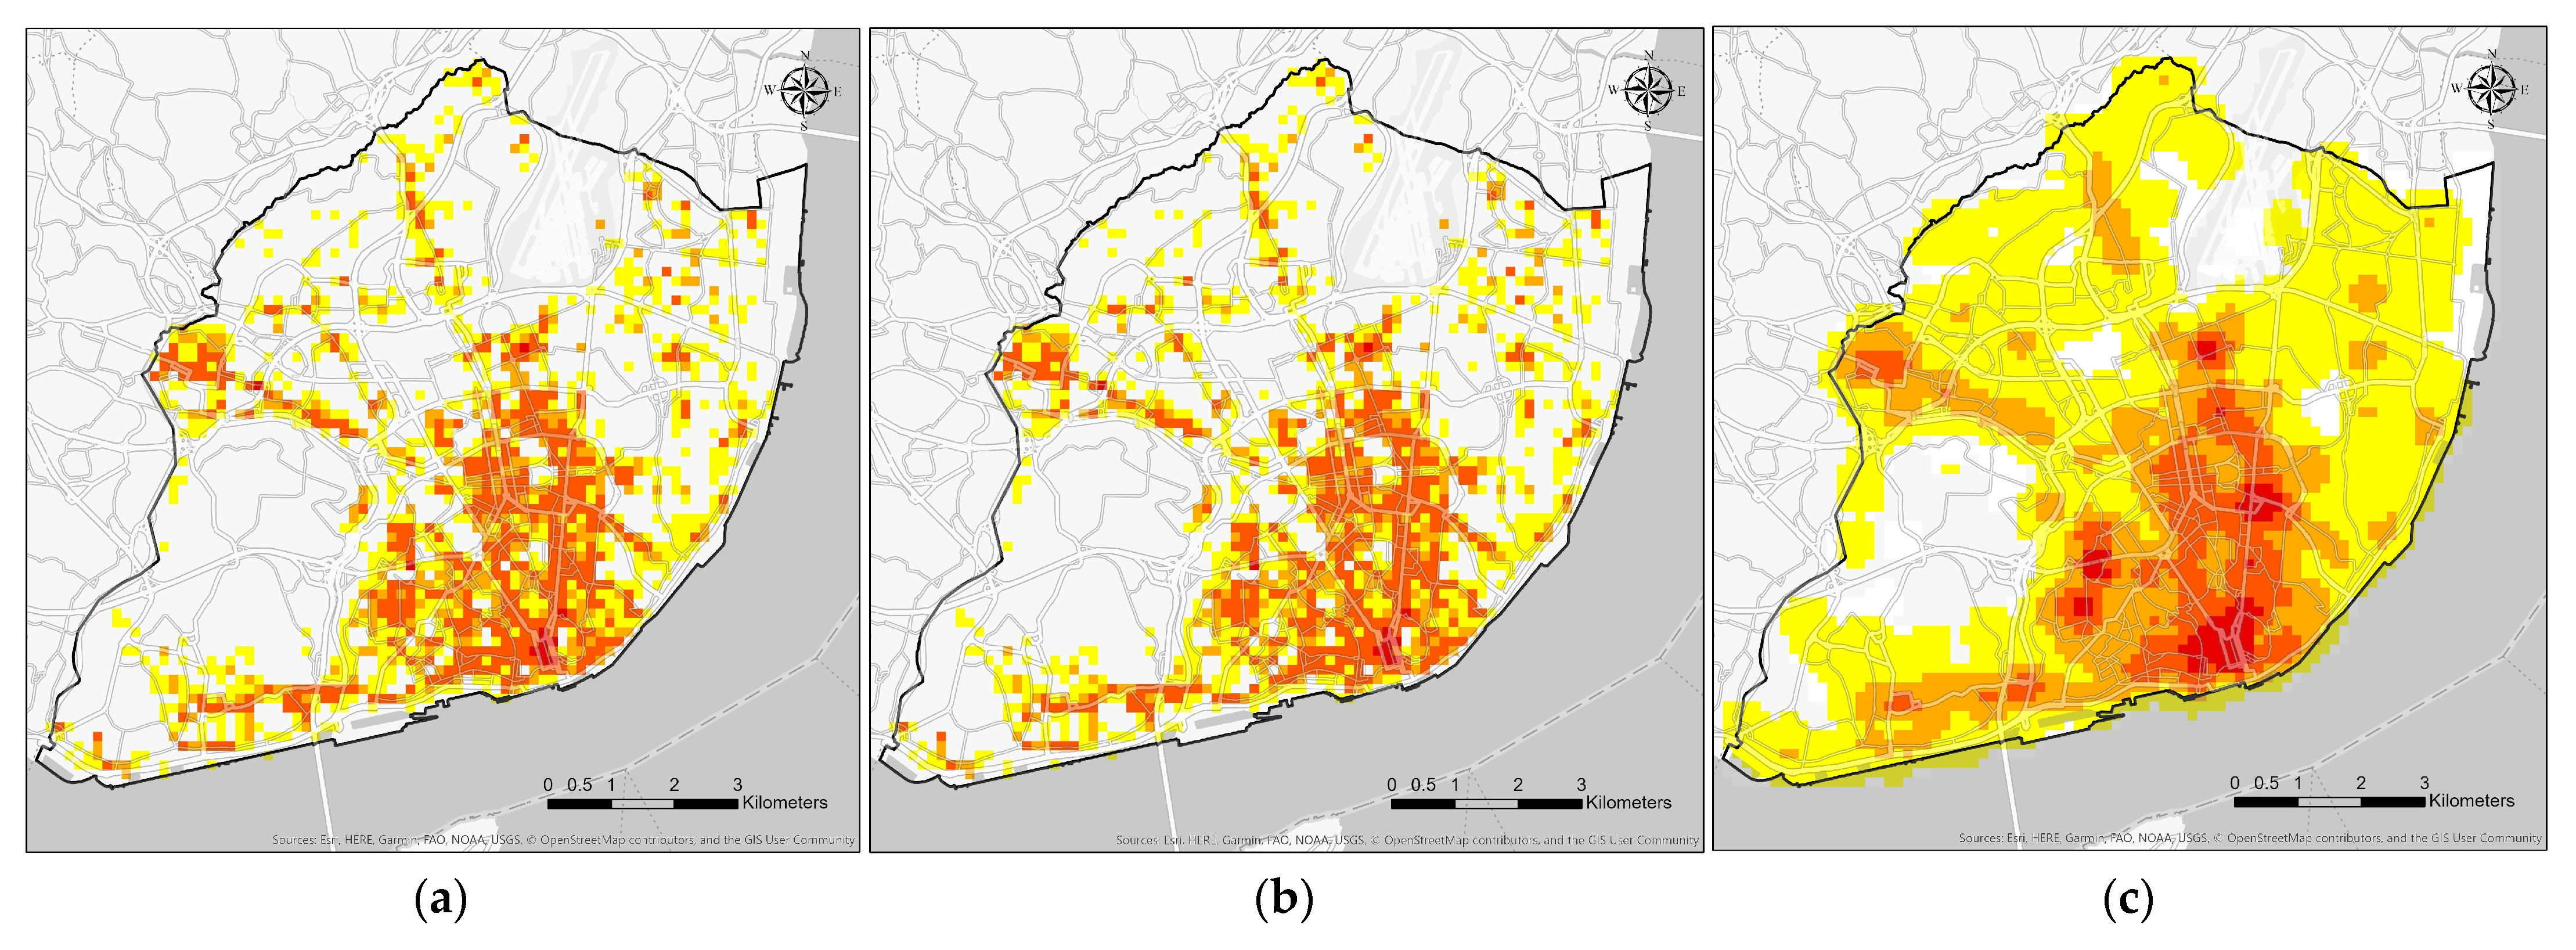
First, we considered 325 m-sided and 150 m-sided grids to estimate density. The polygons from the former have an area of 105,625 m2 (the average area of a block in the Metropolitan Area of Lisbon considering 1991, 2001 and 2011 census blocks) while those from the latter have a 22,500 m2 area (the average area of a block in the city of Lisbon). Then, a second approach was devised using the Point Density Estimation tool from ArcGIS Pro® (which calculates the density of points within a given neighbourhood for each cell [63]) to produce a density surface, considering a 300 m radius and the same 150 m-sided square grid. The results are presented in Figure 1.
Though the results found using the 325 m-sided grid or the density surface were intuitive and, to a certain extent, easier to explain, the conclusion is that using one of these approaches would result in losing a substantial amount of information—which is the advantage of having it at point level. Therefore, we find that the 150 m-sided square grid is the best suited to address the MAUP since it can relate commercial points to blocks. Furthermore, it is also suited for our goal since it can be used to describe the city. Therefore, all information was associated with this grid, after which it became possible to calculate the density, diversity, and clustering indicators. Density is simply the number of points per unit, as presented in Equation (1):
where Di is the density of a cell i, NRi is the number of commercial establishments found at that cell, and Ai is the area of the cell. Since all cells have the same area, the interpretation will be the same simply considering DS = NC, allowing for a straightforward interpretation of density: instead of having (e.g.,) 0.022 units/m2, or 22.2 units per 1.000 m2, we have 50 units per block (etc.). In addition, separating commercial establishments into those located in the high-street and those located in shopping malls also helps interpret the results. This is not different from using a variable such as the area of a commercial lot [37] to separate street-level establishments from shopping malls and is more straightforward. Hence, density is represented by two variables, DSS and DSM, with DSS indicating the density of commercial establishments at street level (high-street), and DSM representing the density at shopping malls.
As for Diversity, the most straightforward measure of diversity is a direct count of the number of activities [45], as presented in Equation (2) (here termed DVT, for “diversity-variety”):
where k represents the different categories of commercial establishments. This Diversity indicator is the same as the Variety indicator used by Araldi and Fusco [18]. It is equal to 0 where no commercial activity exists and to K where all categories are present. DVT is intended to provide an immediate “snapshot” of the city in terms of diversity. What is being admitted is that (e.g.,) a block with nine categories and nine stores or a block with nine categories and 90 stores share a degree of similarity—which is accurate. This indicator alone is insufficient to characterise diversity. Using the same example, if there are nine categories and 90 stores, but in one block each type occupies 10 stores, and on another, one type occupies 82 stores, this degree of (dis)similarity should also be assessed. For this effect, numerous diversity indicators have been proposed. In a comprehensive review of diversity indices, Jost [64] concludes that most nonparametric diversity indices take on the form of Equation (3):
where p is the proportion of each type s at each place i, and S is the total number of categories. The author also mentions the potential misinterpretations that arise from using overly complex indices to assess diversity. An example is given with the Shannon-Wiener index, which gives the uncertainty in the outcome of a sampling process. Though it can be used as a measure of diversity, the interpretation is not straightforward and especially not as straightforward as it may be implied in some analyses. Therefore, we use the simplest indicator that can be derived from this function, which is the Simpson index [65]. This index measures the degree of concentration of individuals classified in different categories, with the notation being presented in Equation (4) (here termed DVC, for “diversity-concentration”):
where p is the proportion of each type k at each place i, and K is the total number of categories. This index is usually considered a measure of concentration and equals 1 if only one type of establishment is present at block-level; values closer to 0 indicate a competitive use of the available stores by each of the K categories. For Diversity, we did not distinguish between high-street and shopping malls. The implication is that a shopping mall and a high-street cluster with similar DVC will be considered the same in cluster analysis. They may attract different customers, but not because of diversity, and hence they share some degree of similarity.
For Clustering, we use the concept of spatial lag [66,67], which is, to some extent, another way of dealing with the MAUP. In spatial econometric models, the dependent variable y in place i is often affected by the independent variables in both places i and j. The explanation is that y in i is not confined to what takes place in i, implying that the unit limit is interfering with the results. In our case, a block may be coincident with a commercial cluster, but eventually some clusters may include several blocks. Therefore, Clustering is assessed through a variable that is simply the mean value of the density of the adjacent cells (the “lag value”). A cell surrounded by cells with similar mean densities will be inside a cluster; cells surrounded by others with different densities will form the clusters’ border or isolated clusters. Thus, Clustering will provide structure to the data while also helping to address the MAUP. Formally, Clustering is obtained in two steps: first, a spatial weights matrix W is created considering the weights w defined in Equation (5):
where dij is the distance between two cells, and d* is the threshold distance—the distance at which cell j is considered to be independent of i. If this distance is calculated in cells, then if d is equal to (e.g.,) 1, what is being assumed is that only the adjacent cells (the first-order neighbours) will be considered as being part of the same cluster. This would imply a cluster of nine blocks using a square grid. To ensure that even the largest clusters are addressed, second-order neighbours are also considered. An additional reason for including a second clustering variable is that we want our cluster analysis to be balanced, with two variables for each of the three aspects. The Clustering variables are obtained according to the notation of Equation (6):
with CL1 being the result of Equation (6) when d = 1, and CL2 the result when d = 2. Only the density of high-street retail is considered for this variable: if a shopping mall is clustered with high-street retail, it will be considered integrated into the general commercial structure.
Table 1 presents a summary of the variables considered in the cluster analysis.
3.3. Methodology
The chosen method is cluster analysis, a statistical technique used to classify and group objects based on their characteristics. These characteristics are represented by variables, and the objects are grouped by similarity (proximity). In our case, the objects are cells representing blocks, described by the six variables that were presented in the previous subsection. If we had just two variables, the blocks could be represented on a plane, and delimitating groups based on proximity would be a relatively simple exercise. As the number of variables increases, measuring the proximity of objects becomes more difficult. A method for measuring distances (or measures of dissimilarity) must be defined (Euclidean distance being the simplest), and so must an algorithm for implementing the iterative process of grouping the objects [31]. The final solution is attained when each cluster is as homogenous as possible (the entities contained in it are very similar), while the clusters are as heterogeneous as possible between themselves. In other words, we arrive at the final solution when intra-cluster similarity has been maximised, and between-cluster similarity has been minimised [31,68]. Cluster analysis presents the advantage of consistency, since given the same variables and using the same method, any researcher will arrive at the same result. Hence, the results can be generalised, allowing for a systematic comparison of different structures. This is seen as an advantage compared to most qualitative classifications, where the structure is defined based on data and observation, but inevitably also on the subjective opinion of the researcher. A possible disadvantage of cluster analysis is that a classification relying on subjective knowledge may be better fitted to a specific commercial structure. Considering this, we find that our classification can be used to obtain the commercial structure of a city and afterwards be adjusted, for example, to a land-use plan. The consistent character of our approach is considered better for comparing different periods and/or different cities. This may help understand, for example, how different city centres are affected by new business models (e.g., shopping malls in the last decades) or other phenomena, considering commercial structures that are directly comparable.
The advantages and disadvantages of several clustering techniques are presented and discussed by Xu and Tian [69], from traditional to more recent methods. All recent methods present estimation time as a disadvantage due to increasing algorithm complexity. Being relatively new, the number of cases in which they have been applied may also not be sufficient to grasp other disadvantages. The main advantage of recent methods is that they intend to ensure that a globally optimal solution is attained. In contrast, traditional methods, such as partitioning and hierarchical methods, may produce only a local optimum solution. Anselin [68] argues that this disadvantage may be minimised by performing a sensitivity analysis to assess the robustness of the result. Another advantage of partitioning and hierarchical methods is that they have been extensively studied, allowing for common mistakes to be avoided and sounder results to be obtained, even if a global optimum cannot be assured. Hence, k-means clustering (a partitioning method) was chosen for our analysis, also considering that Carpio-Pinedo and Gutiérrez [37] used the same method for a similar analysis, with good results.
GeoDa [70] is an open-source, cross-platform program initially developed to deal with the lack of spatial analysis tools in the late 1980s [71]. It has since allowed numerous GIS researchers to adopt spatial statistics in their research [72,73,74] and notably to address spatial lag (clustering effects) in commercial location analyses [4,75]. The software contains an extensive set of statistical tools for spatial analysis and a graphic interface for visualising maps compatible with ArcGIS Pro®. Hence, and given the purpose of our analysis, GeoDa was considered the best available software.
Since k-means clustering requires the number of clusters to be defined before the algorithm is implemented, hierarchical methods were used in an exploratory way to set the initial number of seeds. Most of the solutions implied a structure of 5–6 clusters, and hence, 5–6 seeds to be used in the k-means. The partitioning algorithm in k-means uses the squared Euclidean distance as the measure of dissimilarity. The allocation process is based on iterative relocation that ensures that the within-cluster sums of squared errors are lowered at each step [68]. The algorithm stops when no improvement is possible. The process is initiated by sampling k observations (“seeds”) [68], with k being equal to the number of clusters that is expected to be found in the set. The default sampling procedure is random sampling, but it is also possible to implement a different procedure, k-means++ [75]. This procedure considers random sampling in the first iteration only; after that, each seed is located farther away from the original seed to ensure maximum coverage [68]. In both procedures, it is also possible to specify the number of rounds before the first iteration. For a sensitivity analysis, it is recommended that both sampling procedures and different numbers of initial rounds are implemented and compared [68]. The ratio of between sum of squares to total sum of squares (BSS/TSS) can also be compared for guidance, but if the structure is “stable” (small or no changes in cluster members), it can be assumed that the final solution has been attained [68].
Finally, and since the objective function is sensitive to the scale of the variables, all variables are standardised (z-standardization). The variables will be presented in their original scale in the output tables to simplify interpretation.
4. Results
The cluster analysis was performed firstly on the 1995 dataset, using k-means with five and six seeds. The latter provided a more intuitive description of the commercial structure of Lisbon, considering previous studies [43,60] and retail classification theory in general. Next, a sensitivity analysis was performed considering both k-means++ and random sampling, with 150 (default) and 1000 initial rounds. The ratio of between to total sum of squares did not change significantly, nor did the cluster members. The commercial structure of Lisbon in 1995 is thus derived from the default k-means++ initiation, with 150 rounds. The mean value of the six variables considering cluster membership is presented in Table 2, and the spatial distribution of the clusters is illustrated in Figure 2.
Table 2 shows that Cluster 1 is the densest, when considering high-street establishments (DSS), and the most diverse (DVT). The density of high-street establishments is much higher than in the neighbouring cells (CL1, CL2), suggesting that Cluster 1 is the “CBD”, or cells presenting similar characteristics. Cluster 2 is still dense and diverse but to a much smaller extent, and the density of high-street establishments is similar to neighbouring cells (CL1, CL2). Figure 2 shows that Cluster 2 is indeed not a set of “isolated” commercial centres. Instead, Cluster 2 contains both nucleated and ribbon structures, superimposed or not, making it dense and diverse but not as clustered as the CBD. Hence, Cluster 2 is the “Expansion Area of the Centre” [60]. Cluster 3 has a lower density of high-street establishments (5.57 per cell), distributed by 3.67 categories (DVT), which is compatible with these being “Local Store Clusters”. Cluster 4 presents a mean value of 1.21 establishments per cell (DSS), thus representing “Isolated Stores”. Clusters 5 and 6 present much higher DSM values than the remaining clusters, hence corresponding to “new” business models. Cluster 5 is integrated into the urban fabric, as can be seen in Figure 2. The values of DSS, CL1, and CL2 confirm this: though smaller than those of Cluster 2, they are still considerable. This shows a relationship towards the high-street, which is not necessarily “predatory”; hence, Cluster 5 is termed “Integrated Shopping Malls”. Cluster 6 contains just one observation, corresponding to the largest shopping mall in Lisbon in 1995, with a diversity comparable to that of the CBD and surpassing it considering the density of stores. Cluster 6 corresponds to “Large Shopping Malls”.
Table A1 (Appendix A) presents the mean number of stores in each cluster cell, considering each of the nine categories of commercial activity. The mean number of Foodstuffs establishments in the CBD is 4.62, while in the Expansion Area of the Centre this number is 2.56, and in Local Store Clusters 1.35. In comparison, establishments selling Personal Use Items present a mean number of 15.94 in the CBD, 2.59 in the Expansion Area of the Centre and 0.55 in Local Store Clusters. Comparison goods tend to cluster; daily purchase goods do not need to [4,15,49]. Local Store Clusters, which present an average of 3.67 categories (DVT), are essentially composed of daily purchase goods: Foodstuffs, Restaurants, Others, and Cafes. These four categories also present the highest mean values in the Isolated Stores. As for the Integrated Shopping Malls, the mean number of establishments is similar to that of the CBD considering most categories, except notably for Restaurants (these shopping malls did not rely, in general, on large food courts). Finally, the density of stores (for all categories) in the Large Shopping Malls is higher than on the Integrated Shopping Malls, and even of the CBD, especially considering Personal Use Items and Leisure Items.
The results for 2002 are presented in Figure 3 and Table 3. Here, too, a sensitivity analysis was performed, with no significant changes to the structure. The final solution also results from a k-means++ initiation, with 150 rounds.
The commercial structure of 2002 is similar to that of 1995. Still, it is visible that the number of cells classified as “CBD” is smaller in 2002 than in 1995. An analysis of Table 3 shows that the CBD decreased to 28 cells (from 32 in 1995), while the Large Shopping Malls increased to three cells (from one in 1995). A straightforward interpretation is that, in this period, these shopping malls competed directly with the CBD. Only the core (historic) CBD resisted, along with the densest, most diverse, and most central blocks of the remaining centres. Apart from the CBD, only the Integrated Shopping Malls decreased considering the number of cells (from 21 in 1995 to 15 in 2002). In general, the densities of both high-street establishments (DSS) and establishments in shopping malls (DSM) increased. Therefore, this was a period when commercial activity was growing, partly to the expansion of the city north and northwest, but the Large Shopping Malls had started to compete strongly with the CBD. The diversity (variety) (DVT) remained unchanged, in general, but the activity became more concentrated (DVC). Table A1 shows that the mean number of Foodstuffs decreased in general, but most of the other categories increased, especially Personal Use Items and Restaurants.
In 2010, a six-cluster structure did not emerge from the data. The resulting structure could not be related to those of 1995 and 2002. Instead, a five-cluster structure was found to be related to the previous classifications. The explanation is that between 2002 and 2010, the Integrated Shopping Malls became indistinguishable from the Expansion Area of the Centre and the Local Store Clusters. Here, too, a sensitivity analysis was performed, as in the previous years, with the final solution also resulting from a k-means++ initiation, with 150 rounds. Since the Integrated Shopping Malls had to be removed, the clusters are numbered from 1 to 4, and then 6, to allow for a coherent comparison between all information. This is shown in Table 4 and Figure 4.
In 2010 there is a visible change in the commercial structure of the city. With the closing of older shopping malls (pre-90s), those remaining became indistinguishable from the Local Store Clusters or the Expansion Area of the Centre. Hence, the density of stores in shopping malls (DSM) is higher on both compared to 2002. Local Store Clusters increased, pertaining to number of cells, and so did the Isolated Stores, due to further urban expansion and consolidation of the city north and northwest. The CBD also increased (from 28 to 32 cells) but became less dense (DSS) and less diverse (more monofunctional) (DVS) in 2010. A brief analysis of Table A1 shows that most of the categories in the CBD decreased pertaining to the mean number of units. The exception is found in restaurants, cafes, and bars, all of which increased in the CBD compared to 2002. The following section discusses the results considering previous research on the subject.
5. Discussion
Commercial classification is essential to describe and compare commercial structures across different spaces and periods [17]. Cluster analysis presents the advantage of consistency since two researchers will always reach the same results, given the same set of variables and clustering method. Generalisation is useful for comparing the efficacy of policy in two different cities, or over time, in the same city. Furthermore, cluster membership may also be used in location models, making commercial classification and location modelling complementary.
Our classification was applied to Lisbon in 1995, 2002, and 2010. This is a well-documented period considering changes in commercial activity, in international literature, and specifically in the literature about Lisbon. We expected previous research to support our results, ultimately validating the classification by showing that it can be used to arrive at similar conclusions. We also expected to find some specific features mentioned at the end of Section 2, namely a somewhat hierarchical structure. This structure was found and is in line with other recent studies [18,37]. Since we did not use geometry indicators, we expected the structure to be slightly different from classic structures where form plays a relevant part. We found that this is partially true since the structure is built around a series of main avenues (“ribbon structures”). But if the geometry is not considered, ribbons and centres appear superimposed. This shows that a multivariate statistical analysis may be more appropriate for explaining location than using form or accessibility for that purpose. Using a minimal set of variables that precludes most explanatory variables allows us to use cluster membership in statistical models, which we think may produce satisfactory results.
Furthermore, the 1995 structure could be related to a structure found in 1994 [60]. This relationship provided the first direct support to our work. Cluster 2 was termed “Expansion Area of the Centre” [60] because of the 1994 study. Cluster composition, in general, is also supported by the literature, since comparison goods tend to cluster at the CBD and the Expansion Area of the Centre; in contrast, Local Store Clusters and Isolated Store Clusters are composed, mainly, of daily purchase goods [4,15,49].
In 2002, it was found that Large Shopping Malls had started to compete with the CBD directly. The first (large) shopping mall in Lisbon opened in 1985 and was already visible in the 1995 structure (Cluster 6). However, in the 1995–2002 period, the core-periphery (CBD-shopping malls) competition increased. Although the decline of independent retail in the city centres led to tightening measures in urban retail policy in the 1990s [8], and various management models were implemented to promote town centre revival [10,11,12], these were insufficient to restrain the rise of shopping malls against city centre decline. The emergence of new retail concepts focused on car-oriented accessibility represents “retail revolution post-modernity” reaching Lisbon [8]. Pertaining to cluster composition, the mean number of establishments selling Personal Use Items and Restaurants increased significantly in all clusters. Shopping (not for daily necessities, but eventually as a leisure activity) and eating out became so common that Isolated restaurants could still expect to find clients, and so could clothing stores located at Local Store Clusters. This can be attributed to a change in consumers’ habits and the growing symbolism of shopping: from acquiring goods to performing the act of shopping [37,76]. This behaviour change, taking place in Lisbon during this period, was noticed and is well described by Cachinho [33].
The 2010 structure is similar to that arrived at by Alho and de Abreu Silva [77] considering the Logistics Profiles concept [78]. The CBD and the Expansion Area of the Centre relate with the “CBD/Business centres/Large commercial” found by the authors, with an overlap of the Expansion Area of the Centre and the Local Store Clusters with some of the “Residential areas with local trade”. Additionally, the CBD revealed specialisation in restaurants, cafes, and bars. A large part of businesses and services had left the CBD during the 1990s. Residents had started moving even earlier. The combination of empty houses and the displacement of businesses and services, and the specialisation of commerce in restaurants and bars, made this area a fertile ground for the substitution of residents by tourists in the following decade. This gentrification process has been noted in Lisbon [35] as in Barcelona, Seville, or New Orleans [79,80,81].
Therefore, and assuming the differences related to the purpose of each specific research project, we find that our classification describes well the commercial structure of Lisbon in 1995, 2002, and 2010. Consequently, it can be used to compare the city in different periods, considering different aspects, namely cluster size and composition. To some extent, previous research validates our results, showing that our classification can be used to arrive at similar findings while being apt for generalisation and location modelling.
6. Conclusions
This paper contributes to the classification of retail structures by devising a classification system in line with classic qualitative studies but considering a method and variables with a more robust quantitative component and background. In addition, the proposed classification is generalisable. Its absence is a problem found in most classification systems. Furthermore, it allows for cluster membership to be subsequently used in location models, a possibility that is usually disregarded. Finally, the paper aims to present a classification that can be implemented with relative ease in different places and periods, thus improving classification and location models.
The method used is cluster analysis due to consistency, since given the same variables, any researcher will arrive at the same result. This allows for systematic comparison of different settings. Additionally, devising a classification rooted in social analyses of functional structures while using variables based on spatial economy (density, diversity, and clustering) may help its adoption by researchers with different backgrounds.
Using a minimal set of variables also makes for a parsimonious model and allows the process to be reproduced with relative ease. We compared three different periods in the present case, but different spaces may also be compared. That the set of variables is transparent and straightforward will help to explain the results to policymakers and the public in general, which is essential for the classification to be adopted [82]. The system could eventually be implemented by public sector practitioners, thus enabling the collection of empirical evidence by different entities.
The results from the three different periods (1995, 2002, and 2010) were found to be, in general, supported by previous research. This provides, to some extent, validation to the classification since it can offer similar insights. Some general conclusions could be derived from the results. The first is that a hierarchical structure is still present and, to some extent, concurrent with the CPT. Although several business models have been introduced since the CPT was first adapted to an intraurban context [15], it is reasonable to admit that the CPT-like structure will still be around for some time [36,37,38]. In our analysis, the most evident changes were in cluster composition. It was noticed, principally, that the CBD was becoming progressively specialised in activities that can easily be related to tourism: restaurants, cafes, and bars. This has since turned into a gentrification problem, as has happened in other cities [79,80,81]. A second conclusion is that since some structures do not need to be spatially discrete [23], a very comprehensive classification system may prevent generalisation and still be insufficient to explain commercial location. A multivariate statistical analysis may be better fitted to explain location. Hence, while the classification itself can be used to describe commercial structures with detail, cluster membership can be used in statistical models.
Considering the potential use in line with classic systems, the proposed classification can be applied to address gentrification and, for example, to assess commercial blight. Instead of commercial categories, the number of (e.g.,) vacant stores and empty buildings would be used to evaluate that phenomenon. In one case or the other, if policies were being implemented to combat gentrification or blight in different cities, the classification system could be used to obtain the structure and evaluate the impact of policy based on common ground. Since the system is relatively straightforward to implement, different entities could collect data at a short time interval, in a consistent manner, and with comparable results. Using a classification system to guide policymaking is entirely in line with classic theory [22,39]. Immediate practical use of the system would be, for example, to evaluate town centre revival measures in different European Union cities since extensive funding has been directed for that purpose [7,10]. This would help “calibrate” the classification system, eventually leading to further research.
Considering the potential use in location modelling, cluster membership can be used as a dependent or an independent variable. As a dependent variable, cluster membership can be used to explore the factors driving its changes. For example, the impact of accessibility on the CBD and on Local Store Clusters is expected to be different. A model can explore the magnitude of that difference. A variate can include accessibility and several other explanatory variables since the classification was designed to avoid collinearity and address spatial lag (clustering). As an independent variable, cluster membership can be used in location models to explain changes in commercial location. For example, a restaurant in the CBD or a restaurant located in a Local Store Clusters is expected to attract different customers. If restaurants were fitted as one category in a model, the predicted patronage would have to be the same, independently of the location. Considering cluster membership, the predicted patronage can be different depending on cluster membership. Not only can the magnitude reveal itself differently (e.g., 100 customers on the CBD, 10 on Local Store Clusters), but the patronage itself can be separated into different customers (e.g., 100 tourists and 5 residents on the CBD; 1 tourist and 50 residents on Local Store Clusters). Further research will explore the potential of classification for this purpose.
Considering our specific research purpose, we find that the method and the minimal set of variables are appropriate for commercial classification since they describe commercial structures in detail in different periods. These results suggest that the classification will also be appropriate to describe different spaces, which would allow for its generalisation to other cities. It is also relatively simple to implement and maintain up to date. Specific aspects of location can be explored afterwards through location models. As for possible limitations, a classification that is fitted to a specific place will be more adjusted to it. This has been common practice in more qualitative studies. We find that our classification can also be used to derive a commercial structure and, later, be adjusted to fit a specific scenario. The use of the proposed classification could help stimulate communication between various research fields to improve the method. Therefore, its generalised use could help improve itself and location models, thus reinforcing the role of commercial studies in urban planning and policymaking and helping to advance knowledge on commercial location and structure.
Author Contributions
Conceptualisation, R.C. and J.d.A.e.S.; methodology, R.C. and J.d.A.e.S.; software, R.C.; validation, R.C. and J.d.A.e.S.; formal analysis R.C.; investigation, R.C.; resources, R.C. and J.d.A.e.S.; data curation, R.C.; writing—original draft preparation, R.C.; writing—review and editing, R.C. and J.d.A.e.S.; visualisation, R.C.; supervision, J.d.A.e.S.; project administration, R.C. and J.d.A.e.S.; funding acquisition, R.C. All authors have read and agreed to the published version of the manuscript.
Funding
This research was partially funded by Fundação para a Ciência e a Tecnologia, through Rui Colaço’s Ph.D. grant (SFRH/BD/136003/2018).
Data Availability Statement
Publicly available datasets were used in this study. The data can be found here: https://geodados-cml.hub.arcgis.com/ (accessed on 11 September 2020).
Acknowledgments
The authors wish to thank Foundation for Science and Technology (FCT) for funding this research under project UIDB/04625/2020 (CERIS). The authors would also like to thank Câmara Municipal de Lisboa for providing information on the data available on their website.
Conflicts of Interest
The authors declare no conflict of interest.
Appendix A

Table A1.
Commercial Establishments in 1995, 2002 and 2010—Mean Number of Units considering Cluster Membership.
Table A1.
Commercial Establishments in 1995, 2002 and 2010—Mean Number of Units considering Cluster Membership.
| Cluster | 1—CBD | 2—Expansion Area of the Centre | 3—Local Store Clusters | 4—Isolated Stores | 5—Integrated Shopping Malls | 6—Large Shopping Malls | |||||||||||
|---|---|---|---|---|---|---|---|---|---|---|---|---|---|---|---|---|---|
| Year | 1995 | 2002 | 2010 | 1995 | 2002 | 2010 | 1995 | 2002 | 2010 | 1995 | 2002 | 2010 | 1995 | 2002 | 1995 | 2002 | 2010 |
| Foodstuffs | 4.62 | 3.79 | 4.00 | 2.56 | 2.43 | 1.91 | 1.35 | 1.27 | 0.94 | 0.35 | 0.26 | 0.21 | 3.43 | 3.07 | 8.00 | 5.67 | 6.67 |
| Personal Use Items | 15.94 | 18.96 | 18.19 | 2.59 | 2.76 | 2.85 | 0.55 | 0.53 | 0.50 | 0.02 | 0.03 | 0.01 | 16.05 | 21.47 | 82.0 | 89.67 | 96.33 |
| Household Items | 5.38 | 5.43 | 3.91 | 1.74 | 1.91 | 1.47 | 0.44 | 0.45 | 0.44 | 0.07 | 0.07 | 0.05 | 5.19 | 5.93 | 30.0 | 26.67 | 16.33 |
| Health and Hygiene | 2.50 | 3.07 | 3.16 | 0.72 | 0.78 | 0.85 | 0.21 | 0.20 | 0.26 | 0.03 | 0.03 | 0.02 | 2.67 | 2.80 | 6.00 | 9.67 | 11.67 |
| Leisure Items | 6.00 | 7.61 | 6.63 | 1.74 | 1.87 | 1.84 | 0.59 | 0.61 | 0.64 | 0.11 | 0.10 | 0.08 | 7.76 | 9.80 | 39.0 | 25.00 | 19.67 |
| Other Items | 7.47 | 8.57 | 9.72 | 2.56 | 2.62 | 2.67 | 0.91 | 0.96 | 0.87 | 0.26 | 0.29 | 0.20 | 6.19 | 7.40 | 29.0 | 25.67 | 25.00 |
| Restaurants | 8.12 | 10.11 | 10.94 | 2.61 | 2.84 | 3.42 | 0.94 | 1.06 | 1.25 | 0.27 | 0.33 | 0.47 | 3.52 | 6.33 | 28.0 | 27.67 | 29.67 |
| Cafes | 3.18 | 3.82 | 4.19 | 1.50 | 1.70 | 2.00 | 0.72 | 0.86 | 1.08 | 0.16 | 0.17 | 0.24 | 3.14 | 4.20 | 11.0 | 13.67 | 13.33 |
| Bars | 1.35 | 1.07 | 1.81 | 0.42 | 0.39 | 0.33 | 0.21 | 0.18 | 0.11 | 0.04 | 0.02 | 0.00 | 0.24 | 0.27 | 0.00 | 0.33 | 0.00 |
References
- Jacobs, J. The Death and Life of Great American Cities; Random House: New York, NY, USA, 1961. [Google Scholar] [CrossRef]
- Jacobs, J. The Economies of Cities; Random House: New York, NY, USA, 1969. [Google Scholar]
- Griffiths, S.; Vaughan, L.; Haklay, M.M.; Emma Jones, C. The Sustainable Suburban High Street: A Review of Themes and Approaches. Geogr. Compass 2008, 2, 1155–1188. [Google Scholar] [CrossRef] [Green Version]
- Sevtsuk, A. Location and Agglomeration: The Distribution of Retail and Food Businesses in Dense Urban Environments. J. Plan. Educ. Res. 2014, 34, 374–393. [Google Scholar] [CrossRef]
- Salgueiro, T.; Erkip, F. Retail Planning and Urban Resilience—An Introduction to the Special Issue. Cities 2014, 36, 107–111. [Google Scholar] [CrossRef] [Green Version]
- Fernandes, J.R.; Cachinho, H.; Ribeiro, C. Comércio Tradicional Em Contexto Urbano: Dinâmicas de Modernização e Políticas Públicas; Universidade do Porto: Porto, Portugal, 2000. [Google Scholar]
- Guimarães, P. O Planeamento Comercial Em Portugal: Os Projectos Especiais de Urbanismo Comercial; Universidade de Lisboa: Lisbon, Portugal, 2015. [Google Scholar]
- Fernandes, J.R.; Chamusca, P. Urban Policies, Planning and Retail Resilience. Cities 2014, 36, 170–177. [Google Scholar] [CrossRef]
- Jacques, T. The State, Small Shops and Hypermarkets: A Public Policy for Retail, France, 1945–1973. Bus. Hist. 2018, 60, 1026–1048. [Google Scholar] [CrossRef]
- Warnaby, G.; Alexander, A.; Medway, D. Town Centre Management in the UK: A Review, Synthesis and Research Agenda. Int. Rev. Retail. Distrib. Consum. Res. 1998, 21, 15–31. [Google Scholar] [CrossRef]
- Cook, I.R. Private Sector Involvement in Urban Governance: The Case of Business Improvement Districts and Town Centre Management Partnerships in England. Geoforum 2009, 40, 930–940. [Google Scholar] [CrossRef] [Green Version]
- Findlay, A.; Sparks, L. Town Centre First, Second, or Not at All? T. Ctry. Plan. 2014, 83, 158–160. [Google Scholar]
- Cao, X. E-Shopping, Spatial Attributes, and Personal Travel. Transp. Res. Rec. J. Transp. Res. Board 2009, 2135, 160–169. [Google Scholar] [CrossRef] [Green Version]
- Oberlo. Global Ecommerce Sales (2019–2024). Available online: https://www.oberlo.com/statistics/global-ecommerce-sales (accessed on 14 February 2021).
- Proudfoot, M.J. City Retail Structure. Econ. Geogr. 1937, 13, 425–428. [Google Scholar] [CrossRef]
- Christaller, W. Central Places in Southern Germany (Translated by Carlisle W. Baskin in 1966); Prentice-Hall: Englewood Cliffs, NJ, USA, 1933. [Google Scholar]
- Guy, C.M. Classifications Centres: Some Methodological Issues. GeoJournal 1998, 45, 255–264. [Google Scholar] [CrossRef]
- Araldi, A.; Fusco, G. Retail Fabric Assessment: Describing Retail Patterns within Urban Space. Cities 2019, 85, 51–62. [Google Scholar] [CrossRef]
- Maoh, H.; Kanaroglou, P. Geographic Clustering of Firms and Urban Form: A Multivariate Analysis. J. Geogr. Syst. 2007, 9, 29–52. [Google Scholar] [CrossRef]
- Elgar, I.; Farooq, B.; Miller, E.J. Modeling Location Decisions of Office Firms: Introducing Anchor Points and Constructing Choice Sets in the Model System. Transp. Res. Rec. 2009, 2133, 56–63. [Google Scholar] [CrossRef] [Green Version]
- Elgar, I.; Farooq, B.; Miller, E.J. Simulations of Firm Location Decisions: Replicating Office Location Choices in the Greater Toronto Area. J. Choice Model. 2015, 17, 39–51. [Google Scholar] [CrossRef]
- Berry, B.J.L. Commercial Structure and Commercial Blight; University of Chicago Press: Chicago, IL, USA, 1963. [Google Scholar]
- Davies, R.L.; Bennison, D.J. Retailing in the City Centre: The Characters of Shopping Streets. Tijdschr. voor Econ. en Soc. Geogr. 1978, 69, 270–285. [Google Scholar] [CrossRef]
- Brown, S. Retail Location: The Post Hierarchical Challenge. Int. Rev. Retail. Distrib. Consum. Res. 1991, 1, 367–381. [Google Scholar] [CrossRef]
- Hotelling, H. Stability in Competition. Econom. J. 1929, 39, 41–57. [Google Scholar] [CrossRef]
- Eaton, B.C.; Lipsey, R.G. The Principle of Minimum Differentiation Reconsidered: Some New Developments in the Theory of Spatial Competition. Rev. Econ. Stud. 1975, 42, 27. [Google Scholar] [CrossRef]
- D’Aspremont, C.; Gabszewicz, J.J.; Thisse, J.-F. On Hotelling’s “Stability in Competition”. Econometrica 1979, 47, 1145–1150. [Google Scholar] [CrossRef] [Green Version]
- McLafferty, S.L.; Ghosh, A. Multipurpose Shopping and the Location of Retail Firms. Geogr. Anal. 1986, 18, 215–226. [Google Scholar] [CrossRef]
- Krugman, P. Increasing Returns and Economic Geography. J. Polit. Econ. 1991, 99, 483. [Google Scholar] [CrossRef]
- Fujita, M.; Krugman, P.; Mori, T. On the Evolution of Hierarchical Urban Systems. Eur. Econ. Rev. 1999, 43, 209–251. [Google Scholar] [CrossRef]
- Hair, J.F.; Black, W.C.; Babin, B.J.; Anderson, R.E. Multivariate Data Analysis; Pearson Education Limited: London, UK, 2014. [Google Scholar]
- Câmara Municipal de Lisboa. Geodados—Recenseamento Comercial. Available online: https://geodados.cm-lisboa.pt/datasets/6c40669f14c941779b48e2861767ead4_13 (accessed on 11 September 2020).
- Cachinho, H. Consumactor: Da Condição Do Indivíduo Na Cidade Pós-Moderna. Finisterra 2006, 41, 33–56. [Google Scholar] [CrossRef] [Green Version]
- Cachinho, H. Urban Retail Dynamics. From Shopping Spaces to Consumer Places. In Retail Planning for the Resilient City; Salgueiro, T., Cachinho, H., Eds.; CEG: Lisbon, Portugal, 2011; pp. 147–168. [Google Scholar]
- Sequera, J.; Nofre, J. Touristification, Transnational Gentrification and Urban Change in Lisbon: The Neighbourhood of Alfama. Urban Stud. 2019, 57, 3169–3189. [Google Scholar] [CrossRef]
- Reigadinha, T.; Godinho, P.; Dias, J. Portuguese Food Retailers—Exploring Three Classic Theories of Retail Location. J. Retail. Consum. Serv. 2017, 34, 102–116. [Google Scholar] [CrossRef] [Green Version]
- Carpio-Pinedo, J.; Gutiérrez, J. Consumption and Symbolic Capital in the Metropolitan Space: Integrating ‘Old’ Retail Data Sources with Social Big Data. Cities 2020, 106, 102859. [Google Scholar] [CrossRef]
- Ravulaparthy, S.K.; Goulias, K.G. Characterizing the Composition of Economic Activities in Central Locations. Transp. Res. Rec. J. Transp. Res. Board 2014, 2564, 106–117. [Google Scholar] [CrossRef]
- Berry, B.J. Geography of Market Centres and Retail Distribution; Prentice-Hall: London, UK, 1967. [Google Scholar]
- Berry, B.J.L.; Garrison, W.L. A Note on Central Place Theory and the Range of a Good. Econ. Geogr. 1958, 34, 304. [Google Scholar] [CrossRef]
- Berry, B.J.L.; Garrison, W.L. The Functional Bases of the Central Place Hierarchy. Econ. Geogr. 1958, 34, 145. [Google Scholar] [CrossRef]
- Meir, A.; Marcus, M. A Commercial-Blight Perspective on Metropolitan Commercial Structure. Can. Geogr. Le Géographe Can. 1983, 27, 370–375. [Google Scholar] [CrossRef]
- Gaspar, J. A Dinâmica Funcional do Centro de Lisboa; Livros Horizonte: Lisboa, Portugal, 1985. [Google Scholar]
- Thurstain-Goodwin, M.; Unwin, D. Defining and Delineating the Central Areas of Towns for Statistical Monitoring Using Continuous Surface Representations. Trans. GIS 2000, 4, 305–317. [Google Scholar] [CrossRef]
- Batty, M.; Besussi, E.; Maat, K.; Harts, J.J. Representing Multifunctional Cities: Density and Diversity in Space and Time. Built Environ. 2004, 30, 324–337. [Google Scholar] [CrossRef] [Green Version]
- Porta, S.; Strano, E.; Iacoviello, V.; Messora, R.; Latora, V.; Cardillo, A.; Wang, F.; Scellato, S. Street Centrality and Densities of Retail and Services in Bologna, Italy. Environ. Plan. B Plan. Des. 2009, 36, 450–465. [Google Scholar] [CrossRef] [Green Version]
- Piovani, D.; Molinero, C.; Wilson, A. Urban Retail Location: Insights from Percolation Theory and Spatial Interaction Modeling. PLoS ONE 2017, 12, e0185787. [Google Scholar] [CrossRef] [PubMed] [Green Version]
- Zachariadis, V.; Vargas-ruiz, C.; Serras, J.; Ferguson, P.; Ferguson, P. Decoding Retail Location: A Primer for the Age of Big Data and Social Media. In Proceedings of the CUPUM 2015: The 14th International Conference on Computers in Urban Planning and Urban Management, Cambridge, MA, USA, 7–10 July 2015. [Google Scholar] [CrossRef]
- Saraiva, M.; Marques, T.S.; Ribeiro, D.; Ribeiro, P. Multi-Diversity Clusters of Commercial Activities in the City of Porto: How Neighbourhood Concentrations Shape the Municipal Hierarchy. In La Geografía de las Redes Económicas Y la Geografía Económica en Red; Logroño, M.P.A., Marques, T.S., Santos, H., Eds.; Faculdade de Letras da Universidade do Porto, Asociación de Geógrafos Españoles: Porto, Portugal, 2020; pp. 209–217. [Google Scholar] [CrossRef]
- Nelson, P. Information and Consumer Behavior. J. Polit. Econ. 1970, 78, 311–329. [Google Scholar] [CrossRef]
- Zhen, F.; Du, X.; Cao, J.; Mokhtarian, P.L. The Association between Spatial Attributes and E-Shopping in the Shopping Process for Search Goods and Experience Goods: Evidence from Nanjing. J. Transp. Geogr. 2018, 66, 291–299. [Google Scholar] [CrossRef]
- Schmid, B.; Axhausen, K.W. In-Store or Online Shopping of Search and Experience Goods: A Hybrid Choice Approach. J. Choice Model. 2018, 31, 156–180. [Google Scholar] [CrossRef]
- Jensen, P. A Network-Based Prediction of Retail Stores Commercial Categories and Optimal Locations. Phys. Rev. E 2006, 74, 035101. [Google Scholar] [CrossRef] [Green Version]
- Câmara Municipal de Lisboa. Recenseamento Dos Estabelecimentos de Comércio a Retalho e Restauração e Bebidas Da Cidade de Lisboa; CML: Lisboa, Portugal, 2009. [Google Scholar]
- Institututo Nacional de Estatística. Classificação Portuguesa de Atividades Económicas. Available online: http://www.sicae.pt/Legislacao.aspx (accessed on 17 August 2020).
- Direção Geral do Território. Carta Administrativa Oficial de Portugal. Available online: https://www.dgterritorio.gov.pt/cartografia/cartografia-tematica/caop (accessed on 14 February 2021).
- Institututo Nacional de Estatística. Página de Download de Informação Geográfica. Available online: http://mapas.ine.pt/download/index2011.phtml (accessed on 1 August 2020).
- Oliveira, V.; Pinho, P. Lisbon. Cities 2010, 27, 405–419. [Google Scholar] [CrossRef]
- Rubalcaba, L.; Gallego, J.; Gallo, M.T.; Garrido, R. Business Services Location and Market Factors in Major European Cities. Cities 2013, 31, 258–266. [Google Scholar] [CrossRef]
- Cachinho, H. O Comércio a Retalho Na Cidade de Lisboa. Reestruturacão Económica e Dinâmicas Territoriais. Finisterra 1994, 29, 119–144. [Google Scholar] [CrossRef]
- Salgueiro, T.B. Lisboa, Periferia e Centralidades; Celta: Oeiras, Portugal, 2001. [Google Scholar]
- Openshaw, S. The Modifiable Areal Unit Problem; Geo Books: Norwich, UK, 1984. [Google Scholar] [CrossRef]
- ArcGIS. Point Density (Spatial Analyst). Available online: https://pro.arcgis.com/en/pro-app/latest/tool-reference/spatial-analyst/point-density.htm (accessed on 14 February 2021).
- Jost, L. Entropy and Diversity. Oikos 2006, 113, 363–375. [Google Scholar] [CrossRef]
- Simpson, E.H. Measurement of Diversity. Nature 1949, 163, 688. [Google Scholar] [CrossRef]
- Ai, N.; Zheng, J.; Chen, X.; Kawamura, K. Neighborhood-Specific Traffic Impact Analysis of Restaurant Meal Delivery Trips: Planning Implications and Case Studies in Chicago. J. Urban Plan. Dev. 2021, 147. [Google Scholar] [CrossRef]
- Anselin, L. Under the Hood Issues in the Specification and Interpretation of Spatial Regression Models. Agric. Econ. 2002, 27, 247–267. [Google Scholar] [CrossRef]
- Anselin, L. Cluster Analysis. Available online: https://geodacenter.github.io/workbook/7bk_clusters_1a/lab7b.html#fn1 (accessed on 20 December 2020).
- Xu, D.; Tian, Y. A Comprehensive Survey of Clustering Algorithms. Ann. Data Sci. 2015, 2, 165–193. [Google Scholar] [CrossRef] [Green Version]
- Anselin, L. Exploring Spatial Data with GeoDa: A Workbook; University of Illinois, Urbana-Champaign: Urbana, IL, USA, 2005. [Google Scholar]
- Anselin, L.; Syabri, I.; Kho, Y. GeoDa: An Introduction to Spatial Data Analysis; Springer: Berlin/Heidelberg, Germany, 2010. [Google Scholar]
- Li, X.; Anselin, L.; Koschinsky, J. GeoDa Web—Enhancing Web-Based Mapping with Spatial Analytics. In Proceedings of the 23rd SIGSPATIAL International Conference on Advances in Geographic Information Systems, Seattle, WA, USA, 3–6 November 2015; pp. 1–4. [Google Scholar] [CrossRef]
- Mariani, S.; Wardono; Masrukan; Fauzi, F. The Arcview and GeoDa Application in Optimization of Spatial Regression Estimate. J. Theor. Appl. Inf. Technol. 2017, 95, 1286–1299. [Google Scholar]
- Purwaningsih, T.; Cintami, A. Analysis of Factors Affecting the Area of Forest and Land Fires in Indonesia Uses Spatial Regression Geoda and SaTScan. J. Inform. 2019, 12, 58. [Google Scholar] [CrossRef] [Green Version]
- Arthur, D.; Vassilvitskii, S. K-Means++: The Advantages of Careful Seeding. In Proceedings of the eighteenth Annual ACM-SIAM Symposium on Discrete Algorithms, New Orleans, LA, USA, 7–9 January 2007; pp. 1027–1035. [Google Scholar]
- Cachinho, H. Consumerscapes and the Resilience Assessment of Urban Retail Systems. Cities 2014, 36, 131–144. [Google Scholar] [CrossRef] [Green Version]
- Alho, A.R.; de Abreu Silva, J. Utilizing Urban Form Characteristics in Urban Logistics Analysis: A Case Study in Lisbon, Portugal. J. Transp. Geogr. 2015, 42, 57–71. [Google Scholar] [CrossRef]
- Macário, R. Modeling for Public Policies Inducement of Urban Freight Business Development. In Freight Transport Modelling; Ben-Akiva, M., Meersman, H., Van de Voorde, E., Eds.; Emerald Group Publishing Limited: Bingley, UK, 2013; pp. 405–432. [Google Scholar] [CrossRef]
- Cócola-Gant, A. Tourism and Commercial Gentrification. In Proceedings of the RC21 2015 Conference, Urbino, Italy, 27–29 August 2015. [Google Scholar]
- Larraz, B.; García-Gómez, E. Depopulation of Toledo’s Historical Centre in Spain? Challenge for Local Politics in World Heritage Cities. Cities 2020, 105, 102841. [Google Scholar] [CrossRef]
- Jover, J.; Díaz-Parra, I. Gentrification, Transnational Gentrification and Touristification in Seville, Spain. Urban Stud. 2020, 57, 3044–3059. [Google Scholar] [CrossRef]
- Miller, E.J. Integrated Urban Modeling: Past, Present, and Future. J. Transp. Land Use 2018, 11, 387–399. [Google Scholar] [CrossRef] [Green Version]
Figure 1.
Total Density of Establishments, 1995, using: (a) a 150 m-sided square grid; (b) a 325 m-sided hexagonal grid; (c) the Point Density tool of ArcGIS Pro® considering a 300 m radius.
Figure 1.
Total Density of Establishments, 1995, using: (a) a 150 m-sided square grid; (b) a 325 m-sided hexagonal grid; (c) the Point Density tool of ArcGIS Pro® considering a 300 m radius.

Figure 2.
Cluster Classification—1995.

Figure 3.
Cluster Classification—2002.

Figure 4.
Cluster Classification—2010.

Table 1.
Summary of the Variables.
| Variable | Description | Mean | |||
|---|---|---|---|---|---|
| 1995 | 2002 | 2010 | |||
| DSS | Density of Commercial Establishments—High Street | number of establishments per block | 8.79 | 8.69 | 7.87 |
| D.S.M. | Density of Commercial Establishments—Shopping Malls | number of establishments per block | 1.10 | 1.62 | 1.43 |
| DVT | Diversity (Variety) | number of categories per block | 3.99 | 3.76 | 3.50 |
| DVC | Diversity (Concentration) | Simpson index | 0.45 | 0.46 | 0.48 |
| CL1 | Clustering (1st order) | average number of establishments in 1st order neighbouring blocks | 8.33 | 8.62 | 7.84 |
| CL2 | Clustering (2nd order) | average number of establishments in 2nd order neighbouring blocks | 7.45 | 7.63 | 6.92 |
| N | 1420 | 1492 | 1721 | ||
Note: N is the number of cells presenting commercial activity.
Table 2.
Commercial Variables in 1995—Mean Value considering Cluster Membership.
| Cluster Variable | 1—CBD | 2—Expansion Area of the Centre | 3—Local Store Clusters | 4—Isolated Stores | 5—Integrated Shopping Malls | 6—Large Shopping Malls |
|---|---|---|---|---|---|---|
| DSS | 53.21 | 15.75 | 5.57 | 1.21 | 11.19 | 6.00 |
| DSM | 1.35 | 0.67 | 0.33 | 0.09 | 37.00 | 227.00 |
| DVT | 8.26 | 6.23 | 3.67 | 1.03 | 7.95 | 8.00 |
| DVS | 0.20 | 0.23 | 0.34 | 0.99 | 0.20 | 0.20 |
| CL1 | 39.59 | 14.86 | 4.97 | 3.00 | 9.90 | 3.75 |
| CL2 | 25.81 | 13.43 | 4.48 | 3.51 | 7.67 | 7.88 |
| N | 34 | 418 | 618 | 328 | 21 | 1 |
Note: N is the number of cells presenting commercial activity.
Table 3.
Commercial Variables in 2002—Mean Value considering Cluster Membership.
| Cluster Variable | 1—CBD | 2—Expansion Area of the Centre | 3—Local Store Clusters | 4—Isolated Stores | 5—Integrated Shopping Malls | 6—Large Shopping Malls |
|---|---|---|---|---|---|---|
| DSS | 59.14 | 16.25 | 5.59 | 1.22 | 7.33 | 0.33 |
| DSM | 3.29 | 1.05 | 0.54 | 0.08 | 53.93 | 223.67 |
| DVT | 7.96 | 6.11 | 3.51 | 0.97 | 3.20 | 0.33 |
| DVS | 0.21 | 0.22 | 0.35 | 0.99 | 0.21 | 0.23 |
| CL1 | 46.27 | 15.84 | 4.99 | 3.51 | 11.74 | 3.83 |
| CL2 | 31.55 | 13.54 | 4.59 | 4.24 | 7.84 | 3.25 |
| N | 28 | 430 | 680 | 336 | 15 | 3 |
Note: N is the number of cells presenting commercial activity.
Table 4.
Commercial Variables in 2010—Mean Value considering Cluster Membership.
| Cluster Variable | 1—CBD | 2—Expansion Area of the Centre | 3—Local Store Clusters | 4—Isolated Stores | 6—Large Shopping Malls |
|---|---|---|---|---|---|
| DSS | 57.16 | 15.22 | 5.32 | 1.20 | 0.67 |
| DSM | 5.38 | 2.14 | 0.77 | 0.09 | 218.00 |
| DVT | 8.00 | 5.76 | 3.38 | 0.94 | 0.67 |
| DVS | 0.22 | 0.23 | 0.36 | 1.00 | 0.25 |
| CL1 | 45.05 | 15.76 | 4.47 | 3.11 | 5.71 |
| CL2 | 30.67 | 13.85 | 4.06 | 3.29 | 3.60 |
| N | 32 | 449 | 824 | 413 | 3 |
Note: N is the number of cells presenting commercial activity.
Publisher’s Note: MDPI stays neutral with regard to jurisdictional claims in published maps and institutional affiliations. |
© 2021 by the authors. Licensee MDPI, Basel, Switzerland. This article is an open access article distributed under the terms and conditions of the Creative Commons Attribution (CC BY) license (https://creativecommons.org/licenses/by/4.0/).
Share and Cite
MDPI and ACS Style
Colaço, R.; de Abreu e Silva, J. Commercial Classification and Location Modelling: Integrating Different Perspectives on Commercial Location and Structure. Land 2021, 10, 567. https://doi.org/10.3390/land10060567
AMA Style
Colaço R, de Abreu e Silva J. Commercial Classification and Location Modelling: Integrating Different Perspectives on Commercial Location and Structure. Land. 2021; 10(6):567. https://doi.org/10.3390/land10060567
Chicago/Turabian StyleColaço, Rui, and João de Abreu e Silva. 2021. "Commercial Classification and Location Modelling: Integrating Different Perspectives on Commercial Location and Structure" Land 10, no. 6: 567. https://doi.org/10.3390/land10060567
Note that from the first issue of 2016, this journal uses article numbers instead of page numbers. See further details here.