Article

Spatial Distribution, Environmental Risk and Safe Utilization Zoning of Soil Heavy Metals in Farmland, Subtropical China

1
College of Geography and Environmental Sciences, Zhejiang Normal University, Jinhua 321004, China
2
School of Geography and Ocean Science, Nanjing University, Nanjing 210023, China
3
Institute of Land and Urban-Rural Development, Zhejiang University of Finance & Economics, Hangzhou 310018, China
4
Key Laboratory of the Coastal Zone Exploitation and Protection, Ministry of Natural Resources, Nanjing 210023, China
*
Author to whom correspondence should be addressed.
These two authors contributed equally to this study as co-first author.
Land 2021, 10(6), 569; https://doi.org/10.3390/land10060569
Submission received: 23 April 2021 / Revised: 22 May 2021 / Accepted: 26 May 2021 / Published: 28 May 2021
(This article belongs to the Section Soil-Sediment-Water Systems)

Abstract

:
Heavy metal (HM) accumulation in farmland soil can be transferred to the human body through the food chain, posing a serious threat to human health. Exploring the environmental risk and safe utilization zoning of soil HMs in farmland can provide the basis for the formulation of effective control strategies. Soil samples from typical subtropical farmland were collected in Jinhua City and analyzed for HMs (As, Cd, Cr, Cu, Hg, Ni, Pb, and Zn). The objective of this study was to explore the spatial distribution and environmental risk of soil HMs, and then divide the safe utilization area of soil HMs of farmland in Jinhua City. The results showed that the mean concentrations of soil HMs were, in descending order: Zn (76.05 mg kg−1) > Cr (36.73 mg kg−1) > Pb (32.48 mg kg−1) > Cu (18.60 mg kg−1) > Ni (11.95 mg kg−1) > As (6.37 mg kg−1) > Cd (0.18 mg kg−1) > Hg (0.11 mg kg−1), and all determined soil HMs did not exceed the risk screening values for soil contamination of agricultural land of China. The fitted semi-variogram showed that the spatial autocorrelation of Cd, Hg, Pb, and Zn was weak, with island-shaped distribution, while As, Cr, Cu, and Ni had medium spatial autocorrelation, with strip-shaped and island-shaped distribution. The hot spot analysis and environmental risk probability showed that the environmental risks of As, Cd, Cu, Pb, Zn, and Cu were relatively high, whereas those of Cr, Hg, and Ni were relatively low. Safe utilization zones and basic safe utilization zones accounted for 89.35% and 8.58% of the total farmland area in Jinhua, respectively, and only a small part of the farmland soil was at risk of use.

1. Introduction

Soil is one of the most important natural resources for human survival and development, and it is also the source and sink of many pollutants [1,2]. With rapid industrialization and urbanization, heavy metals (HMs) have gradually accumulated in farmland soil [3,4], which have not only degraded the soil quality of farmland, but can also affect the growth of plants [5,6]. Furthermore, soil HMs can be transferred to the human body through the food chain, posing a serious threat to human health [7,8].
Recently, GIS-based geostatistical analysis methods have been widely used in the study of soil spatial distribution [9,10,11]. Among them, ordinary kriging quantifies the spatial distribution pattern by fitting a semi-variogram, which is one of the most commonly used methods to explore the spatial distribution of soil HMs [12]. Additionally, indicator kriging, which is a nonparametric approach, is more advanced due to its ability to take the data uncertainty into account and it is used to predict the conditional probability for the categorical data of unsampled sites [13,14]. Many scholars applied the indicator kriging method to predict the spatial distribution and pollution risk probability of soil HMs with the soil background value as the threshold [15,16,17]. The Getis-Ord spatial statistics index (Gi*), also called hot spot analysis, is calculated to identify statistically significant spatial clusters of high values (hot spots) and low values (cold spots) [18]. The hot spots of soil HMs and their surroundings may have environmental risks and, consequently, the Gi* index can be used for the identification of the environmental risk of soil HMs [12,19]. Currently, the safe utilization zoning of HMs in farmland has mainly been based on the assessment of soil HMs pollution, and a unified standard system has not yet been formed. Many assessment methods were proposed for measuring soil HMs pollution, such as the single pollution index [20], Nemerow index [21], geo-accumulation index [22], pollution load index [23], potential ecological risk index [24], enrichment factor index [25], etc. However, these methods are either not able to comprehensively reflect HMs pollution in soil, or may be subjective. The influence index of comprehensive quality of soil (IICQs) comprehensively considers the valence effect of elements, the environmental quality standard for soil, the background value of soil elements, and the specific load capacity of soil, which could scientifically and comprehensively evaluate HMs pollution in soil [26]. Therefore, this research adopts the IICQs to evaluate HMs pollution in farmland soil and carry out safe utilization zoning of soil HMs.
Jinhua has a long history of agricultural cultivation and is one of the most important granaries in Zhejiang Province. Therefore, exploring the pollution of HMs in farmland soil in Jinhua is essential to ensure food safety and human health. Previous studies on heavy metals in Jinhua mainly focused on urban soil, and little attention was paid to the characteristics and risk of heavy metals in farmland soil [27]. We hypothesized that the combined multiple methods would effectively assess the risk status of soil HMs and accurately delineate the safe utilization zoning. Specifically, the main objectives of this research were to (1) explore the spatial variability and distribution characteristics of HMs in farmland soils in the study area; (2) identify the environmental risks of HMs in farmland soils in the study area; (3) carry out safe utilization zoning of HMs in farmland soil based on the IICQs.

2. Materials and Methods
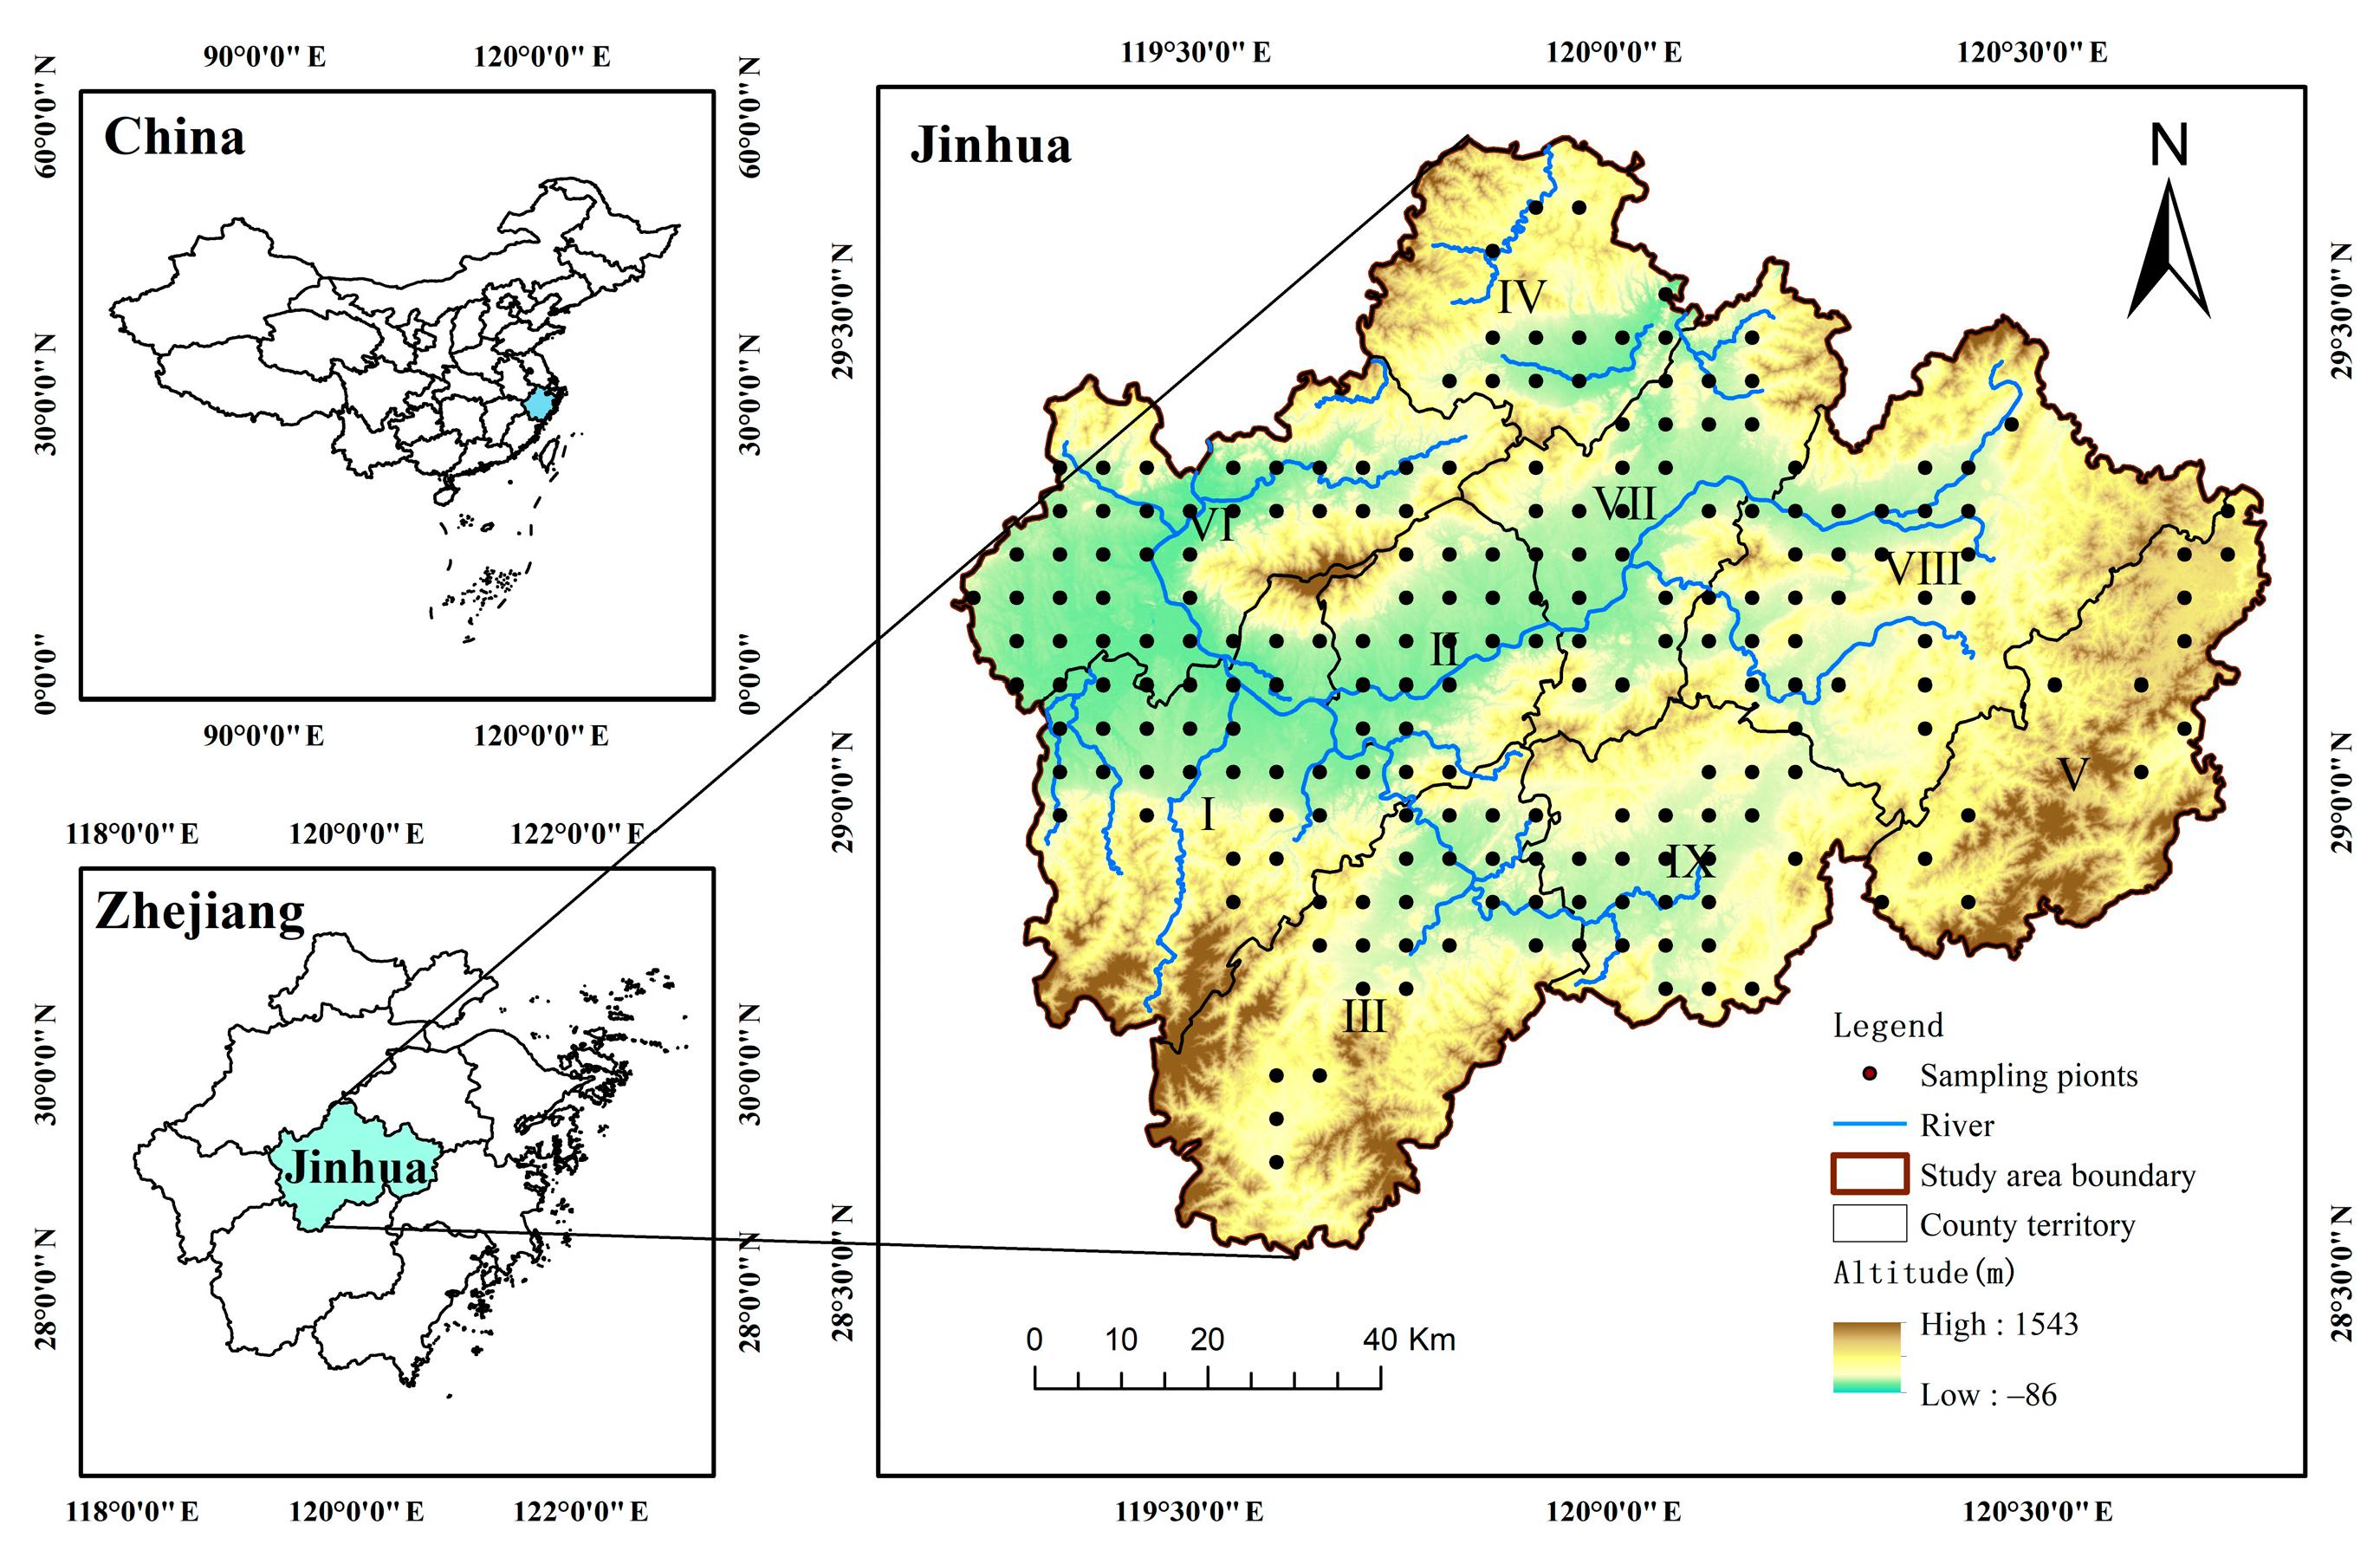
2.1. Study Area

Jinhua City (28°32′~29°41′ N, 119°14′~120°47′ E) is located in the middle of Zhejiang Province, eastern China, with an area of about 1.09 × 10⁴ km2 (Figure 1). The study area has a subtropical monsoon climate, warm and humid, with abundant rainfall and four distinct seasons. The annual average temperature and precipitation are about 16.3~17.6 °C and 1150~1909 mm, respectively. The vegetation is subtropical evergreen broad-leaved forests. The area of farmland in Jinhua is about 2400 km2, and is dominated by paddy fields and dry land. Jinhua is also an important grain production area in Zhejiang Province, with annual grain output of 4.35 × 10⁵ tons. In recent years, the concentrations of heavy metals in farmland soils in Jinhua have gradually increased with the massive use of pesticides and industrial emissions.

2.2. Soil Sampling and Laboratory Analyses

According to the principle of typicality, representativeness, and consistency, soil samples were collected by using a 5 km × 5 km grid, then the non-farm sampling points were removed after field investigations, and a total of 209 farmland topsoil samples (0–20 cm) were finally collected (Figure 1). For each sample, five subsamples within a 100 m radius from the sampling site were collected and mixed into a composite sample, stored in polyethylene bags, and taken back to the laboratory for further analysis.
All soil samples were air-dried and ground in a dust-free laboratory, and after that passed through a 2 mm nylon sieve to remove stones and other debris, and then passed through a 0.149 mm sieve for testing. Soil pH was measured by a pH meter with a ratio of 1:2.5 soil to deionized water [28]. Soil Cr, Cd, Cu, Pb, Ni, and Zn were digested with HCl–HNO3–HClO4 on a hot plate, and then measured by inductively coupled plasma–atomic emission spectrometry (ICP-AES); soil As and Hg were digested with aqua regia water bath digestion, and then measured by an inductively coupled plasma–atomic fluorescence spectrometer (ICP-AFS). All reagents used in the analyses were of premium grade, and all water was ultrapure water. The quality control was carried out with the national soil standard reference material (GBW07424, GSS-24) provided by the Center of National Standard Reference Material of China [29]. Additionally, 20% of the samples were randomly selected for testing repeatedly, and the error remained within 5%. The recovery rate ranged from 81% to 109%, and the measurement results were within the allowable range of error.

2.3. Data Processing and Statistical Analysis

2.3.1. Ordinary Kriging

Ordinary kriging is an unbiased optimal estimation of soil HMs concentration by fitting a semi-variogram, which is used to quantify the structural characteristics and random changes of regionalized variables [11,24,30]. The calculation formula of the semi-variogram is as follows:
γ ( h ) = 1 2 N ( h ) i = 1 N ( h ) [ Z ( x i ) Z ( x i + h ) ] 2
where γ(h) is the semi-variogram; h is the space separation distance between the two samples; Z(xi) is the sample value of Z(x) at the spatial position xi; Z(xi + h) is the sample value of Z(x) at the spatial position xi + h; N(h) is the number of sample point pairs.

2.3.2. Indicator Kriging

Indicator kriging is a non-linear kriging method for estimating the probability of exceeding a specific threshold value at a given location, thereby indicating environmental risks [17]. The key point of indicator kriging is to perform binary encoding of the original data according to the threshold (Zk) [31], and the relationship is measured as follows:
I ( x ; Z k ) = { 1 , Z ( x ) Z k 0 , Z ( x ) < Z k
then, the semi-variogram was used to quantify the spatial correlation of the indicator codes, and calculate the probability of the indicator variable at the unsampled points through the following linear equation:
I * ( x 0 ; Z k ) = α = 1 n λ α I ( x α ; Z k )
where I (xα; Zk) is the indicated transformation value of the known sample point xα; I*(x0; Zk) represents the estimated value of x0 to be predicted; n is the number of samples, α = 1, 2, …, n; λα is the weight coefficient, which can be solved by the following equations.
{ β = 1 n λ β = 1 β = 1 n λ β γ I ( x α x β ; Z k ) + η = γ I ( x α x 0 ; Z k )
where η is the Lagrange multiplier; γI is the indicated semi-variance value at the respective lag distances when Zk is the threshold, α = 1, 2, …, n.

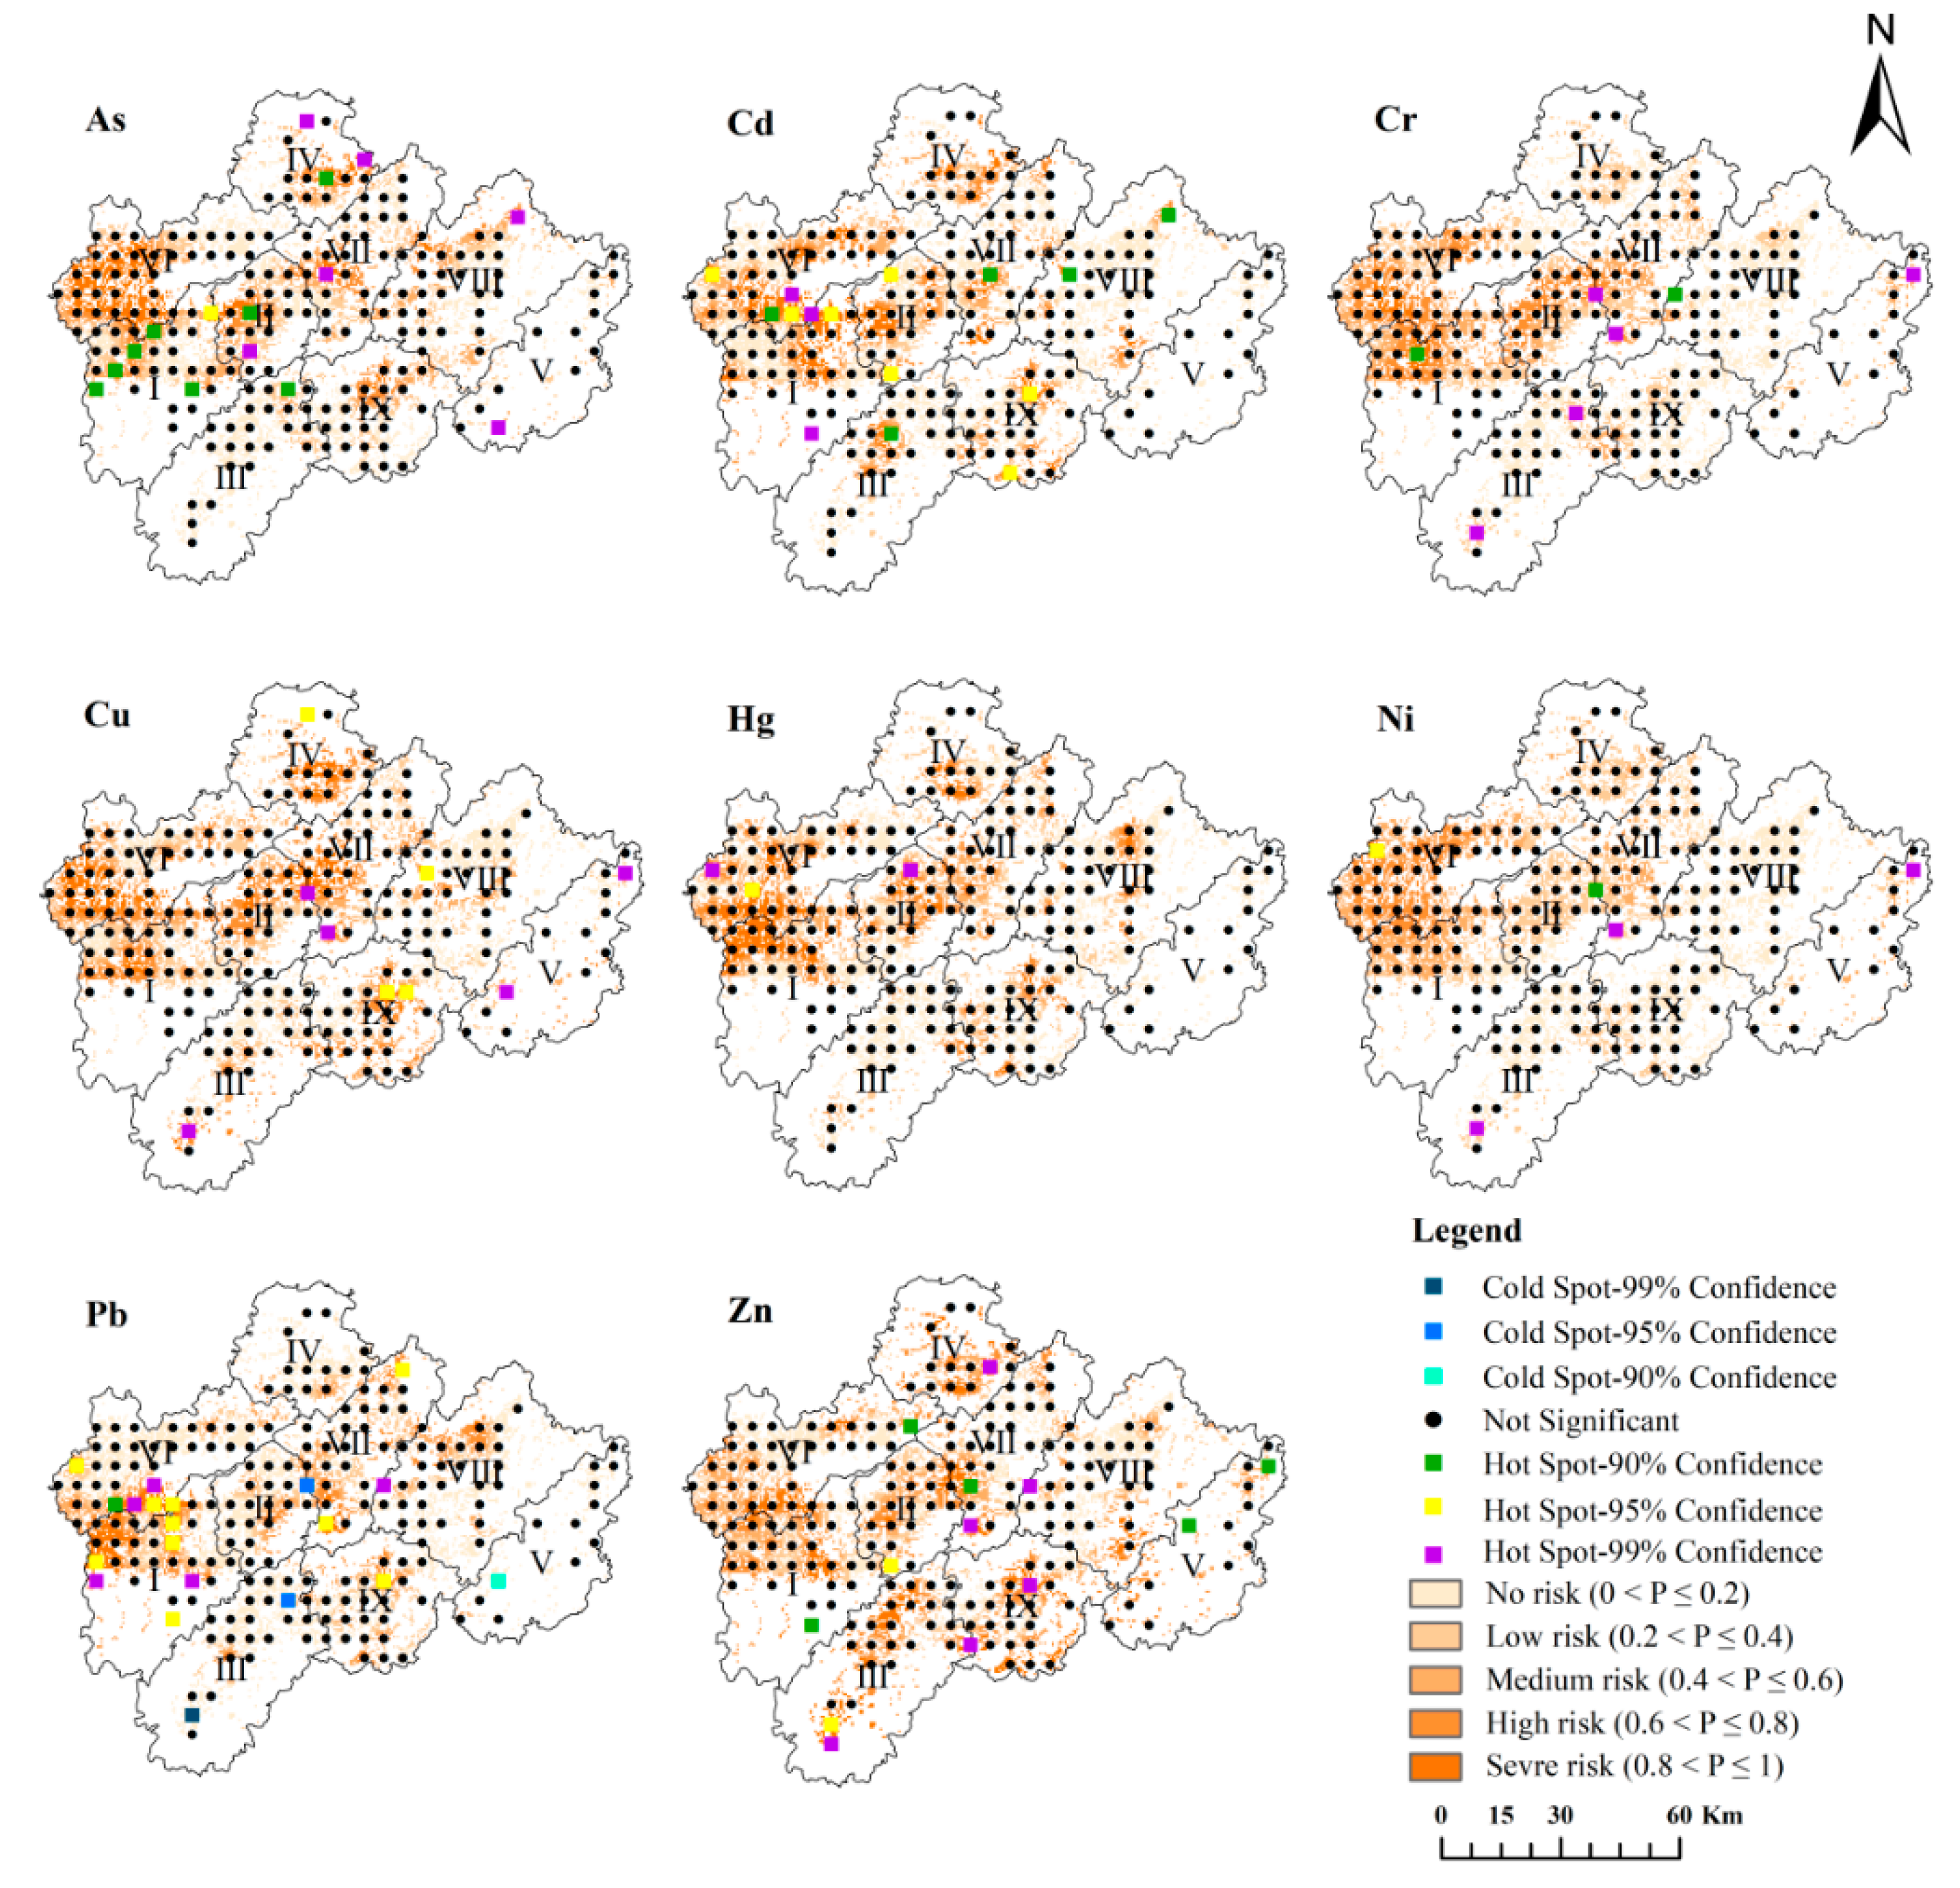
2.3.3. Hot Spot Analysis

The Getis–Ord spatial statistics index ( G i * ) is one of the local spatial autocorrelation analysis methods, which can identify statistically significant spatial clusters of hot spots and cold spots by calculating G i * statistics [18]. The hot spots of HMs represent areas with statistically significant spatial clustering of samples with high HMs concentrations, and the cold spots are areas in which the lowest HMs concentrations are spatially clustered [32]. Hot spots of HMs in the soil may have potential pollution risks. The formula of the G i * index is as follows:
G i * = j = 1 n w i , j x j X ¯ j = 1 n w i , j [ n j = 1 n w i , j 2 ( j = 1 n w i , j ) 2 ] / ( n 1 ) s
where xj represents the attribute value of spatial unit j; wi,j represents the spatial weight between spatial units i and j; n is the number of spatial units; X   ¯ is the mean value; S is the standard deviation. A significantly positive G i * statistical value indicates hot spots, and the higher the G i * statistical value, the more densely the hot spots are clustered. A significantly negative G i * statistical value indicates cold spots, and the lower the G i * statistical value, the more tightly the cold spots are clustered [33,34].

2.3.4. Influence Index of Comprehensive Quality of Soil (IICQs)

The IICQs comprehensively consider factors such as the background value of soil HMs, soil quality standards, and valence effects, and can comprehensively reflect the degree of soil pollution [27]. The formula of the IICQs is as follows:
RIE = [ i = 1 N ( P SSi ) 1 n ] / N = [ i = 1 N ( C i C Si ) 1 n ] / N
DDDB = [ i = 1 N ( P SBi ) 1 n ] / N = [ i = 1 N ( C i C Bi ) 1 n ] / N  
DDSB = [ i = 1 N ( C Si C Bi ) 1 n ]
IICQs = X · ( 1 + RIE ) + Y · ( DDDB / DDSB )
where N indicates the number of HMs; Ci indicates the measured concentration of HMi; CSi indicates the soil environmental quality standard value of HMi, which is the soil risk screening value; CBi indicates the background value of HMi; n represents the oxidation number of HMi; RIE represents relative impact equivalent; DDDB represents deviation degree of the determination concentration from the background value; DDSB represents the deviation degree of soil standard from the background value; X is the number of soil-measured values exceeding the soil risk screening values; and Y is the number of soil-measured values exceeding the background values.
The pollution levels of soil HMs were classified according to the IICQs and “The National Soil Pollution Condition Investigation Report” [35], and then the safe utilization zoning of soil HMs in farmland was carried out based on the pollution levels (Table 1).

2.3.5. Statistical Analysis

The descriptive statistics were produced and the Kolmogorov–Smirnov (K–S) test was conducted using SPSS 19.0 for Windows (SPSS Inc., Chicago, IL, USA). The fitting of the semi-variogram was performed in GS+ 9.0 for Windows (Gamma Inc., Ann Arbor, MI, USA). The kriging interpolation, hot spot analysis, and safe utilization zoning were estimated in ArcGIS 10.2 for Windows (ESRI Inc., Redlands, CA, USA).

3. Results and Discussion

3.1. Concentration Characteristics of Soil HMs

The descriptive statistics of HMs in farmland soils in Jinhua are summarized in Table 2. Soil pH ranged from 3.99 to 8.15, with an average pH of 5.34, which was mainly acidic. The study area has a subtropical monsoon climate with abundant rain and heat resources, and the strong leaching makes the soil acidic [36]. In addition, the application of chemical fertilizers intensifies the acidification of farmland soils [37]. The mean concentrations of soil HMs were, in descending order: Zn (76.05 mg kg−1) > Cr (36.73 mg kg−1) > Pb (32.48 mg kg−1) > Cu (18.60 mg kg−1) > Ni (11.95 mg kg−1) > As (6.37 mg kg−1) > Cd (0.18 mg kg−1) > Hg (0.11 mg kg−1), and all determined soil HMs did not exceed the risk screening values for soil contamination of agricultural land of China [38]. However, the mean concentrations of Cu, Hg, and Zn were higher than the corresponding background values of Jinqu Basin and Zhejiang Province, indicating anthropic inputs of these elements were relatively high. The mean concentrations of Cu, Cr, Ni, and Pb in farmland soil in Jinhua City were lower than those in Dehui except for Zn [39]. Similarly, the mean concentrations of As, Cd, Cr, Cu, Hg, Ni, Pb, and Zn in farmland soil in Jinhua City were all lower than those in the agricultural soil south of the Yangtze River Delta [19]. According to the coefficient of variation (CV) of HMs, Pb and Zn had moderate variability (20% < CV < 50%), and As, Cd, Cr, Cu, and Ni had high variability (50% < CV < 100%), whereas Hg had extremely high variability (CV > 100%) [4]. It could be suggested that the distribution of Hg in the study area was extremely uneven and might be dominated by anthropogenic sources [40]. Kurtosis and skewness indicated that the distribution of soil HMs in the study area was a skewed distribution.

3.2. Spatial Distribution Characteristics of Soil HM Concentration

The parameters of fitted semi-variogram models are shown in Table 3. The exponential model was fitted for all HMs. The R2 of both As and Ni was higher than 0.8, and the RSS values were both close to 0, which indicated the fitted models could better reflect the spatial structure characteristics of soil HMs. The R2 values of Cd, Cr, Cu, Pb, and Zn were higher than 0.5, and RSS values were also close to 0, which indicated the fitted models basically met the requirements. The ratio of nugget (C0) and sill (C0 + C) was usually used to reflect the spatial heterogeneity in the nugget variance [40]. The C/(C0 + C) ratios of As, Cr, Cu, and Ni were between 0.25 and 0.75, which indicated a moderate spatial correlation, and the variable was dominated by the combined effects of natural and human factors. The C/(C0 + C) ratios of Cd, Hg, Pb, and Zn were higher than 0.75, indicating that there was strong spatial randomness and weak autocorrelation [40,43]. The range of spatial autocorrelation of soil HM concentrations was between 8400 and 77,100 m, which was much larger than the sampling interval (5000 m), indicating that the sampling design in this paper was reasonable and could reflect the true variation characteristics of soil HMs [44]. Ni had the largest range (77,100 m), indicating that it was spatially correlated at a larger scale, and the intrinsic factors (such as soil parent material, climate, and topography) had a greater impact on its spatial variability in the soil [45]. However, the ranges of Cd, Hg, Pb, and Zn were smaller, which implied that the spatial variability of these elements was greatly affected by extrinsic factors, such as agricultural activities, industrial emissions, vehicle emissions, etc. [40,45].
The spatial distribution of soil HMs in farmland of Jinhua City is shown in Figure 2. The As, Cr, Cu, and Ni presented strip-shaped and island-shaped distributions. The high concentrations of As were mainly distributed in the central and western parts of the study area, where light industry and agriculture are located, and the population and traffic is dense. In addition, the high concentrations of As were distributed in the east of Pujiang (IV), which was basically consistent with the distribution of farmland. Previous studies have shown that long-term application of phosphate fertilizers and pesticides can increase the As concentration in farmland soils [46,47]. The concentrations of Cr and Ni had similar spatial distributions, which were mainly concentrated in the central and western parts of the study area, indicating that they may have common sources [48]. Moreover, the concentrations of Cr and Ni in the southwest of Wuyi (III) were also relatively high, which might be related to nearby mines. The spatial distribution of Cu was similar to that of Cr. Furthermore, Cu had obvious high concentrations in the east of Yongkang (IX) and the southwest of Pan’an (V), which might be related to the fact that there are many hardware factories and plastic manufacturing factories there. The spatial distributions of Cd, Hg, Pb, and Zn concentrations were mainly island-shaped distributions, and showed obvious point source pollution, implying that they may be mainly affected by human activities [39]. High concentrations of Cd were mainly distributed in the western part of the study area, and were scattered in other counties. It has been demonstrated that long-term application of phosphate fertilizer, sewage irrigation, and mining and smelting of cadmium bearing ores can cause soil Cd pollution [9,49,50]. The high concentration of Hg mainly was distributed in a small area of the middle and western part of the study area, which might be caused by sewage irrigation and atmospheric deposition [49,51]. The high concentration of Pb was mainly distributed near the urban areas and main roads of the study area. Many studies indicated that the common sources of Pb in agricultural soils are industrial fumes, vehicle exhausts, and pesticides [39,52]. The high concentration of Zn showed a scattered distribution in the southern and central parts of the study area, which may have derived from both lithogenic sources and human activities [6,49,53].

3.3. Environmental Risk of Soil HM Concentration

The distribution of soil HM hot spots and environmental risk probabilities are shown in Figure 3. Almost all the hot spots of HMs were present in areas with environmental risk, indicating that both the G i * index and indicator kriging could reflect the soil environmental risks of soil HMs well. However, As and Cu elements did not have hot spots in the high-risk area (VI), which might be because the G i * index is a commonly used local spatial autocorrelation method. An earlier study noted that the spatial autocorrelation analysis could easily compare and test the strength and significance of spatial dependence, and the local Moran’s I is helpful to find the spatial outliers or hot spots of soil HMs, which are both considered effective exploratory spatial analysis methods for regional variables [54]. Hu et al. [19] reported that most interpolation methods have smoothing effects or prediction bias when predicting soil HM pollution, and the G i * index could not only define hot spots, but also provide credible probabilities for the results, which is of great significance for practical applications. However, the G i * index could only evaluate the known sample data, while the indicator kriging could perform risk assessment on unsampled points, which makes up for the deficiency of the G i * index [12,13,54]. Lin et al. [55] also demonstrated that the combination of hot spot analysis and geostatistical analysis was effective for exploring soil HM pollution.

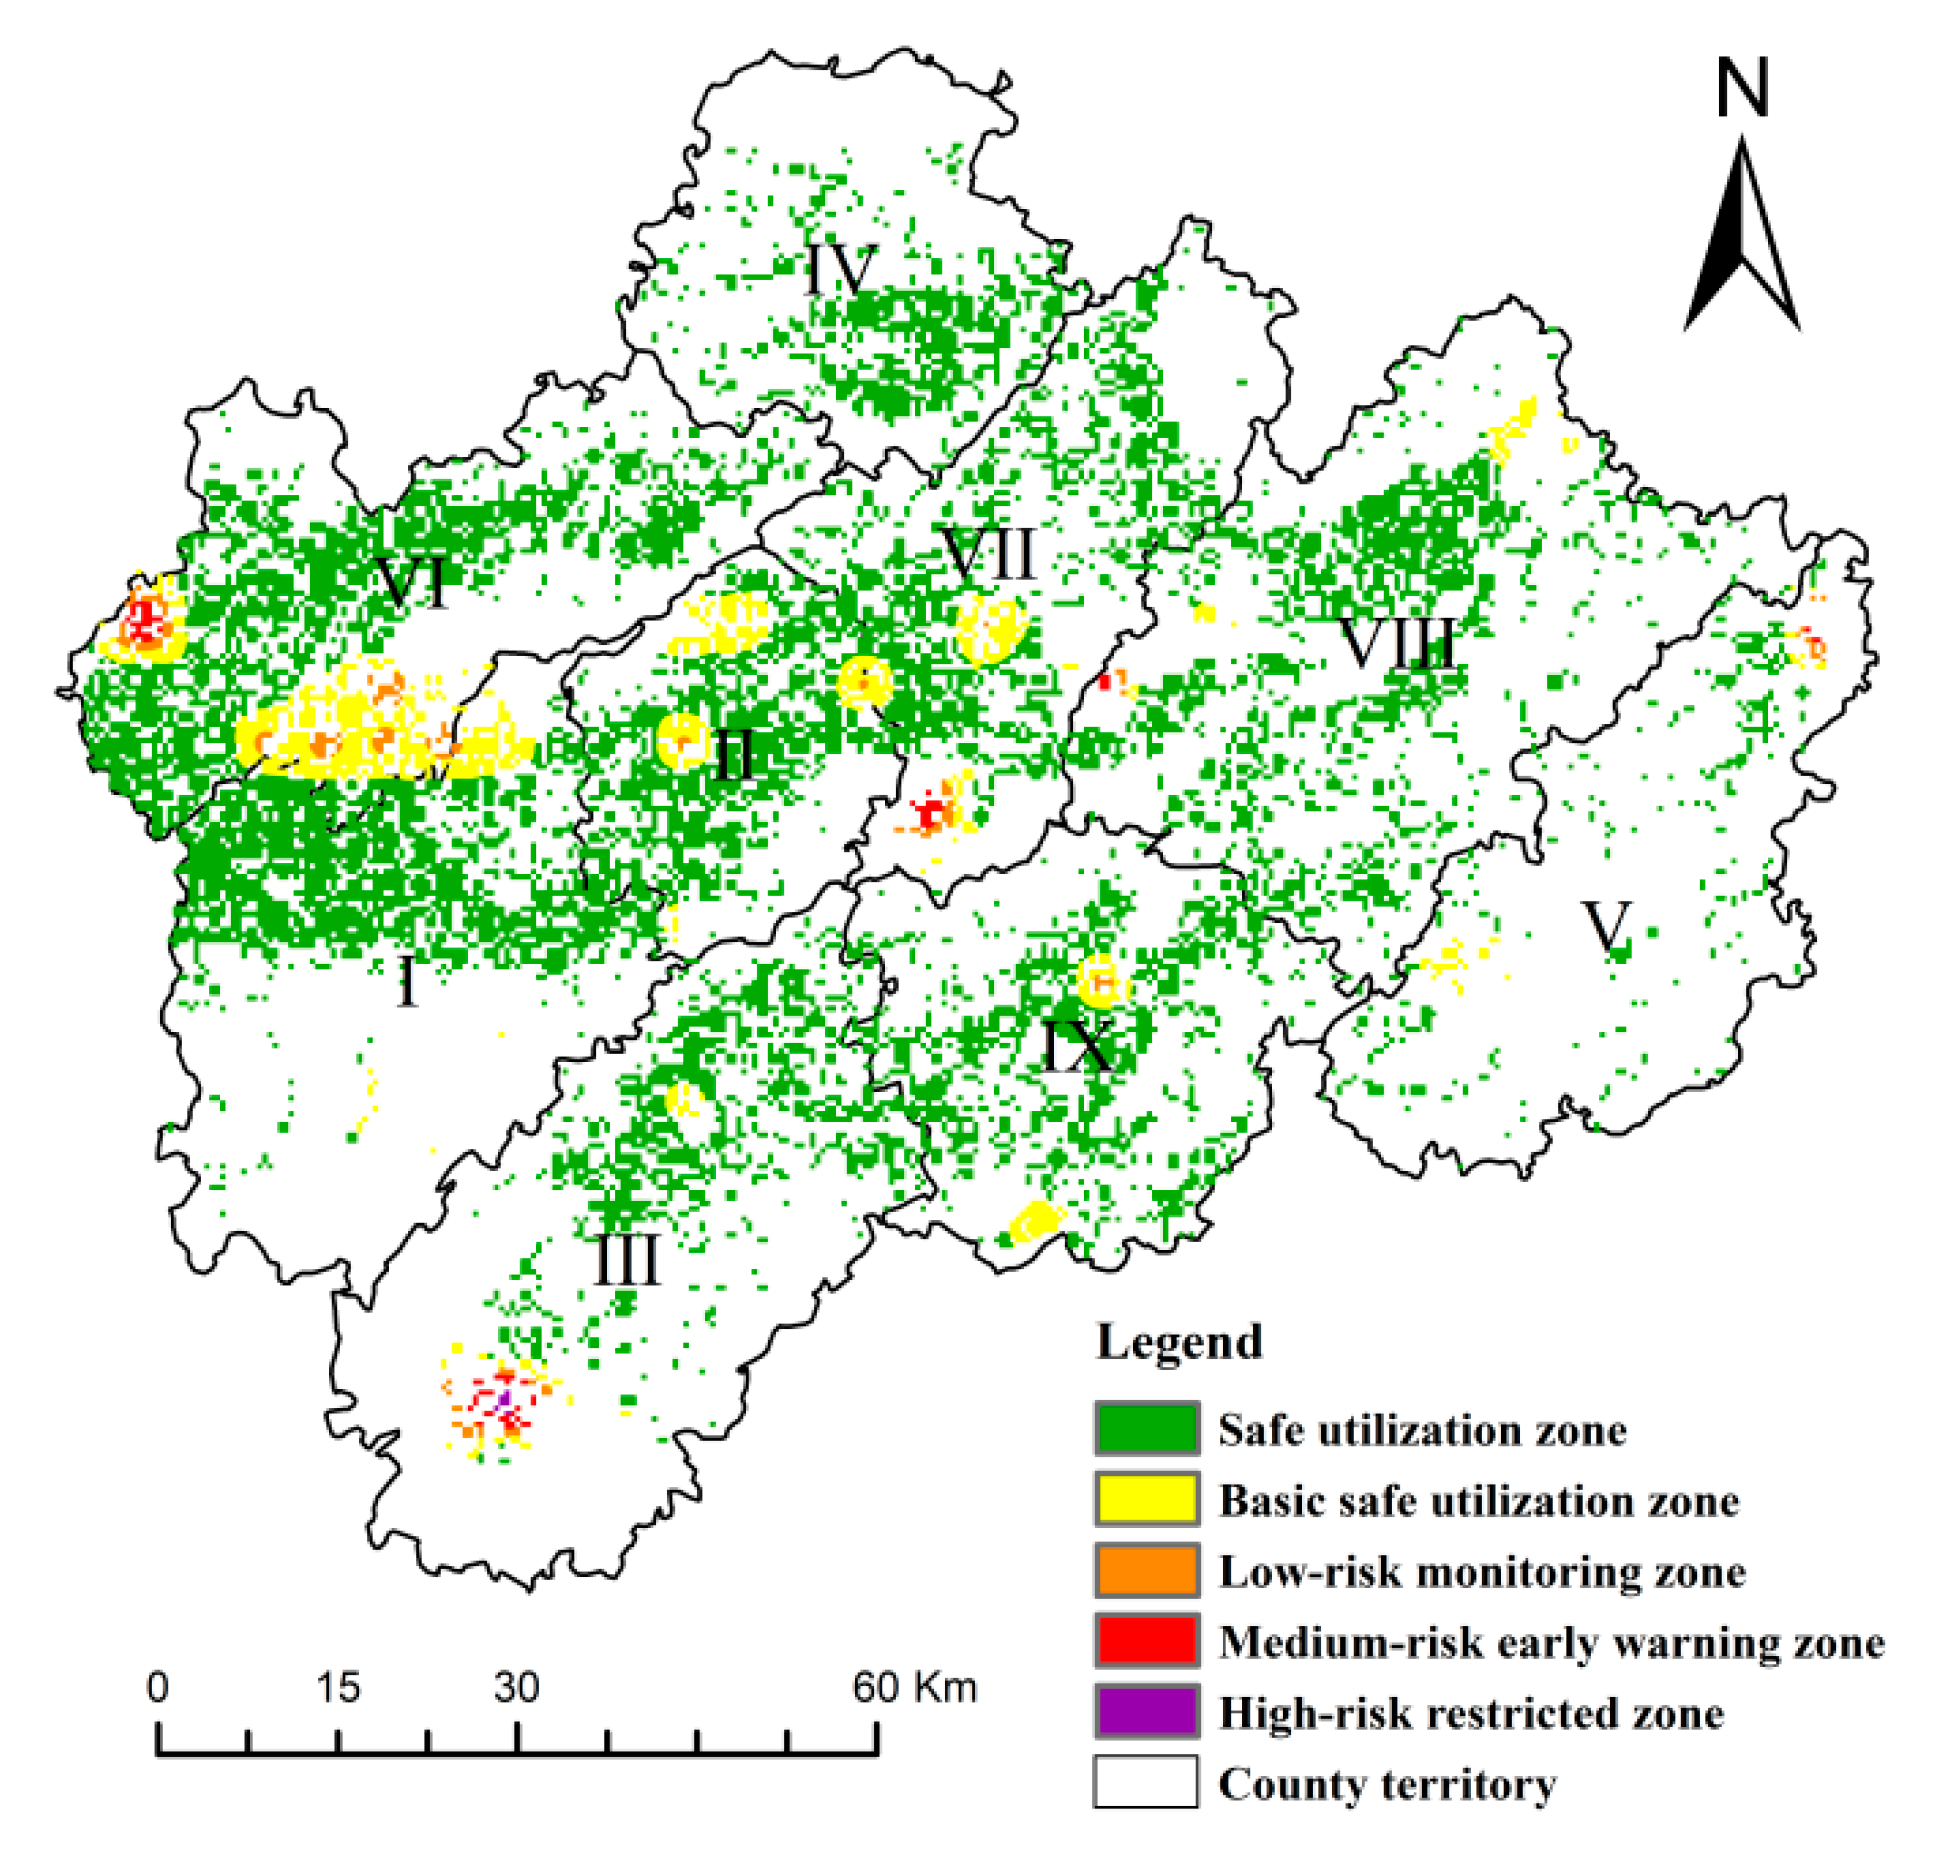
3.4. Safe Utilization Zoning of Soil HMs in Farmland

The IICQs was calculated according to Equations (6)–(9), and the grades of the farmland soil safe utilization zones were classified with reference to Table 1. The safe utilization zoning of soil HMs in farmland of Jinhua City were interpolated by ordinary kriging (Figure 4), and the areas of each safe utilization zone are shown in Table 4.
(1) Safe utilization zone. The safe utilization zone covered an area of 2144.47 km2, accounting for 89.35% of the total farmland area of Jinhua, and was evenly distributed in the northern part of Wucheng (I) and Wuyi (III) and other countries. The soil HM concentrations in the safe utilization area might exceed the soil background value, but did not exceed the risk screening values for soil contamination of agricultural land of China, so the soil was clean and safe to use, thus a strategy of key protection and prioritized use should be adopted. It is necessary to give priority to the development of agriculture and strictly prevent the input of pollutants [56].
(2) Basic safe utilization zone. The basic safe utilization zone accounted for 8.58% of the total farmland area and was mainly distributed in counties except Pujiang (IV). The soil HM concentrations in this zone slightly exceeded the screening values, but without constituting a threat to crop growth and human health. Therefore, priority protection strategies should be adopted, such as controlling the input of new pollutants and optimizing agricultural farming measures to reduce the risks of agricultural production [17].
(3) Low-risk monitoring zone. The area of the low-risk monitoring zone only accounted for 1.41% of the total farmland area, and was mainly distributed in the western and southern parts of Lanxi (VI), southern parts of Yiwu (VII), and southern parts of Wuyi (III), etc. The soil HM concentrations of farmland soil in this zone slightly exceeded the screening values, and pose a threat to crop growth and human health. Therefore, it is necessary to monitor the soil environment dynamically to prevent the input of pollution. Additionally, it is suggested that soil remediation measures such as adjusting the tillage system should be taken to improve the soil environment [4].
(4) Medium-risk early warning zone. The area of this zone was about 10.84 km2, and was mainly distributed in the western part of Lanxi (VI), Yiwu (VII) and the southern part of Wuyi (III). The concentration of soil HMs in these areas obviously exceeded the risk screening values, posing a greater threat to crop growth and human health. Therefore, strict early warning and control strategies should be implemented, and the quality of crops, soil and irrigation water should be strictly monitored. Additionally, economic crops could be planted instead of grain crops, which could reduce the accumulation of HMs in the human body through the food chain [4].
(5) High-risk restricted zone. The high-risk restricted zone had the smallest area, and only accounted for 0.05% of the total farmland area in the study area, and was concentrated in the southern part of Wuyi (III). The high-risk restricted zone had extremely high levels of soil HM concentrations, which seriously exceeded the risk screening values and were not suitable for planting crops. Therefore, the area should have restricted agricultural use and the soil should be actively repaired [57].

4. Conclusions

In this paper, we explored the spatial distribution, environmental risk, and safe utilization of soil HMs in farmland of Jinhua City, subtropical China. The results showed that the mean concentrations of As (6.37 mg kg−1), Cd (0.18 mg kg−1), Cu (18.60 mg kg−1), Cr (36.73 mg kg−1), Hg (0.11 mg kg−1), Ni (11.95 mg kg−1), Pb (32.48 mg kg−1), and Zn (76.05 mg kg−1) did not exceed the risk screening values for soil contamination of agricultural land of China. However, the mean concentrations of Cu, Hg, and Zn were higher than the corresponding background values of the study area, indicating anthropic inputs of these elements were high. The C/(C0 + C) ratios of As (0.576), Cr (0.502), Cu (0.502), and Ni (0.501) indicated a moderate spatial correlation, whereas the C/(C0 + C) ratios of Cd (0.874), Hg (0.919), Pb (0.926), and Zn (0.904) indicated a strong spatial randomness and weak autocorrelation. As, Cr, Cu, and Ni showed strip-shaped and island-shaped distributions, while Cd, Hg, Pb, and Zn presented island-shaped distributions. The environmental risks of As, Cd, Cu, Pb, and Zn were relatively high, which need to be monitored. The total area of safe and basic safe utilization areas accounts for 98% of farmland in the study area. For the safe and basic safe utilization area, a protection strategy should be implemented. The low-risk and medium-risk utilization areas should adopt dynamic monitoring and early warning prevention strategies, respectively, while the high-risk utilization areas should adopt strategies to restrict agricultural use. This study will provide a reference for land managers to formulate effective control and remediation strategies for protecting farmland soil. From the methodological perspective, this paper will provide a methodological reference for exploring soil HM pollution in areas with similar characteristics to the study area.

Author Contributions

Conceptualization, X.X.; Methodology, L.P. and T.W.; Writing—original draft, W.G. and T.W.; Supervision, F.X. and H.Y.; Project administration, G.J. and J.Z.; Funding acquisition, X.X. and L.P. All authors have read and agreed to the published version of the manuscript.

Funding

This research was funded by the National Natural Science Foundation of China (41871083, 41230751, 41701618), the Science and Technology Planning Project of Jinhua City (2020-4-183), the Open Fund of Key Laboratory of Coastal Zone Exploitation and Protection, Ministry of Natural Resources (2019CZEPK09), and the Natural Science Foundation of Zhejiang Province, China (LQ21D010007, LY21D010008).

Institutional Review Board Statement

Not applicable.

Informed Consent Statement

Not applicable.

Data Availability Statement

The data presented in this paper are available on request from the corresponding author.

Conflicts of Interest

The authors declare no conflict of interest.

References

  1. Karim, Z.; Qureshi, B.A.; Mumtaz, M.; Qureshi, S. Heavy metal concentration in urban soils as an indicator of anthropogenic and natural influences on landscape of Karachi—A multivariate spatio-temporal analysis. Ecol. Indic. 2014, 42, 20–31. [Google Scholar] [CrossRef]
  2. Xie, X.F.; Pu, L.J.; Zhu, M.; Meadows, M.; Sun, L.C.; Wu, T.; Bu, X.G.; Xu, Y. Differential effects of various reclamation treat-ments on soil characteristics: An experimental study of newly reclaimed tidal mudflats on the east China coast. Sci. Total Environ. 2021, 768, 144996. [Google Scholar] [CrossRef] [PubMed]
  3. Wang, X.; Gao, P.; Li, D.; Liu, J.; Tang, W. Risk assessment for and microbial community changes in farmland soil contami-nated with heavy metals and metalloids. Ecotoxicol. Environ. Saf. 2019, 185, 109685. [Google Scholar] [CrossRef]
  4. Hu, B.; Zhou, Y.; Jiang, Y.; Ji, W.; Fu, Z.; Shao, S.; Li, S.; Huang, M.; Zhou, L.; Shi, Z. Spatio-temporal variation and source changes of potentially toxic elements in soil on a typical plain of the Yangtze River Delta, China (2002–2012). J. Environ. Manag. 2020, 271, 110943. [Google Scholar] [CrossRef]
  5. Nicholson, F.A.; Smith, S.R.; Alloway, B.J.; Carlton-Smith, C.; Chambers, B.J. An inventory of heavy metals inputs to agricultural soils in England and Wales. Sci. Total Environ. 2003, 311, 205–219. [Google Scholar] [CrossRef]
  6. Micó, C.; Recatalá, L.; Peris, M.; Sánchez, J. Assessing heavy metal sources in agricultural soils of an European Mediterrane-an area by multivariate analysis. Chemosphere 2006, 65, 863–872. [Google Scholar] [CrossRef]
  7. Singh, A.; Sharma, R.K.; Agrawal, M.; Marshall, F. Health risk assessment of heavy metals via dietary intake of foodstuffs from the wastewater irrigated site of a dry tropical area of India. Food Chem. Toxicol. 2010, 48, 611–619. [Google Scholar] [CrossRef]
  8. Deng, M.; Zhu, Y.; Shao, K.; Zhang, Q.; Ye, G.; Shen, J. Metals source apportionment in farmland soil and the prediction of metal transfer in the soil-rice-human chain. J. Environ. Manag. 2020, 260, 110092. [Google Scholar] [CrossRef]
  9. Marrugo-Negrete, J.; Pinedo-Hernández, J.; Díez, S. Assessment of heavy metal pollution, spatial distribution and origin in agricultural soils along the Sinú River Basin, Colombia. Environ. Res. 2017, 154, 380–388. [Google Scholar] [CrossRef]
  10. Adimalla, N.; Chen, J.; Qian, H. Spatial characteristics of heavy metal contamination and potential human health risk assessment of urban soils: A case study from an urban region of south India. Ecotoxicol. Environ. Saf. 2020, 194, 110406. [Google Scholar] [CrossRef]
  11. Baltas, H.; Sirin, M.; Gökbayrak, E.; Ozcelik, A.E. A case study on pollution and a human health risk assessment of heavy metals in agricultural soils around Sinop province, Turkey. Chemosphere 2020, 241, 125015. [Google Scholar] [CrossRef]
  12. Wang, F.; Wu, Q.-Y.; Lü, J.-S.; Dong, Y.-L.; Cao, W.-T.; Kang, R.-F.; Cao, J.-F. Spatial Characteristics and Environmental Risk of Heavy Metals in Typical Gold Mining Area of Shandong Province. Huan Jing Ke Xue 2016, 37, 3144–3150. [Google Scholar]
  13. Adhikary, P.P.; Dash, C.J.; Bej, R.; Chandrasekharan, H. Indicator and probability kriging methods for delineating Cu, Fe, and Mn contamination in groundwater of Najafgarh Block, Delhi, India. Environ. Monit. Assess. 2010, 176, 663–676. [Google Scholar] [CrossRef]
  14. Hossain, M.; Patra, P.K. Contamination zoning and health risk assessment of trace elements in groundwater through geostatistical modelling. Ecotoxicol. Environ. Saf. 2020, 189, 110038. [Google Scholar] [CrossRef]
  15. Meirvenne, M.V.; Goovaerts, P. Evaluating the probability of exceeding a site-specific soil cadmium contamination thresh-old. Geoderma 2001, 102, 75–100. [Google Scholar] [CrossRef]
  16. Brus, D.J.; De Gruijter, J.J.; Walvoort, D.J.J.; De Vries, F.; Bronswijk, J.J.B.; Römkens, P.F.A.M. Mapping the Probability of Exceeding Critical Thresholds for Cadmium Concentrations in Soils in the Netherlands. J. Environ. Qual. 2002, 31, 1875–1884. [Google Scholar] [CrossRef]
  17. Liu, Y.; Ma, Z.; Lv, J.; Bi, J. Identifying sources and hazardous risks of heavy metals in topsoils of rapidly urbanizing East China. J. Geogr. Sci. 2016, 26, 735–749. [Google Scholar] [CrossRef] [Green Version]
  18. Ord, J.K.; Getis, A. Local Spatial Autocorrelation Statistics: Distributional Issues and an Application. Geogr. Anal. 1995, 27, 286–306. [Google Scholar] [CrossRef]
  19. Hu, B.; Shao, S.; Fu, Z.; Li, Y.; Ni, H.; Chen, S.; Zhou, Y.; Jin, B.; Shi, Z. Identifying heavy metal pollution hot spots in soil-rice systems: A case study in South of Yangtze River Delta, China. Sci. Total Environ. 2019, 658, 614–625. [Google Scholar] [CrossRef] [PubMed]
  20. Kowalska, J.B.; Mazurek, R.; Gasiorek, M.; Setlak, M.; Zaleski, T.; Waroszewski, J. Soil pollution indices conditioned by me-dieval metallurgical activity—A case study from Krakow (Poland). Environ. Pollut. 2016, 218, 1023–1036. [Google Scholar] [CrossRef]
  21. Huang, Y.; Chen, Q.; Deng, M.; Japenga, J.; Li, T.; Yang, X.; He, Z. Heavy metal pollution and health risk assessment of agricultural soils in a typical peri-urban area in southeast China. J. Environ. Manag. 2018, 207, 159–168. [Google Scholar] [CrossRef]
  22. Doabi, S.A.; Karami, M.; Afyuni, M.; Yeganeh, M. Pollution and health risk assessment of heavy metals in agricultural soil, atmospheric dust and major food crops in Kermanshah province, Iran. Ecotoxicol. Environ. Saf. 2018, 163, 153–164. [Google Scholar] [CrossRef]
  23. Varol, M. Assessment of heavy metal contamination in sediments of the Tigris River (Turkey) using pollution indices and multivariate statistical techniques. J. Hazard. Mater. 2011, 195, 355–364. [Google Scholar] [CrossRef]
  24. Mazurek, R.; Kowalska, J.; Gąsiorek, M.; Zadrożny, P.; Józefowska, A.; Zaleski, T.; Kępka, W.; Tymczuk, M.; Orłowska, K. Assessment of heavy metals contamination in surface layers of Roztocze National Park forest soils (SE Poland) by indices of pollution. Chemosphere 2017, 168, 839–850. [Google Scholar] [CrossRef]
  25. Alonso, D.L.; Pérez, R.; Okio, C.K.; Castillo, E. Assessment of mining activity on arsenic contamination in surface water and sediments in southwestern area of Santurbán paramo, Colombia. J. Environ. Manag. 2020, 264, 110478. [Google Scholar] [CrossRef]
  26. Liu, S.; Zhao, H.; Wu, K.; Zhang, Z.; Hou, Y.; Chen, T.; Jin, Q. Evaluation of heavy metal distribution characteristics of agricultural soil–rice system in a high geological background area according to the influence index of comprehensive quality (IICQ). Environ. Sci. Pollut. Res. 2020, 27, 20920–20933. [Google Scholar] [CrossRef]
  27. Bartholomew, C.J.; Li, N.; Li, Y.; Dai, W.; Nibagwire, D.; Guo, T. Characteristics and health risk assessment of heavy metals in street dust for children in Jinhua, China. Environ. Sci. Pollut. Res. 2020, 27, 5042–5055. [Google Scholar] [CrossRef]
  28. Xie, X.; Wu, T.; Zhu, M.; Jiang, G.; Xu, Y.; Wang, X.; Pu, L. Comparison of random forest and multiple linear regression models for estimation of soil extracellular enzyme activities in agricultural reclaimed coastal saline land. Ecol. Indic. 2021, 120, 106925. [Google Scholar] [CrossRef]
  29. Tang, H.; Ke, Z.; Yan, M.; Wang, W.; Nie, H.; Li, B.; Zhang, J.; Xu, X.; Wang, J. Concentrations, Distribution, and Ecological Risk Assessment of Heavy Metals in Daya Bay, China. Water 2018, 10, 780. [Google Scholar] [CrossRef] [Green Version]
  30. Ćujić, M.; Dragović, S.; Đorđević, M.; Dragović, R.; Gajić, B. Reprint of ”Environmental assessment of heavy metals around the largest coal fired power plant in Serbia”. Catena 2017, 148, 26–34. [Google Scholar] [CrossRef]
  31. Goovaerts, P.; Webster, R.; Dubois, J.P. Assessing the risk of soil contamination in the Swiss Jura using indicator geostatistics. Environ. Ecol. Stat. 1997, 4, 31–48. [Google Scholar] [CrossRef]
  32. Parchomenko, A.; Borsky, S. Identifying phosphorus hot spots: A spatial analysis of the phosphorus balance as a result of manure application. J. Environ. Manag. 2018, 214, 137–148. [Google Scholar] [CrossRef] [Green Version]
  33. Getis, A.; Ord, J.K. The Analysis of Spatial Association by Use of Distance Statistics. Geogr. Anal. 2010, 24, 189–206. [Google Scholar] [CrossRef]
  34. Anselin, L. Local Indicators of Spatial Association-LISA. Geogr. Anal. 1995, 27, 93–115. [Google Scholar] [CrossRef]
  35. Ministry of Environmental Protection (MEP); Ministry of Land and Resources (MLR). The National Soil Pollution Condition Investigation Report [EB/OL]. 2014. Available online: http://www.gov.cn/foot/site1/20140417/782bcb88840814ba158d01.pdf (accessed on 16 December 2020).
  36. Slessarev, E.W.; Lin, Y.; Bingham, N.L.; Johnson, J.E.; Dai, Y.; Schimel, J.P.; Chadwick, O.A. Water balance creates a threshold in soil pH at the global scale. Nat. Cell Biol. 2016, 540, 567–569. [Google Scholar] [CrossRef]
  37. Guo, J.H.; Liu, X.J.; Zhang, Y.; Shen, J.L.; Han, W.X.; Zhang, W.F.; Christie, P.; Goulding, K.W.T.; Vitousek, P.M.; Zhang, F. Significant Acidification in Major Chinese Croplands. Science 2010, 327, 1008–1010. [Google Scholar] [CrossRef] [Green Version]
  38. Ministry of Ecology and Environment (MEE). Soil Environmental Quality Risk Control Standard for Soil Contamination of Agricultural Land (GB15618–2018). 2018. Available online: http://www.mee.gov.cn/ywgz/fgbz/bz/bzwb/trhj/201807/W020190626595212456114.pdf (accessed on 16 December 2020).
  39. Sun, C.; Liu, J.; Wang, Y.; Sun, L.; Yu, H. Multivariate and geostatistical analyses of the spatial distribution and sources of heavy metals in agricultural soil in Dehui, Northeast China. Chemosphere 2013, 92, 517–523. [Google Scholar] [CrossRef] [PubMed]
  40. Wang, S.; Cai, L.-M.; Wen, H.-H.; Luo, J.; Wang, Q.-S.; Liu, X. Spatial distribution and source apportionment of heavy metals in soil from a typical county-level city of Guangdong Province, China. Sci. Total Environ. 2019, 655, 92–101. [Google Scholar] [CrossRef]
  41. Wang, Q.H.; Dong, Y.X.; Zheng, W.; Zhou, G.H. Soil geochemical baseline values and environmental background values in Zhejiang, China. Geol. Bull. China 2007, 26, 590–597. (In Chinese) [Google Scholar]
  42. Zhang, Y.Y.; Ma, J.; Wei, H.Y.; Shi, T.R. Heavy metals in typical farmland soils of Zhejiang Province: Levels, sources and ecological risks. Ecol. Environ. Sci. 2019, 28, 1233–1241. (In Chinese) [Google Scholar]
  43. Heuvelink, G.; Webster, R. Modelling soil variation: Past, present, and future. Geoderma 2001, 100, 269–301. [Google Scholar] [CrossRef]
  44. Yang, P.; Mao, R.; Shao, H.; Gao, Y. An investigation on the distribution of eight hazardous heavy metals in the suburban farmland of China. J. Hazard. Mater. 2009, 167, 1246–1251. [Google Scholar] [CrossRef] [PubMed]
  45. El Sebai, T.; Lagacherie, B.; Soulas, G.; Martin-Laurent, F. Spatial variability of isoproturon mineralizing activity within an agricultural field: Geostatistical analysis of simple physicochemical and microbiological soil parameters. Environ. Pollut. 2007, 145, 680–690. [Google Scholar] [CrossRef]
  46. Kelepertzis, E. Accumulation of heavy metals in agricultural soils of Mediterranean: Insights from Argolida basin, Peloponnese, Greece. Geoderma 2014, 221–222, 82–90. [Google Scholar] [CrossRef]
  47. Jiao, W.; Chen, W.; Chang, A.C.; Page, A.L. Environmental risks of trace elements associated with long-term phosphate fertilizers applications: A review. Environ. Pollut. 2012, 168, 44–53. [Google Scholar] [CrossRef]
  48. Biasioli, M.; Barberis, R.; Ajmone-Marsan, F. The influence of a large city on some soil properties and metals concentration. Sci. Total Environ. 2006, 356, 154–164. [Google Scholar] [CrossRef] [PubMed]
  49. Luo, L.; Ma, Y.; Zhang, S.; Wei, D.; Zhu, Y.-G. An inventory of trace element inputs to agricultural soils in China. J. Environ. Manag. 2009, 90, 2524–2530. [Google Scholar] [CrossRef]
  50. Yan, X.; Zhao, W.; Yang, X.; Liu, C.; Zhou, Y. Input–output balance of cadmium in typical agriculture soils with historical sewage irrigation in China. J. Environ. Manag. 2020, 276, 111298. [Google Scholar] [CrossRef]
  51. Liu, S.J.; Wang, X.D.; Guo, G.L.; Yan, Z.G. Status and environmental management of soil mercury pollution in China: A review. J. Environ. Manag. 2021, 277, 111442. [Google Scholar] [CrossRef] [PubMed]
  52. Facchinelli, A.; Sacchi, E.; Mallen, L. Multivariate statistical and GIS-based approach to identify heavy metal sources in soils. Environ. Pollut. 2001, 114, 313–324. [Google Scholar] [CrossRef]
  53. Wei, B.; Yang, L. A review of heavy metal contaminations in urban soils, urban road dusts and agricultural soils from China. Microchem. J. 2010, 94, 99–107. [Google Scholar] [CrossRef]
  54. Huo, X.-N.; Zhang, W.-W.; Sun, D.-F.; Li, H.; Zhou, L.-D.; Li, B.-G. Spatial Pattern Analysis of Heavy Metals in Beijing Agricultural Soils Based on Spatial Autocorrelation Statistics. Int. J. Environ. Res. Public Health 2011, 8, 2074–2089. [Google Scholar] [CrossRef] [Green Version]
  55. Lin, Y.-P.; Chu, H.-J.; Wu, C.-F.; Chang, T.-K.; Chen, C.-Y. Hotspot Analysis of Spatial Environmental Pollutants Using Kernel Density Estimation and Geostatistical Techniques. Int. J. Environ. Res. Public Health 2010, 8, 75–88. [Google Scholar] [CrossRef] [PubMed]
  56. Yu, T.; Hou, W.L.; Hou, Q.Y.; Ma, W.J.; Xia, X.Q.; Li, Y.T.; Yan, B.Z.; Yang, Z.F. Safe utilization and zoning on natural selenium-rich land resources: A case study of the typical area in Enshi County, China. Environ. Geochem. Health 2020, 42, 2803–2818. [Google Scholar] [CrossRef] [PubMed]
  57. Wei, H.B.; Luo, M.J.; Zheng, S.; Wu, K.N. Risk zoning and governance of heavy metal pollution in agricultural land. Chin. J. Agric. Resour. Reg. Plan. 2018, 39, 82–87. (In Chinese) [Google Scholar]
Figure 1. Schematic diagram of the study area and soil sampling sites. I: Wucheng District; II: Jindong District; III: Wuyi County; IV: Pujiang County; V: Pan’an County; VI: Lanxi City; VII: Yiwu City; VIII: Dongyang City; IX: Yongkang City.
Land 10 00569 g001
Figure 2. Spatial distribution of soil heavy metal concentrations of farmland area in Jinhua City. I: Wucheng District; II: Jindong District; III: Wuyi County; IV: Pujiang County; V: Pan’an County; VI: Lanxi City; VII: Yiwu City; VIII: Dongyang City; IX: Yongkang City.
Land 10 00569 g002
Figure 3. Distribution of hot spots and environmental risk probabilities of soil heavy metals of farmland area in Jinhua City. Hot/Cold spot—99% confidence: significant statistical hot/cold spots with 99% confidence; Hot/Cold spot—95% confidence: significant statistical hot/cold spots with 95% confidence; Hot/Cold spot—90% confidence: significant statistical hot/cold spots with 90% confidence; I: Wucheng District; II: Jindong District; III: Wuyi County; IV: Pujiang County; V: Pan’an County; VI: Lanxi City; VII: Yiwu City; VIII: Dongyang City; IX: Yongkang City.
Land 10 00569 g003
Figure 4. Safe utilization zoning of soil heavy metals in farmland area of Jinhua City. I: Wucheng District; II: Jindong District; III: Wuyi County; IV: Pujiang County; V: Pan’an County; VI: Lanxi City; VII: Yiwu City; VIII: Dongyang City; IX: Yongkang City.
Land 10 00569 g004
Table 1. Classification of soil environmental quality and safe utilization.
Division BasisSoil Pollution LevelSafe Utilization Zoning
IICQs ≤ 1CleanSafe utilization zone
1 < IICQs ≤ 2Slightly exceededBasic safe utilization zone
2 < IICQs ≤ 3Moderately exceededLow-risk monitoring zone
3 < IICQs ≤ 5Highly exceededMedium-risk warning zone
IICQs > 5Severely exceededHigh-risk restricted zone
Table 2. Descriptive statistics of soil heavy metals of farmland areas in Jinhua City.
AsCdCrCuHgPbNiZnpH
Mean (mg kg−1)6.370.1836.7318.600.1132.4811.9576.055.34
SD3.670.1026.4910.470.168.3111.7826.150.78
CV (%)57.5653.0772.1256.29152.2425.5998.5534.3915.00
Kurtosis5.445.2020.9216.21125.971.8057.567.032.71
Skewness1.891.733.842.9410.231.006.542.051.47
JBV (mg kg−1)6.490.1939.0718.080.1035.1212.4572.13
ZBV (mg kg−1)9.200.0752.9017.600.0923.7024.6070.60
RSV (mg kg−1)30.000.30150.0050.000.5070.0060.00200.00
SD, standard deviation; CV, coefficient of variation; JBV, soil background value of Jinqu Basin [41]; ZBV, soil background value of Zhejiang Province [42]; RSV, risk screening values for soil contamination of agricultural land of China (GB 15618–2018) (pH < 5.5) [38].
Table 3. Parameters of the semi-variogram models for heavy metals in farmland soil.
ElementModelC0C0 + CC/(C0 + C)Range (m)R2RSS
Asexponential0.1220.2890.57638,7000.8601.88 × 10−3
Cdexponential0.0370.2940.87489000.5395.82 × 10−4
Crexponential0.1470.2960.50232,4000.6233.40 × 10−3
Cuexponential0.1230.2520.50231,2000.5803.13 × 10−3
Hgexponential0.0340.4220.91984000.5281.53 × 10−3
Niexponential0.1910.3840.50177,1000.8195.15 × 10−3
Pbexponential0.0050.0640.92612,6000.6607.63 × 10−5
Znexponential0.0090.0910.90411,7000.8037.05 × 10−5
C0, Nugget; C0 + C, Sill; RSS, Residual sum of squares.
Table 4. Area statistics of each utilization area of farmland soil of Jinhua City.
GradeArea (km2)Proportion (%)
Safe utilization zone2144.4789.35
Basic safe utilization zone206.088.58
Low-risk monitoring zone33.741.41
Medium-risk warning zone14.590.61
High-risk restricted zone1.120.05
Total2400.00100
Publisher’s Note: MDPI stays neutral with regard to jurisdictional claims in published maps and institutional affiliations.

