
Exploring the Ecological Climate Effects of Different Land Use Changes in the Yangtze River Basin from 2000 to 2020

 and
and 
Abstract
:1. Introduction
2. Materials and Methods
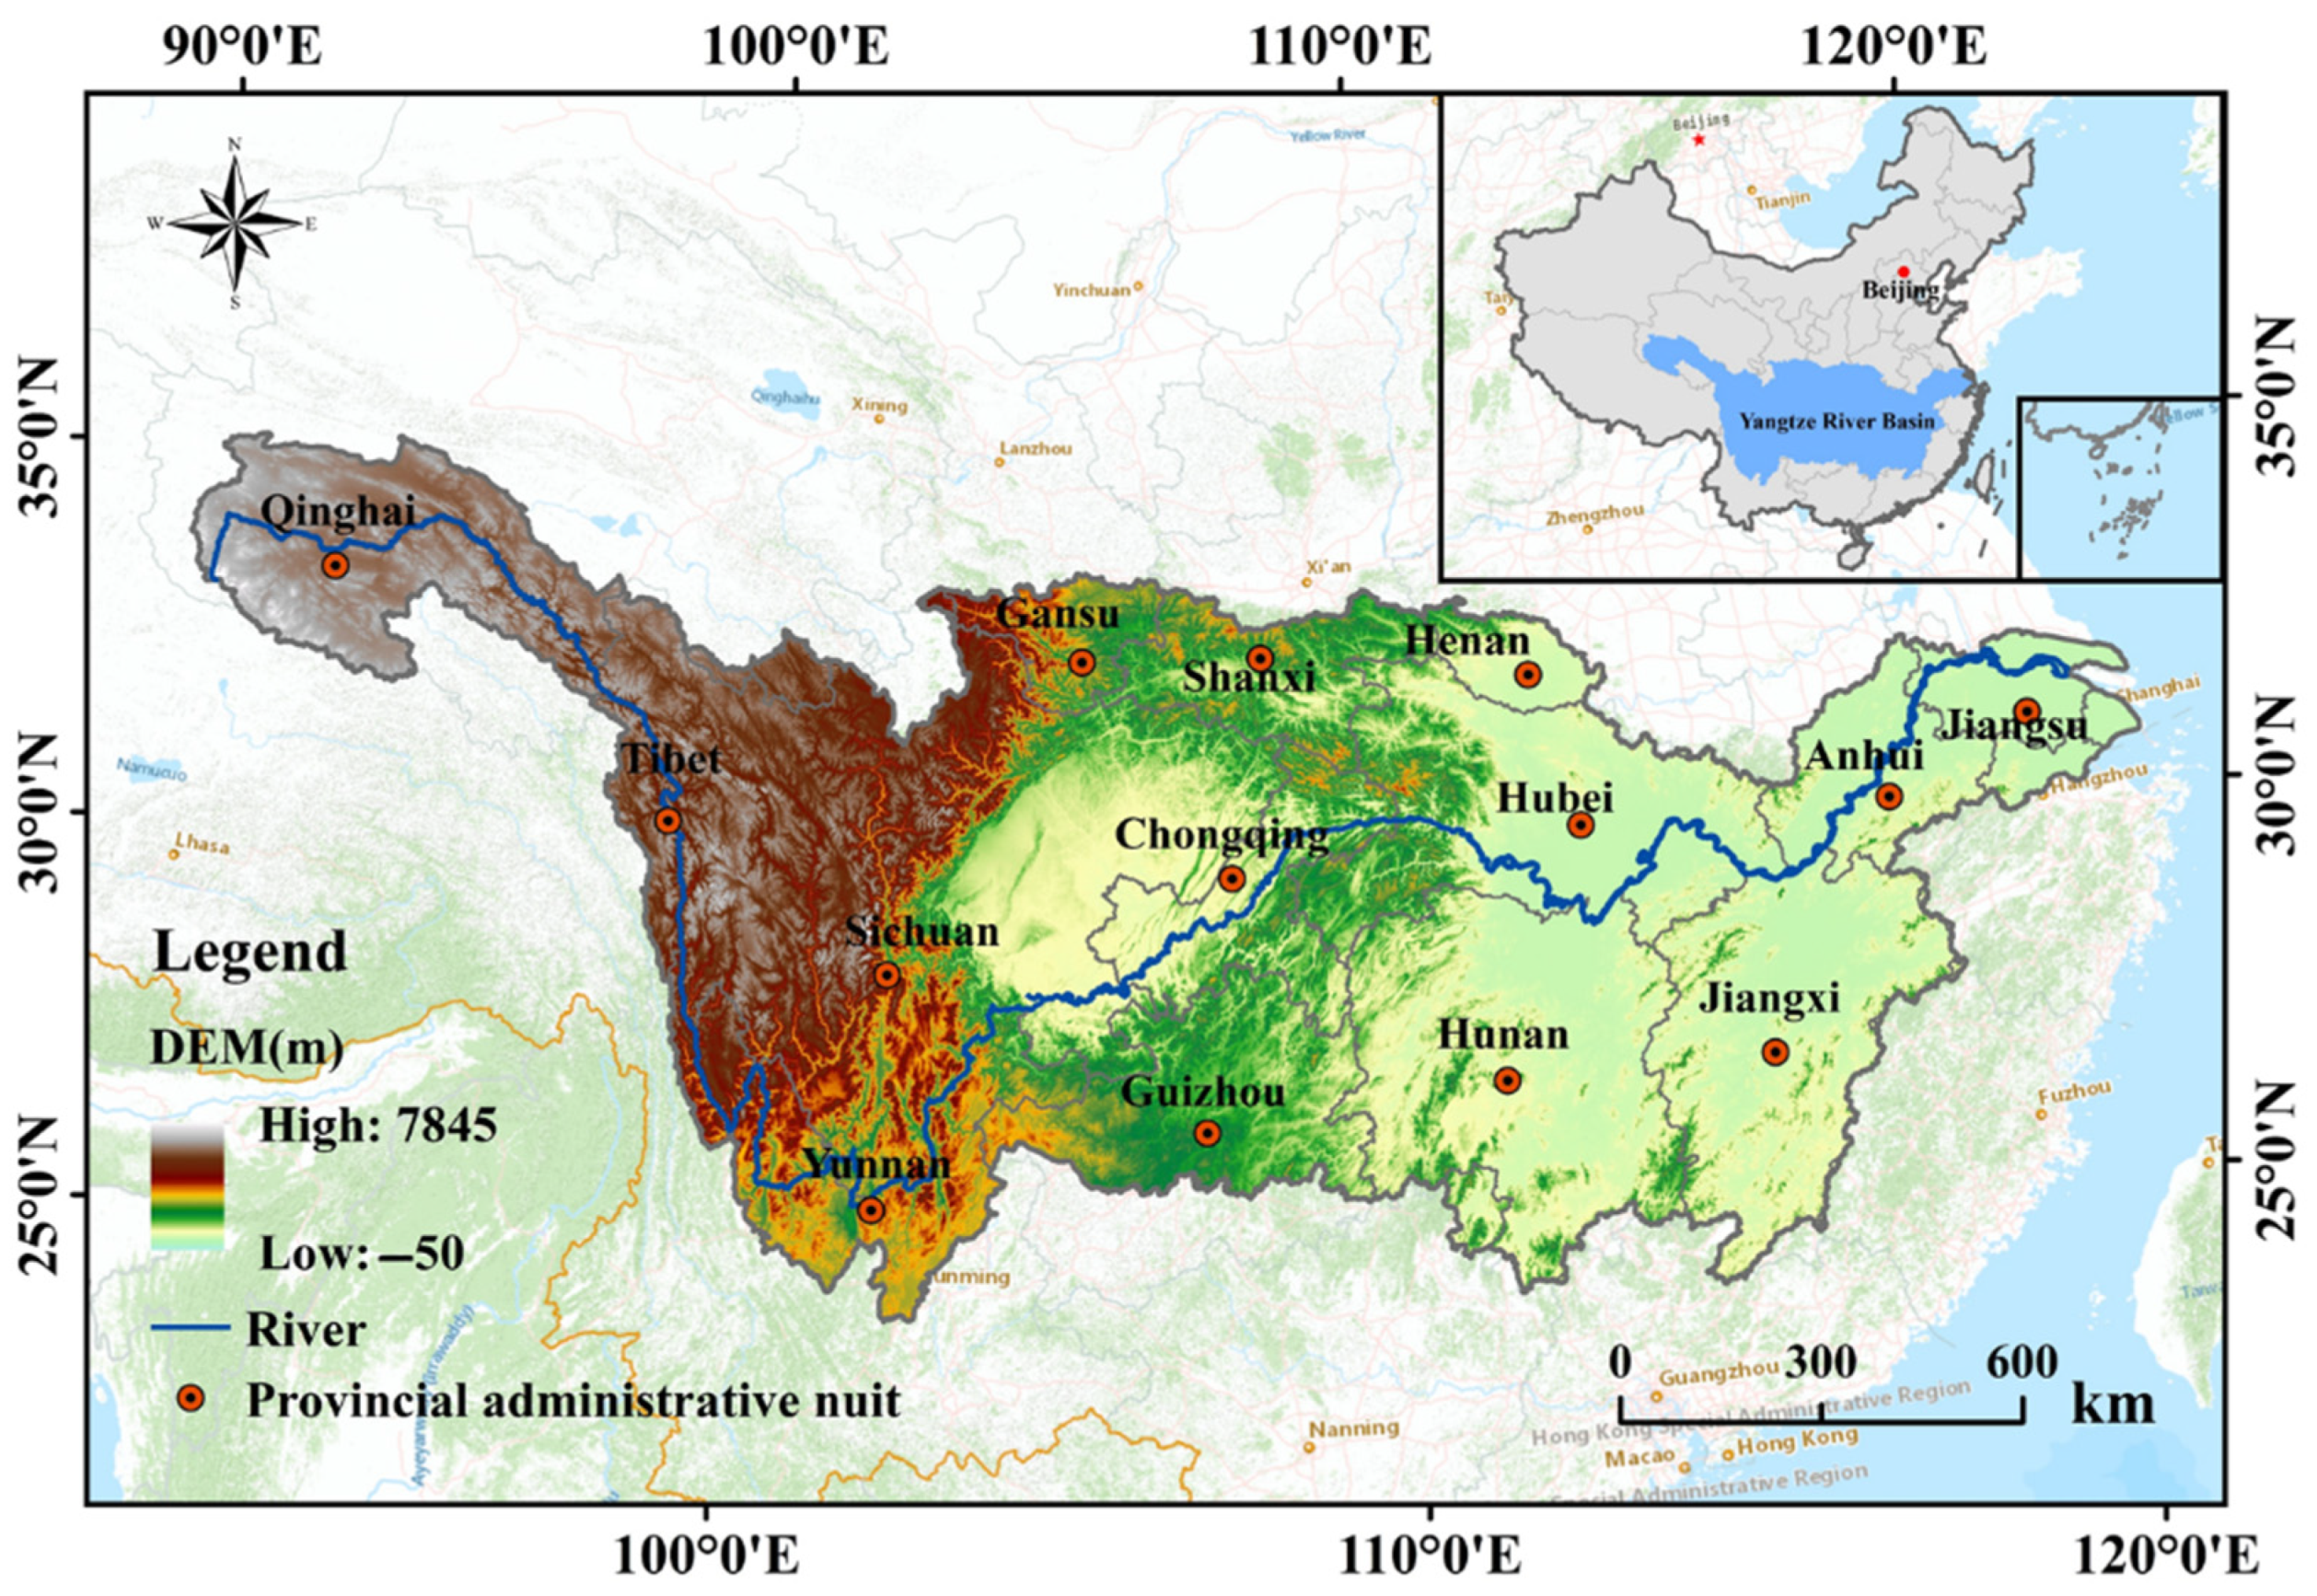
2.1. Study Area
2.2. Data Resource
2.3. Research Methodology
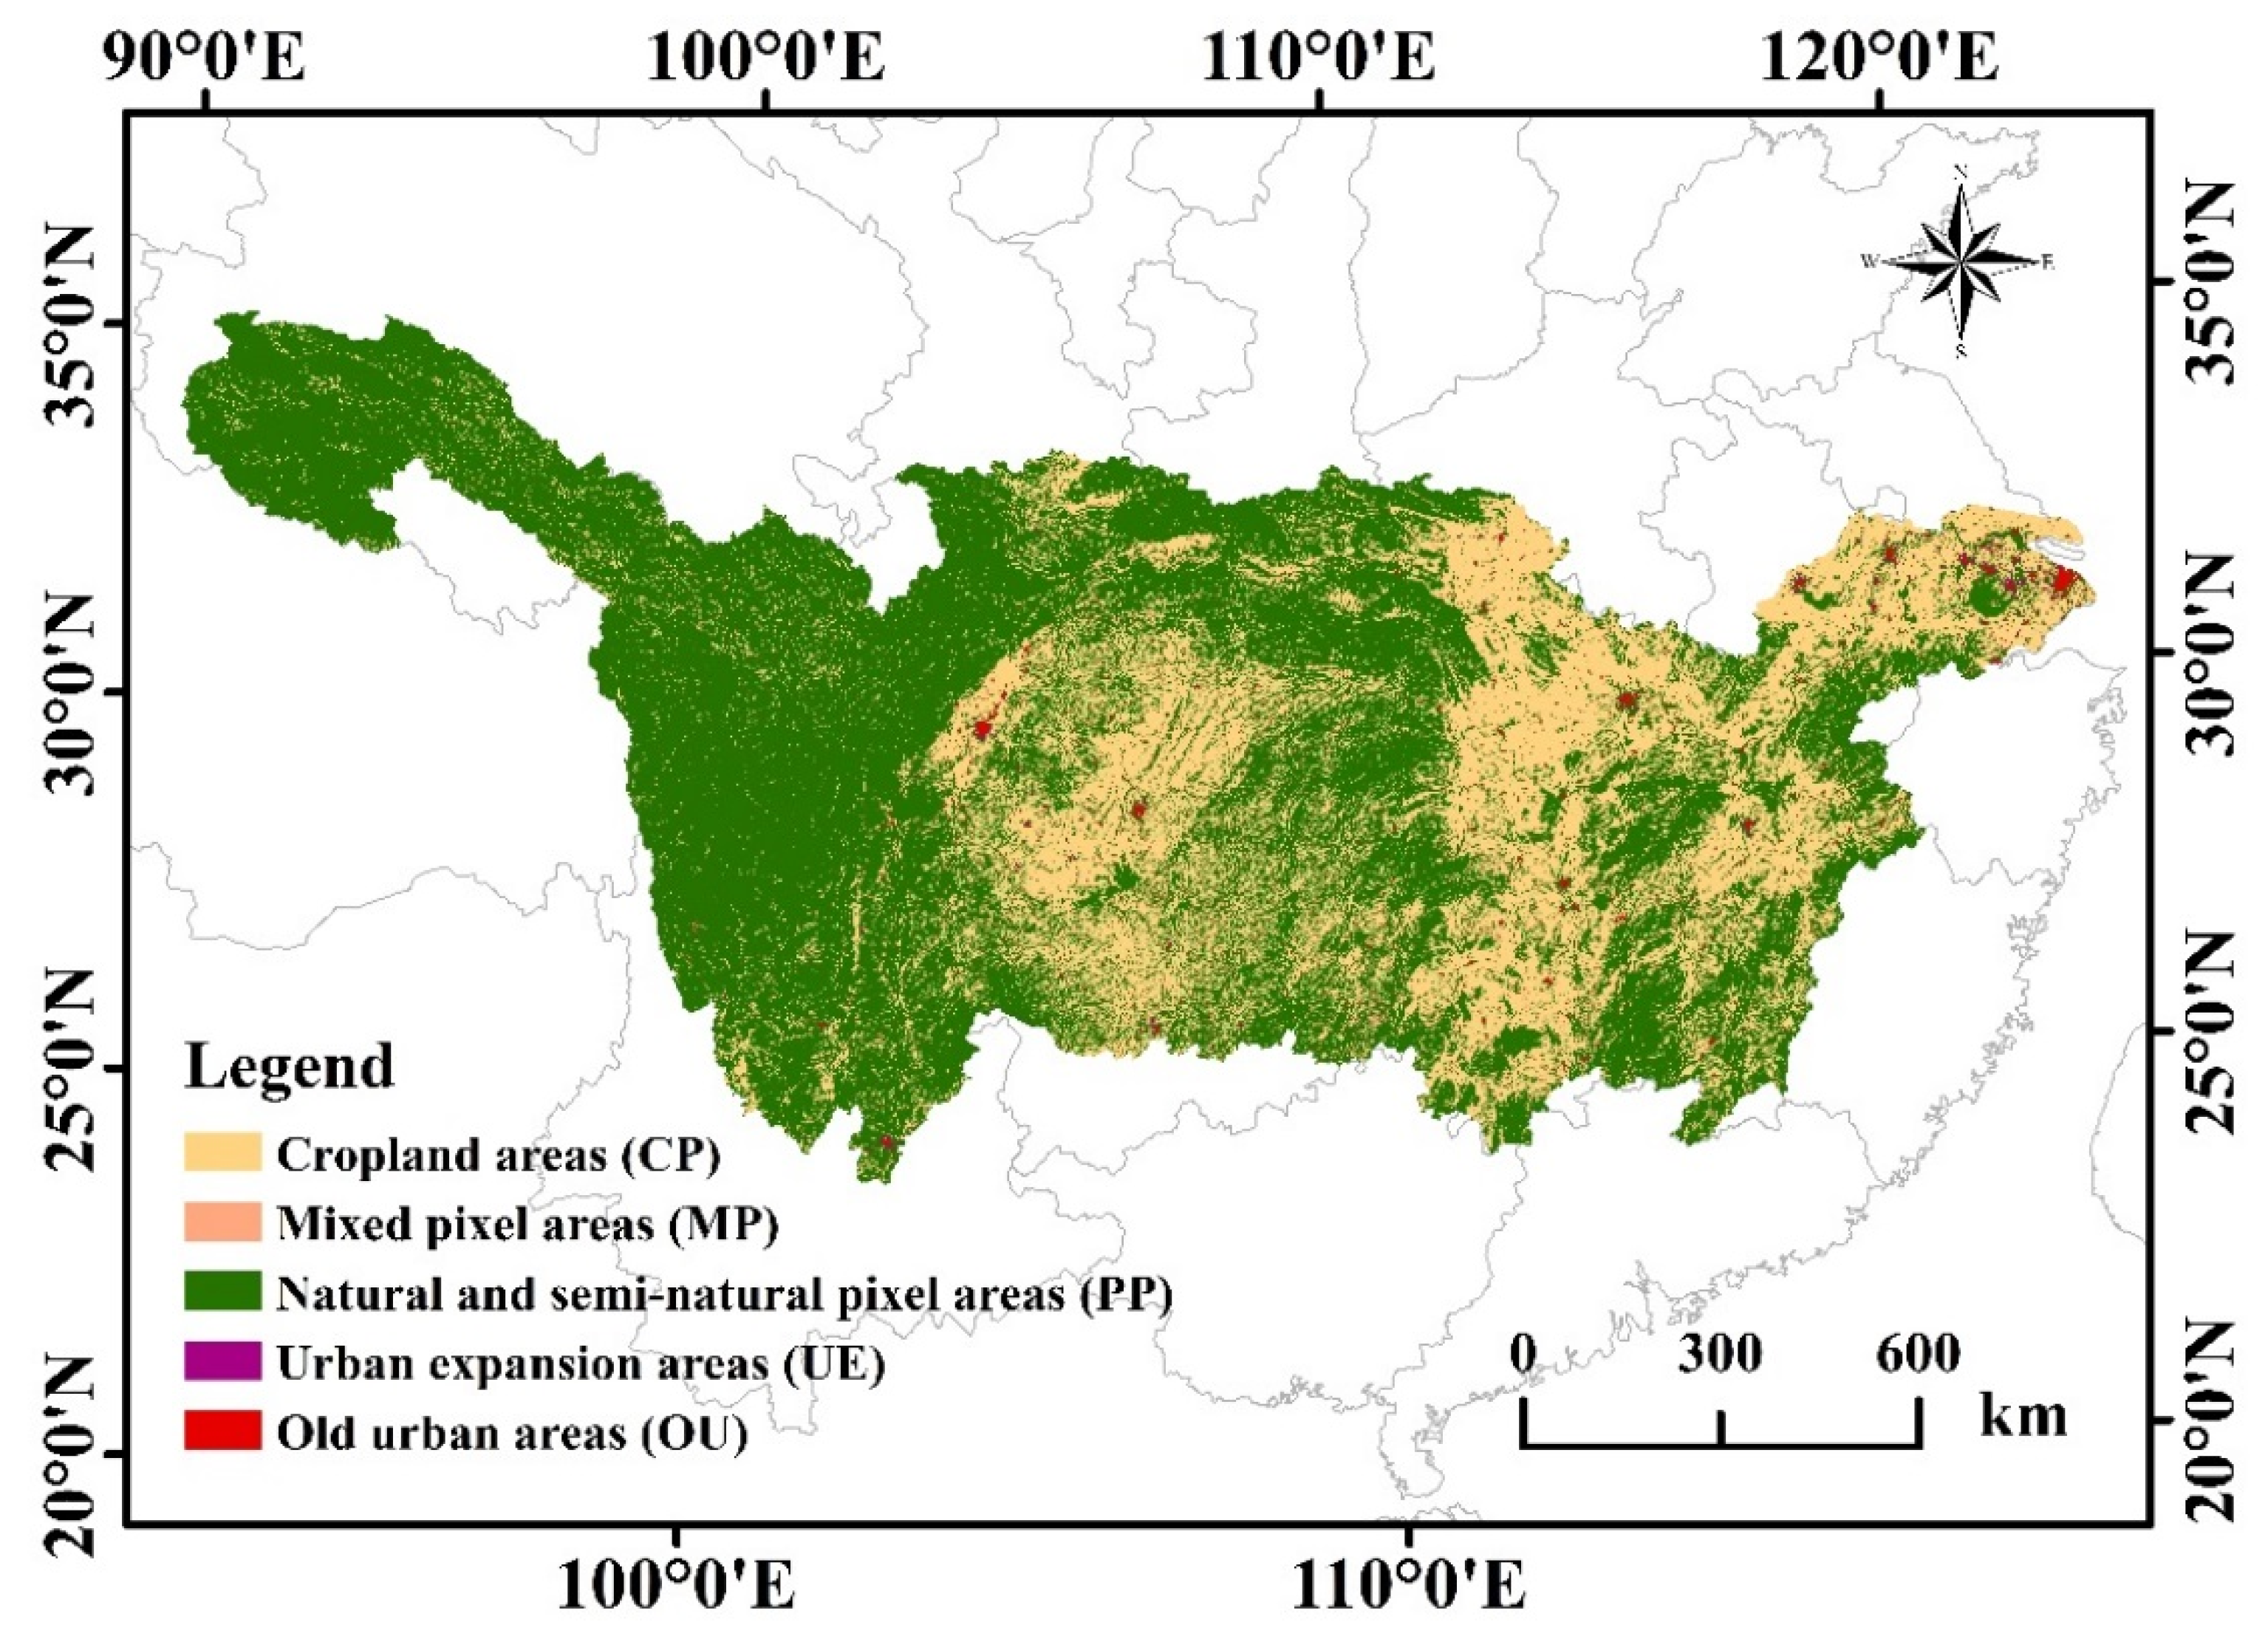
2.3.1. Land Use Reclassification
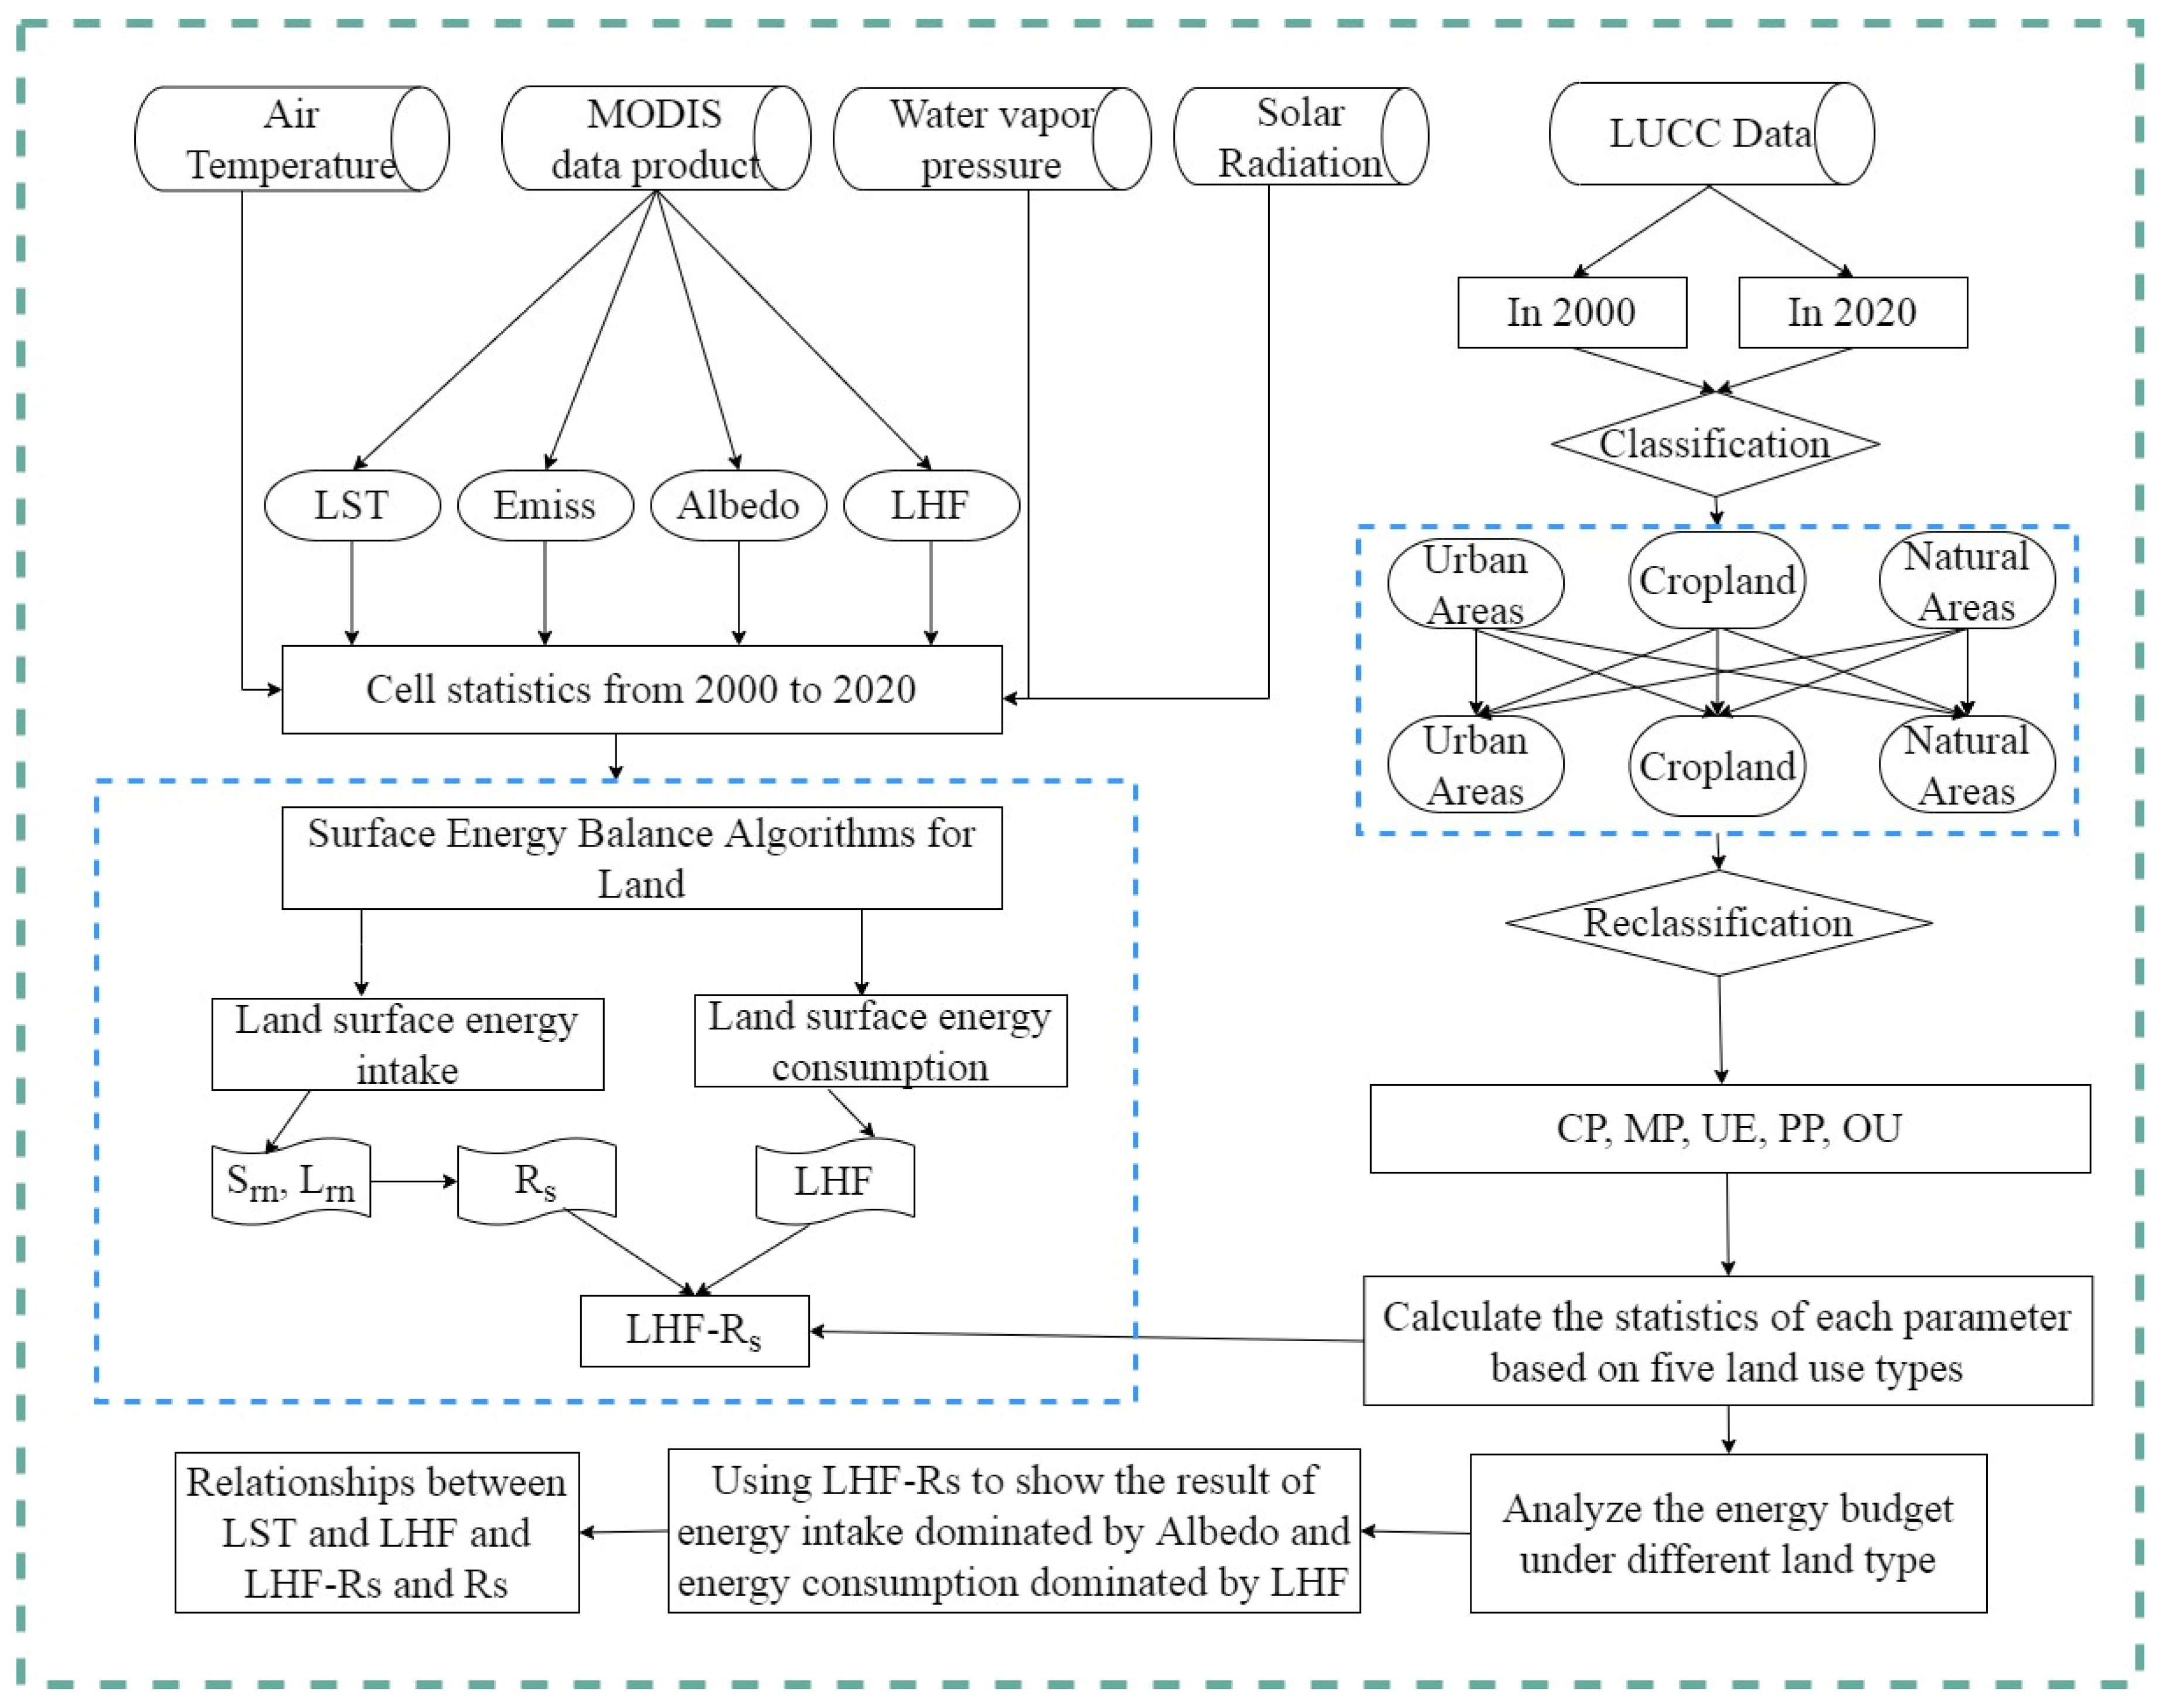
2.3.2. Calculation of Surface Energy Balance and Research Framework
3. Results
3.1. Changes of Surface Energy Intake
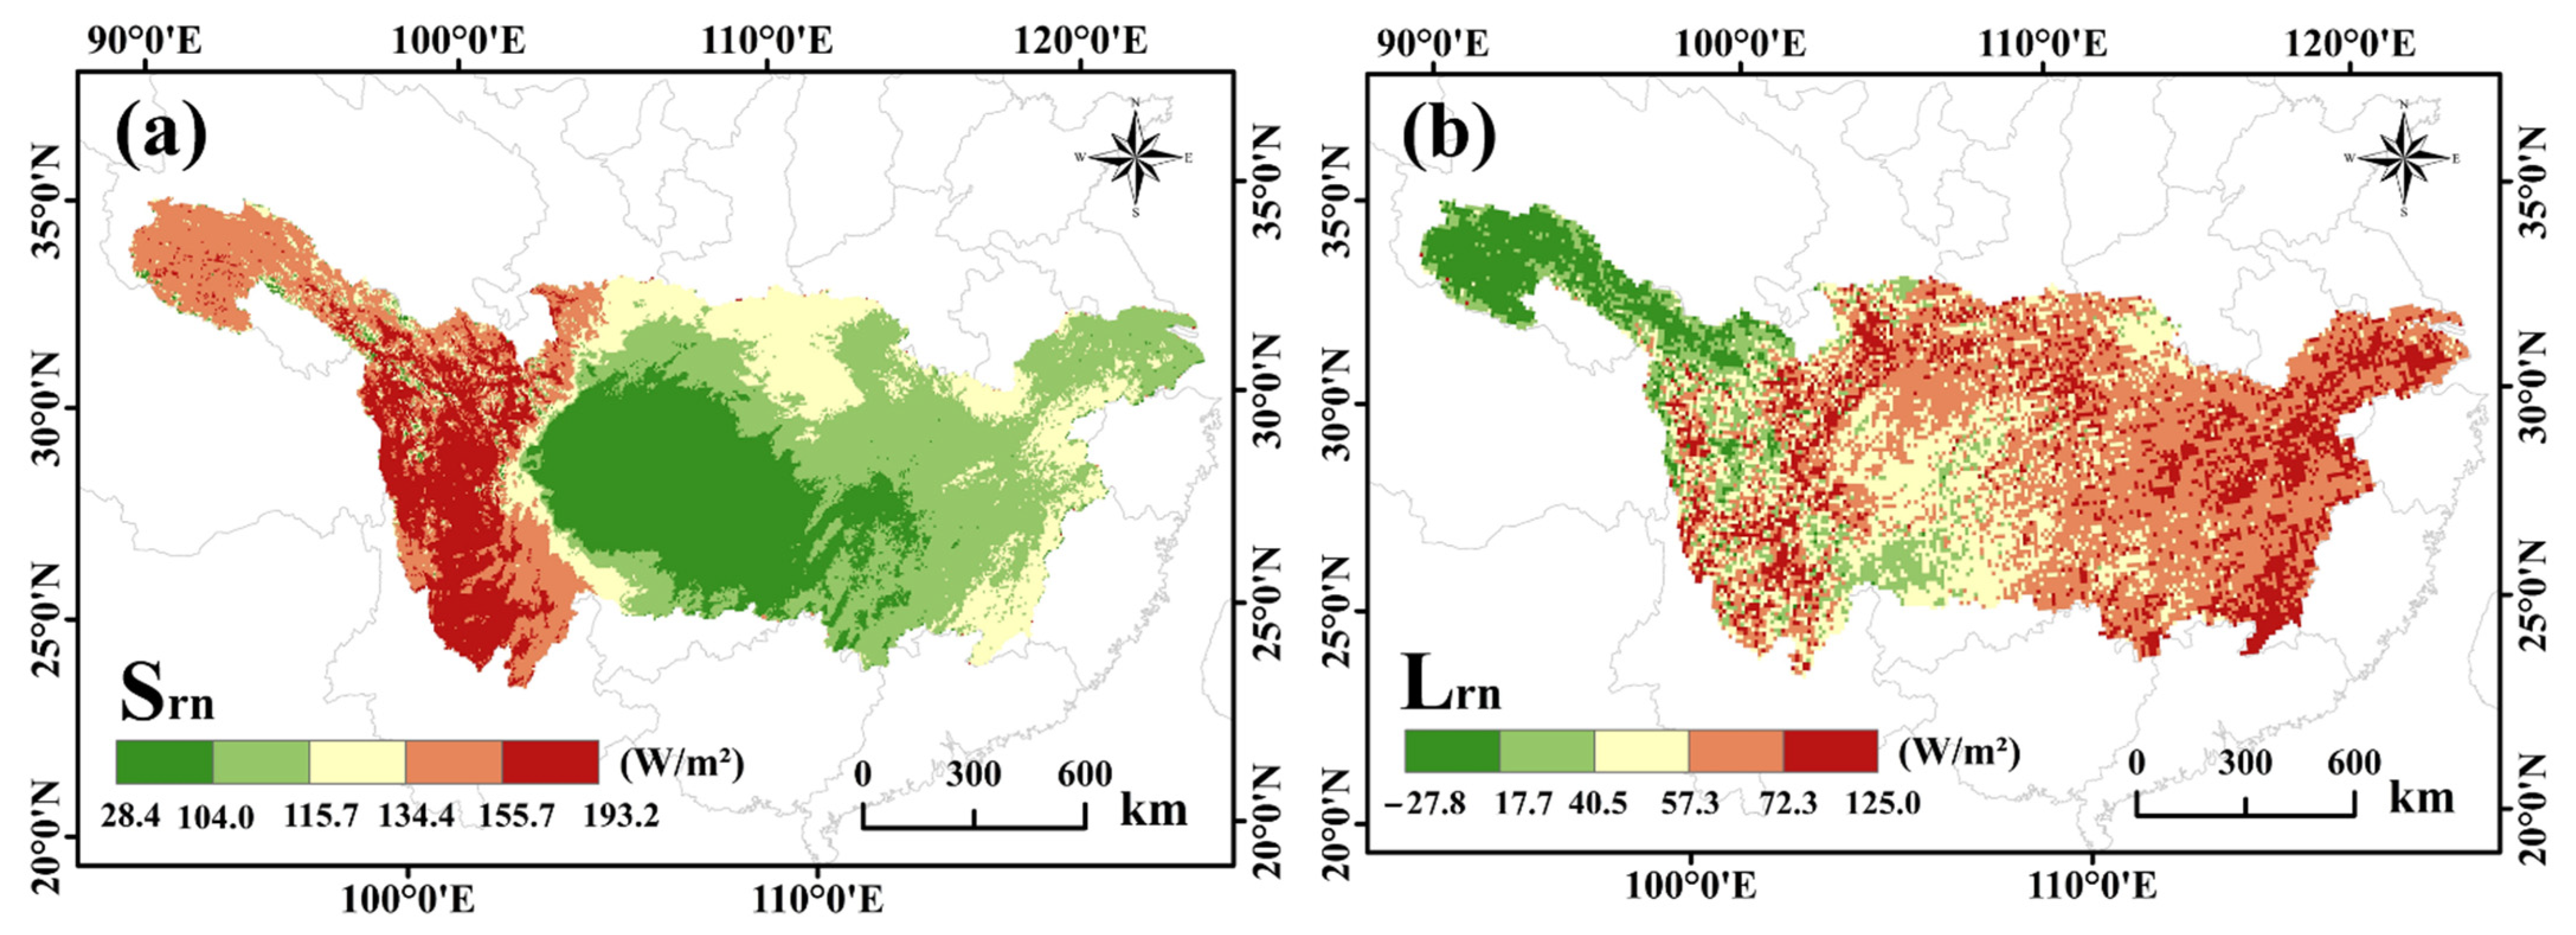
3.1.1. Net Short-Wave and Long-Wave Radiation
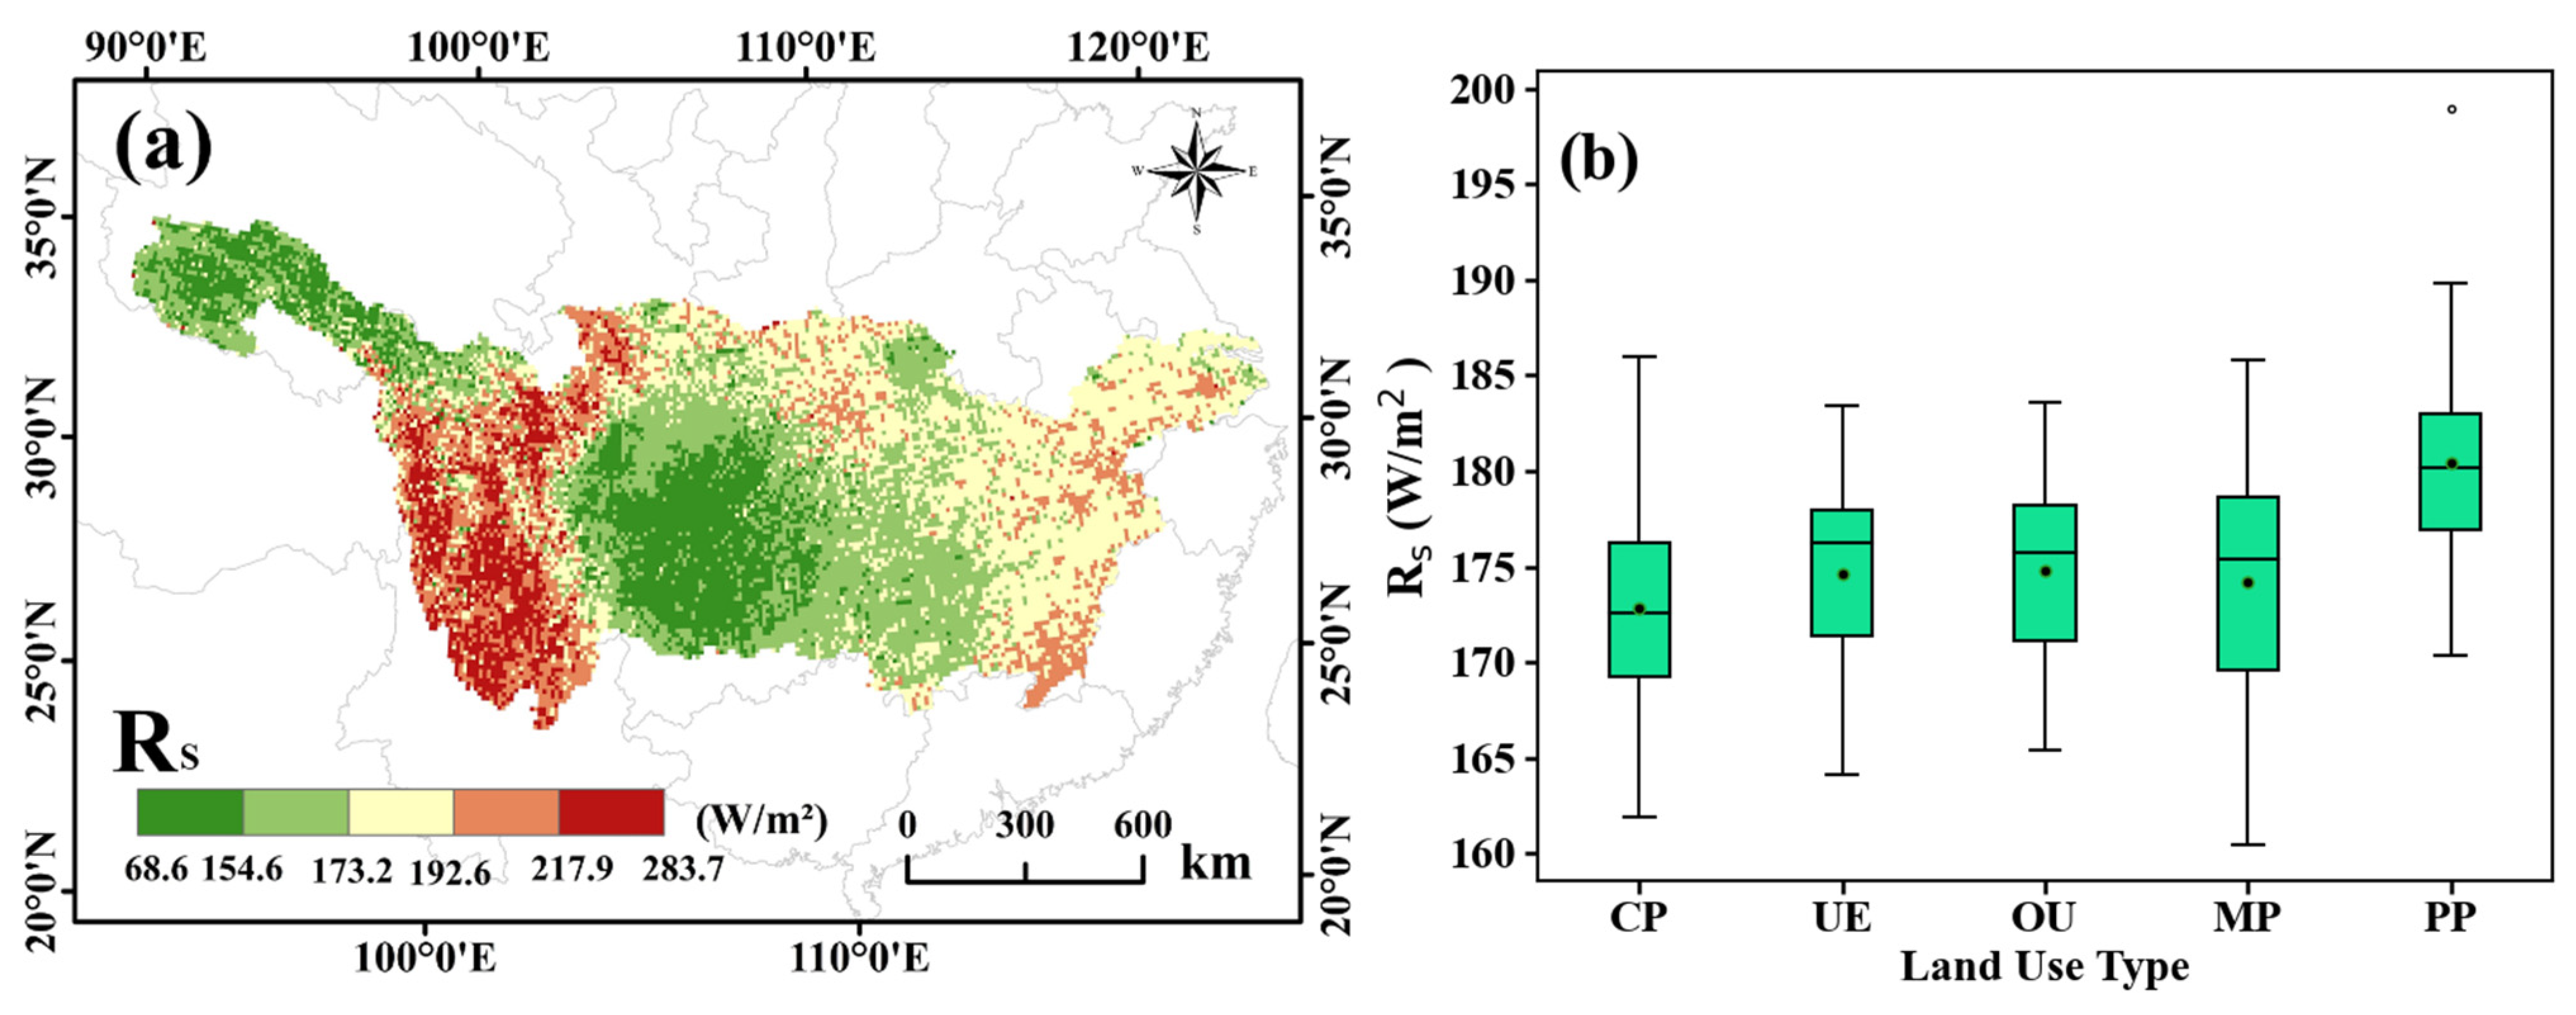
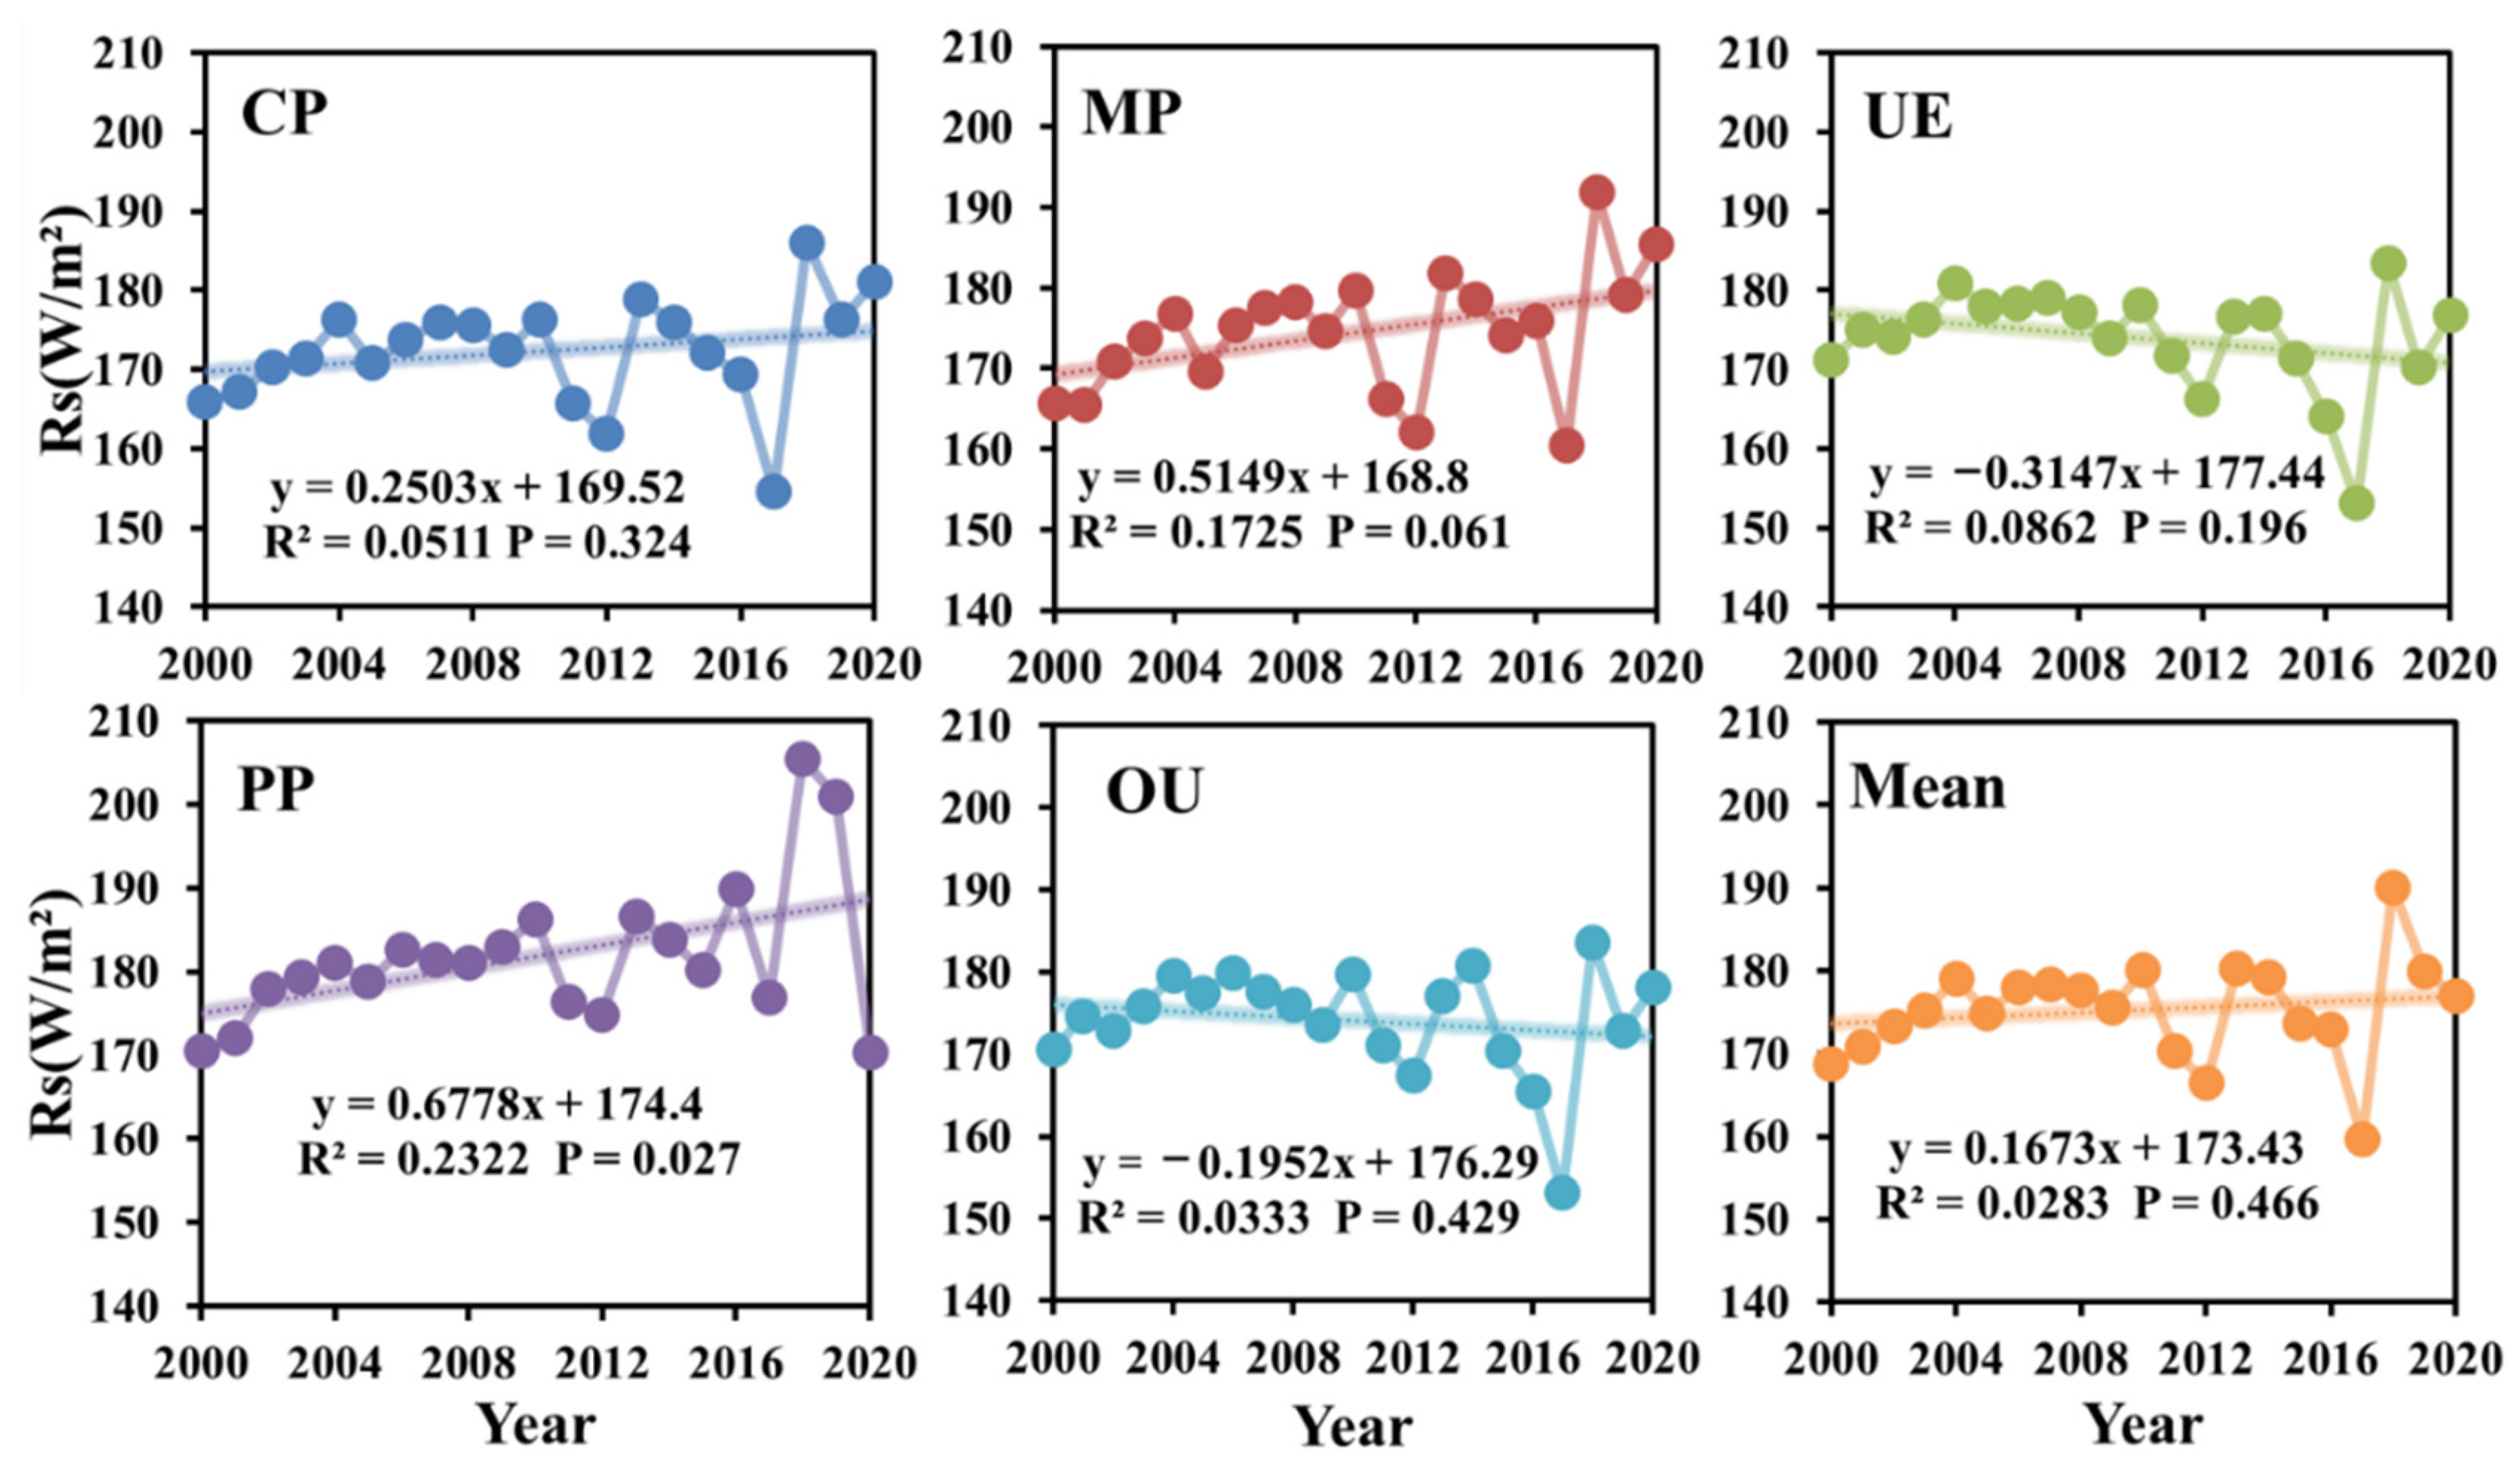
3.1.2. Changes of Surface Net Solar Radiation
3.2. Analysis of Surface Energy Balance
3.2.1. Changes in Surface Energy Consumption
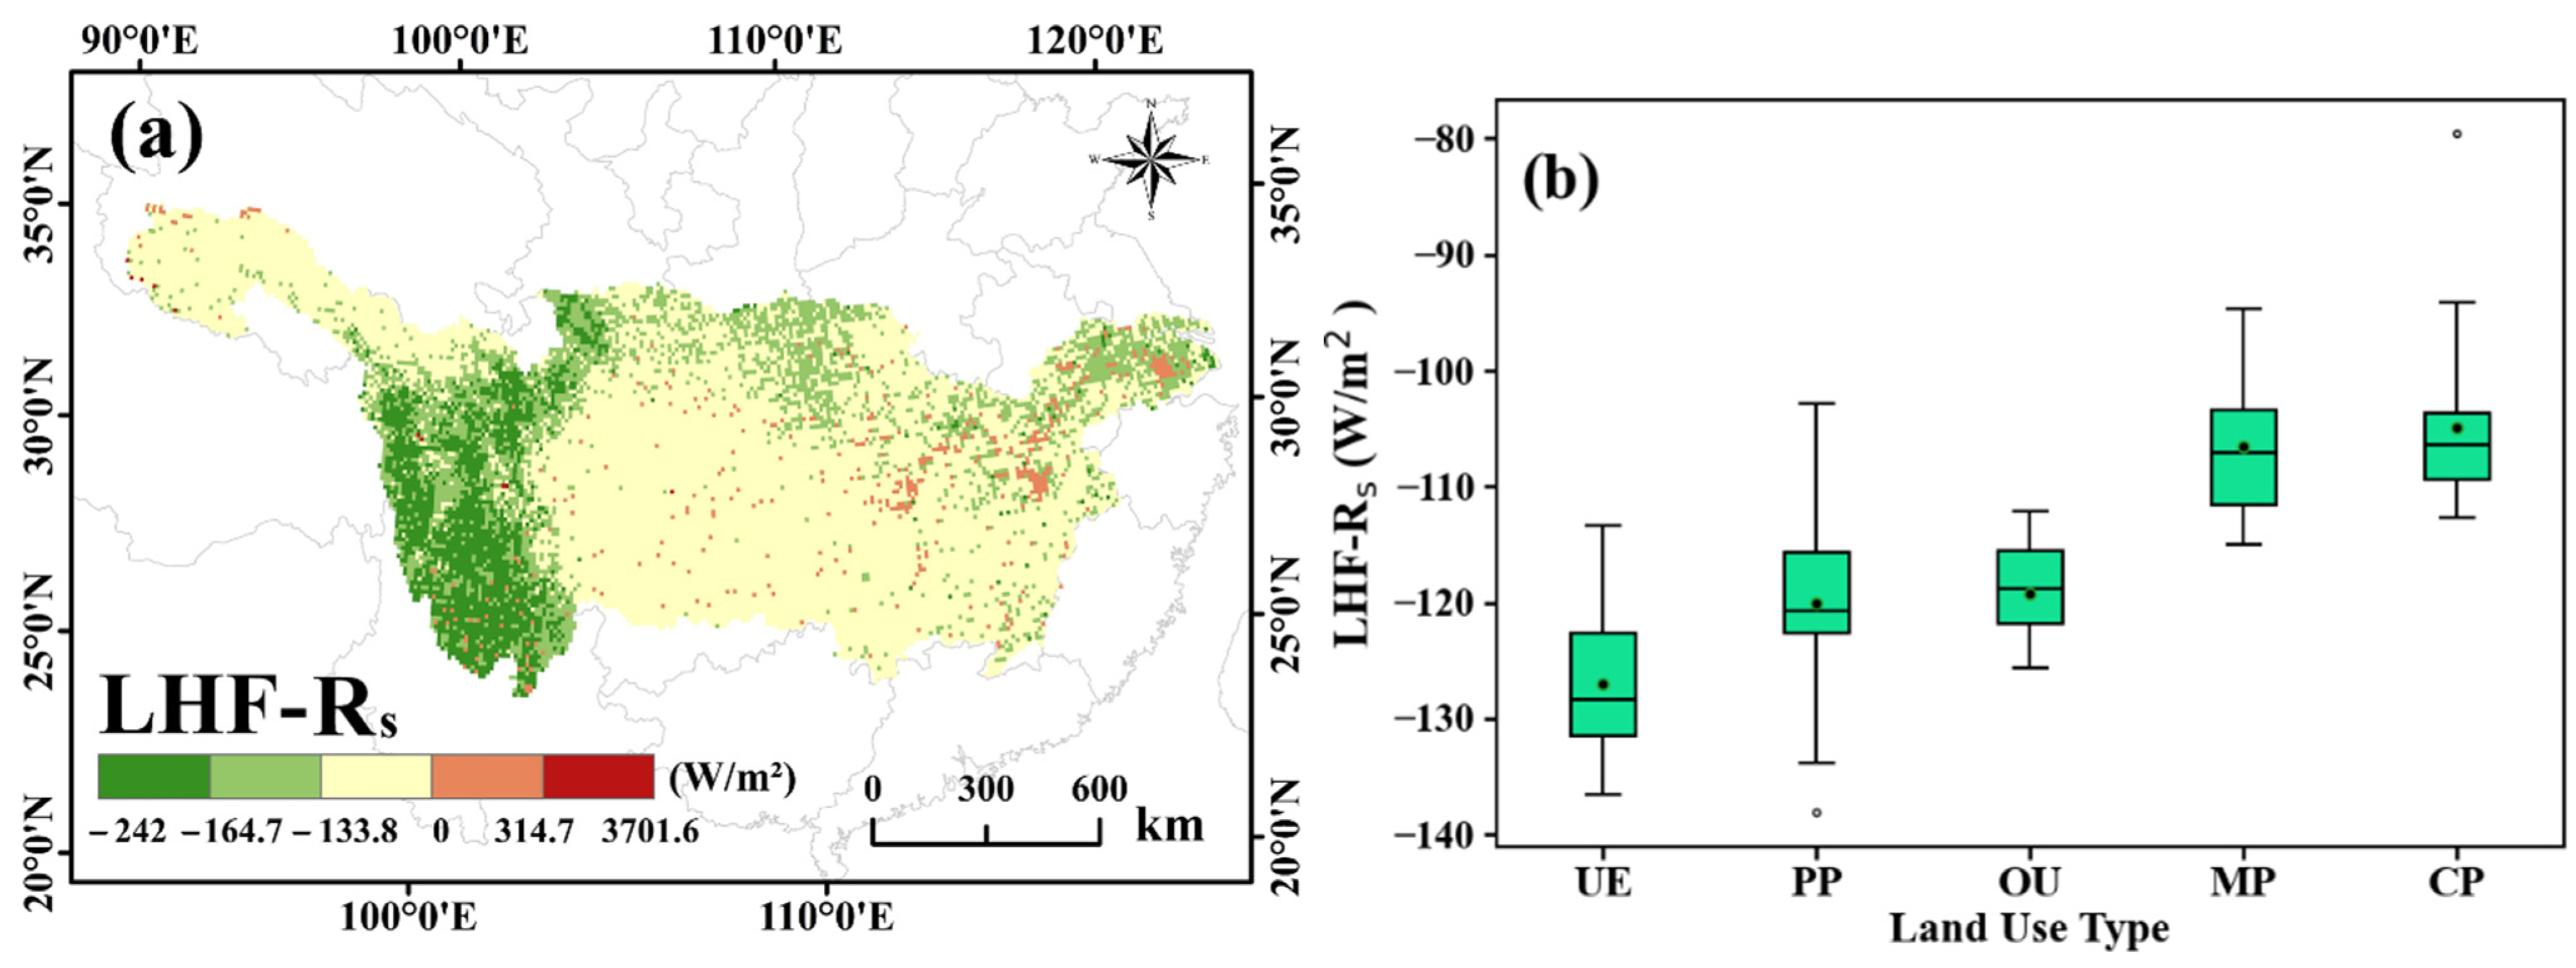
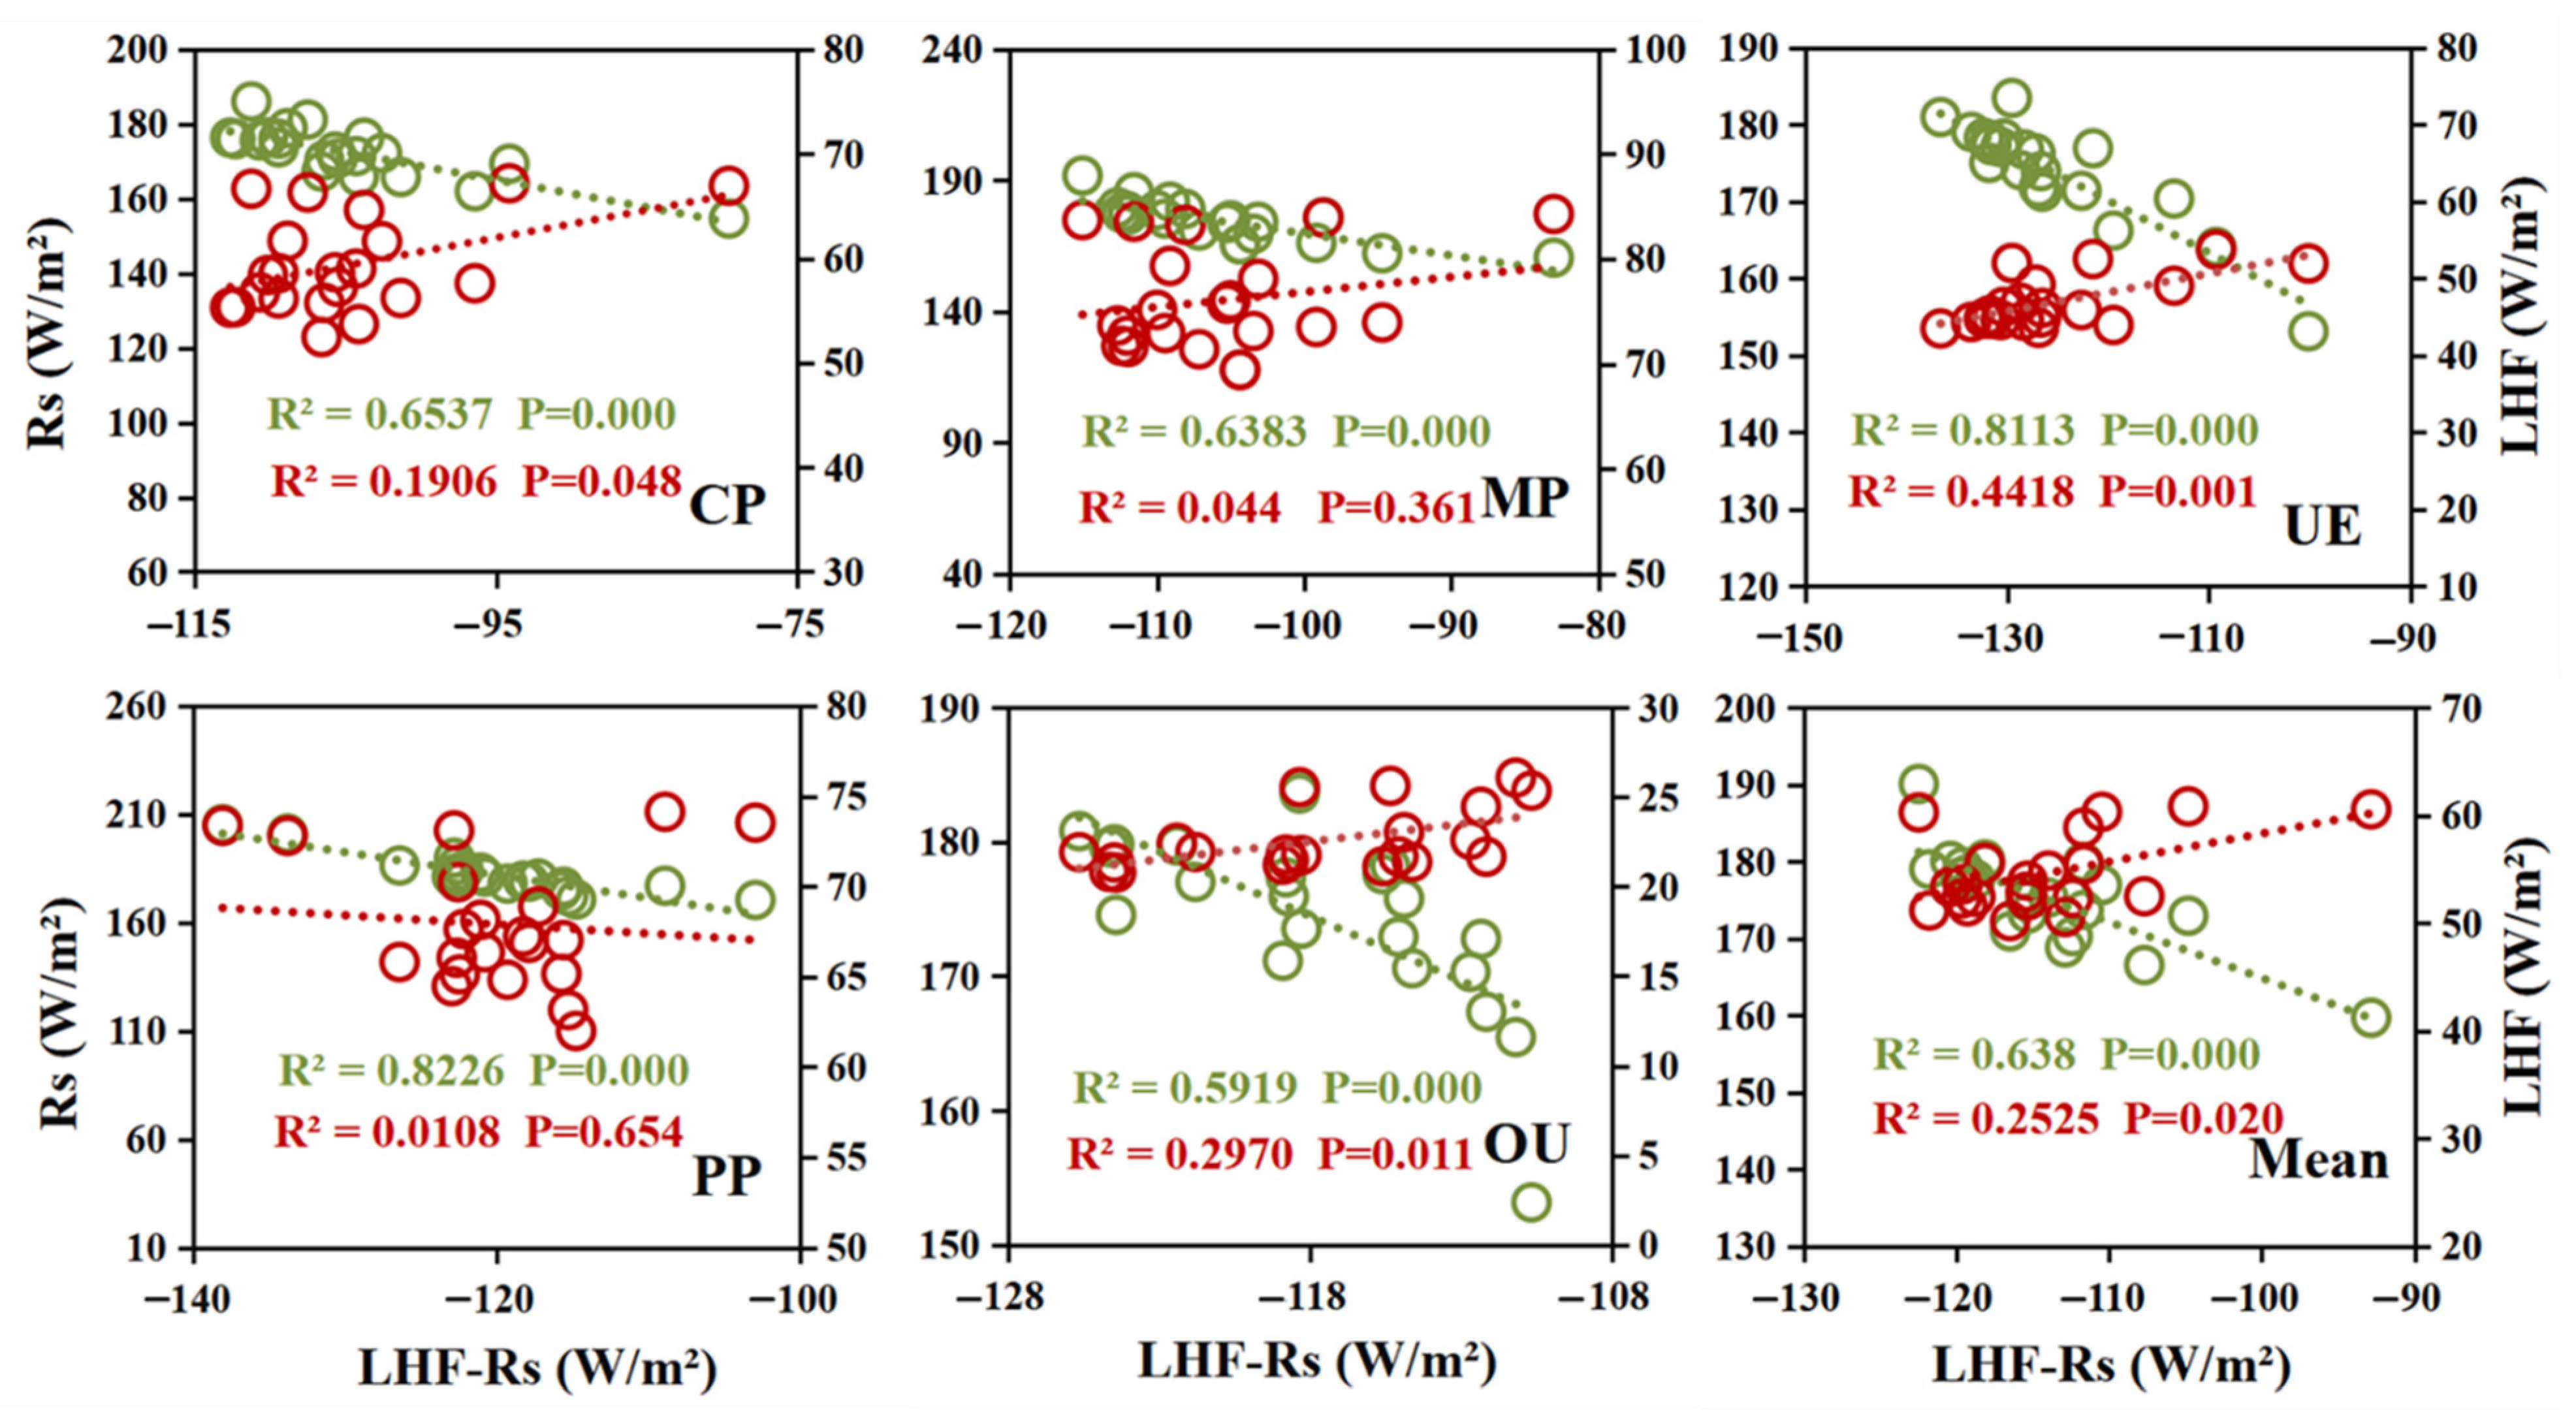
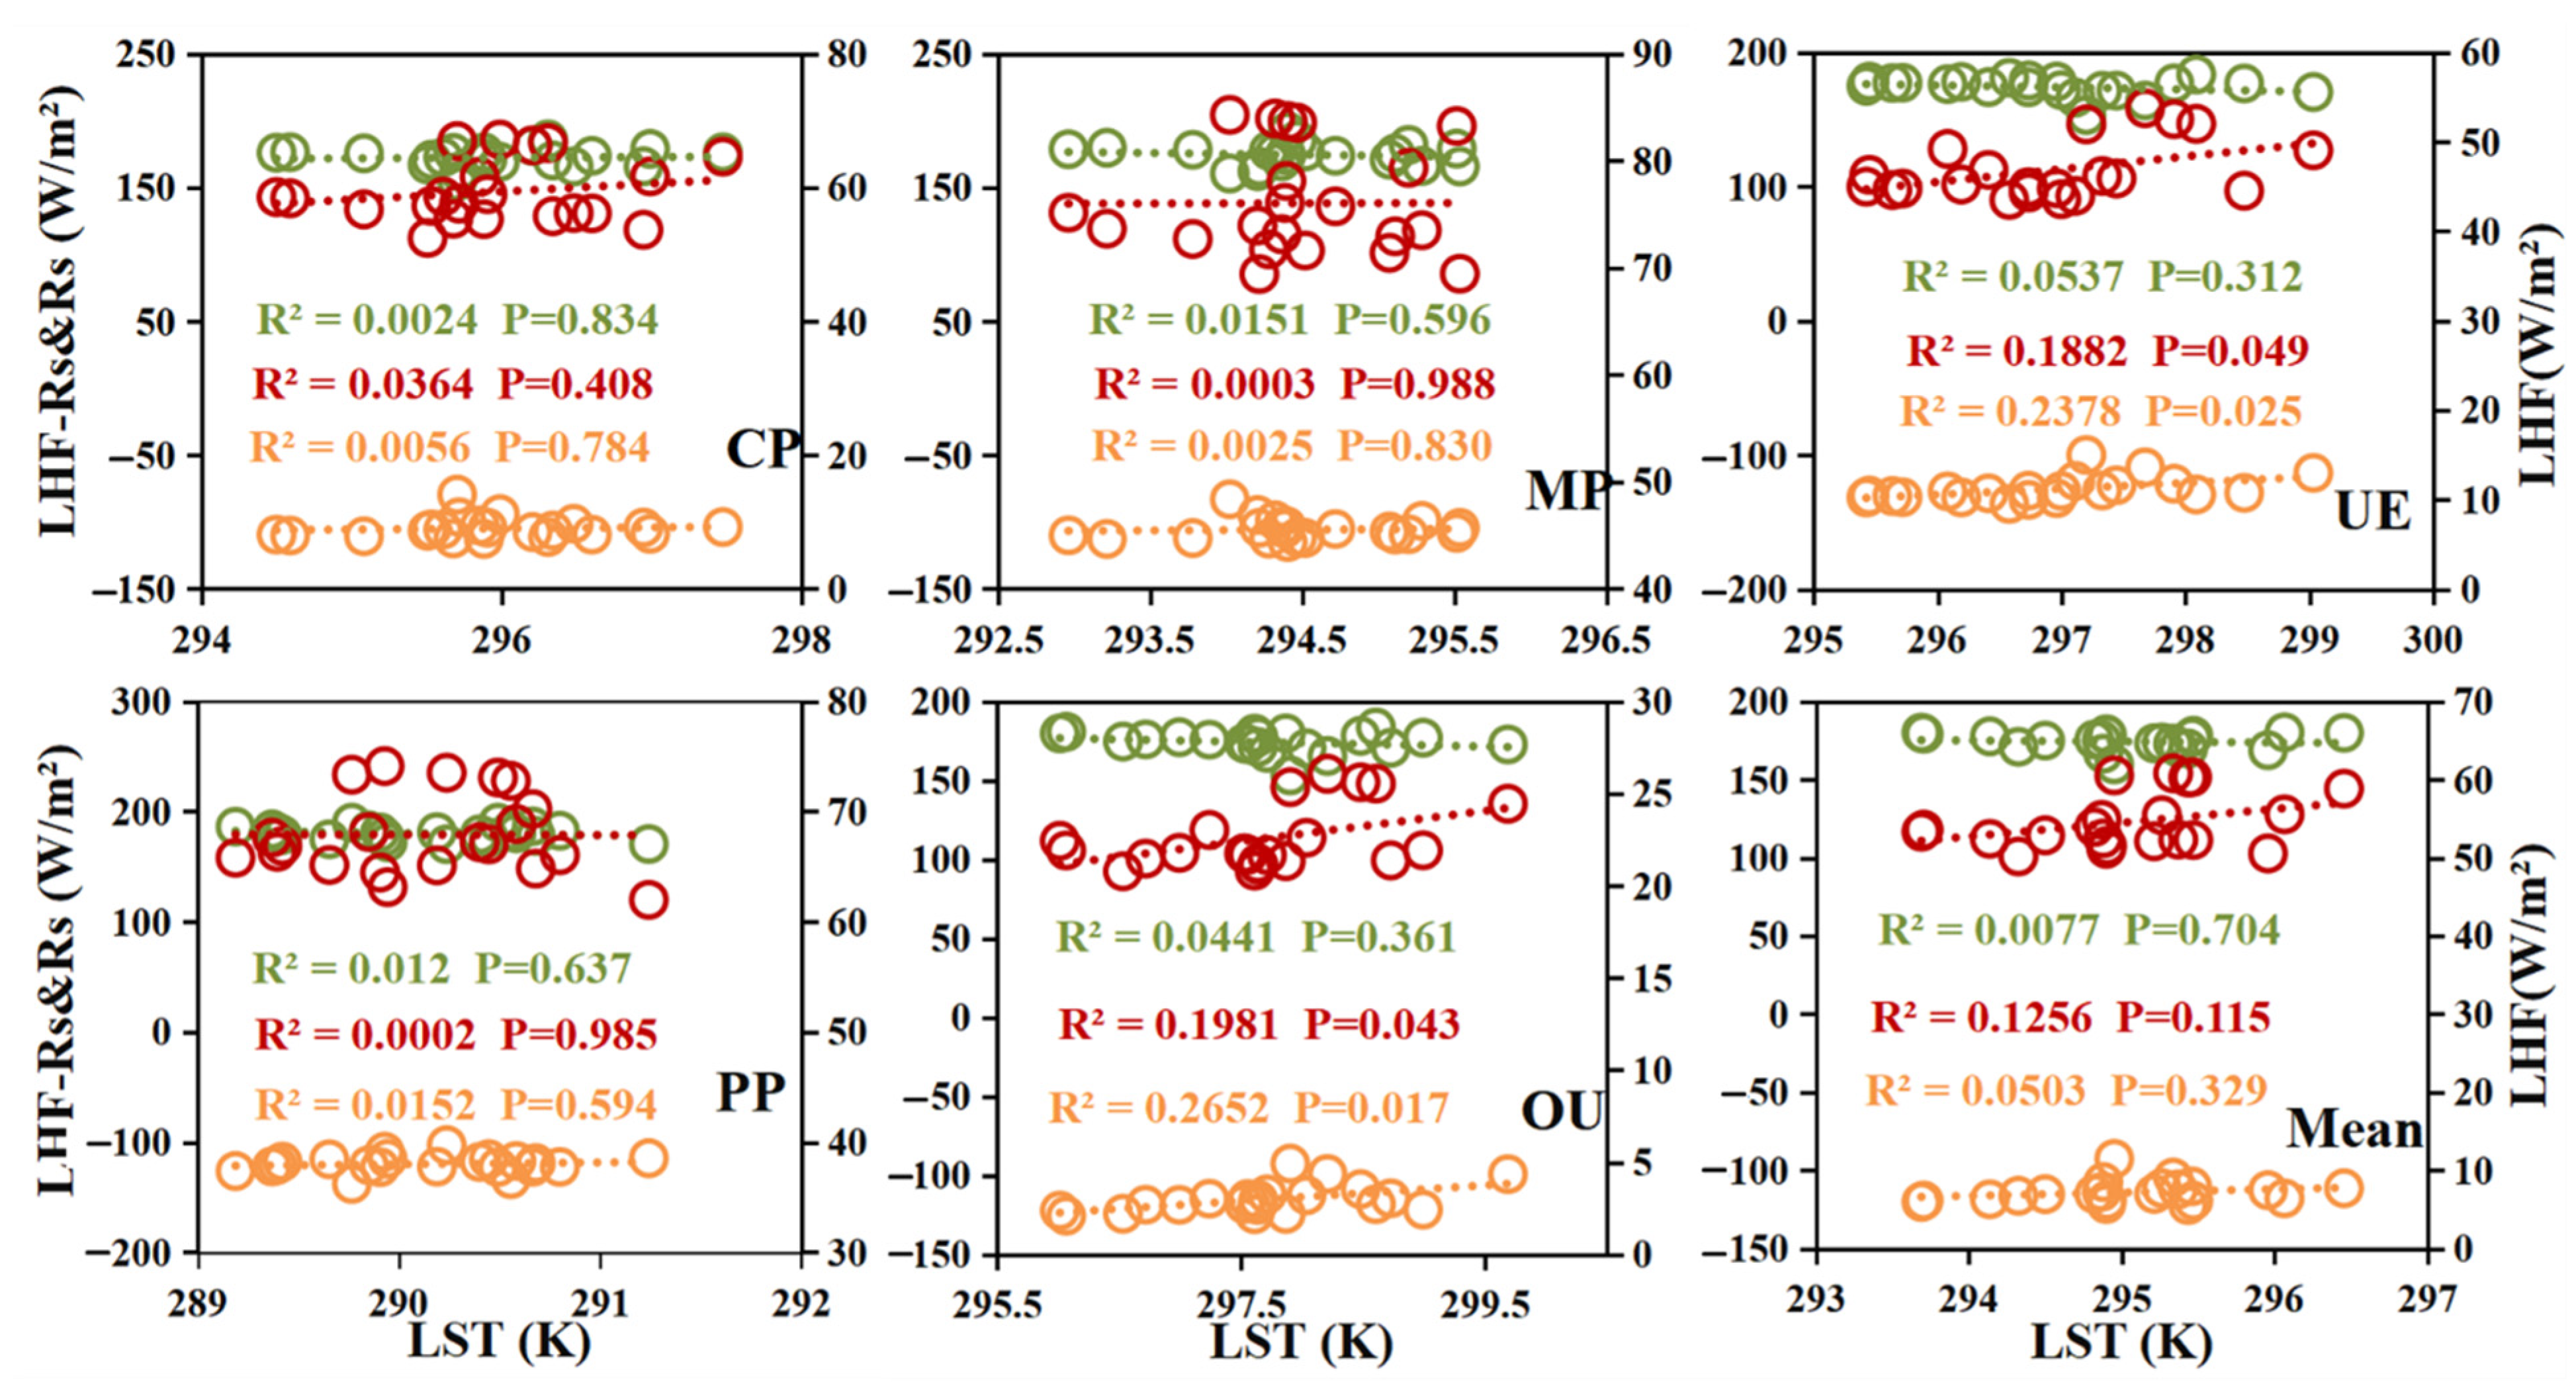
3.2.2. Comparison of Net Radiation and Latent Heat Fluxes
4. Discussion
5. Conclusions
- (1)
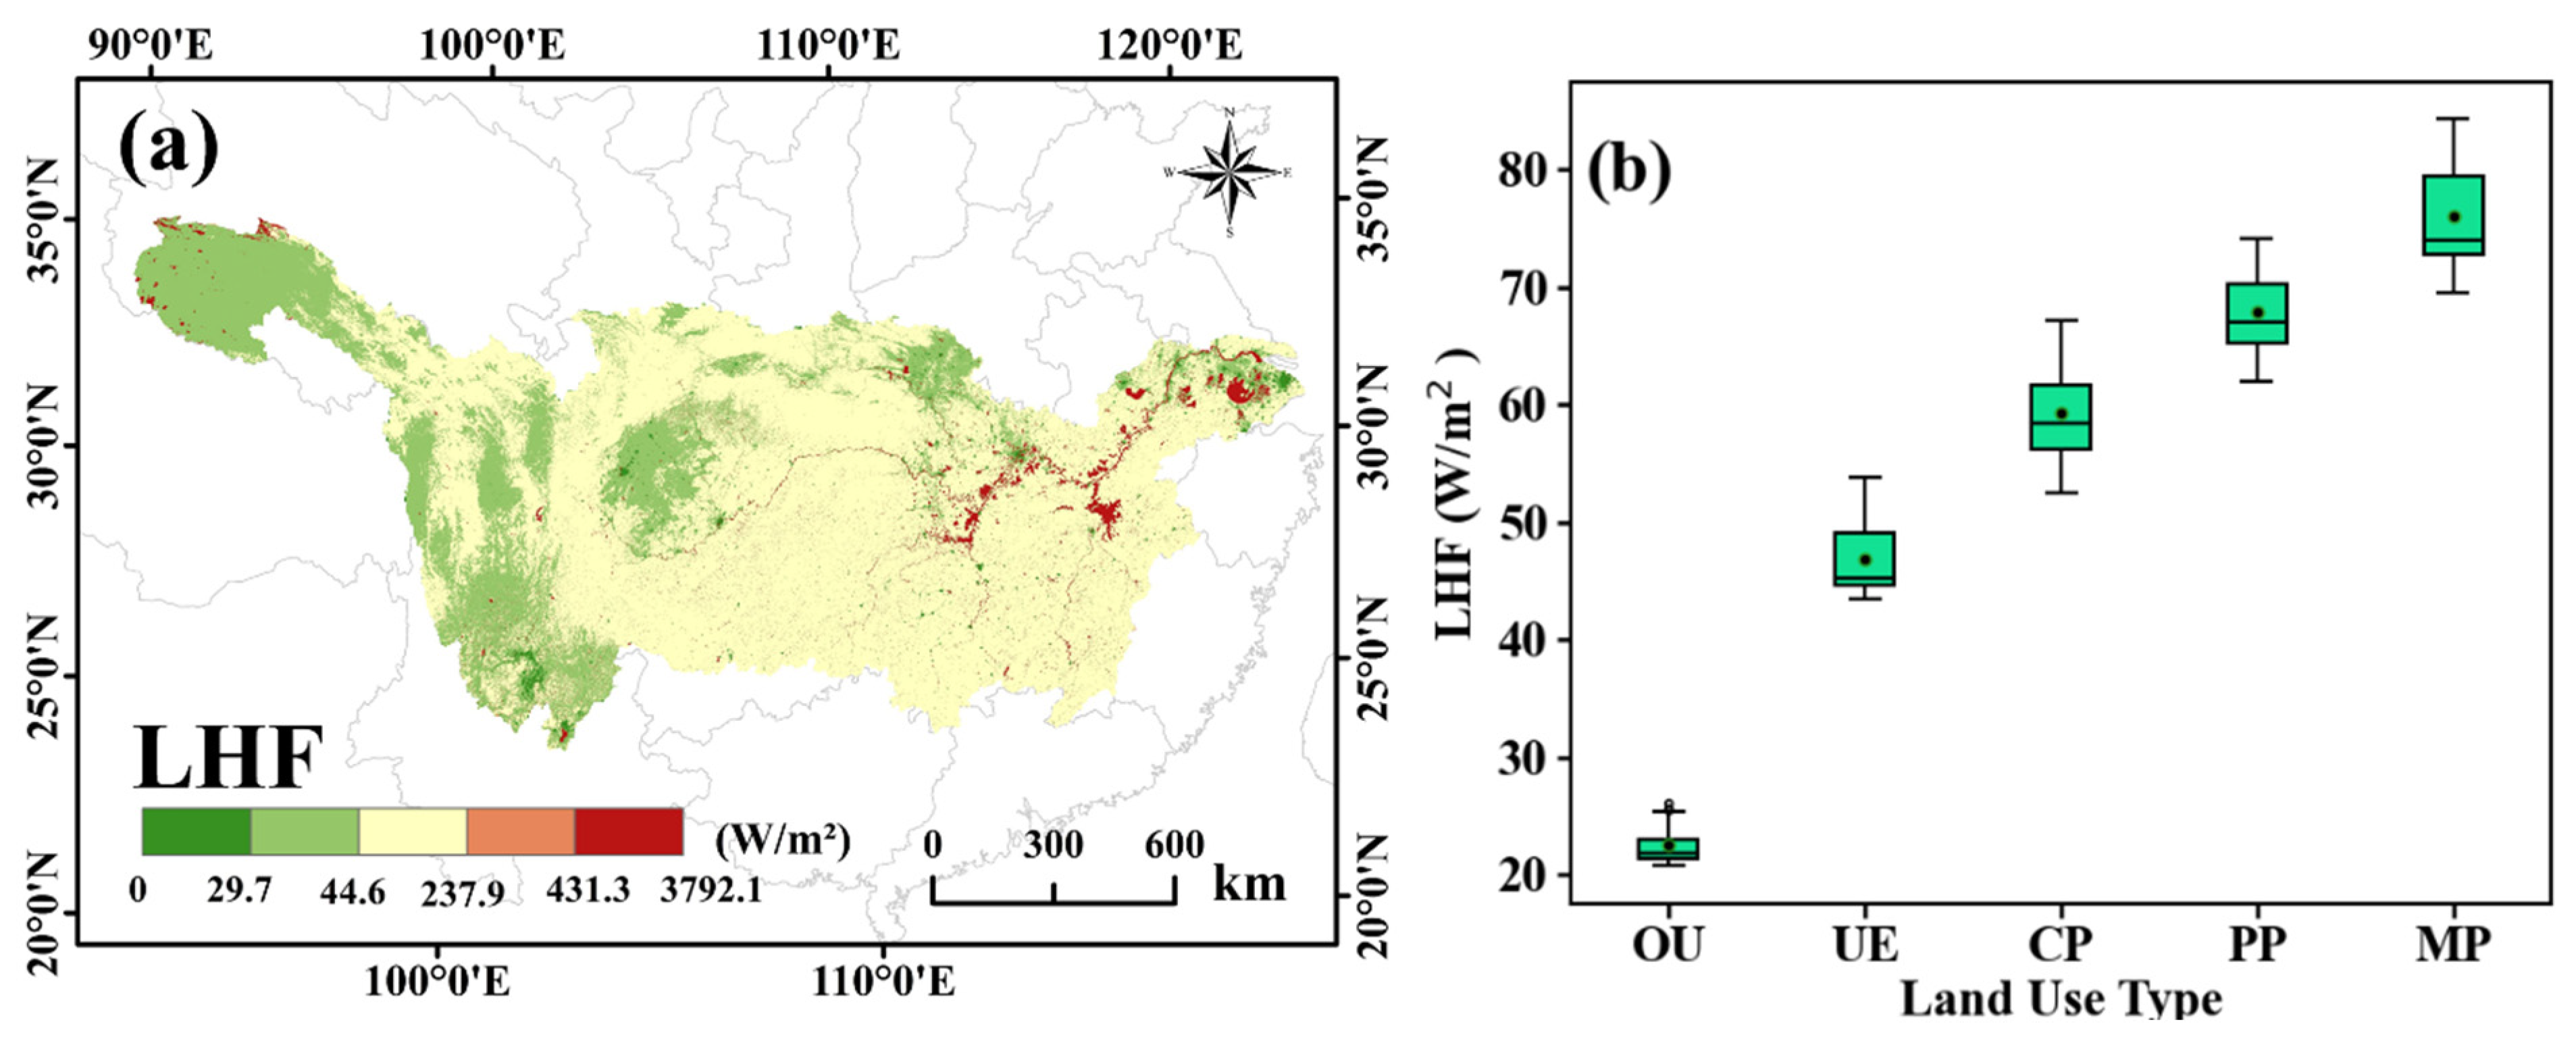
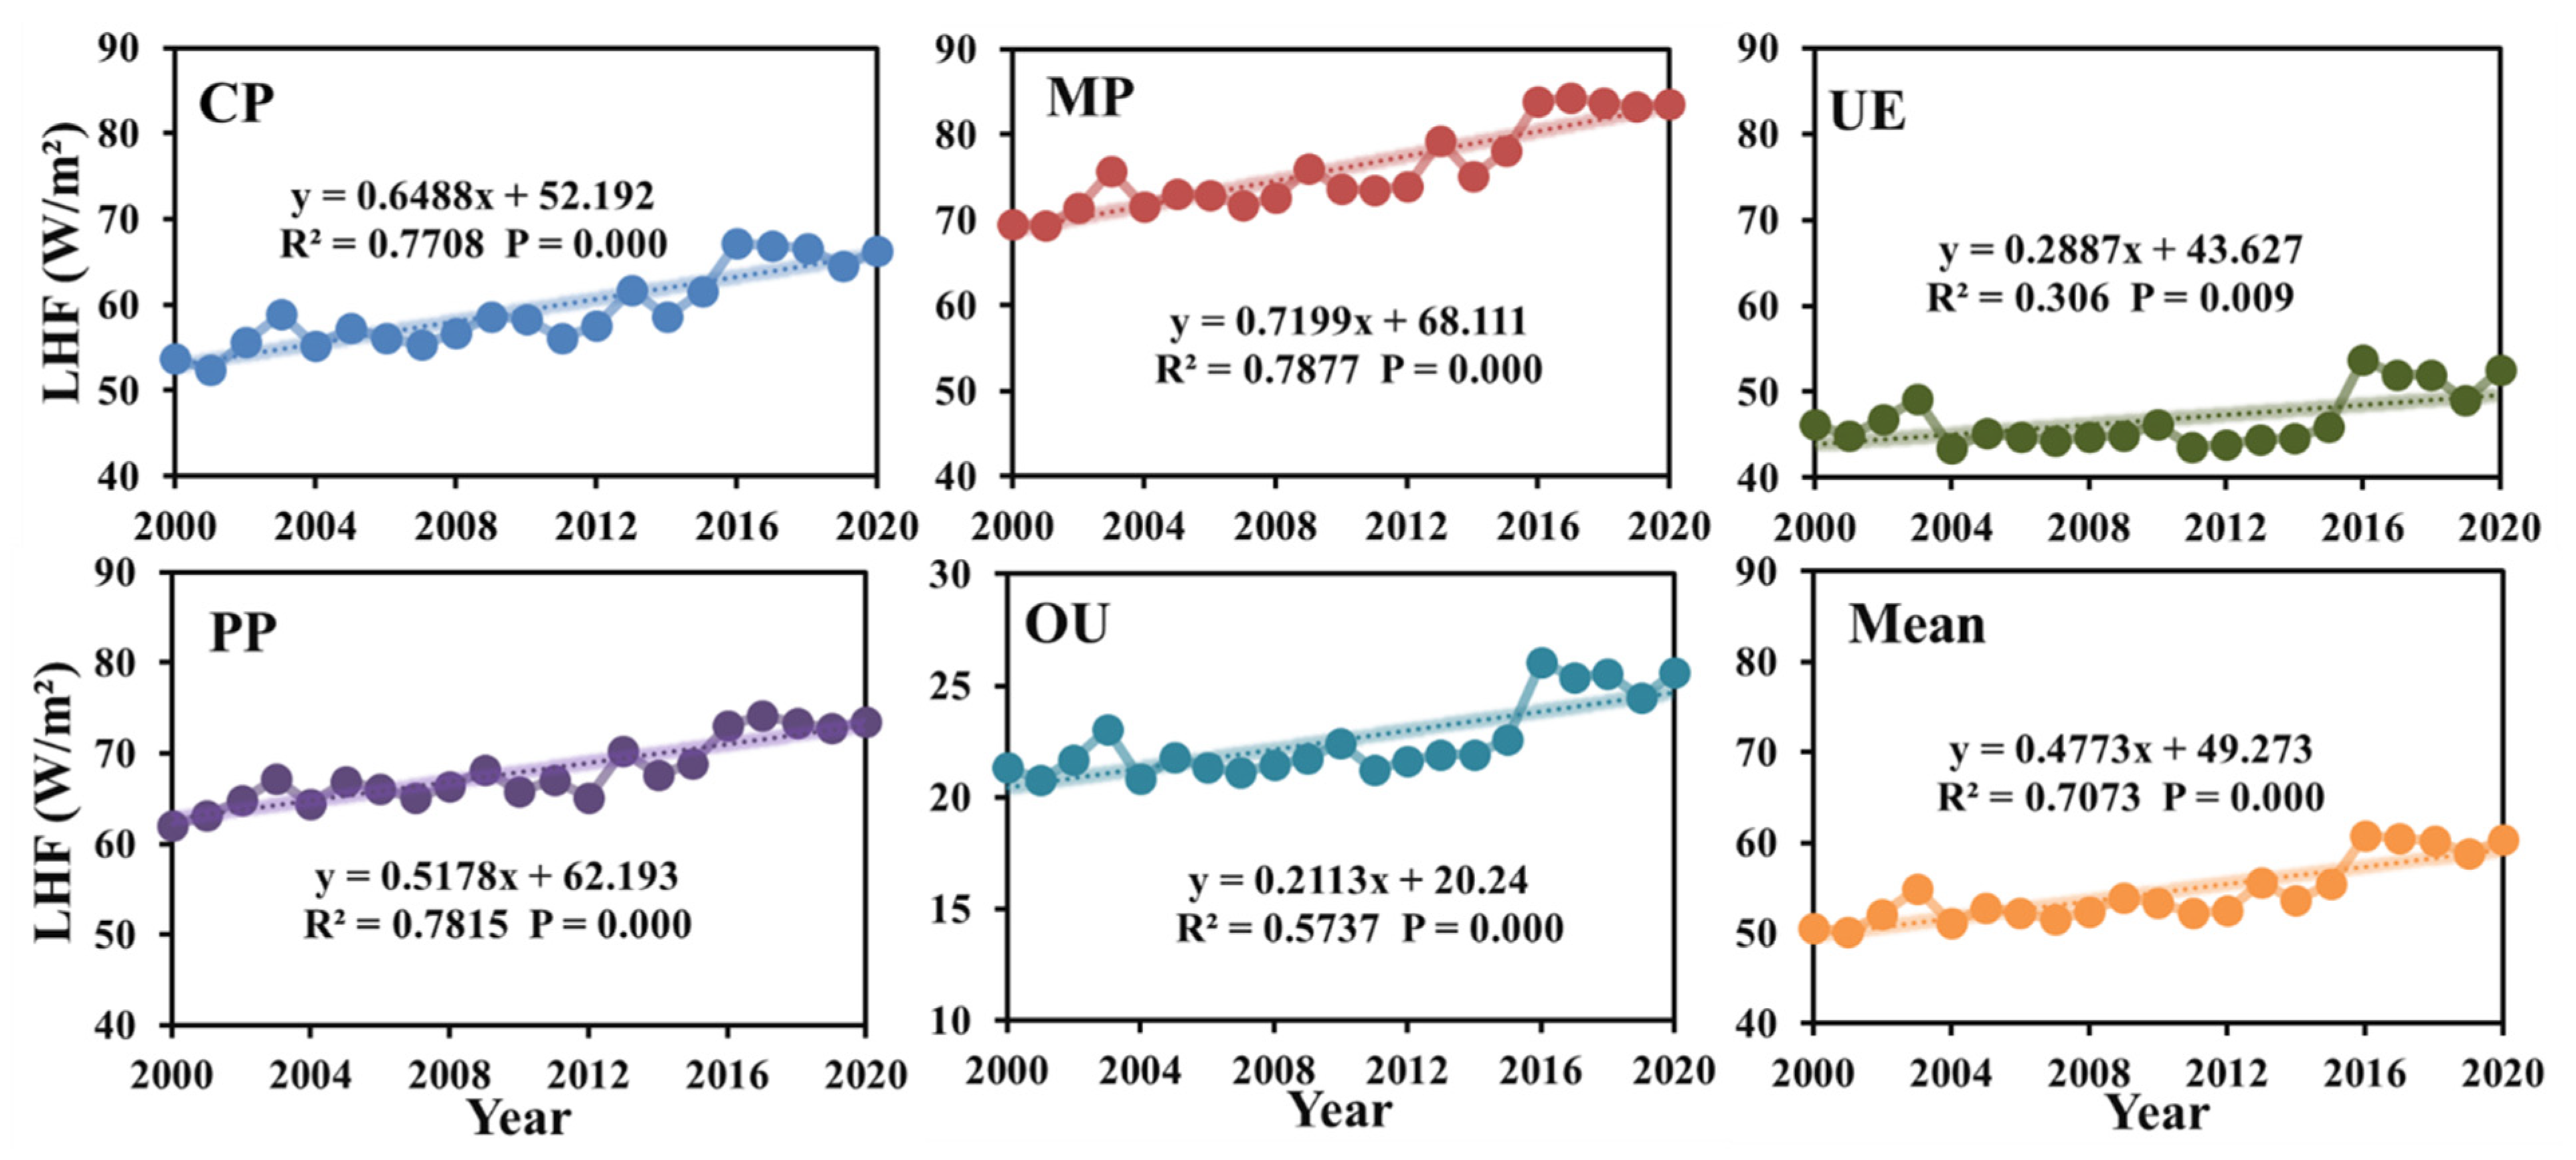
- During the past 21 years, and LHF showed an increasing trend, which was more obvious in natural and semi-natural regions (PP) and mixed-pixel regions (MP). This study found that the and LHF of OU and UE areas with severe human intervention were much lower than those of other land use types, which indicated that human intervention and urbanization weakened the impact of surface net radiation and latent heat flux.
- (2)
- From 2000 to 2020, the energy absorption of showed a downward trend, indicating that the influence of on surface energy absorption was greater than LHF, which was more obvious in OU and UE areas. With the continuous improvement of living standards, the impact on the surrounding nature was also expanding. Therefore, when analyzing the relationship between LUCC and radiative forcing, it is necessary to consider the influence of LHF and on LUCC.
- (3)
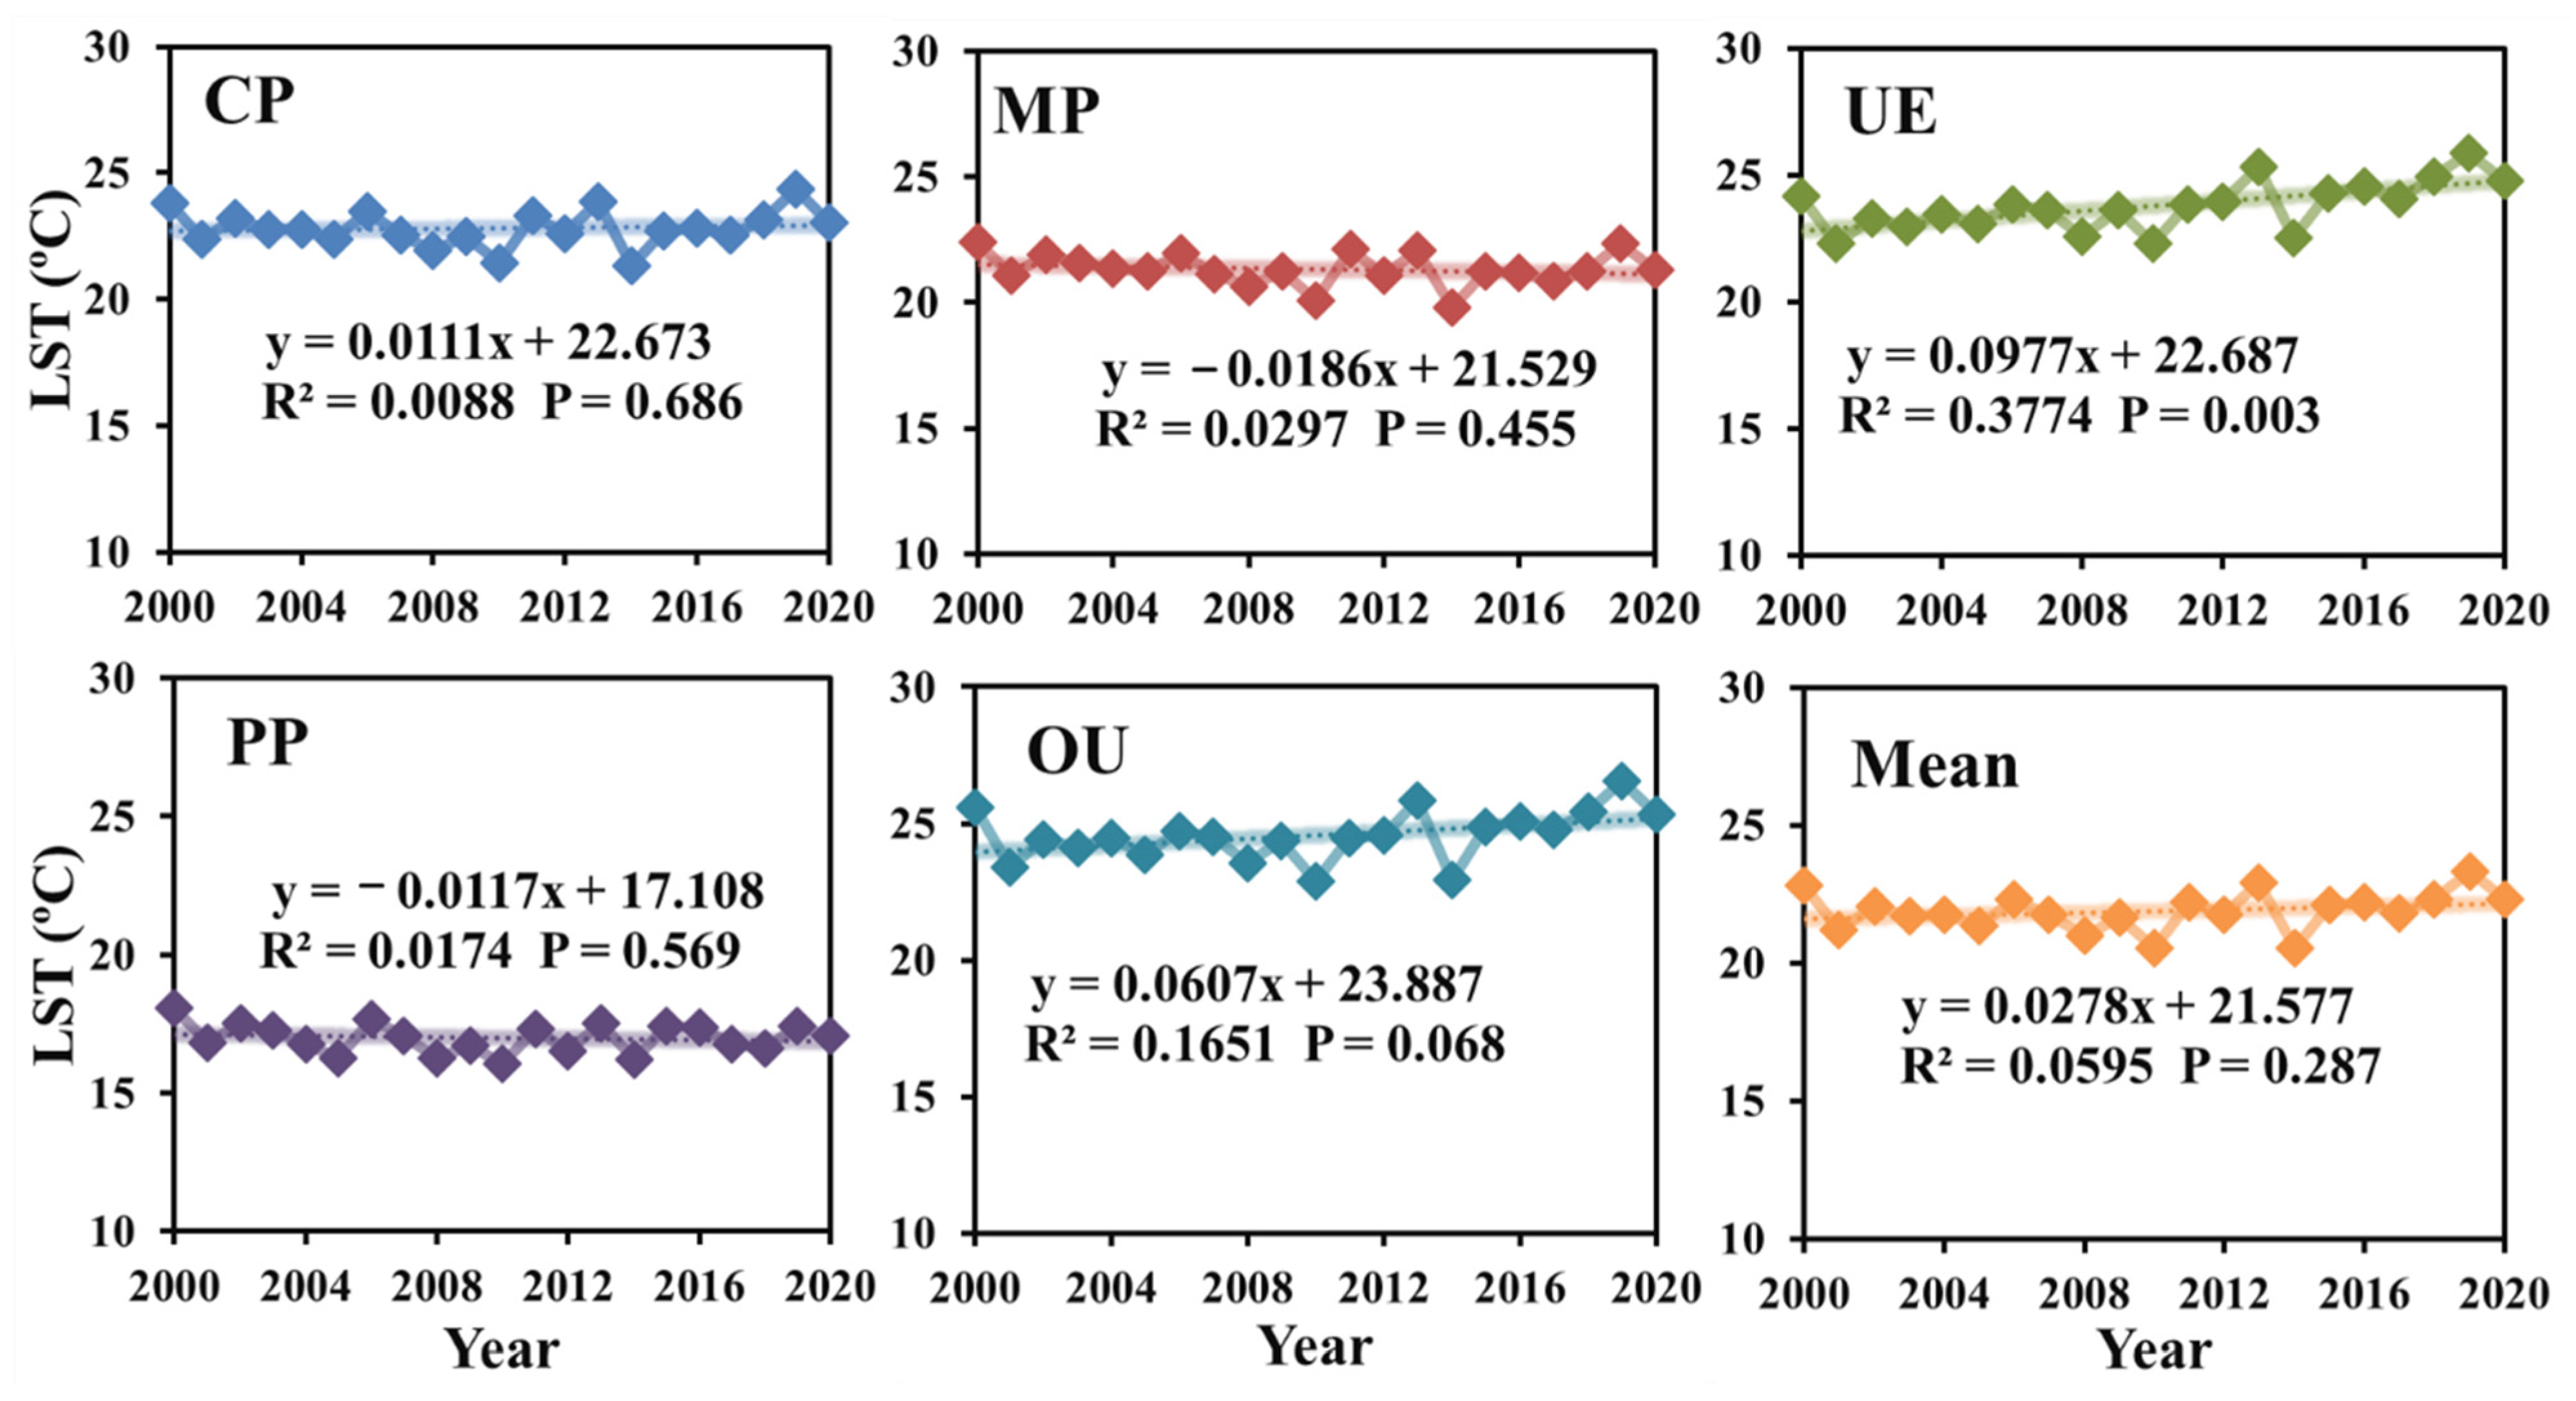
- The trend values of LST in the Yangtze River basin during 2000–2020 from high to low were OU > UE > CP > PP > MP. Among them, the values of LST were higher in OU and UE areas, and lower in the PP area, indicating that the trend of LST increased significantly with the increase in human activities.
Author Contributions
Funding
Data Availability Statement
Acknowledgments
Conflicts of Interest
References
- Wild, M.A. Towards Global Estimates of the Surface Energy Budget. Curr. Clim. Chang. Rep. 2017, 3, 87–97. [Google Scholar] [CrossRef]
- Dabberdt, W.F.; Lenschow, D.H.; Horst, T.W.; Zimmerman, P.R.; Oncley, S.P.; Delany, A.C. Atmosphere-surface exchange measurements. Science 1993, 260, 1472–1481. [Google Scholar] [CrossRef] [PubMed]
- Silva, A.M.; Da Silva, R.M.; Santos, C.A.G. Automated surface energy balance algorithm for land (ASEBAL) based on automating endmember pixel selection for evapotranspiration calculation in MODIS orbital images. Int. J. Appl. Earth Obs. 2019, 79, 1–11. [Google Scholar] [CrossRef]
- Zhu, D.; Chen, W.; Liu, H.; Huang, R. Comparison of Characteristics of Surface Radiation Energy Budget between Typical Arid Area and Plateau in Northwest my country. Clim. Environ. Res. 2006, 6, 683–690. [Google Scholar]
- Yi, Y.; Wu, S.; Dai, E. Analysis of temporal and spatial evolution of potential evapotranspiration in China from 1971 to 2008. Sci. Bull. 2010, 55, 2226–2234. [Google Scholar]
- Choudhury, I.; Ghosh, R. Spatio-temporal coupling of land-surface and energy balance parameters with monsoon rainfall using remote-sensing technology. Int. J. Remote Sens. 2014, 35, 532–553. [Google Scholar] [CrossRef]
- Rotenberg, E.; Yakir, D. Contribution of Semi-Arid Forests to the Climate System. Science 2010, 327, 451–454. [Google Scholar] [CrossRef]
- Peng, S.S.; Piao, S.; Zeng, Z.; Ciais, P.; Zhou, L.; Li, L.Z.X.; Myneni, R.B.; Yin, Y.; Zeng, H. Afforestation in China cools local land surface temperature. Proc. Natl. Acad. Sci. USA 2014, 111, 2915–2919. [Google Scholar] [CrossRef]
- McGuire, A.D.; Hinzman, L.D.; Walsh, J.; Hobbie, J.; Sturm, M. Trajectory of the Arctic as an integrated system1. Ecol. Appl. 2013, 23, 1743–1744. [Google Scholar] [CrossRef]
- Cui, Y.; Liu, J.; Hu, Y.; Wang, J.; Kuang, W. Modeling the radiation balance of different urban underlying surfaces. Sci. Bull. 2012, 57, 465–473. [Google Scholar] [CrossRef]
- Luyssaert, S. Land management and land-cover change have impacts of similar magnitude on surface temperature. Nat. Clim. Chang. 2014, 4, 389–393. [Google Scholar] [CrossRef]
- Wang, K.; Dickinson, R.E. Global atmospheric downward longwave radiation at the surface from ground-based observations, satellite retrievals, and reanalyses. Rev. Geophys. 2013, 51, 150–185. [Google Scholar] [CrossRef]
- Zheng, Y.; Huang, L.; Zhai, J. Comparison of the influence of land surface cover changes on the surface albedo in four countries. J. Remote Sens. 2020, 24, 917–932. [Google Scholar]
- Li, Y.; Zhao, M.; Motesharrei, S.; Mu, Q.; Kalnay, E.; Li, S. Local cooling and warming effects of forests based on satellite observations. Nat. Commun. 2015, 6, 6603. [Google Scholar] [CrossRef] [PubMed]
- Chen, W.; Meng, H.; Song, H.; Zheng, H. Progress in Dust Modelling, Global Dust Budgets, and Soil Organic Carbon Dynamics. Land 2022, 11, 176. [Google Scholar] [CrossRef]
- Kang, Z.; Zhang, Z.; Liu, L.; Wang, T.; Tian, H.; Chen, H.; Zhang, X. Analysis of temporal and spatial variation characteristics of surface temperature in Xinjiang based on MODIS. Geogr. Res. 2022, 41, 997–1017. [Google Scholar]
- Guan, Y.; Wang, R.; Li, C.; Yao, J. Variation characteristics of ground surface temperature in northern piedmont of Tianshan Mountains during 1963–2010. J. Arid Meteorol. 2015, 33, 587–594. [Google Scholar]
- Pei, L.; Moore, N.; Zhong, S.; Kendall, A.D.; Gao, Z.; Hyndman, D.W. Effects of irrigation on summer precipitation over the United States. J. Clim. 2016, 29, 3541–3558. [Google Scholar] [CrossRef]
- Zhu, M.; Liu, D.; Tang, W.; Chi, Q.; Zhao, X.; Xu, S.; Ye, S.; Wang, Y.; Cui, Y.; Zhou, S. Exploring the Ecological Climate Effects Based on Five Land Use Types: A Case Study of the Huang-Huai-Hai River Basin in China. Land 2022, 11, 265. [Google Scholar] [CrossRef]
- Stenseth, N.C.; Mysterud, A.; Ottersen, G.; Hurrell, J.W.; Chan, K.; Lima, M. Ecological Effects of Climate Fluctuations. Science 2002, 297, 1292–1296. [Google Scholar] [CrossRef]
- Forzieri, G.; Alkama, R.; Miralles, D.G.; Cescatti, A. Satellites reveal contrasting responses of regional climate to the widespread greening of Earth. Science 2017, 356, 1180–1184. [Google Scholar] [CrossRef] [PubMed]
- Chi, Q.; Zhou, S.; Wang, L.; Zhu, M.; Liu, D.; Tang, W.; Cui, Y.; Lee, J. Exploring on the Eco-Climatic Effects of Land Use Changes in the Influence Area of the Yellow River Basin from 2000 to 2015. Land 2021, 10, 601. [Google Scholar] [CrossRef]
- Wang, Q.; Zhang, M.; Wang, S.; Luo, S.; Wang, B.; Zhu, X. Analysis of Extreme Temperature Events in the Yangtze River Basin from 1962 to 2011. Acta Geogr. Sin. 2013, 68, 611–625. [Google Scholar]
- Wang, L.; Qiu, X.; Wang, P.; Liu, A. Distributed Simulation of Total Solar Radiation in Yangtze River Basin under Complex Terrain. Acta Geogr. Sin. 2010, 65, 543–552. [Google Scholar]
- Wang, D.W.; He, P.; Xu, J.; Wang, J. Changes of land use and ecosystem service in the Yangtze River Basin after five years’ general protection. J. Environ. Eng. 2022, 12, 408–416. [Google Scholar]
- Zhao, H.; He, H.; Bai, C.; Zhang, C. Spatial-Temporal Characteristics of Land Use Change in the Loess Plateau and Its Environmental Effects. China Land Sci. 2018, 32, 49–57. [Google Scholar]
- Zhou, S.; Wang, K.; Yang, S.; Li, W.; Zhang, Y.; Zhang, B.; Fu, Y.; Liu, X.; Run, Y.; Chubwa, O.G.; et al. Warming Effort and Energy Budget Difference of Various Human Land Use Intensity: Case Study of Beijing, China. Land 2020, 9, 280. [Google Scholar] [CrossRef]
- Benali, A.; Carvalho, A.C.; Nunes, J.P.; Carvalhais, N.; Santos, A. Estimating air surface temperature in Portugal using MODIS LST data. Remote Sens. Environ. 2012, 124, 108–121. [Google Scholar] [CrossRef]
- Zheng, H.; Ren, Q.; Zheng, K.; Qin, Z.; Wang, Y.; Wang, Y. Spatial distribution and risk assessment of metal(loid)s in marine sediments in the Arctic Ocean and Bering Sea. Mar. Pollut. Bull. 2022, 179, 113729. [Google Scholar] [CrossRef]
- Ma, T.; Li, X.; Bai, J.; Cui, B. Tracking three decades of land use and land cover transformation trajectories in Chinese large river deltas. Land Degrad. Dev. 2019, 30, 799–810. [Google Scholar] [CrossRef]
- Duveiller, G.; Caporaso, L.; Abad-Viñas, R.; Perugini, L.; Grassi, G.; Arneth, A.; Cescatti, A. Local biophysical effects of land use and land cover change: Towards an assessment tool for policy makers. Land Use Policy 2020, 91, 104382. [Google Scholar] [CrossRef]
- Yu, X.; Jia, S.; Zhu, W. Estimation of Land Surface Net Radiation Flux based on Remote Sensing and Analysis of its Spatial-temporal Characteristics in Qinghai Province. Plateau Meteorol. 2021, 13, 407–422. [Google Scholar]
- Li, Y.; Piao, S.; Chen, A.; Ciais, P.; Li, L.Z.X. Local and teleconnected temperature effects of afforestation and vegetation greening in China. Natl. Sci. Rev. 2020, 7, 897–912. [Google Scholar] [CrossRef] [PubMed]
- Du, J.; Wang, K.; Wang, J.; Ma, Q. Contributions of surface solar radiation and precipitation to the spatiotemporal patterns of surface and air warming in China from 1960 to 2003. Atmos. Chem. Phys. 2017, 17, 4931–4944. [Google Scholar] [CrossRef]
- Zhao, G.; Dong, J.; Cui, Y.; Liu, J.; Zhai, J.; He, T.; Zhou, Y.; Xiao, X. Evapotranspiration-dominated biogeophysical warming effect of urbanization in the Beijing-Tianjin-Hebei region, China. Clim. Dynam. 2019, 52, 1231–1245. [Google Scholar] [CrossRef]
- Portela, C.I.; Massi, K.G.; Rodrigues, T.; Alcântara, E. Impact of urban and industrial features on land surface temperature: Evidences from satellite thermal indices. Sustain. Cities Soc. 2020, 56, 102100. [Google Scholar] [CrossRef]
- Zhou, S.; Liu, D.; Zhu, M.; Tang, W.; Chi, Q.; Ye, S.; Xu, S.; Cui, Y. Temporal and Spatial Variation of Land Surface Temperature and Its Driving Factors in Zhengzhou City in China from 2005 to 2020. Remote Sens. 2022, 14, 4281. [Google Scholar] [CrossRef]
- Cui, Y.; Xiao, X.; Dong, J.; Zhang, Y.; Qin, Y.; Doughty, R.B.; Wu, X.; Liu, X.; Joiner, J.; Moore, B. Continued Increases of Gross Primary Production in Urban Areas during 2000–2016. J. Remote Sens. 2022, 14, 2022. [Google Scholar] [CrossRef]
- Liu, X.; Ming, Y.; Liu, Y.; Yue, W.; Han, G. Influences of landform and urban form factors on urban heat island: Comparative case study between Chengdu and Chongqing. Sci. Total Environ. 2022, 820, 153395. [Google Scholar] [CrossRef]
- Shan, B.; Zhang, Q.; Ren, Q. Spatial differentiation of urban thermal environment and its influencing factors based on local climate zones in Jinan. J. Geo-Inf. Sci. 2022, 24, 711–722. [Google Scholar]
- Yang, J.; Zhan, Y.; Xiao, X.; Xia, J.C.; Sun, W.; Li, X. Investigating the diversity of land surface temperature characteristics in different scale cities based on local climate zones. Urban Clim. 2020, 34, 100700. [Google Scholar] [CrossRef]
- Vahmani, P.; Jones, A.D. Water conservation benefits of urban heat mitigation. Nat. Commun. 2017, 8, 1072. [Google Scholar] [CrossRef] [PubMed] [Green Version]


| Data Items | Time Resolution | Spatial Resolution | Data Resource |
|---|---|---|---|
| Albedo | daily | 500 m | MCD43A3 |
| Temperature (LST) | daily | 1 km | MOD11A1 |
| Latent heat flux (LHF) | 8 daily | 500 m | MOD16A2 |
| Emissivity | daily | 1 km | MOD11A1 |
| Land Use Change from 2000 to 2020 | Unchanged Land Types from 2000 to 2020 | ||
|---|---|---|---|
| Categories | Percentage | Categories | Percentage |
| cropland to urban areas | 0.95% | urban areas | 0.46% |
| natural and semi-natural areas to urban areas | 0.29% | cropland | 33.58% |
| natural and semi-natural areas to cropland | 0.74% | natural and semi-natural areas | 63.25% |
| cropland to natural and semi-natural areas | 0.73% | ||
Publisher’s Note: MDPI stays neutral with regard to jurisdictional claims in published maps and institutional affiliations. |
© 2022 by the authors. Licensee MDPI, Basel, Switzerland. This article is an open access article distributed under the terms and conditions of the Creative Commons Attribution (CC BY) license (https://creativecommons.org/licenses/by/4.0/).
Share and Cite
Zhao, X.; Zhu, M.; Liu, D.; Xu, S.; Ye, S.; Wang, S.; Cui, Y.; Zhou, S. Exploring the Ecological Climate Effects of Different Land Use Changes in the Yangtze River Basin from 2000 to 2020. Land 2022, 11, 1636. https://doi.org/10.3390/land11101636
Zhao X, Zhu M, Liu D, Xu S, Ye S, Wang S, Cui Y, Zhou S. Exploring the Ecological Climate Effects of Different Land Use Changes in the Yangtze River Basin from 2000 to 2020. Land. 2022; 11(10):1636. https://doi.org/10.3390/land11101636
Chicago/Turabian StyleZhao, Xiao, Mengyao Zhu, Dandan Liu, Siqi Xu, Siyu Ye, Shuang Wang, Yaoping Cui, and Shenghui Zhou. 2022. "Exploring the Ecological Climate Effects of Different Land Use Changes in the Yangtze River Basin from 2000 to 2020" Land 11, no. 10: 1636. https://doi.org/10.3390/land11101636