Article

Ecological Compensation in the Context of Carbon Neutrality: A Case Involving Service Production-Transmission and Distribution-Service Consumption

1
College of Resources and Environmental Sciences, Henan Agricultural University, Zhengzhou 450002, China
2
Beijing Kuo Ye Tian Yuan Biotechnology Co., Ltd., Beijing 102112, China
3
State Key Laboratory of Cotton Biology, Institute of Cotton Research, Chinese Academy of Agricultural Sciences, Anyang 455000, China
4
International Laboratory for Green Pest Control/College of Plant Protection, Henan Agricultural University, Zhengzhou 450002, China
5
School of Resource and Environmental Sciences, Wuhan University, Wuhan 430079, China
*
Authors to whom correspondence should be addressed.
T.Z. and L.W. contributed equally to this study.
Land 2022, 11(12), 2321; https://doi.org/10.3390/land11122321
Submission received: 19 October 2022 / Revised: 5 December 2022 / Accepted: 15 December 2022 / Published: 17 December 2022

Abstract

:
Carbon ecological compensation is essential to coordinate regional environmental protection, reduce the gap between the economic development of protected areas and beneficiary areas, and achieve carbon neutrality. This paper proposed a theoretical framework for ecological compensation using the theories of carbon balance, externality, ecosystem services, and carbon trading mechanisms. Based on the analysis of the ecological compensation priority sequence in Henan Province, the suppliers and consumers of carbon sequestration were identified, and cross-regional ecological compensation was realized through ecosystem services flow. The results showed that the carbon sequestration supply in Henan Province was characterized as being high in the west and low in the east, while the demand was the opposite. Affected by the suitable environmental conditions, many areas had an ecological surplus pattern, and the carbon sequestration supply was more significant than the demand. Central and south-western Henan Province were distinct ecological compensation payment areas and receiving areas, respectively. Nanyang, which had the largest carbon sequestration flow and the largest ecological contribution to other regions, received the highest ecological compensation fund of CNY 4.069 billion. This study can provide decision support for carbon ecological compensation in the context of carbon neutrality.

1. Introduction

Since the industrial revolution, the world has experienced rapid socioeconomic development and increased consumption of fossil fuels, resulting in large amounts of carbon dioxide emission and other greenhouse gases in the atmosphere [1,2]. How to reduce greenhouse gas emissions has gradually become a significant challenge for human society [3]. China is the world’s largest carbon emitter, accounting for 29% of global greenhouse gas emissions. The Chinese government is under enormous pressure to address climate change and environmental protection [4]. In 2020, President Xi Jinping of China proposed that China would strive to peak CO2 emissions by 2030 and achieve carbon neutrality by 2060 to address the increasing global warming [5,6]. At the heart of carbon neutrality is the idea of “breaking even” on carbon dioxide emissions by offsetting as much carbon as is emitted, thus achieving carbon balance. However, different regions’ environmental conditions and socioeconomic development lead to large differences in carbon emissions. Along with the increasing globalization of the economy, the separation of production and consumption places has resulted in a significant transfer of carbon emissions [7,8,9]. Undoubtedly, carbon emissions have an apparent externality, resulting in a clear environmental injustice. Developed regions have taken control of low-energy, low-emission, and high-value-added production processes and outsourced high-energy, high-emission, and low-value-added production processes to poorer regions [10]. Instead of changing the rising global carbon emissions, carbon transfer has led to countries with weaker emission reduction efforts taking on the risks of industrial shifts, facing problems such as increased domestic pollution, and possibly even becoming a pollution haven [11,12]. Many studies have also analyzed China’s carbon emissions and regional carbon transfers in recent years [13,14]. At the national level, China’s carbon emissions from the production side are significantly higher than those from the consumption side. Nearly a third of carbon emissions will serve the final demand of foreign countries, particularly in the US, EU, and Japan [15]. The scope and scale of carbon transfer in China’s inter-provincial trade are more significant than that of its international trade. There is a tendency to shift from developed eastern regions to less-developed central and western regions [8,16,17]. The environmental injustice caused by carbon transfer is getting worse.
Carbon injustice is reflected in the fact that carbon economic activities benefit the private, while the resulting damages, such as climate change and air pollution, are shared by the whole society [18]. How to address carbon injustice is emerging as a hot topic [19,20]. Carbon eco-compensation provides an effective solution to guide regional low-carbon development, optimize the land-use structure, and promote the region to achieve a carbon neutrality target as soon as possible. Carbon eco-compensation refers to the act of carbon emission (or increase in carbon sink) by charging (or compensating) to increase the cost (or benefit) of the act to incentivize the subject of carbon emission (or increase in the sink) to reduce (or increase) the external diseconomies (or external economics) brought about by their actions, to achieve the purpose of reducing emissions and increasing sinks, protecting the environment, and promoting harmony between people and land [21]. Carbon eco-compensation emerged under the background of economic decarbonization, which is a new field of ecological compensation. The study on carbon eco-compensation is still at the stage of theoretical exploration. Previous studies mainly explored the trading mechanism, feasibility, and regional cost difference of carbon eco-compensation [22,23]. A carbon trading compensation system and trading mechanism are proposed through specific projects, such as carbon compensation for marine vegetation protection [24] and reservoir development [25]. After the signing of the Kyoto Protocol, the focus of carbon eco-compensation evolved into the application and development of relevant rules, including the management and trading of carbon offset projects and carbon market design [23,26]. With the deepening of carbon compensation study, many achievements have been made in theoretical research, ecological compensation calculation, and ecological compensation application [18]. Current carbon compensation studies involve ecosystems such as farmland, forests, wetlands, and oceans [27,28,29]. The accounting methods are the opportunity cost method [30], the carbon offsetting method [31], the carbon budget method [32,33], and the footprint method [34]. Scholars have also studied carbon compensation in the agriculture, fisheries, tourism, and water conservancy sectors [25,35,36,37], which enriches the connotation of carbon compensation. The practice and theoretical research of carbon compensation in China started late but developed rapidly. China’s carbon compensation theory originates from its ecological compensation mechanism, which determines the connotation characteristics of carbon compensation, the basic framework of regional carbon compensation, and the carbon trading system [31]. Chinese scholars have conducted studies in different provinces from theoretical and empirical perspectives, exploring regional carbon compensation in terms of government, individuals, land use, and horizontal compensation [35,38,39,40,41,42]. Pay more attention to the conceptual definition, characteristics, market, model, and standard determination of carbon compensation [23,43,44,45]. For example, Hu [40] studied the spatial and temporal changes in the ecological compensation standard in Jiangxi Province by constructing a carbon footprint, carbon carrying capacity, and ecological compensation standard model. Wang [41] used carbon pressure, per capita carbon emissions, and carbon intensity as indicators to calculate the amount of carbon compensation for different major functional areas in Guangdong Province. Zhao [42] defined and analyzed the connotation and essential characteristics of carbon compensation and analyzed the implementation steps. In summary, the existing studies mainly focus on individual provinces or typical regions, and there are fewer studies on cross-regional carbon compensation [41,42]. Research on the priorities of ecological compensation in different regions is also lacking. The natural and social conditions of different regions in China vary significantly, and the impact of natural conditions and economic development differences on compensation standards, willingness, and capacity is little considered [33,46]. There is still room to expand the connotation of carbon compensation.
The core of carbon compensation is the accounting of the cost of ecological compensation. In recent years, ecological compensation based on ecosystem services is gradually emerging [47,48]. The ecosystem services-based valuation approach is based on the market value theory, a quantitative assessment of the costs and benefits of ecosystem services outside of the market in monetary terms, which is then used as the basis for calculating the ecological compensation amount. This approach is usually based on objective environmental data, and the accounting process is less influenced by subjective factors, enabling the maximization of ecological benefits. The amount of ecological compensation obtained by this method is theoretically the best compensation amount. Research on ecosystem services is increasingly human-centered and has addressed different supply, delivery, demand, and consumption stages. Many studies have begun to address ecosystem services flow, the agents through which ecosystem services are transferred from supply to benefit areas. However, most current research on ecosystem services flow is only conceptual [49,50], and many studies focus on easily quantifiable ecosystem services, such as food production and water supply [51,52]. Research scales are also small, such as urban and scenic areas, and large-scale studies are lacking [53]. By studying ecosystem services flow, it is possible to find the pathways through which ecological goods and services are transferred between natural ecosystems and human socioeconomic systems and identify critical zones that influence the transfer of ecosystem services. However, there are still many gaps in the study of ecosystem services flow, and more research that combines them with concrete and implementable ecological compensation cases is required.
This study adopted the theories of carbon balance, externality, ecosystem services, and carbon trading mechanism, and selected Henan Province as the study area. The supply and demand of carbon sequestration were estimated according to the differences in economic development, population, and resource endowment in different regions, which was used to classify the priority sequence of payment or reimbursement of carbon compensation. Based on an integrated perspective of ecosystems and social systems, a carbon compensation model integrating ecosystem services flow was developed, and differentiated ecological compensation amounts were calculated. The study can provide a new idea for achieving carbon neutrality goals and carbon compensation and also has important theoretical and practical significance for achieving regional low carbon and coordinated development in Henan Province.

2. Materials and Methods

2.1. Study Area

Henan Province is located in central China, with a high topography in the west and a low topography in the east. The western, northern, and southern parts are mainly mountainous and hilly, while the eastern part is flat and low and dominated by plains (Figure 1). The land area is about 167,000 km2, of which mountains and hills account for 44.3% of the province’s total area, while plains and basins account for 55.7%. Henan Province has experienced rapid economic development in recent years, with an average annual GDP growth of 7.1% from 2012 to 2022, and the province’s economy accounts for 5% of the country’s total [54]. The externalities caused by the massive amount of carbon emissions from economic development have triggered apparent environmental injustice. Henan Province has taken measures to solve environmental injustice, including returning farmland to forest and protecting natural forests, which have achieved certain effects. However, there are still problems, such as the target being challenging to achieve and limited compensation. With the implementation of two national strategies, namely the rise of central China and the ecological protection and high-quality development of the Yellow River basin, higher requirements have been put forward to promote coordinated regional development, optimize regional development pattern, and alleviate environmental injustice.

2.2. Data Source

The 2018 land-use data were from China’s National Land Use and Cover Change (CNLUCC), with a resolution of 30 m. CNLUCC used Landsat remote sensing image data as the primary information source, which were obtained through visual interpretation, which was the most accurate land-use remote sensing monitoring data product in China [55]. The data included six primary types: arable land, forest land, grassland, water, construction land, and unused land. Population density data were from the WorldPop dataset with a resolution of 100 m. The population density data published by WorldPop were the most accurate and reliable long-time series data among the current mainstream population density maps in the world and were used by many international organizations [56]. China’s 2018 carbon emission per capita data are from the Emissions Database for Global Atmospheric Research (EDGAR) (https://edgar.jrc.ec.europa.eu/ accessed on 6 May 2021). EDGAR, because of its high citation rate and influence on the world carbon database, has become an authoritative reference material for scientific research and education, and is also the official data source for the International Panel on Climate Change’s Fifth Assessment Report [57]. The Chinese domestic carbon emissions trading pilot market price (23.5 CNY/ton) was obtained from the China Carbon Emissions Trading Network(http://www.tanpaifang.com/ accessed on 22 April 2021), a vertical portal for China’s carbon emissions trading industry. Engel coefficients were from the Statistical Yearbook and the 2018 Henan Provincial Consumption Development Report [58].

2.3. Methods

2.3.1. Quantifying Carbon Sequestration Supply and Demand

The carbon storage and sequestration module of the InVEST model were used to calculate the carbon sequestration (CS) in the study area. This module is based on the four major carbon pools (aboveground biomass, belowground biomass, dead, and soil organic matter) corresponding to different land types to calculate the total amount of carbon currently sequestered. In addition, there is another carbon pool, namely the wood products or forest by-products carbon pool. As this carbon pool is closely related to the frequency and type of rotation of forest products, it is difficult to obtain data. The calculation of this carbon pool is not addressed in this study. Land-use data and the carbon pool of Henan Province were inputed into the carbon module and run to obtain the current total CS. Land-use data were resampled to 100 × 100 m. Carbon pool referred to the previous study [59,60,61,62]. The specific formula for CS is as follows:
C t o t a l = ( C a b o v e + C b e l o w + C s o i l + C d e a d ) × A
where Ctotal is the total supply of CS of all land-use types, Cabove, Cbelow, Csoil, and Cdead are the carbon pool of aboveground biomass, belowground biomass, soil, and dead organic matter, respectively, and A is the area of different land-use types.
The understanding of ecosystem services demand varies between scholars. Many scholars define the ecosystem services demand as the number of services that society needs or desires [49,50,63,64,65]. This study adopts this view, considering that ecosystem services demand includes both products or services that are available or consumed and desired. Population density combined with average consumption rates is a common indicator [63]. Multiplying carbon emission per capita and population density data gives the CS demand in the study area. The specific formula for CS demand is as follows:
D c s = D c e × P o p
where Dcs is carbon demand, Dce is carbon emission per capita; Pop is population density.
In addition, this study defined an indicator to measure the ecological security of the region, which to some extent measures the potential of an area to provide ecosystem services to other areas, i.e., the difference between supply and demand of carbon sequestration (DSDCS). When DSDCS is greater than 0, the region is a carbon sink and supply is greater than demand. The environmental condition is good. Ecosystem services generated in this region can meet their own needs and serve other regions through spatial flow. Conversely, it is a carbon source where supply exceeds demand. The region is in a pattern of ecological deficit, and there is a trend of gradual deterioration of environmental conditions. Services outside the region need to be consumed to meet their needs. The formula is as follows:
D S D C S = C t o t a l D c s

2.3.2. Determination of Ecological Compensation Priority Sequence

There are apparent quantitative and qualitative differences in the ecosystem services and products of different regions. The core issues in improving the ecological compensation mechanism are balancing efficiency and equity, prioritizing ecological compensation, and reasonably allocating funds [66,67]. Typically, developed regions are less eager to obtain ecological compensation than poorer regions. Nevertheless, most of China’s carbon sequestration supply areas are very poor. The economic growth of poor areas depends mainly on the exploitation and use of natural resources, and the GDP per unit area is small. Moreover, the amount of ecological value per unit area in poor areas is large, and many development opportunity costs are lost to protect the environment. The demand for ecological compensation is more urgent. This paper introduced the ecological compensation priority sequence (ECPS). ECPS refers to the ratio of the non-market value of ecosystem services per unit area to GDP per unit area in a region, which indicates the urgency of obtaining ecological compensation in different regions [68]. The formula is as follows:
E C P S = V A L n G D P n  
where ECPS is the ecological compensation priority sequence, GDPn is gross domestic product per unit area, and VALn is the non-market value of ecosystem services per unit area. Carbon sequestration is a significant regulating service with non-market characteristics; here, VALn is the CS value. The lower ECPS indicates that the region’s economic situation is less affected by the payment of ecological compensation and should be the first to pay ecological compensation funds. Conversely, the region is lagging in economic development to provide good ecological services and should be given priority to receive ecological compensation paid by economically developed regions with lower ecosystem service value [69]. The ECPS in the study area was classified into five levels using the Jenks natural breaks method. The highest level was regarded as the ecological compensation receiving area (ECRA), and the lowest was regarded as the ecological compensation payment area (ECPA).

2.3.3. Quantifying Ecosystem Services Flow

Ecosystems are the providers of CS, and sources of carbon emissions are the demanders of CS. A surplus of CS is created when the CS supply in a given region exceeds the demand. The CS generated will become applicable outside the territory [70,71]. Carbon sequestration and emission are dynamic processes, and CS flows between regions. As CS flows spatially, beneficiaries in different regions receive services that vary and diminish in quantity and quality with increasing distance [72]. By studying CS flow, it is possible to establish the spatiotemporal links between the ECRAs and ECPAs and analyze the ecological compensation benefits of each ECRA. Chen [73] proposed comparative ecological radiation force (CERF) to analyze the ecosystem services flow by referring to the gravity model in physics and the breaking point formula [74]. CERF connotes the influence of ecosystem services in different areas within a particular region on external areas within different distances through spatial flows [73]. CERF positively correlates with the number of ecosystem services that an outer region obtains from that region. The formula is as follows:
E = e D i j H 1 + N i N j  
where E is the CERF, Dij is the distance between the ECPA i and the ECRA j. Ni and Nj are the DSDCS values for ECPA i and ECRA j, respectively. H is the maximum distance between different regions.

2.3.4. Quantifying the Amount of Ecological Compensation

The calculation of ecosystem services is the theoretical upper limit of ecological compensation. However, it is affected by multiple factors during the implementation process, which does not mean that the upper limit can be reached [71,75]. Currently, the calculated ecosystem services value is often too large. The influence of the local stage of economic development and public perception of society in each region can also significantly affect the ecological compensation results. Referring to Sun’s [75] study, an ecological value development coefficient was introduced to avoid the results obtained being too large. When regional socioeconomic development is lower, it is difficult for people to understand ecosystem services fully. With the improvement of social development, people’s demand for environmental comfort and the importance of ecological products and services will increase sharply. The ecological value development coefficient is similar to the S-type Pearl growth curve, which is combined with the stage of social development and people’s living standards and is calculated as follows:
E C = E S V × k  
E S V = D S D C S × B × P
k = 1 1 + e t  
t = 1 E n 3  
where EC is the amount of ecological compensation, ESV is the ecosystem services value that ECPAs should pay, B is the proportion of carbon sequestered that flows from ECRA to ECPA, P is the Chinese domestic carbon emissions trading pilot market price, k is the ecological value development coefficient, t is the stage of socioeconomic development, e is the natural constant, and En is the Engel coefficient.

3. Results

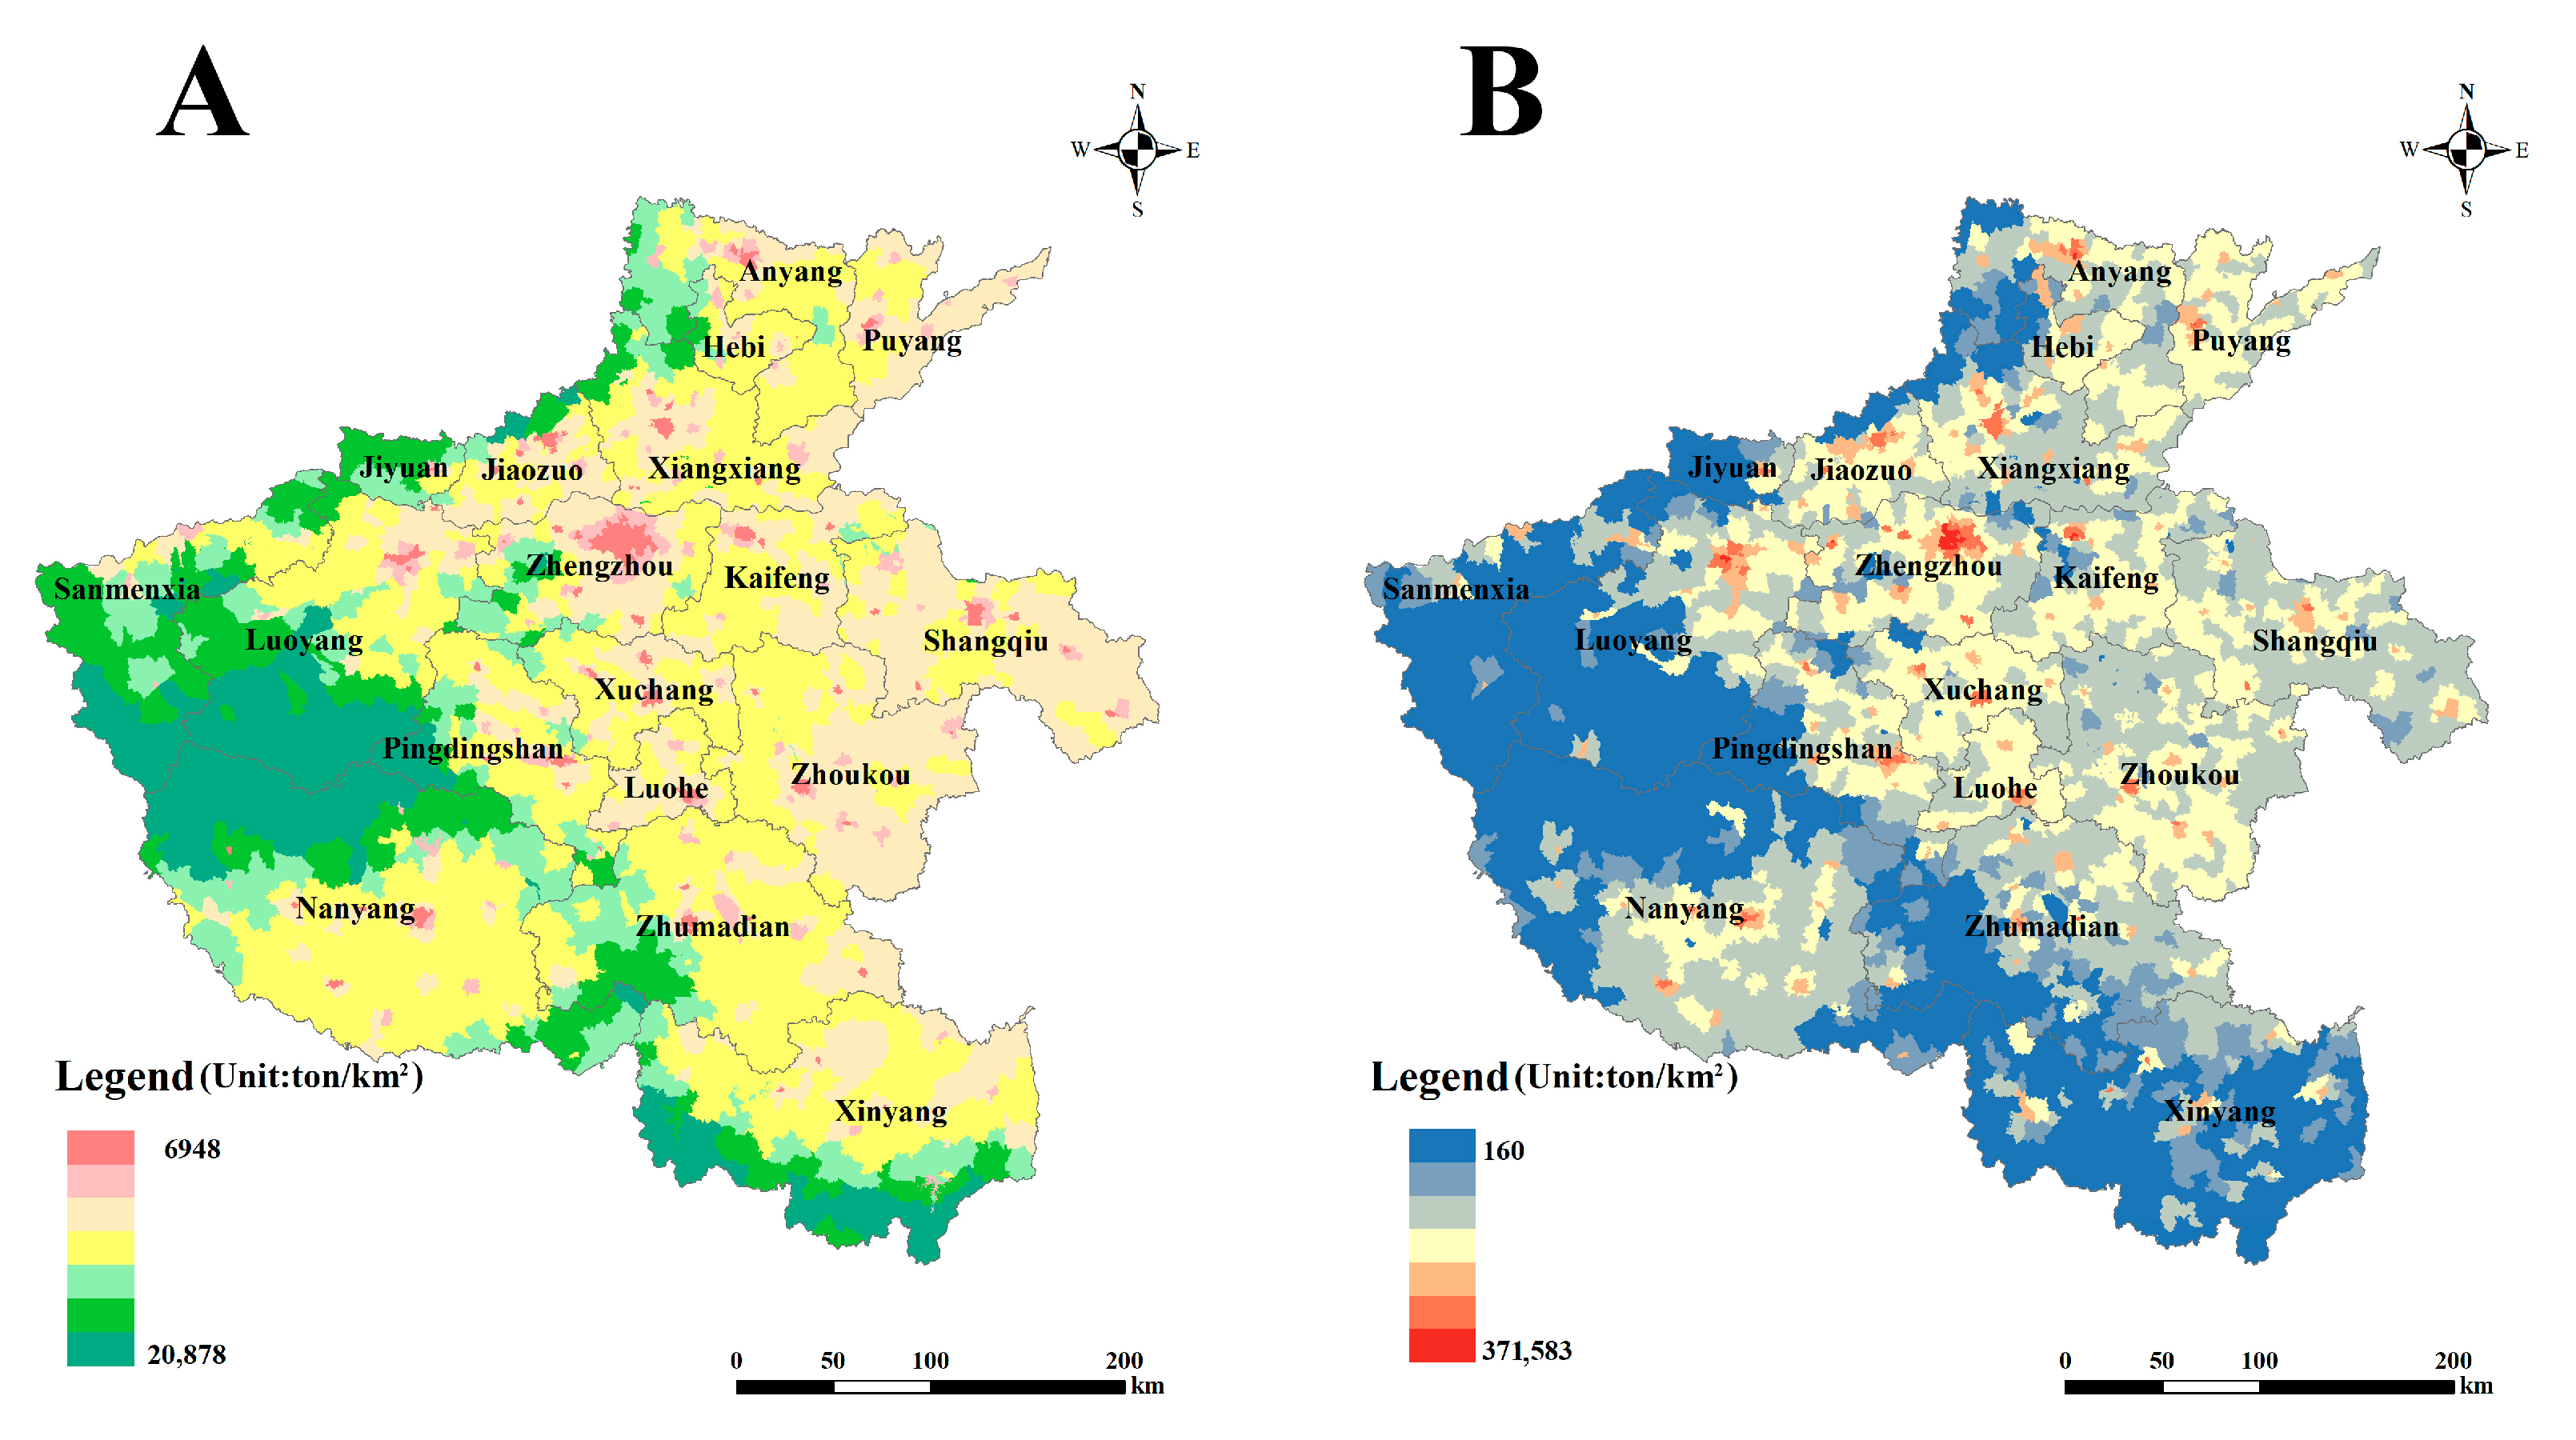
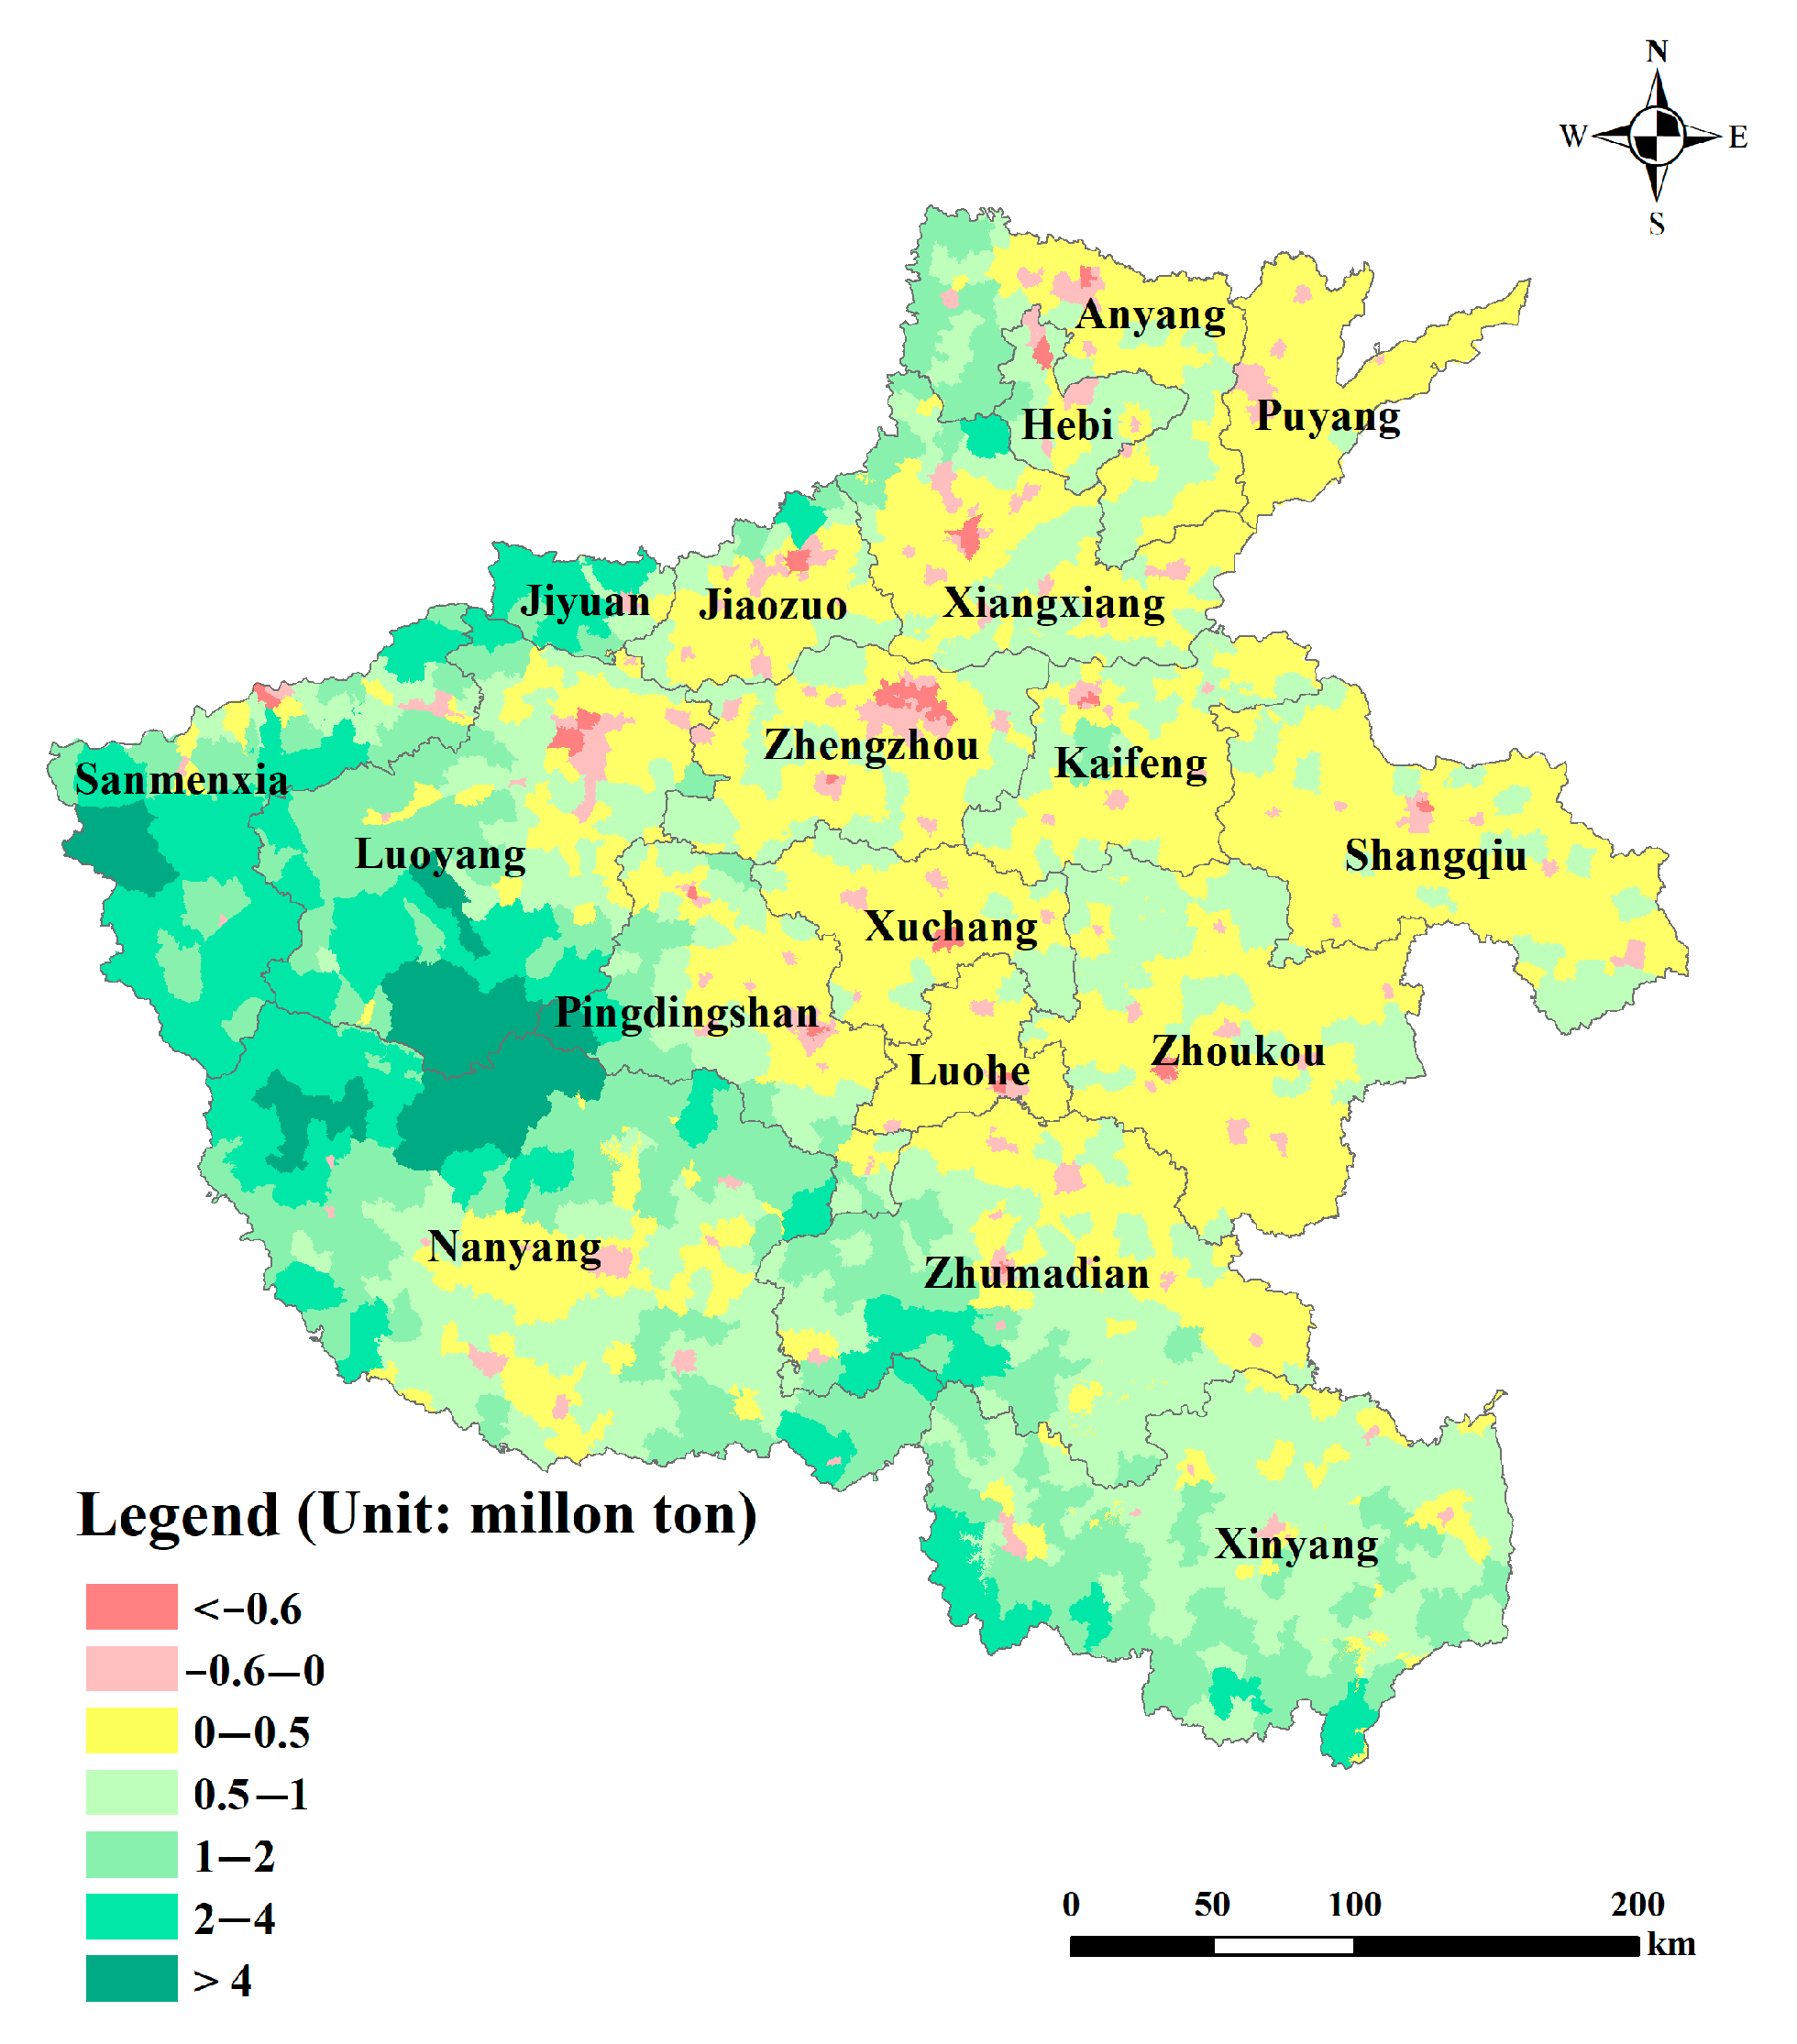
3.1. Spatial Differences in the Carbon Sequestration Supply and Demand

Significant spatial differences existed in the carbon sequestration supply and demand, with a strong negative correlation (Figure 2). Areas with strong supply generally had weaker demand, and vice versa. The high-supply areas were mainly concentrated in Nanyang, Sanmenxia, Luoyang, and Xinyang, with a supply capacity generally exceeding 11,500 ton/km2. These areas were the mountainous distribution areas of Henan. Some mountain ranges, including the Faniu Mountains, the Tongbai Mountains, and the Dabie Mountains, were treacherous, not easily exploited by humans, and had relatively good environmental conditions. These areas were densely covered with forests, which were the most vital regions of CS supply in Henan Province, and most of them exceeded 13,500 ton/km2. The maximum CS supply was 20,878 ton/km2 in Xinyang. The mountainous area was also the weakest for CS demand in Henan Province, with CS demand mostly less than 3000 ton/km2. The area with the weakest CS demand was located in Sanmenxia, with a value of 160 ton/km2. Areas where strong CS demand was mostly urban or prefectural cores, where the majority of the population was concentrated, and economic activity was intense. CS demand was generally greater than 36,000 ton/km2. The maximum CS demand was 371,583 ton/km2, which was located in Zhengzhou City. However, the lack of ecological land led to a weak supply, with CS supply mostly less than 8000 ton/km2. Most of Henan Province was in the North China Plain, a crucial grain-producing area in China. Crops also had some CS capacity during growth, but it was weaker than woodland types such as trees and shrubs. Although the agricultural areas were less densely populated than the urban core, there was also a demand for ecosystem services during agricultural production. CS supply in many plains areas was generally below 9500 ton/km2. CS demand was between 3000 and 12,000 ton/km2. The CS supply and demand in agricultural areas were moderate.

3.2. Spatial Distribution of Carbon Ecological Security

The DSDCS was positive in most areas of Henan Province, which indicated that the CS supply exceeded the demand and showed a decreasing trend with decreasing altitude (Figure 3). Most areas of Henan Province were in an ecological surplus pattern. The areas where supply far exceeded demand were mainly located in the Funiu Mountains. The DSDCS in these areas exceeded 4 Mt. The Funiu Mountains are the transition zone between the northern and southern climates of China and the mountains with the highest average elevation in Henan Province. As the watershed of the Yangtze, Yellow, and Huai rivers and the water source area of the Huai River, the Funiu Mountains are also the regions with the largest area of natural forests, the highest forest cover, the most extensive forest stock, and the widest variety of flora and fauna in Henan Province. The region has a high potential for CS, with relatively little human activity and a well-preserved natural ecology. Most human production activities are concentrated in cities, with carbon emissions from industry, construction, transport, and households far exceeding the region’s CS capacity. These cities were in an ecological deficit pattern, with DSDCS less than 0. Some economically developed urban cores, such as Zhengzhou, Xuchang, and Luoyang, were the areas with the most severe ecological deficits. DSDCS was generally less than 0.6 Mt. Furthermore, Henan Province is undergoing rapid urbanization. Urban expansion has led to the construction of infrastructure such as housing and transport, which has encroached heavily on vegetation and agricultural land previously used as a carbon sink [76]. Urban space is also not adequately utilized, increasing the proportion of private car commuting and travel, and carbon emissions from urban household consumption are rising yearly [77,78,79,80]. Cities are typically carbon source areas and must pay ecological compensation. DSDCS in the rest of Henan Province were between 0 and 1 Mt, which was at an intermediate level. This was inextricably linked to the topography of the plain. Arable land in Henan Province is large and widely distributed and is mostly planted with large field crops such as rice, wheat, and maize, which have high CS benefits, low CS costs, and unique ecological functions. Arable land is also an essential source of carbon sinks.

3.3. Ecological Compensation Priority Sequence in Different Regions

The results showed that ECPS in most parts of Henan Province were at levels 1 and 2, and ecological compensation was not urgent. Areas at levels 3, 4, and 5 were mainly concentrated in the west and south (Figure 4). These areas should be prioritized for ecological compensation. Some urban core areas were typical ECPAs and needed to be compensated for the lost development opportunities of other protected areas to adjust the distribution of ecological and economic benefits among the relevant stakeholders and promote inter-regional and inter-group equity and coordinated social development.
Due to a large number of stakeholders in ecological compensation, it is inconvenient to quantify the rights and obligations between ECPAs and ECRAs. Moreover, most of the ecological compensation currently implemented in China is concentrated between different main functional areas, upstream and downstream of watersheds, and different provinces or municipalities. Therefore, considering into account the actual situation in Henan Province, this study determined the ECPS in different areas at the municipal administrative unit. The results showed that the north-central region of Henan Province was a weak priority for ecological compensation. The lowest ECPS values were less than 1.965 × 10⁻³. Cities of medium urgency were located in the east and west (Figure 5). The areas with the highest ECPS were located in the south-western part of Henan Province. ECPS values were generally greater than 10.013 × 10⁻³. This study selected the areas with the highest and lowest ECPS as the ECRA and ECPA, respectively. The ECPA contains four cities: Jiaozuo, Zhengzhou, Xuchang, and Luohe. The ECRA contains three cities, namely Sanmenxia, Nanyang, and Xinyang.

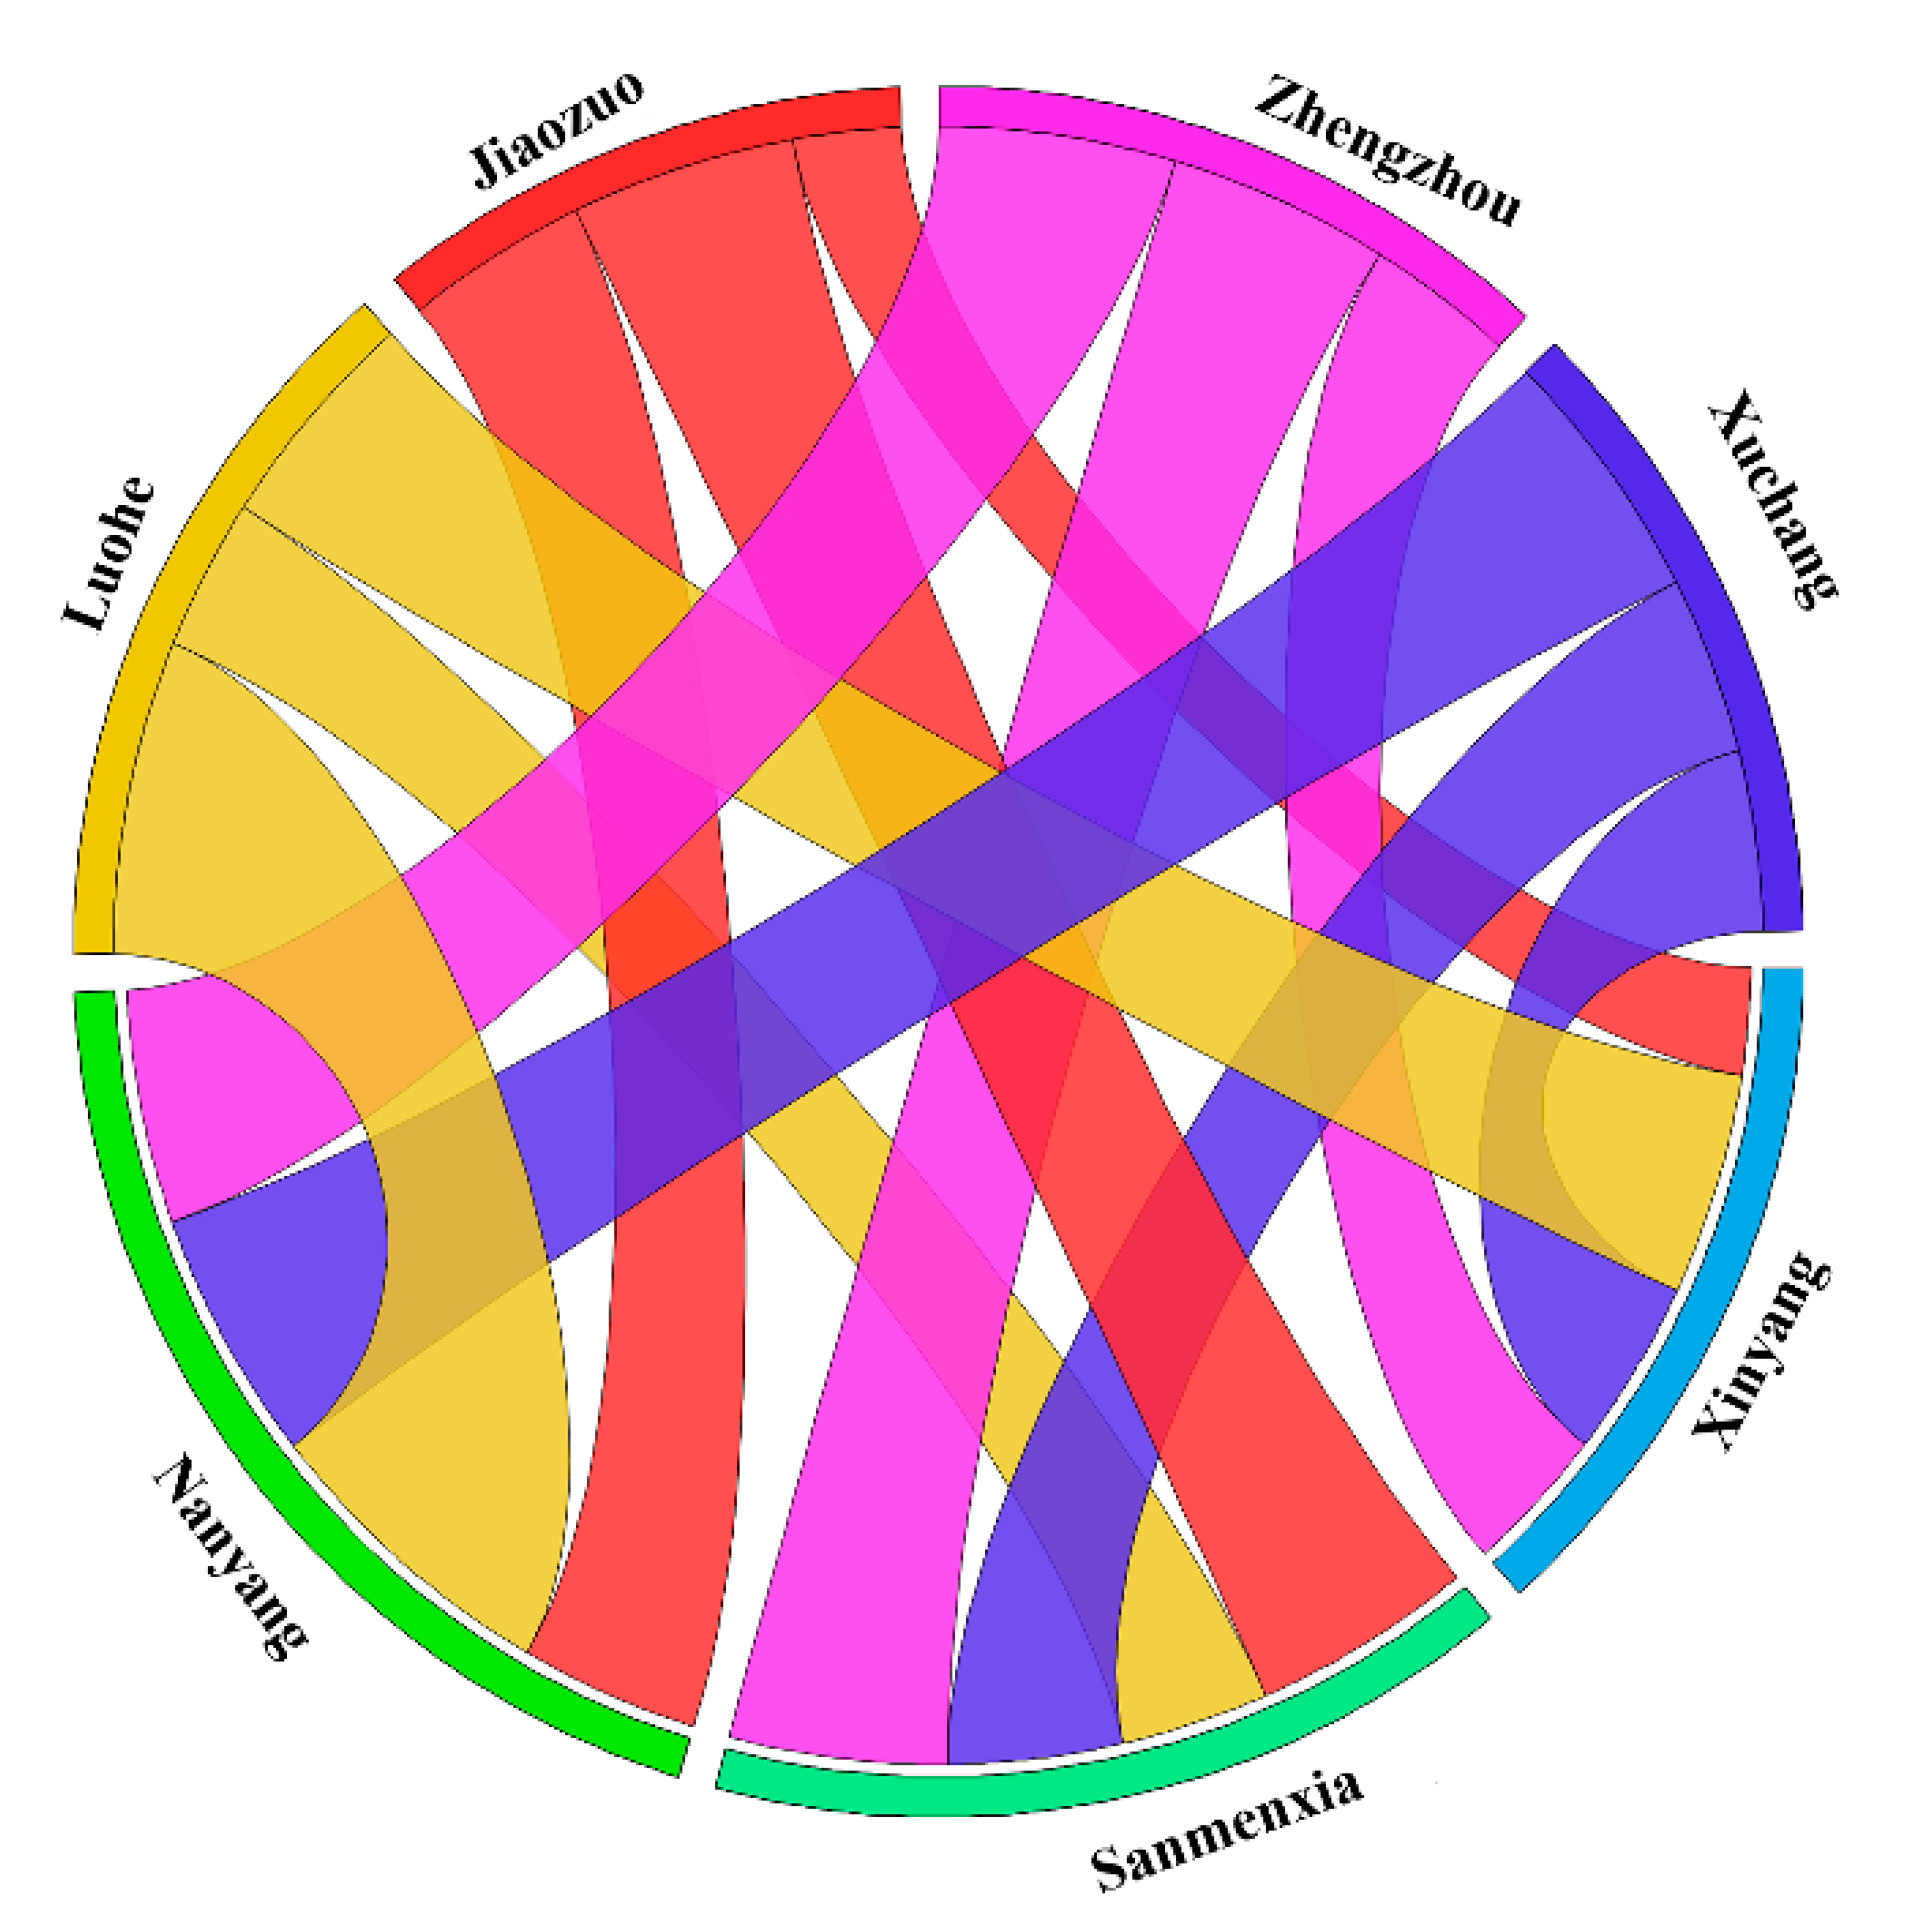
3.4. Determining the Amount of Ecological Compensation

Figure 6 illustrated the spatial flow of CS from different ECRAs to ECPAs. Sanmenxia had a large CERF for Jiaozuo and Zhengzhou and a small one for Luohe. Nanyang and Xinyang had the greatest CERF for Luohe and the least for Jiaozuo. Nanyang had the largest CERF, total ecosystem services flowing to external regions, and the highest ecological contribution to ECPAs. In addition, the study found that the outflow of ecosystem services from different ECRAs mostly decreased with increasing distance. Depending on the ecosystem services flow, the study also calculated separately ecological compensation amounts paid by ECPAs to ECRAs. The results showed that all four cities paid the highest ecological compensation to Nanyang (Figure 7). Besides Jiaozuo, Zhengzhou, Xuchang, and Luohe paid the second ecological compensation to Xinyang. Jiaozuo paid the least to Xinyang. Nanyang received the highest ecological compensation funds, amounting to CNY 4.069 billion. Sanmenxia and Xinyang also received CNY 1.948 and 2.556 billion, respectively.

4. Discussion

4.1. Optimizing Land Management to Achieve Carbon Neutrality

The results indicated that the CS supply in most areas of Henan Province was more significant than the demand. Terrestrial ecosystems store carbon within trees, biomass, and soils to reduce atmospheric CO2 emissions and contribute positively to carbon neutrality in China [81,82]. Indeed, natural and anthropogenic factors jointly influence the process of the ecosystem’s carbon cycle. However, anthropogenic-led changes in land-use cover affect the carbon cycle and carbon stocks to a far greater extent than natural factors [83,84]. Terrestrial ecosystems such as forests, green spaces, and swamps have a greater capacity for organic CS than inorganic CS, such as atmospheric transport and carbonate dissolution. According to current research, different land-use types lead to a wide variation in the CS capacity of ecosystems. The CS capacity of different ecosystems is expressed from largest to smallest: forest > grassland > wetland > agricultural land > unused land and construction land [85]. However, non-benign land-use cover changes, including fire, deforestation, and vegetation degradation, can cause significant disturbance to ecosystems and lead to a decline in carbon sinks [86]. Conversely, land-use change management measures such as forest conservation and ecological agriculture can lead to significant CS, significantly increasing the CS capacity of ecosystems [87,88]. China needs to achieve the goal of carbon neutrality by fully optimizing land management and exploiting the vast benefits of sink increase. For Henan Province, the concept of low-carbon development is used to guide the spatial planning and use the control, scientific regulation, and management of land-use purpose and mode. Plain agricultural areas should build high-standard farmland, ensure the stability of the cultivated land, focus on land degradation, improve soil properties through ecological restoration, increase the content of soil organic matter, and restore and enhance the potential of soil CS. Important ecosystems such as forests, grasslands, and wetlands need to be protected to reduce the occupation of ecological land. Greening of slopes, wastelands, and abandoned mines should be carried out to increase the total amount of vegetation resources. Governments must also adapt to local conditions to determine the types of potential ecosystems suitable for planting in each region. On this basis, the most suitable vegetation types can be planted. With full use of the power of nature, scientific and rational management of these vegetation types can maximize carbon sinks.
It is important to note that neither excess supply nor demand is necessarily a good situation. Each supply–demand situation has a relatively desirable level, determined by the interrelationship between environmental protection and regional development [89]. The western and southern parts of Henan Province are concentrated in contiguous particular hardship areas in China, and the use of natural resources is too inefficient, limiting the region’s development. The people aspire to a happy life, and development remains the primary goal in these regions. While obtaining external ecological compensation, these regions should promote the scientific and rational use of regional natural resources and moderate urbanization to achieve sustainable regional development. Some urban cores in Henan Province need to control the scale and speed of urban development and focus on ecological restoration and construction to alleviate the severe supply–demand imbalance.

4.2. Inadequacies of Ecological Compensation and Directions for Improvement

The core of ecological compensation lies in the ecosystem services flow. Using ecosystem services flow, decision-makers can better identify ECRA and ECPA, which provides a meaningful way to establish cross-regional carbon transfer payment mechanisms and address regional ecological inequalities [71]. If the ECRA wants to obtain more ecological compensation, more extraordinary protection efforts must be made to improve regional ecosystem services. ECPA can also increase environmental protection input to improve the region’s ecosystem services and to reduce the compensation to other areas. This method can stimulate enthusiasm for environmental protection in various regions and realize the region’s sustainable development. Based on the carbon compensation in Henan, this study identified the relevant subjects that pay and receive compensation and the amount of ecological compensation. However, since ecological compensation involves many stakeholders with numerous and highly complex relationships, it is difficult to precisely locate the responsibilities and obligations of protectors and beneficiaries for each piece of land and each individual. Stakeholders in some countries are unlikely to be willing to voluntarily make significant investments or subsidize carbon-neutral activities, considering their income [90,91,92]. Unlike these countries, ecological compensation in China is mainly paid by the government, lack social funding, and the subsidy level is relatively low [93]. Statistics show that as of 2016, 157 compensation projects were being implemented, with an annual compensation amount of about CNY 180 billion. The proportion of funds invested by the central and local finances reached 87% and 12%, respectively, which exacerbated the financial pressure [94]. Moreover, the ecological compensation policy in China is time-limited, which leads to insufficient continuity of the policy [95]. The corresponding policy can only be effective in a specific area and time, and it is difficult to fully realize the purpose. Based on the original national ecological compensation policy, it is necessary to change the past single compensation model, introduce multiple financing channels, attract private capital, and mobilize market resources to participate in the construction of ecological compensation mechanism [96,97]. For example, green finance can be introduced into ecological compensation through a market-based model to increase farmers’ “ecological income” [98]. It is also possible to promote green compensation and build a market-oriented compensation mechanism by guiding the regional transfer of resources such as capital and technology. Currently, China has successively eight carbon emission trading pilots similar to the European Union Emissions Trading Scheme (EU-ETS) and the New Zealand Emissions Trading Scheme (NZ-ETS). In July 2021, China’s carbon emission trading market opened. The cumulative volume of carbon emission allowances traded last year was 179 million tons, with a cumulative turnover of CNY 7.661 billion. The Carbon market has bridged the gap between carbon sources (buying carbon) and carbon sinks (selling carbon), realizing the ecological compensation function and poverty alleviation function [99].

4.3. Coupling Ecological Infrastructure to Stabilize Ecosystem Services Flow

The essence of ecosystem services flow is the spatiotemporal process of ecosystem services relying on certain carriers, driven by natural or anthropogenic factors, and transmitted to the consumption domain along with certain directions and paths, which is a coupling of ecosystem patterns, functions, and processes [100,101]. Ecological infrastructure is a naturally functioning ecosystem that can effectively perform ecosystem functions and provide effective ecosystem services to humans and can be considered an important spatial carrier of ecosystem services flow. Cities are the core of national and regional social development and have the densest population and highest intensity of human activities. In this study, many cities in Henan Province were severely overloaded with supply and demand, threatening regional ecological security. In addition to the excessive demand for ecosystem services by aggregated populations, high-intensity human activities fragment urban ecological infrastructure, leading to disruptions in ecological processes and reduced effectiveness and mobility of ecosystem services [102,103]. Protecting and building key ecological infrastructure through investments to address imbalances between supply and demand of ecosystem services, spatial mismatches, and typological mismatches caused by disrupted ecosystem services flow is a spatial solution to fully realize the ecological and social benefits of ecosystem services [104,105,106]. On the one hand, corresponding environmental protection measures can be taken for urban green space, forestry and agricultural systems, and nature reserve systems to ensure the effective supply of ecosystem services. More importantly, ecosystem services flow can identify the transfer pathways of ecological goods and services between natural ecosystems and human socioeconomic systems and determine the key zones affecting the transfer of ecosystem services [71,107,108]. Areas in the direction and path of flow should be more important areas for ecological infrastructure construction to build stable supply and demand networks for biological, material, and energy flows. However, many current ecological infrastructure studies focus on identifying key ecological reserves and ecological restoration areas in the region based on static assessments of ecological status and calculating the socio-ecological benefits and returns on investment from conservation and restoration [109,110]. This lacks consideration of the dynamics and complexity of ecosystems and ignores the complex supply and demand relationships between ecosystems and socioeconomic systems. In the future study, based on of spatial quantification of ecosystem service flows, the concepts of ecosystem services flow, and ecological corridors in ecological infrastructure can be coupled to form an ecological infrastructure network that realizes the integration of the supply, flow, and demand of ecosystem services, ensuring the effectiveness and sustainability of ecosystem services flow and safeguarding regional ecological security [111].

4.4. Methodological Limitations and Challenges for Future Research

Carbon compensation is a new field of ecological compensation developed in global change and low-carbon development [41]. This paper adopted the theory of carbon balance, externality, ecological service, and carbon trading mechanism to propose the theoretical framework of ecological compensation, roughly determined the responsibilities of different stakeholders in cross-regional carbon compensation based on CS supply, demand, and flow, introduced ECPS model to quantify the urgency of regional ecological compensation, monetized the ecosystem services from the ECRA to ECPA and calculated the differentiated ecological compensation amount. The conclusions can provide a basis for establishing an ecological compensation mechanism, carbon reduction and sequestration, and low carbon development in the context of carbon neutrality in Henan Province. However, this study was restricted to the administrative boundary and did not consider the ecosystem services flow between Henan Province and other regions. Moreover, although the carbon compensation results accounted for the loss of CS during the flow process, the uncertainty of atmospheric motion made it difficult to establish compensation relationships among stakeholders. There are obvious spatial differences among regions regarding the natural environment, industrial development, resource abundance, and environmental pressure, making it difficult to accurately locate the responsibilities and obligations of protectors and beneficiaries for each piece of land and each person [112,113]. Different populations’ differentiated ecosystem services demand also increased the uncertainty of the results. Overall, the value and significance of this study are to explore a carbon compensation model based on carbon balance and ecosystem service theory. Future studies should combine atmospheric transport models and social survey information to focus on the flow, direction, lowered cost, and differentiated needs of different populations of ecosystem services flow, which is the key to transforming ecosystem services into human well-being [114,115].

5. Conclusions

The results indicated that the terrain greatly affected the carbon sequestration supply and demand in Henan Province. Mountains were mostly high-supply areas, while plains and cities had a high demand for carbon sequestration. The CS supply and demand had a strong negative correlation. Thanks to Henan Province’s environmental conditions, DSDCS was positive in most areas, and many areas had an ecological surplus pattern. Except for a small part of urban core areas, the CS supply exceeded the demand in other areas. Future land-use optimization strategies such as building high-standard farmland, implementing ecological restoration, and protecting natural ecosystems can increase carbon sinks and achieve carbon neutrality. The western and southern parts of Henan Province had the highest EPCS and urgently needed ecological compensation. Nanyang had the largest CERF and CS flow to external areas and the highest ecological contribution to ECPA. The highest ecological compensation fund was obtained with CNY 4.069 billion. Based on protecting and building critical ecological infrastructure and ensuring the effectiveness and sustainability of ecosystem services flow, optimizing national ecological compensation policies, and establishing diversified ecological compensation mechanisms are the keys to achieving carbon ecological compensation.

Author Contributions

Conceptualization, T.Z. and L.H.; methodology, Y.C.; software, M.C.; validation, T.Z., L.H. and Y.C.; formal analysis, E.C.; investigation, Y.M.; resources, G.D.; data curation, Y.C.; writing—original draft preparation, T.Z. and Y.C.; writing—review and editing T.Z., L.W., C.Z. and M.F.N.; visualization, L.H.; supervision, T.Z.; project administration, T.Z.; funding acquisition, T.Z. and L.L. All authors have read and agreed to the published version of the manuscript.

Funding

This work was funded by the National Natural Science Foundation of China (Grant No. 42101298 and 42077004) and the special fund for young talents of Henan Agricultural University (Grant No. 30500956).

Institutional Review Board Statement

Not applicable.

Informed Consent Statement

Not applicable.

Data Availability Statement

Not applicable.

Conflicts of Interest

The authors declare no conflict of interest.

References

  1. Rodhe, H. A comparison of the contribution of various gases to the greenhouse effect. Science 1990, 248, 1217–1219. [Google Scholar] [CrossRef] [PubMed]
  2. Vetharaniam, I.; Timar, L.; Stanley, C.J.; Müller, K.; van den Dijssel, C.; Clothier, B. Modelling climate change impacts on location suitability and spatial footprint of apple and kiwifruit. Land 2022, 11, 1639. [Google Scholar] [CrossRef]
  3. Guo, X.; Fang, C. Integrated Land Use Change Related Carbon Source/Sink Examination in Jiangsu Province. Land 2021, 10, 1310. [Google Scholar] [CrossRef]
  4. Du, M.; Zhang, X.; Xia, L.; Cao, L.; Zhang, Z.; Zhang, L.; Zheng, H.; Cai, B. The China Carbon Watch (CCW) system: A rapid accounting of household carbon emissions in China at the provincial level. Renew. Sustain. Energy Rev. 2021, 155, 111825. [Google Scholar] [CrossRef]
  5. Liu, J.; Murshed, M.; Chen, F.; Shahbaz, M.; Kirikkaleli, D.; Khan, Z. An empirical analysis of the household consumption-induced carbon emissions in China. Sustain. Prod. Consum. 2021, 26, 943–957. [Google Scholar] [CrossRef]
  6. Wu, J.; Li, B. Spatio-temporal evolutionary characteristics of carbon emissions and carbon sinks of marine industry in China and their time-dependent models. Mar Policy 2022, 135, 104879. [Google Scholar] [CrossRef]
  7. Qin, L.; Malik, M.Y.; Latif, K.; Khan, Z.; Siddiqui, A.W.; Ali, S. The salience of carbon leakage for climate action planning: Evidence from the next eleven countries. Sustain. Prod. Consum. 2021, 27, 1064–1076. [Google Scholar] [CrossRef]
  8. Wang, Y.; Wang, X.; Chen, W.; Qiu, L.; Wang, B.; Niu, W. Exploring the path of inter-provincial industrial transfer and carbon transfer in China via combination of multi-regional input–output and geographically weighted regression model. Ecol. Indic. 2021, 125, 107547. [Google Scholar] [CrossRef]
  9. Tang, W.; Cui, L.; Zheng, S.; Hu, W. Multi-Scenario Simulation of Land Use Carbon Emissions from Energy Consumption in Shenzhen, China. Land 2022, 11, 1673. [Google Scholar] [CrossRef]
  10. Zhao, X.; Liu, C.; Sun, C.; Yang, M. Does stringent environmental regulation lead to a carbon haven effect? Evidence from carbon-intensive industries in China. Energy Econ. 2020, 86, 104631. [Google Scholar] [CrossRef]
  11. Shen, J.; Wang, S.; Liu, W.; Chu, J. Does migration of pollution-intensive industries impact environmental efficiency? Evidence supporting “Pollution Haven Hypothesis”. J. Environ. Manag. 2019, 242, 142–152. [Google Scholar] [CrossRef] [PubMed]
  12. Nathaniel, S.; Aguegboh, E.; Iheonu, C.; Sharma, G.; Shah, M. Energy consumption, FDI, and urbanization linkage in coastal Mediterranean countries: Re-assessing the pollution haven hypothesis. Environ. Sci. Pollut. Res. 2020, 27, 35474–35487. [Google Scholar] [CrossRef] [PubMed]
  13. He, W.; Liu, D.; Wang, C. Are Chinese provincial carbon emissions allowances misallocated over 2000–2017? Evidence from an extended Gini-coefficient approach. Sustain. Prod. Consum. 2022, 29, 564–573. [Google Scholar] [CrossRef]
  14. Peng, H.; Qi, S.; Cui, J. The environmental and economic effects of the carbon emissions trading scheme in China: The role of alternative allowance allocation. Sustain. Prod. Consum. 2021, 28, 105–115. [Google Scholar] [CrossRef]
  15. Wang, W.; Hu, Y. The measurement and influencing factors of carbon transfers embodied in inter-provincial trade in China. J. Clean. Prod. 2020, 270, 122460. [Google Scholar] [CrossRef]
  16. Shi, M.J.; Wang, Y.; Zhang, Z.Y.; Zhou, X. Regional carbon footprint and interregional transfer of carbon emissions in China. Acta Geogr. Sin. 2012, 67, 1327–1338. [Google Scholar] [CrossRef]
  17. Zhou, D.; Zhou, X.; Xu, Q.; Wu, F.; Wang, Q.; Zha, D. Regional embodied carbon emissions and their transfer characteristics in China. Struct. Chang. Econ. D 2018, 46, 180–193. [Google Scholar] [CrossRef]
  18. Jing, X.; Tian, G.; Li, M.; Javeed, S.A. Research on the Spatial and Temporal Differences of China’s Provincial Carbon Emissions and Ecological Compensation Based on Land Carbon Budget Accounting. Int. J. Environ. Res. Public Health 2021, 18, 12892. [Google Scholar] [CrossRef]
  19. Evans, G.; Phelan, L. Transition to a post-carbon society: Linking environmental justice and just transition discourses. Energy Policy 2016, 99, 329–339. [Google Scholar] [CrossRef]
  20. Lejano, R.P.; Kan, W.S.; Chau, C.C. The hidden disequities of carbon trading: Carbon emissions, air toxics, and environmental justice. Front. Environ. Sci. 2020, 8, 593014. [Google Scholar] [CrossRef]
  21. Wang, L.; Ding, C.; Peng, J.; Li, W. Comparison of factors affecting tourism operators’ carbon offset willingness of forest parks. Econ. Geogr. 2020, 40, 230–238. [Google Scholar] [CrossRef]
  22. Zhou, P.; Wen, W. Carbon-constrained firm decisions: From business strategies to operations modeling. Eur. J. Oper. Res. 2020, 281, 1–15. [Google Scholar] [CrossRef]
  23. Ma, M.; Li, Q.; Zhou, W. The Study of Carbon Ecological Compensation in Yellow River Basin Based on carbon neutrality. Yellow River 2021, 43, 5–11. [Google Scholar] [CrossRef]
  24. Duarte, C.M.; Losada, I.J.; Hendriks, I.E.; Mazarrasa, I.; Marbà, N. The role of coastal plant communities for climate change mitigation and adaptation. Nat. Clim. Chang. 2013, 3, 961–968. [Google Scholar] [CrossRef] [Green Version]
  25. Yu, B.; Xu, L.; Yang, Z. Ecological compensation for inundated habitats in hydropower developments based on carbon stock balance. J. Clean. Prod. 2016, 114, 334–342. [Google Scholar] [CrossRef]
  26. Weng, Q.; Xu, H. A review of China’s carbon trading market. Renew. Sustain. Energy Rev. 2018, 91, 613–619. [Google Scholar] [CrossRef]
  27. Xiong, C.; Yang, D.; Huo, J.; Zhao, Y. The Relationship between Agricultural Carbon Emissions and Agricultural Economic Growth and Policy Recommendations of a Low-carbon Agriculture Economy. Pol. J. Environ. Stud. 2016, 25, 2187–2195. [Google Scholar] [CrossRef]
  28. Herr, D.; Blum, J.; Himes-Cornell, A.; Sutton-Grier, A. An analysis of the potential positive and negative livelihood impacts of coastal carbon offset projects. J. Environ. Manag. 2019, 235, 463–479. [Google Scholar] [CrossRef]
  29. Sapkota, Y.; White, J.R. Carbon offset market methodologies applicable for coastal wetland restoration and conservation in the United States: A review. Sci. Total Environ. 2020, 701, 134497. [Google Scholar] [CrossRef]
  30. Wünscher, T.; Engel, S.; Wunder, S. Spatial targeting of payments for environmental services: A tool for boosting conservation benefits. Ecol. Econ. 2008, 65, 822–833. [Google Scholar] [CrossRef]
  31. Yang, G.; Shang, P.; He, L.; Zhang, Y.; Wang, Y.; Zhang, F.; Zhu, L.; Wang, Y. Interregional carbon compensation cost forecast and priority index calculation based on the theoretical carbon deficit: China as a case. Sci. Total Environ. 2019, 654, 786–800. [Google Scholar] [CrossRef] [PubMed]
  32. Neeff, T.; de Alencastro Graça, P.M.; Dutra, L.V.; Da Costa Freitas, C. Carbon budget estimation in Central Amazonia: Successional forest modeling from remote sensing data. Remote Sens. Environ. 2005, 94, 508–522. [Google Scholar] [CrossRef]
  33. Miao, Y.; Kong, C.; Wang, L.; Mu, J.; Lu, X.; Bao, J.; Li, H. A provincial lateral carbon emissions compensation plan in China based on carbon budget perspective. Sci. Total Environ. 2019, 692, 1086–1096. [Google Scholar] [CrossRef]
  34. Yan, F.; Wang, Y.; Du, Z.; Chen, Y.; Chen, Y. Quantification of ecological compensation in Beijing-Tianjin-Hebei based on carbon footprint calculated using emission factor method proposed by IPCC. Trans. Chin. Soc. Agric. Eng. 2018, 34, 15–20. [Google Scholar] [CrossRef]
  35. Yu, J.K.; Yang, Z.K.; Shao, G.L. Analysis on carbon compensation amount of carbon sink fisheries cased on shadow price model: Take seawater shellfish aquaculture industry of Shandong Province as an example. Agric. Econ. Manag. 2011, 10, 83–90. [Google Scholar] [CrossRef]
  36. Rochecouste, J.; Dargusch, P.; King, C. Farmer perceptions of the opportunities and constraints to producing carbon offsets from Australian dryland grain cropping farms. Australas. J. Environ. Manag. 2017, 24, 441–452. [Google Scholar] [CrossRef]
  37. Ritchie, B.W.; Kemperman, A.; Dolnicar, S. Which types of product attributes lead to aviation voluntary carbon offsetting among air passengers? Tour. Manag. 2021, 85, 104276. [Google Scholar] [CrossRef]
  38. Sun, X.; Zeng, J.; Chen, S.; Yang, Z.; Luo, J. Ecological Compensation Payment Order with Considering the Ecological Profit and LossThe Case of Hubei Province. Econ. Geogr. 2018, 38, 170–178. [Google Scholar] [CrossRef]
  39. Zhao, R.Q.; Liu, Y.; Lin, M.A.; Yu-Xiang, L.I.; Hou, L.P.; Zhang, Z.P.; Ding, M.L. County-level Carbon Compensation of Henan Province Based on Carbon Budget Estimation. J. Nat. Resour. 2016, 31, 1675–1687. [Google Scholar] [CrossRef]
  40. Hu, X.F.; Zou, Y.; Fu, C. Spatial and temporal patterns of the ecological compensation criterion in Jiangxi Province, China based on carbon footprint. J. Appl. Ecol. 2017, 28, 493–499. [Google Scholar] [CrossRef]
  41. Wang, W.; Wang, W.; Xie, P.; Zhao, D. Spatial and temporal disparities of carbon emissions and interregional carbon compensation in major function-oriented zones: A case study of Guangdong province. J. Clean. Prod. 2020, 245, 118873. [Google Scholar] [CrossRef]
  42. Zhao, R.Q.; Liu, Y.; Li, Y.X.; Ding, M.L.; Zhang, Z.P.; Chuan, X.W.; Jiao, S.X. Overview of regional carbon compensation: Mechanism, pattern and policy suggestions. Areal. Res. Dev. 2015, 34, 116–120. [Google Scholar] [CrossRef]
  43. Yin, Y.; Jiang, Z.; Liu, Y.; Yu, Z. Factors affecting carbon emission trading price: Evidence from China. Emerg. Mark. Financ. Trade 2019, 55, 3433–3451. [Google Scholar] [CrossRef]
  44. Jiang, W.; Zhang, S. Robust estimation and application of shadow price of CO2: Evidence from China. Manag. World 2018, 38, 5178–5186. [Google Scholar] [CrossRef]
  45. Li, H.; Peng, J.; Hu, Y.; Wu, W. Ecological function zoning in Inner Mongolia Autonomous Region based on ecosystem service bundles. Chin. J. Appl. Ecol. 2017, 28, 2657–2666. [Google Scholar] [CrossRef]
  46. Yuan, K.H.; Zhang, M.; Gan, C.L.; Chen, Y.R.; Zhu, Q.Y.; Yang, H.L. Provincial Eco-Compensation of Carbon Based on the Target of Carbon Emission Reduction. Resour. Environ. Yangtze Basin 2019, 28, 21–29. [Google Scholar] [CrossRef]
  47. Zhu, H.; Zhang, Y.; Chen, Y.; Zhao, M.; Bo, C. Constructing a Model of Government Purchasing of Ecological Services: Evidence from China’s Northeast Tiger and Leopard National Park. Land 2022, 11, 1737. [Google Scholar] [CrossRef]
  48. Gao, X.; Huang, B.; Hou, Y.; Xu, W.; Zheng, H.; Ma, D.; Ouyang, Z. Using ecosystem service flows to inform ecological compensation: Theory & application. Int. J. Environ. Res. Public Health 2020, 17, 3340. [Google Scholar] [CrossRef]
  49. Villamagna, A.M.; Angermeier, P.L.; Bennett, E.M. Capacity, pressure, demand, and flow: A conceptual framework for analyzing ecosystem service provision and delivery. Ecol. Complex 2013, 15, 114–121. [Google Scholar] [CrossRef]
  50. Schröter, M.; Barton, D.N.; Remme, R.P.; Hein, L. Accounting for capacity and flow of ecosystem services: A conceptual model and a case study for Telemark, Norway. Ecol. Indic. 2014, 36, 539–551. [Google Scholar] [CrossRef]
  51. Dang, K.B.; Burkhard, B.; Vu, K.C. Potential, flow and demand of rice provisioning ecosystem services–Case study in Sapa district, Vietnam. Ecol. Indic. 2020, 118, 106731. [Google Scholar] [CrossRef]
  52. Chen, D.; Li, J.; Yang, X.; Zhou, Z.; Pan, Y.; Li, M. Quantifying water provision service supply, demand and spatial flow for land use optimization: A case study in the YanHe watershed. Ecosyst. Serv. 2020, 43, 101117. [Google Scholar] [CrossRef]
  53. Vigl, L.E.; Depellegrin, D.; Pereira, P.; de Groot, R.; Tappeiner, U. Mapping the ecosystem service delivery chain: Capacity, flow, and demand pertaining to aesthetic experiences in mountain landscapes. Sci. Total Environ. 2017, 574, 422–436. [Google Scholar] [CrossRef] [PubMed]
  54. The Average Annual Growth Rate of Henan’s Total Economic Output Has Been 7.1% in the Past Ten Years. Available online: https://baijiahao.baidu.com/s?id=1744801864798874469&wfr=spider&for=pc (accessed on 24 September 2021).
  55. Remote Sensing Monitoring Data of Land Use in China. Available online: https://www.resdc.cn/data.aspx?DATAID=97 (accessed on 5 December 2021).
  56. Lin, D.; Tan, M.; Liu, K.; Liu, L.; Zhu, Y. Accuracy comparison of four gridded population datasets in Guangdong Province, China. Trop. Geogr. 2020, 40, 346–356. [Google Scholar] [CrossRef]
  57. Li, Q.; Su, Y.; Shang, L.; Wei, W.; Wang, M. Comparison analysis of China’s emissions accounting by typical international carbon databases. Adv. Clim. Chang. Res. 2018, 14, 275. [Google Scholar] [CrossRef]
  58. Henan Provincial Consumption Development Report. Available online: http://www.henan.gov.cn/zwgk/zfxxgk/fdzdgknr/tjxx/tjnj/ (accessed on 19 April 2022).
  59. Delaney, M.; Brown, S.; Lugo, A.E.; Torres Lezama, A.; Quintero, N.B. The quantity and turnover of dead wood in permanent forest plots in six life zones of Venezuela 1. Biotropica 1998, 30, 2–11. [Google Scholar] [CrossRef]
  60. Chuai, X.W.; Huang, X.J.; Zheng, Z.Q.; Zhang, M.; Liao, Q.; Lai, L.; Lu, J. Land use change and its influence on carbon storage of terrestrial ecosystems in Jiangsu Province. Resour. Sci. 2011, 33, 1932–1939. [Google Scholar]
  61. Mokany, K.; Raison, R.J.; Prokushkin, A.S. Critical analysis of root: Shoot ratios in terrestrial biomes. Glob. Chang. Biol. 2006, 12, 84–96. [Google Scholar] [CrossRef]
  62. Shi, S. Spatio-Temporal Evolution of Land Use Carbon Storage in the Huang-Huai-Hai Plain. Master’s Thesis, Hubei University, Wuhan, China, 2018. [Google Scholar]
  63. Burkhard, B.; Kroll, F.; Nedkov, S.; Müller, F. Mapping ecosystem service supply, demand and budgets. Ecol. Indic. 2012, 21, 17–29. [Google Scholar] [CrossRef]
  64. Kroll, F.; Müller, F.; Haase, D.; Fohrer, N. Rural–urban gradient analysis of ecosystem services supply and demand dynamics. Land Use Policy 2012, 29, 521–535. [Google Scholar] [CrossRef]
  65. Peng, J.; Yang, Y.; Xie, P.; Liu, Y.X. Zoning for the construction of green space ecological networks in Guangdong Province based on the supply and demand of ecosystem services. Acta Ecol. Sin. 2017, 37, 4562–4572. [Google Scholar] [CrossRef]
  66. Hou, L.; Xia, F.; Chen, Q.; Huang, J.; He, Y.; Rose, N.; Rozelle, S. Grassland ecological compensation policy in China improves grassland quality and increases herders’ income. Nat. Commun. 2021, 12, 4683. [Google Scholar] [CrossRef]
  67. Xu, J.; Xiao, Y.; Xie, G.; Liu, J.; Qin, K.; Wang, Y.; Zhang, C.; Lei, G. How to coordinate cross-regional water resource relationship by integrating water supply services flow and interregional ecological compensation. Ecol. Indic. 2021, 126, 107595. [Google Scholar] [CrossRef]
  68. Wang, N.; Liu, J.; Wu, D.; Gao, S.; Wang, R. Regional eco-compensation based on ecosystem service assessment: A case study of Shandong province. Acta Ecol. Sin. 2010, 30, 6646–6653. [Google Scholar]
  69. Gao, X.; Shen, J.; He, W.; Sun, F.; Zhang, Z.; Zhang, X.; Zhang, C.; Kong, Y.; An, M.; Yuan, L. Changes in ecosystem services value and establishment of watershed ecological compensation standards. Int. J. Environ. Res. Public Health 2019, 16, 2951. [Google Scholar] [CrossRef] [Green Version]
  70. Luisetti, T.; Turner, R.K.; Andrews, J.E.; Jickells, T.D.; Kröger, S.; Diesing, M.; Paltriguera, L.; Johnson, M.T.; Parker, E.R.; Bakker, D.C. Quantifying and valuing carbon flows and stores in coastal and shelf ecosystems in the UK. Ecosyst. Serv. 2019, 35, 67–76. [Google Scholar] [CrossRef]
  71. Zhai, T.; Zhang, D.; Zhao, C. How to optimize ecological compensation to alleviate environmental injustice in different cities in the Yellow River Basin? A case of integrating ecosystem service supply, demand and flow. Sustain. Cities Soc. 2021, 75, 103341. [Google Scholar] [CrossRef]
  72. De Groot, R.S.; Wilson, M.A.; Boumans, R.M. A typology for the classification, description and valuation of ecosystem functions, goods and services. Ecol. Econ. 2002, 41, 393–408. [Google Scholar] [CrossRef] [Green Version]
  73. Chen, J.L.; Xu, M.Y.; Su, X.; Gao, J.L. Spatial transfer of regional ecosystem service in Nanjing City. Acta Ecol. Sin. 2014, 34, 5087–5095. [Google Scholar] [CrossRef] [Green Version]
  74. Converse, P.D. New laws of retail gravitation. J. Mark. 1949, 14, 379–384. [Google Scholar] [CrossRef]
  75. Sun, F.; Xiong, J.; Xu, J.; Gao, X. A case study on Yangzhou city: Water source ecological compensation based on ecosystem servicing values. Resour. Ind. 2021, 23, 38–49. [Google Scholar] [CrossRef]
  76. Li, X.; Wu, K.; Feng, Z.; Wang, H. Carbon balance from the perspective of supply and demand of carbon sequestration services in Henan Province. Acta Ecol. Sin. 2022, 23, 9627–9635. [Google Scholar] [CrossRef]
  77. Chai, Y.; Kwan, M.P. The relationship between the built environment and car travel distance on weekdays in Beijing. Acta Geogr. Sin. 2015, 70, 1675–1685. [Google Scholar] [CrossRef]
  78. Yuan, Y.; Liu, Q.; Ma, H. Spatial differentiation of the commuting carbon emissions based on a housing price perspective: A case study of Jinan city. J. Nat. Resour. 2021, 36, 2081–2094. [Google Scholar] [CrossRef]
  79. Policy Interpretation of the Implementation Opinions of the General Office of Henan Provincial People’s Government on Accelerating the Development of Urban Parking Facilities. Available online: https://www.henan.gov.cn/2022/07-29/2550956.html (accessed on 29 July 2022).
  80. Outline of the General Plan for Land Use in Henan Province. Available online: https://www.mnr.gov.cn/gk/ghjh/201811/P020181101638441978338.doc (accessed on 5 December 2022).
  81. Xie, G.; Liu, J.; Xu, J.; Xiao, Y.; Zhen, L.; Zhang, C.; Wang, Y.; Qin, K.; Gan, S.; Jiang, Y. A spatio-temporal delineation of trans-boundary ecosystem service flows from Inner Mongolia. Environ. Res. Lett. 2019, 14, 65002. [Google Scholar] [CrossRef]
  82. Schwaiger, F.; Poschenrieder, W.; Biber, P.; Pretzsch, H. Ecosystem service trade-offs for adaptive forest management. Ecosyst. Serv. 2019, 39, 100993. [Google Scholar] [CrossRef]
  83. Brienen, R.J.; Phillips, O.L.; Feldpausch, T.R.; Gloor, E.; Baker, T.R.; Lloyd, J.; Lopez-Gonzalez, G.; Monteagudo-Mendoza, A.; Malhi, Y.; Lewis, S.L. Long-term decline of the Amazon carbon sink. Nature 2015, 519, 344–348. [Google Scholar] [CrossRef] [Green Version]
  84. Mendoza-Ponce, A.; Corona-Nunez, R.; Kraxner, F.; Leduc, S.; Patrizio, P. Identifying effects of land use cover changes and climate change on terrestrial ecosystems and carbon stocks in Mexico. Glob. Environ. Chang. 2018, 53, 12–23. [Google Scholar] [CrossRef] [Green Version]
  85. Chen, G.; Tian, H. Land use/cover change effects on carbon cycling in terrestrial ecosystems. Chin. J. Plant Ecol. 2007, 31, 189. [Google Scholar] [CrossRef] [Green Version]
  86. Gatti, L.V.; Basso, L.S.; Miller, J.B.; Gloor, M.; Gatti Domingues, L.; Cassol, H.L.; Tejada, G.; Aragão, L.E.; Nobre, C.; Peters, W. Amazonia as a carbon source linked to deforestation and climate change. Nature 2021, 595, 388–393. [Google Scholar] [CrossRef] [PubMed]
  87. Roshetko, J.M.; Dawson, I.K.; Urquiola, J.; Lasco, R.D.; Leimona, B.; Weber, J.C.; Bozzano, M.; Lillesø, J.B.; Graudal, L.; Jamnadass, R. To what extent are genetic resources considered in environmental service provision? A case study based on trees and carbon sequestration. Clim. Dev. 2018, 10, 755–768. [Google Scholar] [CrossRef]
  88. Lin, Z.; Xiao, Y.; Rao, E.; Shi, X.; Zhang, P. Relationships among different types of ecosystem service in Southwest China. J. Appl. Ecol. 2020, 31, 978–986. [Google Scholar] [CrossRef]
  89. Xin, R.; Skov-Petersen, H.; Zeng, J.; Zhou, J.; Li, K.; Hu, J.; Liu, X.; Kong, J.; Wang, Q. Identifying key areas of imbalanced supply and demand of ecosystem services at the urban agglomeration scale: A case study of the Fujian Delta in China. Sci. Total Environ. 2021, 791, 148173. [Google Scholar] [CrossRef] [PubMed]
  90. Ezzine-de-Blas, D.; Wunder, S.; Ruiz-Pérez, M.; Moreno-Sanchez, R.D.P. Global patterns in the implementation of payments for environmental services. PLoS ONE 2016, 11, e149847. [Google Scholar] [CrossRef] [PubMed] [Green Version]
  91. Bond, A.J.; Saison, C.L.; Lawley, V.R.; O’Connor, P.J. Bridging the Urban–Rural Divide Between Ecosystem Service Suppliers and Beneficiaries: Using a Distributed Community Nursery to Support Rural Revegetation. Environ. Manag. 2019, 64, 166–177. [Google Scholar] [CrossRef]
  92. Puupponen, A.; Lonkila, A.; Savikurki, A.; Karttunen, K.; Huttunen, S.; Ott, A. Finnish dairy farmers’ perceptions of justice in the transition to carbon-neutral farming. J. Rural Stud. 2022, 90, 104–112. [Google Scholar] [CrossRef]
  93. Sheng, J.; Qiu, W.; Han, X. China’s PES-like horizontal eco-compensation program: Combining market-oriented mechanisms and government interventions. Ecosyst. Serv. 2020, 45, 101164. [Google Scholar] [CrossRef]
  94. Wu, L.; Tian, Q. Study on regional carbon ecological security and ecological compensation in China under carbon neutralization target. Geogr. Res. 2022, 41, 149–166. [Google Scholar] [CrossRef]
  95. Wang, J.; Zhai, T.; Lin, Y.; Kong, X.; He, T. Spatial imbalance and changes in supply and demand of ecosystem services in China. Sci. Total Environ. 2019, 657, 781–791. [Google Scholar] [CrossRef]
  96. Osborne, T.; Shapiro-Garza, E. Embedding carbon markets: Complicating commodification of ecosystem services in Mexico’s forests. Ann. Am. Assoc. Geogr. 2018, 108, 88–105. [Google Scholar] [CrossRef]
  97. Wang, Y.; Li, X.; Sun, M.; Yu, H. Managing urban ecological land as properties: Conceptual model, public perceptions, and willingness to pay. Resour. Conserv. Recycl. 2018, 133, 21–29. [Google Scholar] [CrossRef]
  98. Hu, Y.; Wu, J.; Hu, R. Internal logic and development path of the “two mountains” theory for ecological civilization construction. Strateg. Study Chin. Acad. Eng. 2019, 21, 151–158. [Google Scholar] [CrossRef]
  99. Jo, J.; Roh, T.; Hwang, J.; Lee, K.; Lee, C. Factors and paths affecting payment for forest ecosystem service: Evidence from voluntary forest carbon market in South Korea. Sustainability 2020, 12, 7009. [Google Scholar] [CrossRef]
  100. Hou, Y.; Ding, S.; Chen, W.; Li, B.; Burkhard, B.; Bicking, S.; Müller, F. Ecosystem service potential, flow, demand and their spatial associations: A comparison of the nutrient retention service between a human-and a nature-dominated watershed. Sci. Total Environ. 2020, 748, 141341. [Google Scholar] [CrossRef] [PubMed]
  101. Liu, W.; Zhan, J.; Zhao, F.; Zhang, F.; Teng, Y.; Wang, C.; Chu, X.; Kumi, M.A. The tradeoffs between food supply and demand from the perspective of ecosystem service flows: A case study in the Pearl River Delta, China. J. Environ. Manag. 2022, 301, 113814. [Google Scholar] [CrossRef]
  102. Kowe, P.; Mutanga, O.; Dube, T. Advancements in the remote sensing of landscape pattern of urban green spaces and vegetation fragmentation. Int. J. Remote Sens. 2021, 42, 3797–3832. [Google Scholar] [CrossRef]
  103. Arthur, N.; Hack, J. A multiple scale, function, and type approach to determine and improve Green Infrastructure of urban watersheds. Urban For. Urban Green. 2022, 68, 127459. [Google Scholar] [CrossRef]
  104. Palliwoda, J.; Banzhaf, E.; Priess, J.A. How do the green components of urban green infrastructure influence the use of ecosystem services? Examples from Leipzig, Germany. Landscape Ecol. 2020, 35, 1127–1142. [Google Scholar] [CrossRef] [Green Version]
  105. Ramyar, R.; Saeedi, S.; Bryant, M.; Davatgar, A.; Hedjri, G.M. Ecosystem services mapping for green infrastructure planning–The case of Tehran. Sci. Total Environ. 2020, 703, 135466. [Google Scholar] [CrossRef]
  106. Rasmussen, L.V.; Fold, N.; Olesen, R.S.; Shackleton, S. Socio-economic outcomes of ecological infrastructure investments. Ecosyst. Serv. 2021, 47, 101242. [Google Scholar] [CrossRef]
  107. Bagstad, K.J.; Johnson, G.W.; Voigt, B.; Villa, F. Spatial dynamics of ecosystem service flows: A comprehensive approach to quantifying actual services. Ecosyst. Serv. 2013, 4, 117–125. [Google Scholar] [CrossRef]
  108. Palomo, I.; Martín-López, B.; Potschin, M.; Haines-Young, R.; Montes, C. National Parks, buffer zones and surrounding lands: Mapping ecosystem service flows. Ecosyst. Serv. 2013, 4, 104–116. [Google Scholar] [CrossRef]
  109. Sigwela, A.; Elbakidze, M.; Powell, M.; Angelstam, P. Defining core areas of ecological infrastructure to secure rural livelihoods in South Africa. Ecosyst. Serv. 2017, 27, 272–280. [Google Scholar] [CrossRef]
  110. Gokool, S.; Jewitt, G. Identifying hotspots for investment in ecological infrastructure within the uMngeni catchment, South Africa. Phys. Chem. Earth Parts A/B/C 2019, 114, 102807. [Google Scholar] [CrossRef]
  111. Jing, Y.; Chen, L.; Sun, R. A theoretical research framework for ecological security pattern construction based on ecosystem services supply and demand. Acta Ecol. Sin. 2018, 38, 4121–4131. [Google Scholar] [CrossRef]
  112. Feurer, M.; Rueff, H.; Celio, E.; Heinimann, A.; Blaser, J.; Htun, A.M.; Zaehringer, J.G. Regional scale mapping of ecosystem services supply, demand, flow and mismatches in Southern Myanmar. Ecosyst. Serv. 2021, 52, 101363. [Google Scholar] [CrossRef]
  113. Baró, F.; Gómez-Baggethun, E.; Haase, D. Ecosystem service bundles along the urban-rural gradient: Insights for landscape planning and management. Ecosyst. Serv. 2017, 24, 147–159. [Google Scholar] [CrossRef] [Green Version]
  114. Wang, L.; Zheng, H.; Wen, Z.; Liu, L.; Robinson, B.E.; Li, R.; Li, C.; Kong, L. Ecosystem service synergies/trade-offs informing the supply-demand match of ecosystem services: Framework and application. Ecosyst. Serv. 2019, 37, 100939. [Google Scholar] [CrossRef]
  115. Mashizi, A.K.; Sharafatmandrad, M. Investigating tradeoffs between supply, use and demand of ecosystem services and their effective drivers for sustainable environmental management. J. Environ. Manag. 2021, 289, 112534. [Google Scholar] [CrossRef]
Figure 1. Location of the study area.
Land 11 02321 g001
Figure 2. Spatial distribution of carbon sequestration supply and demand ((A) and (B) are CS supply and demand, respectively).
Land 11 02321 g002
Figure 3. Spatial distribution of DSDCS.
Land 11 02321 g003
Figure 4. Carbon compensation priority sequence at the county scale.
Land 11 02321 g004
Figure 5. Carbon compensation priority sequence at the prefecture-level city scale.
Land 11 02321 g005
Figure 6. Carbon sequestration flow between ECPAs and ECRAs.
Land 11 02321 g006
Figure 7. Ecological compensation fund paid by each ECPA.
Land 11 02321 g007
Publisher’s Note: MDPI stays neutral with regard to jurisdictional claims in published maps and institutional affiliations.

