Article

Responses of Phragmites australis to Nitrogen Addition along Salinity Gradients in Coastal Saline–Alkali Soil

1
Institute of Geographic Sciences and Natural Resources Research, Chinese Academy of Sciences, Beijing 100101, China
2
Shandong Dongying Institute of Geographic Sciences, Dongying 257000, China
3
Yellow River Delta Modern Agricultural Engineering Laboratory, Chinese Academy of Sciences, Beijing 100101, China
4
College of Biology and the Environment, Nanjing Forestry University, Nanjing 210037, China
5
Yantai Coastal Zone Geological Survey Center, China Geological Survey, Yantai 264011, China
*
Author to whom correspondence should be addressed.
These authors contributed equally to this work.
Land 2022, 11(12), 2320; https://doi.org/10.3390/land11122320
Submission received: 11 November 2022 / Revised: 6 December 2022 / Accepted: 15 December 2022 / Published: 17 December 2022

Abstract

:
Soil salinization and nitrogen (N) enrichment in saline–alkali soils resulting from human activities cause potential environmental pressure on Phragmites australis. However, the response of P. australis to N addition under different salt conditions remains unknown. This study examined the changes in soil properties and growth indices as well as their relationship to N addition through an in situ field experiment using three soil salinity levels with P. australis in the Yellow River Delta. The study showed that soil salinity levels significantly affected the effects of N addition on soil pH and water contents. N addition increased the soil NO3 contents and decreased soil available phosphorus (Avail. P) contents; however, soil salinity levels did not impact the effects of N addition on soil NO3 and Avail. P contents. N addition decreased the biomass of P. australis, since the decrease in the competitiveness for N sources changed the vegetation diversity. The results suggest that the biomass, plant height, and leaf soil plant analysis development (SPAD) values of P. australis increased with increasing soil Avail. P contents rather than soil NO3 contents. Therefore, we suggest the important role of Avail. P addition in N enrichment conditions in saline–alkali wasteland and estuarine wetland ecosystems.

1. Introduction

Phragmites australis is one of the most extensively distributed emergent plant species throughout the world [1,2]. P. australis provides ecosystem services such as nitrogen removal, water purification, and maintaining biodiversity for saline–alkali wasteland and estuarine wetland ecosystems [3,4]. Human activities, including reclamation, aquaculture, and pollutant emissions, aggravate soil salinization and water eutrophication, which can cause irreversible changes to the P. australis community in saline–alkali wasteland and estuarine wetland ecosystems [5,6,7].
Nitrogen (N) is one of the key elements limiting the growth of salt marsh plants [8,9]. The increased N input resulting from human activities has many deleterious effects on ecological function in saline–alkali wasteland and estuarine wetland ecosystems [10,11]. N enrichment has affected plant morphological traits, thus changing plant N uptake strategies [12,13]. For example, the excessive N input has increased the stem production rates of P. australis [14,15] and decreased the flexural strength of P. australis by reducing sclerenchyma [16]. However, when N is no longer a limiting resource, the competitive advantage for N in plant communities changes [17]. Therefore, P. australis regulates morphological traits for superior performance, resulting in a competitive advantage for N resources [18,19].
The Yellow River Delta is located at the junction of the Bohai Sea and Yellow River and has a unique ecosystem and important ecological functions [20,21]. In recent decades, coastal agriculture, fertilization, irrigation, tillage, and other management practices in the Yellow River Delta have added complexity to soil water and salt transport processes and intensified soil salinization and degradation [22]. Primary and secondary salinization and soil degradation cause potential environmental pressure on P. australis [23,24]. Meanwhile, the increasing N deposition caused by agricultural N inputs in the Yellow River Delta seriously affects the structure and function of the saline–alkali wasteland and estuarine wetland ecosystems [25,26]. However, the response of P. australis to N addition under different salt conditions remains unknown.
In this study, we examined differences in the response of P. australis to N addition among soil salinity gradients as well as the links between P. australis growth and changes in soil characteristics. To achieve our objectives, we conducted a field experiment in which N was not added or was added to the soil of P. australis at each of three sites exclusively dominated by P. australis and differing in soil salinity levels. Specifically, we hypothesized that (1) N addition would affect the performance of P. australis and alter soil characteristics and (2) the impacts of N addition would vary with different soil salinity levels.

2. Materials and Methods

2.1. Site Description

The study sites were located in the Yellow River Delta adjacent to the muddy coastal zone (118°59′26′′ E, 37°39′54′′ N; Figure 1). Sites were characterized by a temperate semiarid climate, which is representative of agriculturally intensive areas of North China, with a mean annual temperature of 12.6 °C and a mean precipitation of 580 mm. Approximately 70% of the annual precipitation occurs in June–September. The soil is classified as a coastal saline soil derived from alluvial loess parent materials [27].

2.2. Experimental Design

We selected three soil salinity levels with P. australis at the study sites based on a soil investigation in June: (1) high salinity level (soil salt contents ≥ 8 g kg−1), (2) medium salinity level (soil salt contents ranged between 4 and 8 g kg−1), and (3) low salinity level (soil salt contents ≤ 4 g kg−1). To keep microclimatic conditions similar, the distance between any two adjacent stands of the three soil salinity levels was 5 m. The details of the soil physicochemical characteristics at the three salinity levels are shown in Table 1.
The experimental site with N addition was set up on 10 July 2020 and was then followed by high (H), medium (M), and low (L) salinity levels without N addition and three soil salinity levels with N addition (HN, MN, and LN, respectively), with three replicates for each treatment. Within each salinity level, 6 plots (2 m × 2 m), including three N addition plots and three control plots, were randomly established. The distance between any two adjacent plots within a stand was 5 m. To achieve the N addition, N was added to the plots in the form of urea by dissolution in deionized water with application, for a total of 20 g N m−2 [28]. The N addition rates were in accordance with the N deposition rates in the Yellow River Delta. Before the N addition experiment, the living plants were removed inside the plots to ensure that the initial state of the test was consistent.

2.3. Sampling and Analyses

The growth indices of P. australis in each plot were measured at 20, 30, 40, 50, 60, and 70 d after N addition, including plant height and leaf soil plant analysis development (SPAD) values. The leaf SPAD values indicated the level of chlorophyll and were measured with a SPAD-502 (Minolta Camera Co. Ltd., Osaka, Japan) portable chlorophyll meter. Ten healthy and fully expanded leaves were randomly measured at the middle layer leaf and averaged to a single SPAD value for each experimental plot [29].
To measure aboveground biomass, P. australis and other plant stems in each plot were cut at the soil level 70 d after N addition, the period of maximum biomass of P. australis. The aboveground biomass was separated by species. The aboveground stems of P. australis were dried at 70 °C for 48 h and weighed. Vegetation diversity in each plot was calculated using Shannon–Weiner diversity [30].
Soil was collected at 30, 50, and 70 d after N addition. Five soil cores were taken at two depths in each plot and combined into one mixed sample. The soil samples were immediately transported to the laboratory and sieved through a 2 mm mesh to determine the physicochemical properties.

2.4. Soil Properties

The soil water content (SWC) was measured by the oven-drying method [31]. The soil electrical conductivity (EC) and pH were measured using a 1:5 soil:water solution (w/v). The amount of 0.5 M NaHCO3 was used to extract soil available phosphorus (P) contents (Avail. P) using an ultraviolet spectrometer (UV2600, Shimadzu, Kyoto, Japan). Fresh soils were extracted with 2 M KCl, and the extracts were used to determine soil NO3 using an autoanalyzer (AA3, Bran-Luebbe, Norderstedt, Germany).
The mean values of soil properties at 0–20 and 20–40 cm represented the soil properties in the upper layer. The mean values of soil properties at 40–60, 60–80, and 80–100 cm represented the soil properties in the deeper layer.

2.5. Data Analysis

One-way ANOVA with least significant difference (LSD) multiple comparisons was performed to explore the differences in growth indices of P. australis and soil physicochemical properties. Two-way ANOVA was applied to examine the main and interactive effects of N addition and salinity levels on P. australis biomass, dry matter, plant moisture and vegetation diversity. Multiple-factor repeated-measures ANOVA was used to assess the effects of N addition, salinity levels, growth stage, and soil depth as fixed factors on plant growth indices and soil physicochemical properties.
We used linear mixed models to evaluate the effect of soil characteristics in the upper and deeper layers on the dependent variables with growth indices of P. australis developed in the “lme4” and “lmerTest” packages [32]. This allowed the potential differences in variance among mesocosms to be considered when evaluating the coefficients of the models and their confidence intervals.
All statistical analyses were performed by using R 3.6.2.

3. Results

3.1. Soil pH and Water Contents in Different Growth Stages

The mean values of soil pH under high, medium, and low salinity levels were 8.1, 8.2, and 8.7, respectively (Figure 2a). The soil pH increased with the decrease in soil salinity levels. N addition increased soil pH under medium and low salinity levels (p < 0.05) during the growth periods and had no significant effect on soil pH under high salinity levels. Meanwhile, soil pH was also significantly affected by the soil depth and growth stages of P. australis (Table 2).
The soil salinity levels significantly changed the SWC in the upper layer (0–40 cm) at 30 d (Figure 2b). Compared with the SWC under the high salinity level, the SWC under the low salinity level increased by 14.2% and 16.6% at 0–20 and 20–40 cm, respectively, at 30 d (p < 0.05). However, the soil salinity level had no significant effect on the SWC in the deeper layer (40–100 cm). Compared with the effects of soil salinity and N addition, the soil depth had more significant effects on the SWC (Table 2), which increased with increasing soil depth.

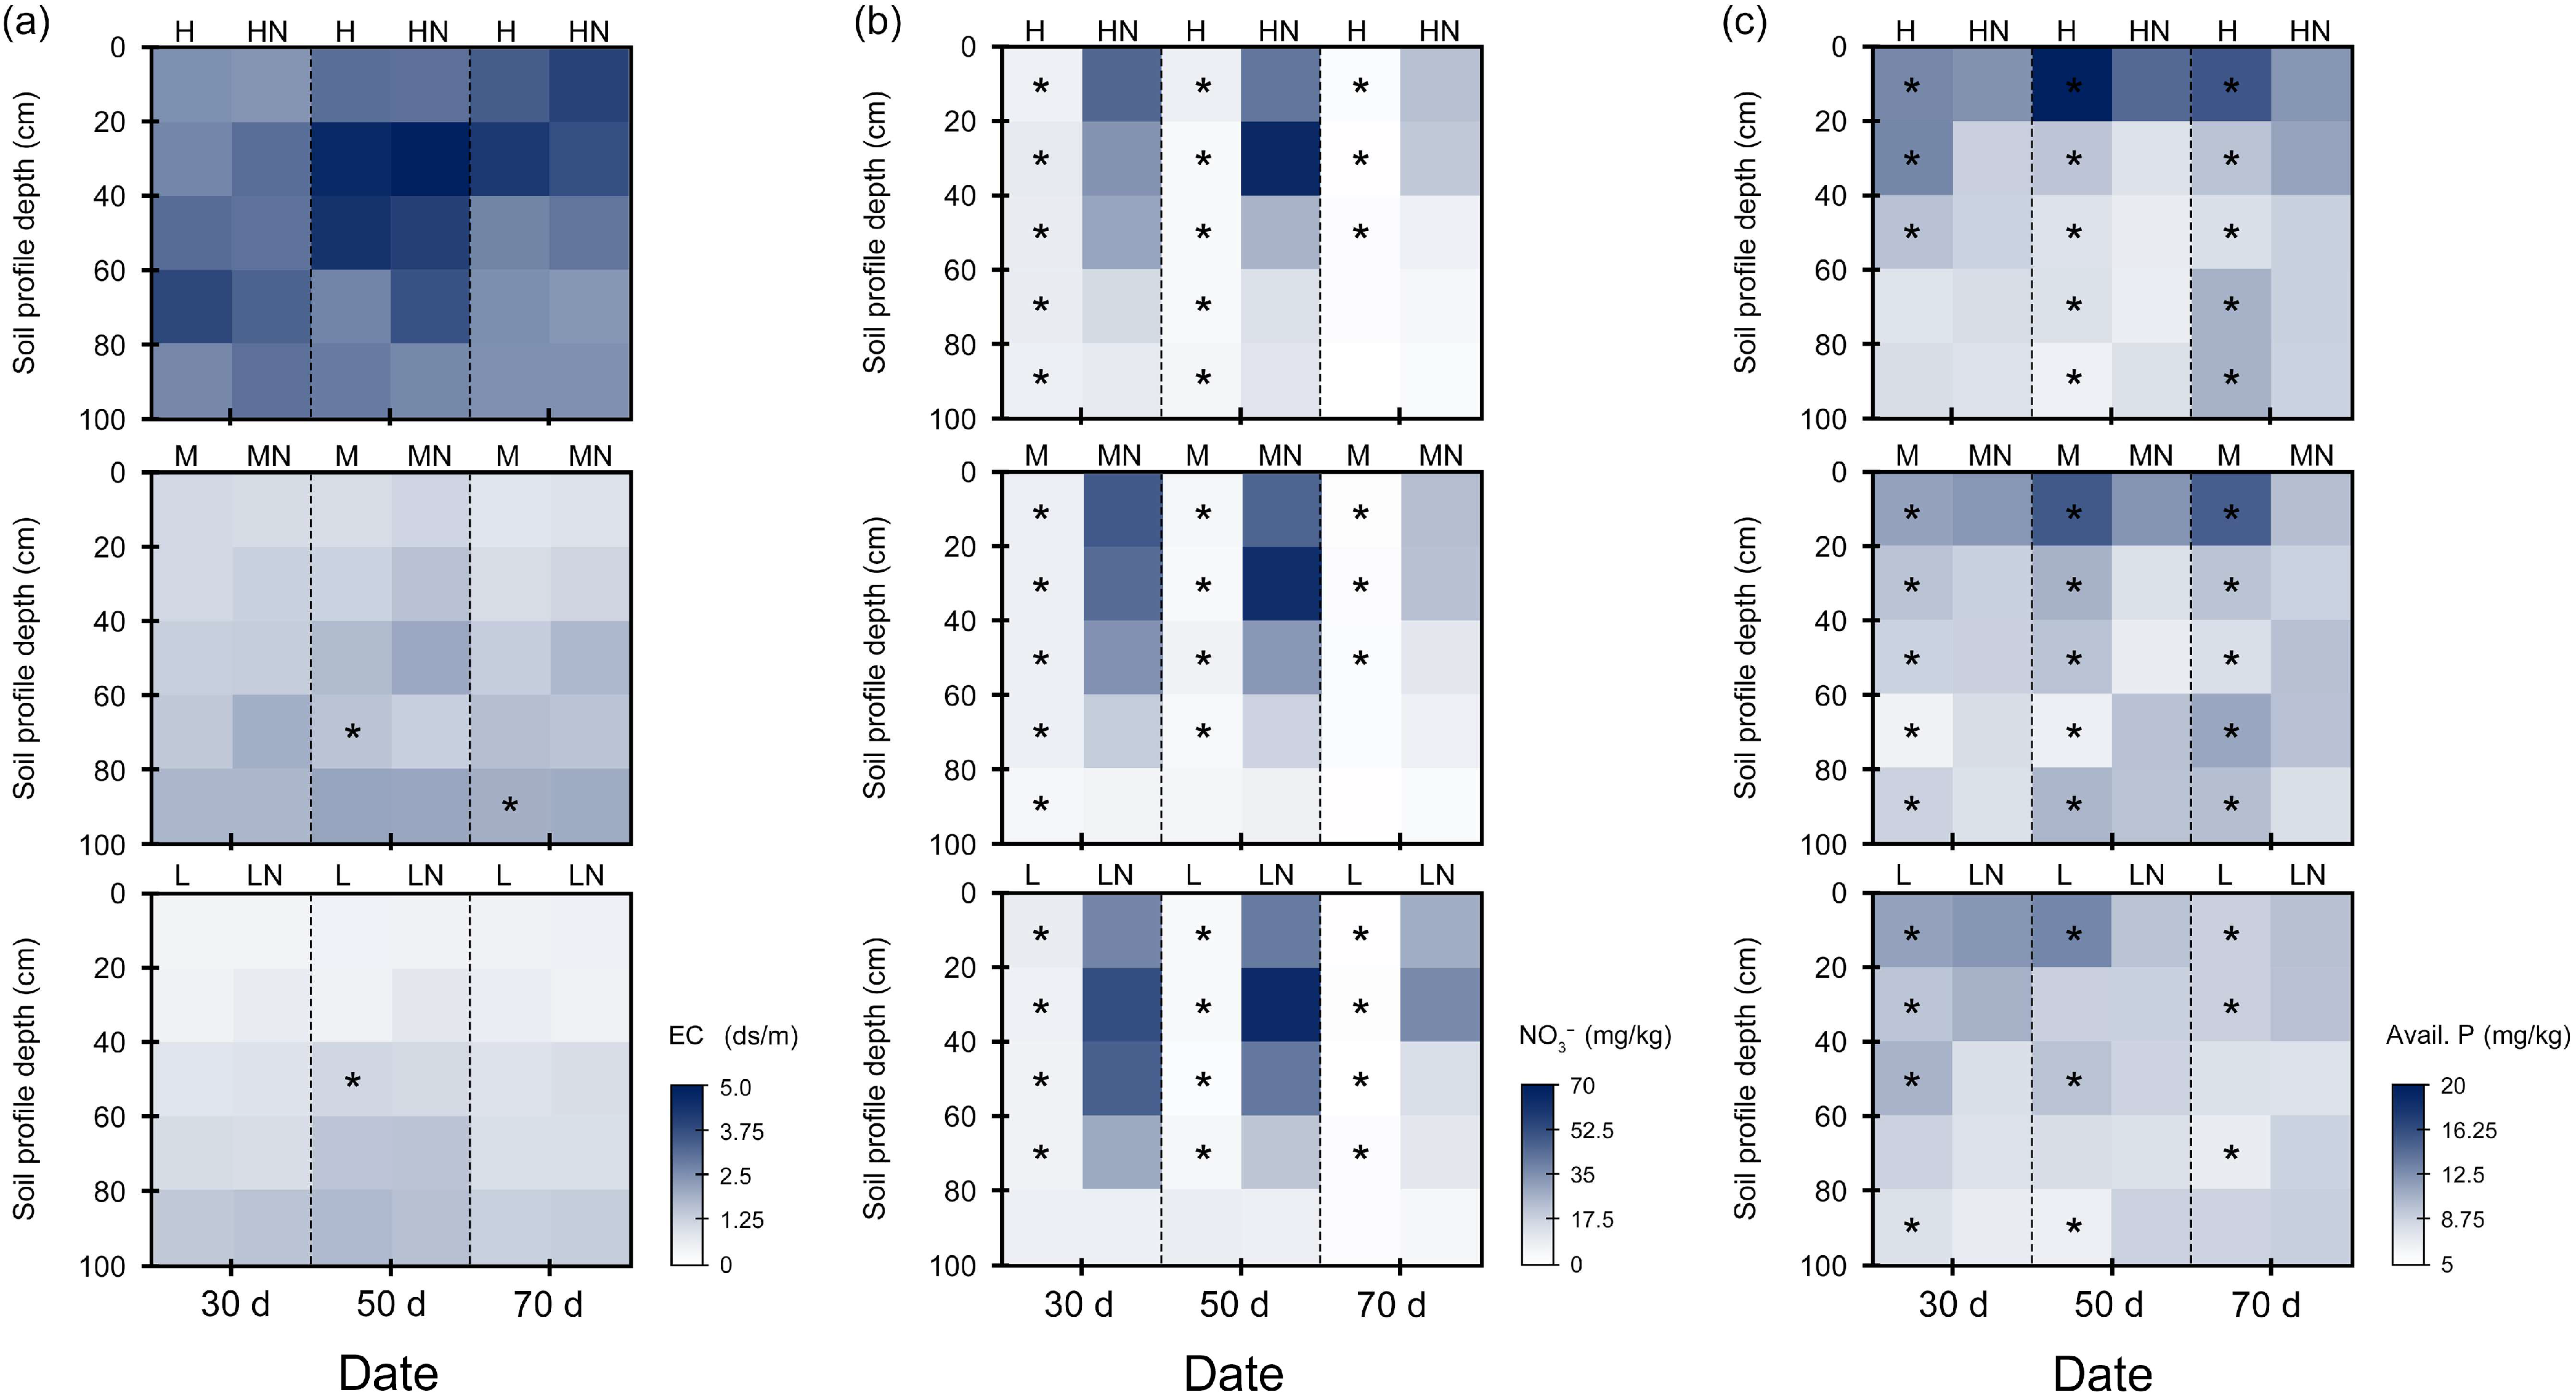
3.2. Soil Salt and Nutrient Characteristics in Different Growth Stages

The soil EC increased with the increase in soil salinity levels and was also not significantly affected by N addition (Figure 3a). The soil EC increased with the growth of P. australis in the soil depth profiles and decreased with increasing soil depth (p < 0.001, Table 3).
Soil NO3 contents were not significantly affected by soil salinity but were significantly changed by N addition (Figure 3b). Under the three soil salinity levels at 30d, the soil NO3 contents increased from 5.6 mg kg−1 to 45.8 mg kg−1 (p < 0.05) in the upper layer (0–40 cm) and increased from 4.9 mg kg−1 to 20.5 mg kg−1 (p < 0.05) in the deeper layer (40–100 cm). With the growth of P. australis, N addition still affected soil NO3 contents in the upper layer but had no significant changes in the deeper layer. The soil NO3 contents decreased with the growth of P. australis and the increase in the soil depth (p < 0.001, Table 3).
Soil salinity levels and N addition had significant effects on the soil Avail. P (Figure 3c, Table 3). During the three growth stages, the soil Avail. P in the upper layer under the high salinity level was 14.5% and 55.9% greater than that under the medium and low salinity levels, respectively (p < 0.05). However, the soil salinity levels did not significantly change the soil Avail. P in the deeper layer. Under high and medium salinity levels, N addition decreased the soil Avail. P during experimental periods at the 0–40 cm depth by 5.6–41.3% (p < 0.05). The soil Avail. P with N addition at the 40–100 cm depth was also lower than that without N addition (p < 0.05). The soil Avail. P decreased with increasing soil depth (p < 0.001) but was not affected by the growth of P. australis (Table 3).

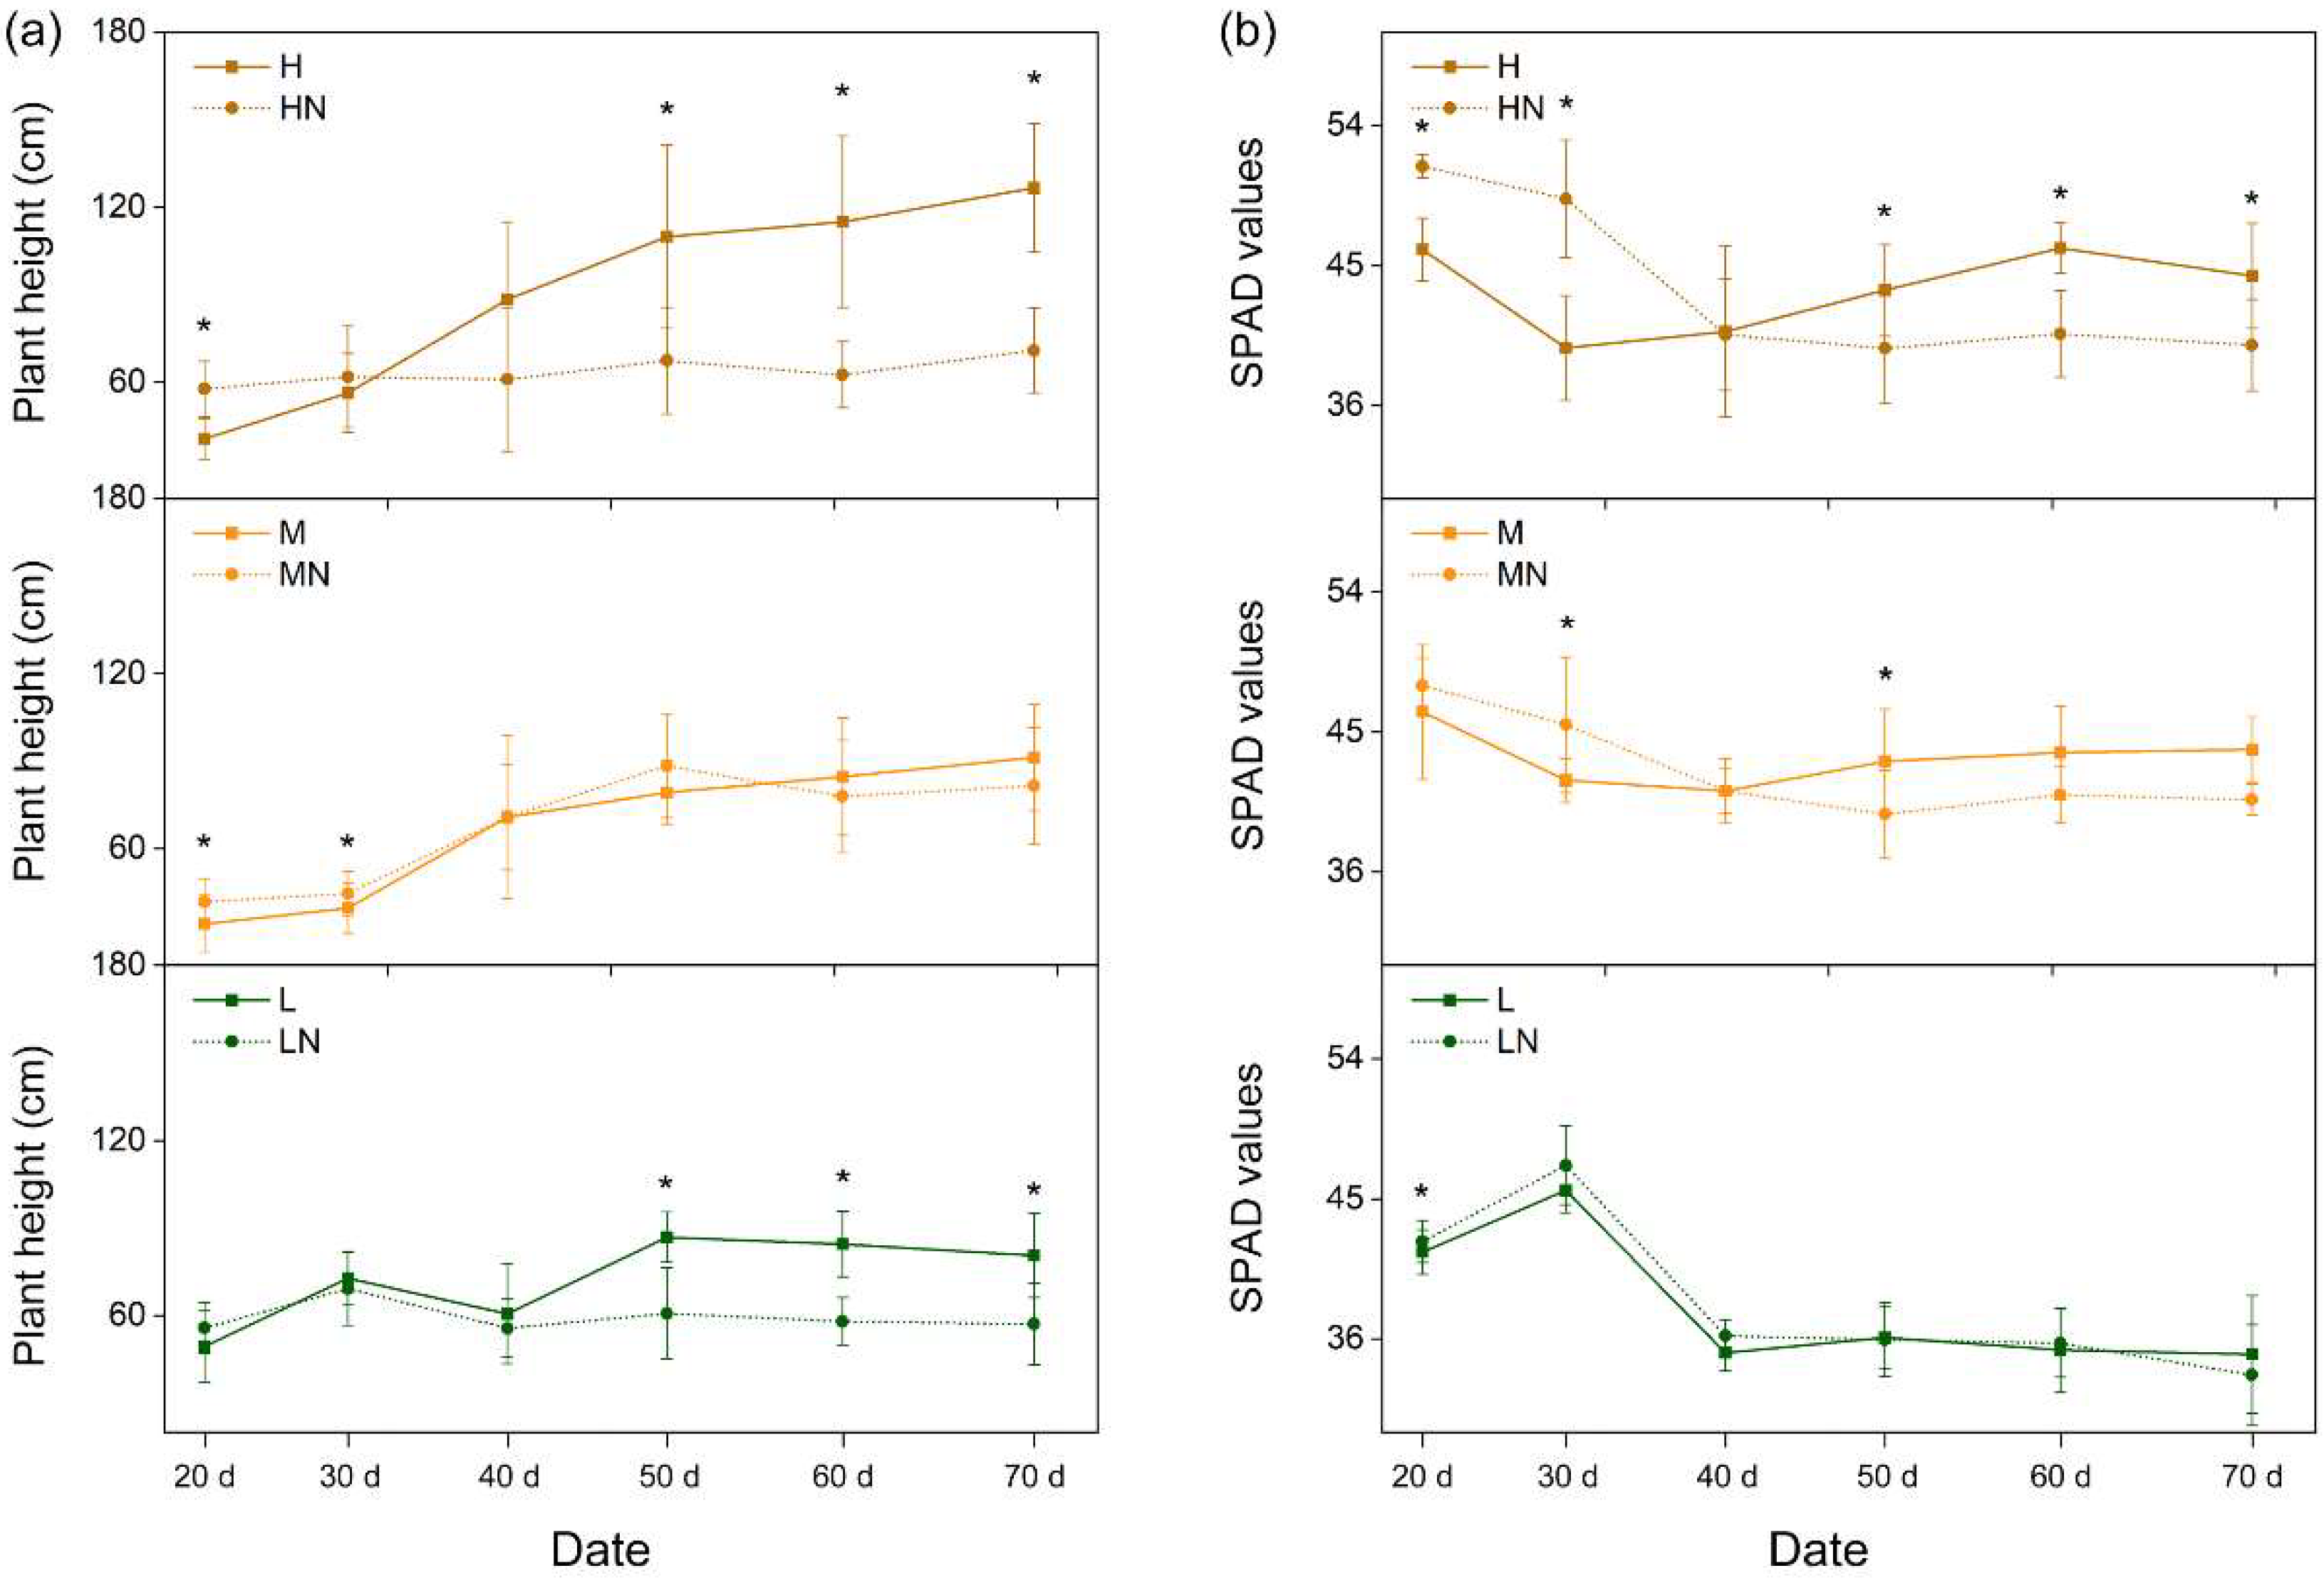
3.3. Growth Indices of P. australis

The soil salinity levels had significant effects on the growth indices of P. australis (Figure 4a). With increasing soil salinity levels, the plant height increased during the growth periods. For the influence of N addition, the plant height with N addition was greater than that without N addition during 20 d–30 d; in particular, a significant difference in plant height between the treatments with and without N addition existed under high and medium soil salinity levels (p < 0.05). With the growth of P. australis, the plant height without N addition was greater than that with N addition. During 50 d–70 d, the plant height with N addition decreased by 44.8–85.6% (p < 0.05) under the high soil salinity level, decreased by 8.7–11.9% under the medium soil salinity level, and decreased by 8.8–45.6% (p < 0.05) under the low soil salinity level compared with those without N addition.
Consistent with the effect of soil salinity levels on the plant height of P. australis, leaf SPAD values also increased with the soil salinity levels. Under the high salinity level, the leaf SPAD values with N addition were 11.6% and 24.1% greater than those without N addition at 20 d and 30 d, respectively. During 50 d–70 d, N addition decreased leaf SPAD values by 8.6–12% (p < 0.05) under the high salinity level. Under medium and low salinity levels, N addition had no significant effect on leaf SPAD values. Therefore, the soil salinity significantly affected the leaf SPAD values (p < 0.001), which were not significantly affected by N addition (Table 4).
The effects of soil salinity levels on the biomass and dry matter of P. australis were significant. The biomass and dry matter of P. australis under the high salinity level were significantly greater than those under the medium and low salinity levels (p < 0.05, Table 5). N addition decreased the biomass and dry matter of P. australis by 35.4–39.1% (p < 0.05) and 36.2–40.3% (p < 0.05), respectively, compared with those without N addition under the three soil salinity levels (p < 0.05). The plant moisture under the high soil salinity level was greater than that under the medium and low salinity levels. Compared with the effects of N addition, the soil salinity levels had more significant effects on the plant moisture (p < 0.001). For the vegetation diversity, the treatment with the medium salinity level had the greatest values among the six treatments, which was significantly greater than the vegetation diversity under the high salinity level (p < 0.05). Under the three salinity levels, N addition increased the vegetation diversity in the plots (p < 0.05).

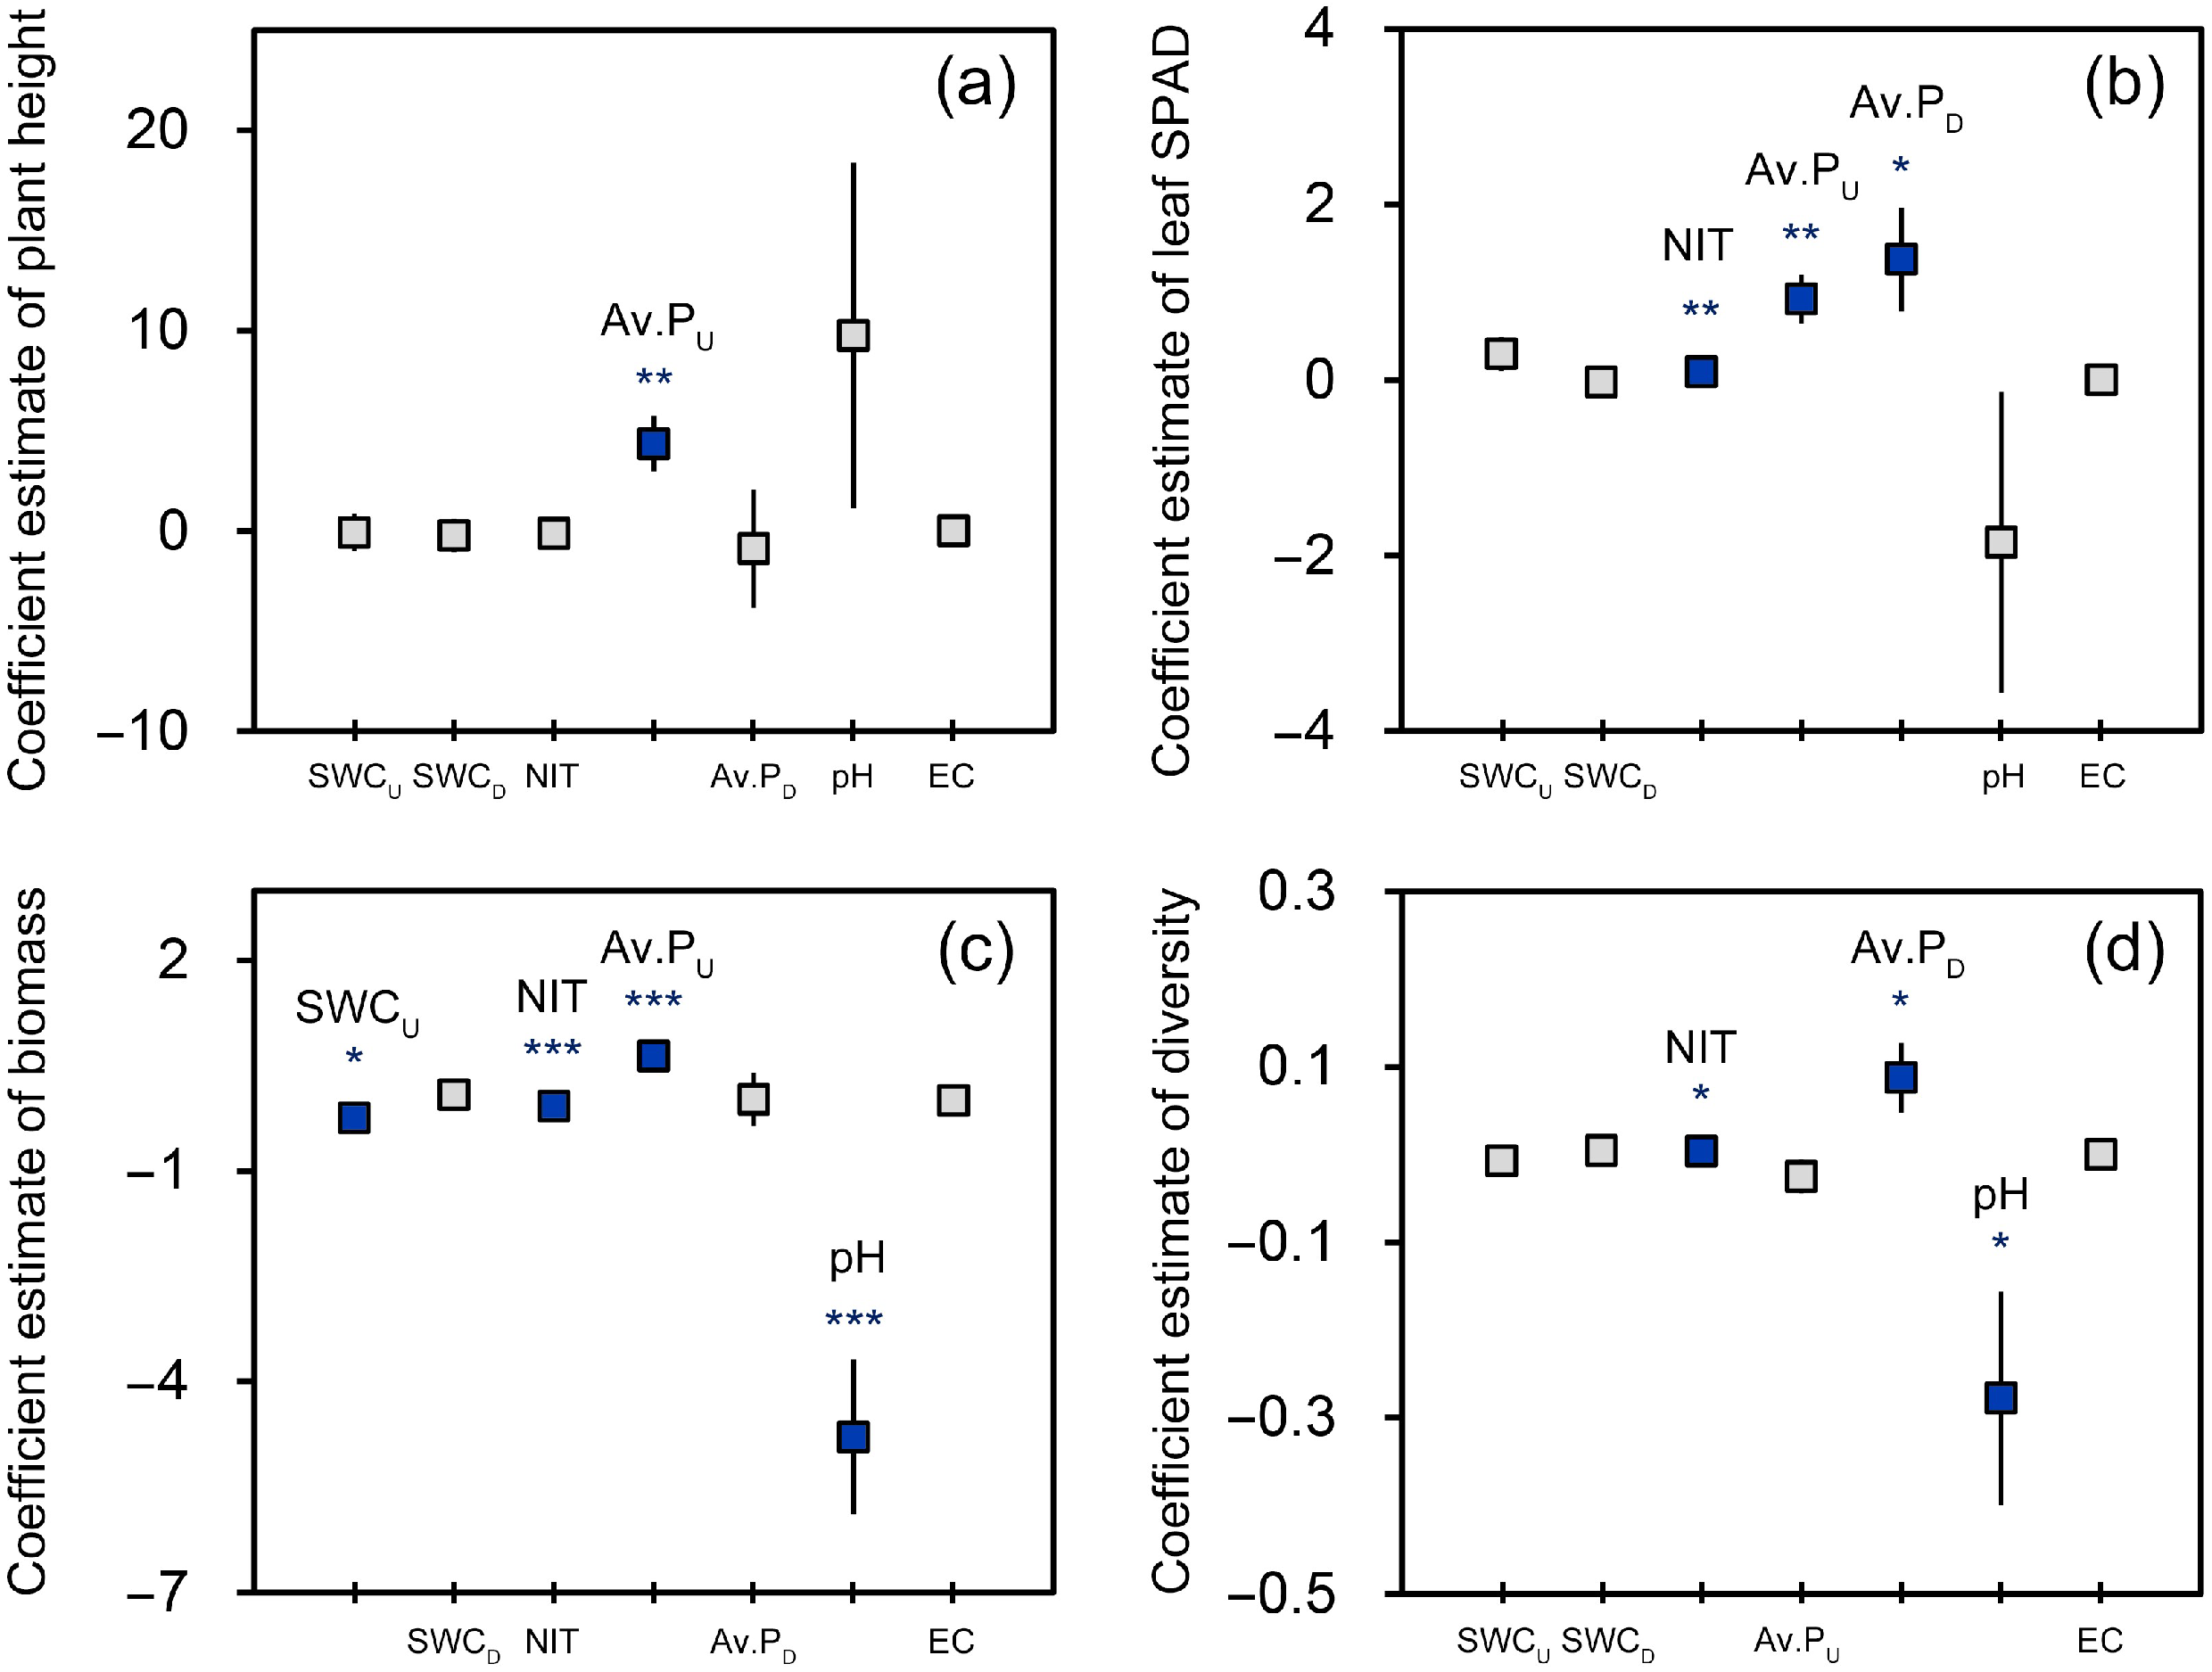
3.4. The Relationship between P. australis Growth and Soil Characteristics

For growth indices of P. australis, we estimated the fixed effects of the soil characteristics at different soil depths (SWC and Avail. P in the upper and deeper layers, NO3, pH and EC) at the three growth stages of P. australis with linear mixed models (Figure 5). We found significant positive effects of soil Avail. P in the upper layer on plant height (estimate = 4.35, p < 0.01) and leaf SPAD values (estimate = 0.922, p < 0.01). In particular, an increase in the biomass of P. australis with increasing soil Avail. P contents was also observed (Figure 5c). For vegetation diversity in the plots, significant positive effects of soil Avail. P in the deeper layer (estimate = 0.09, p < 0.05) occurred (Figure 5d). The soil pH had significant negative effects on the biomass of P. australis (estimate = −4.8, p < 0.001) and vegetation diversity (estimate = −0.28, p < 0.05).

4. Discussion

4.1. Responses of Soil Characteristics at Salinity Levels to N Addition

N inputs directly changed the soil salinity, soil pH, inorganic N pools, and other soil chemical characteristics [33,34]. The high background values of soil salinity in saline–alkali soils mitigated the effects of N addition on soil salinity [35,36]. Soil electrical conductivity (EC) is a measurement that correlates with soil properties, including soil water-soluble base cations and cation exchange capacity [37]. Therefore, we reported that N addition did not change the soil EC values (Figure 3a). N addition significantly improved soil nitrification rates, resulting in more released H+ [38,39]. Therefore, N addition decreased soil pH and intensified soil acidification [40]. The complicated ion constitution in saline–alkali soils reduced the impact of short-term N inputs on soil pH [41]. In this study, N addition increased soil pH under high and medium salinity levels in the upper layer (Figure 2a), caused by NH4+ leaching into the upper layer. Moreover, the increased soil salt contents by N inputs directly decreased the soil water potential and mitigated soil water evaporation rates; therefore, N addition could maintain moisture in the soil [42]. Our results also suggested that N addition increased the soil water contents under medium and low salinity levels at 30 d (Figure 2b). Therefore, soil salinity levels significantly affected the effects of N addition on soil pH and water contents.
Urea, as an N source, directly increased soil inorganic N pools and soil nitrification rates, resulting in increased soil NO3 contents. Due to leaching, sedimentation and nitrification, the effects of N addition on soil NO3 contents were reduced with increased soil depth [43]. We also reported that N addition increased the soil NO3 contents in the upper layer at the three salinity levels (Figure 3b). With the growth of P. australis, N addition increased soil NO3 contents in the deeper layer, caused by NO3 leaching along the soil profile. Under the wetting–redrying alternating environment in the saline–alkali wasteland and estuarine wetland ecosystems, the stable soil Avail. P contents caused by the slow decomposition of soil organic matter and plant litter did not increase microbial P limitation [44]. Previous studies [36,45] have suggested that the effects of N addition on soil total and available P contents were not significant. However, N addition improved the soil phosphatase activities and increased the soil P availability, enhancing the acquisition of P by plants [46]. The increased plant P uptake decreased the soil Avail. P contents. Our results also indicated that N addition decreased soil Avail. P contents (Figure 3c). Therefore, N addition increased the soil NO3 contents and decreased soil Avail. P contents, but soil salinity levels did not change the effects of N addition on soil NO3 and Avail. P contents.

4.2. Effects of N Addition on Growth Indices of P. australis at Different Salinity Levels

High plant height and leaf chlorophyll improve access to light and increase the photosynthetic carbon-assimilating pathway, resulting in greater biomass and promoting the growth of P. australis [11,47,48]. Under salt stress, P. australis adapts to saline conditions by adjusting the distribution of photosynthate [49]. Therefore, the biomass of P. australis increases with increasing soil salt content, which is basically consistent with the results of the effects of salinity levels on the biomass and dry matter of P. australis in this study (Table 5). Sufficient available N stimulates the dry matter production of P. australis, whereas superfluous N supply results in the death of the plants [14,15]. In this study, N addition increased the plant height of P. australis during 20 d–30 d, especially under high and medium salinity levels (Figure 4a). N addition supported available N for plant growth, resulting in an increase in tolerance to salt stress in P. australis [50].
As limiting factors of chlorophyll biosynthesis, N inputs directly regulate the chlorophyll content and SPAD values of salt marsh plants [51]. Our results suggested that N addition increased leaf SPAD values from 20 d to 30 d (Figure 4b). Along with the phenological development of P. australis, N addition decreased the plant height and leaf SPAD values (Figure 4). Previous studies have suggested that superfluous N supply caused a lack of mineral elements related to chlorophyll biosynthesis (e.g., Ca2+, Mg2+), decreasing the leaf chlorophyll contents [52,53]. However, we suggest that N addition changes the competitive relationship for N sources among plant communities under high salinity levels, resulting in the loss of competitiveness of P. australis [54,55]. Therefore, more available N is taken up by other superior plants, limiting the N uptake and chlorophyll biosynthesis of P. australis. We also report that N addition increased the vegetation diversity and decreased the biomass of P. australis (Table 5), which proved that N addition affected the N uptake of P. australis by changing the plant communities.

4.3. Relationship between P. australis Growth and Soil Characteristics

In response to N addition, the differentiation of soil characteristics affected plant communities. The changes in soil characteristics and plant communities both affected P. australis growth. N sources are essential for P. australis growth and development, whereas N addition changes the competitiveness for N sources of P. australis by improving vegetation diversity, resulting in decreased P. australis growth. Therefore, soil available N contents under salt conditions may not affect or limit the growth of P. australis. The organic acid secreted from the rhizosphere of P. australis solubilizes soil sediment P [56]. Therefore, P. australis with greater biomass and developed roots might be related to an increase in soil Avail. P contents. Our results of linear mixed models suggested an increase in biomass, plant height, and leaf SPAD values of P. australis with increasing soil Avail. P contents instead of soil NO3 contents (Figure 5). This phenomenon is most likely attributed to the coordinated effects of N and P on plant growth [57]. Therefore, we suggest the important role of available P addition in N enrichment conditions in saline–alkali wasteland and estuarine wetland ecosystems.

5. Conclusions

Our study demonstrates that soil salinity levels significantly affected the effects of N addition on soil pH and water contents. N addition increased the soil NO3 contents and decreased soil Avail. P contents, but soil salinity levels did not change the effects of N addition on soil NO3 and Avail. P contents. N addition increased the plant height and leaf SPAD values of Phragmites australis during the jointing stage under high and medium salinity levels. With the growth of P. australis, N addition decreased plant height, leaf SPAD values, and biomass, since the decrease in the competitiveness for N sources of P. australis changed the vegetation diversity. The results of linear mixed models suggested an increase in biomass, plant height, and leaf SPAD values of P. australis with increasing soil Avail. P contents instead of soil NO3 contents. Therefore, we suggest the important role of available P addition in N enrichment conditions in saline–alkali wasteland and estuarine wetland ecosystems.

Author Contributions

Conceptualization, H.G., Y.H. and J.L.; methodology, H.G.; writing—original draft, H.G. and Y.H.; data curation, Y.H.; writing—review & editing, J.L.; validation, Z.L., R.H. and Y.Z.; formal analysis, W.D. and B.W.; supervision, Z.O. All authors have read and agreed to the published version of the manuscript.

Funding

This research was funded by the National Key Research and Development Program of China (2021YFD190090503); the Natural Science Foundation of Shandong Province, China (ZR2022QC098); the Strategic Priority Research Program of the Chinese Academy of Sciences (XDA26050202); the Geological Survey projects of China Geological Survey (ZD20220143); and the Natural Science Foundation of China (42271278).

Institutional Review Board Statement

Not applicable.

Informed Consent Statement

Not applicable.

Data Availability Statement

The datasets used and/or analyzed during the current study are available from the corresponding author on reasonable request.

Acknowledgments

The first author acknowledges Shandong Postdoctoral Innovation Practice Base for providing support. We thank the reviewers and editors for the useful suggestions and comments.

Conflicts of Interest

No conflict of interest exists in the submission of this manuscript.

References

  1. Li, L.; Zerbe, S.; Han, W.; Thevs, N.; Li, W.; He, P.; Schmitt, A.O.; Liu, Y.; Ji, C. Nitrogen and phosphorus stoichiometry of common reed (Phragmites australis) and its relationship to nutrient availability in northern China. Aquat. Bot. 2014, 112, 84–90. [Google Scholar] [CrossRef]
  2. Rezania, S.; Park, J.; Rupani, P.F.; Darajeh, N.; Xu, X.; Shahrokhishahraki, R. Phytoremediation potential and control of Phragmites australis as a green phytomass: An overview. Environ. Sci. Pollut. Res. 2019, 26, 7428–7441. [Google Scholar] [CrossRef] [PubMed]
  3. Minkina, T.; Fedorenko, G.; Nevidomskaya, D.; Fedorenko, A.; Chaplygin, V.; Mandzhieva, S. Morphological and anatomical changes of Phragmites australis Cav. due to the uptake and accumulation of heavy metals from polluted soils. Sci. Total Environ. 2018, 636, 392–401. [Google Scholar] [CrossRef] [PubMed]
  4. Liu, X.; Zhang, Y.; Li, X.; Fu, C.; Shi, T.; Yan, P. Effects of influent nitrogen loads on nitrogen and COD removal in horizontal subsurface flow constructed wetlands during different growth periods of Phragmites australis. Sci. Total Environ. 2018, 635, 1360–1366. [Google Scholar] [CrossRef]
  5. Wang, J.; Chen, G.; Fu, Z.; Qiao, H.; Liu, F. Assessing wetland nitrogen removal and reed (Phragmites australis) nutrient responses for the selection of optimal harvest time. J. Environ. Manag. 2021, 280, 111783. [Google Scholar] [CrossRef]
  6. Feng, H.; Zhao, H.; Xia, L.; Yang, W.; Zhao, Y.; Jeelani, N.; An, S. Nitrogen cycling in plant and soil subsystems is driven by changes in soil salinity following coastal embankment in typical coastal saltmarsh ecosystems of Eastern China. Ecol. Eng. 2022, 174, 106467. [Google Scholar] [CrossRef]
  7. Hazelton, E.L.; Mozdzer, T.J.; Burdick, D.M.; Kettenring, K.M.; Whigham, D.F. Phragmites australis management in the United States: 40 years of methods and outcomes. AoB Plants 2014, 6, plu001. [Google Scholar] [CrossRef] [Green Version]
  8. Leghari, S.J.; Wahocho, N.A.; Laghari, G.M.; HafeezLaghari, A.; MustafaBhabhan, G.; HussainTalpur, K.; Bhutto, T.A.; Wahocho, S.A.; Lashari, A.A. Role of nitrogen for plant growth and development: A review. Adv. Environ. Biol. 2016, 10, 209–219. [Google Scholar]
  9. Luo, L.; Zhang, Y.; Xu, G. How does nitrogen shape plant architecture? J. Exp. Bot. 2020, 71, 4415–4427. [Google Scholar] [CrossRef]
  10. Zhang, X.; Davidson, E.A.; Mauzerall, D.L.; Searchinger, T.D.; Dumas, P.; Shen, Y. Managing nitrogen for sustainable development. Nature 2015, 528, 51–59. [Google Scholar] [CrossRef] [Green Version]
  11. Jordan, S.J.; Stoffer, J.; Nestlerode, J.A. Wetlands as sinks for reactive nitrogen at continental and global scales: A meta-analysis. Ecosystems 2011, 14, 144–155. [Google Scholar] [CrossRef]
  12. Zhou, M.; Yan, G.; Xing, Y.; Chen, F.; Zhang, X.; Wang, J.; Zhang, J.; Dai, G.; Zheng, X.; Sun, W. Nitrogen deposition and decreased precipitation does not change total nitrogen uptake in a temperate forest. Sci. Total Environ. 2019, 651, 32–41. [Google Scholar] [CrossRef] [PubMed]
  13. Seghatoleslami, M.J.; Bradaran, R.; Ansarinia, E.; Mousavi, S.G. Effect of irrigation and nitrogen level on yield, yield components and some morphological traits of sunflower. Pak. J. Bot. 2012, 44, 1551–1555. [Google Scholar]
  14. Ravit, B.; Ehrenfeld, J.G.; Häggblom, M.M.; Bartels, M. The effects of drainage and nitrogen enrichment on Phragmites australis, Spartina alterniflora, and their root-associated microbial communities. Wetlands 2007, 27, 915–927. [Google Scholar] [CrossRef]
  15. Clevering, O.A. An investigation into the effects of nitrogen on growth and morphology of stable and die-back populations of Phragmites australis. Aquat. Bot. 1998, 60, 11–25. [Google Scholar] [CrossRef]
  16. Koppitz, H.; Dewender, M.; Ostendorp, W.; Schmieder, K. Amino acids as indicators of physiological stress in common reed Phragmites australis affected by an extreme flood. Aquat. Bot. 2004, 79, 277–294. [Google Scholar] [CrossRef] [Green Version]
  17. Brooks, M.L. Effects of increased soil nitrogen on the dominance of alien annual plants in the Mojave Desert. J. Appl. Ecol. 2003, 40, 344–353. [Google Scholar] [CrossRef]
  18. Jiang, L.; Luo, Y.; Chen, J.; Li, B. Ecophysiological characteristics of invasive Spartina alterniflora and native species in salt marshes of Yangtze River estuary, China. Estuar. Coast. Shelf Sci. 2009, 81, 74–82. [Google Scholar] [CrossRef]
  19. Qing, H.; Cai, Y.; Xiao, Y.; Yao, Y.; An, S. Nitrogen uptake and use efficiency of invasive Spartina alterniflora and native Phragmites australis: Effect of nitrogen supply. Clean Soil Air Water 2015, 43, 305–311. [Google Scholar] [CrossRef]
  20. Mao, W.; Kang, S.; Wan, Y.; Sun, Y.; Li, X.; Wang, Y. Yellow river sediment as a soil amendment for amelioration of saline land in the Yellow River Delta. Land Degrad. Dev. 2016, 27, 1595–1602. [Google Scholar] [CrossRef]
  21. Zhang, H.; Sun, Y.; Zhang, W.; Song, Z.; Ding, Z.; Zhang, X. Comprehensive evaluation of the eco-environmental vulnerability in the Yellow River Delta wetland. Ecol. Indic. 2021, 125, 107514. [Google Scholar] [CrossRef]
  22. Xia, J.; Ren, J.; Zhang, S.; Wang, Y.; Fang, Y. Forest and grass composite patterns improve the soil quality in the coastal saline-alkali land of the Yellow River Delta, China. Geoderma 2019, 349, 25–35. [Google Scholar] [CrossRef]
  23. Sun, X.-S.; Chen, Y.-H.; Zhuo, N.; Cui, Y.; Luo, F.-L.; Zhang, M.-X. Effects of salinity and concomitant species on growth of Phragmites australis populations at different levels of genetic diversity. Sci. Total Environ. 2021, 780, 146516. [Google Scholar] [CrossRef]
  24. Munzarova, E.; Lorenzen, B.; Brix, H.; Vojtiskova, L.; Votrubova, O. Effect of NH4+/NO3 availability on nitrate reductase activity and nitrogen accumulation in wetland helophytes Phragmites australis and Glyceria maxima. Environ. Exp. Bot. 2006, 55, 49–60. [Google Scholar] [CrossRef]
  25. Lu, G.; Xie, B.; Cagle, G.A.; Wang, X.; Han, G.; Wang, X.; Hou, A.; Guan, B. Effects of simulated nitrogen deposition on soil microbial community diversity in coastal wetland of the Yellow River Delta. Sci. Total Environ. 2021, 757, 143825. [Google Scholar] [CrossRef] [PubMed]
  26. Zhang, G.; Bai, J.; Zhao, Q.; Jia, J.; Wang, W.; Wang, X. Bacterial succession in salt marsh soils along a short-term invasion chronosequence of Spartina alterniflora in the Yellow River Estuary, China. Microb. Ecol. 2020, 79, 644–661. [Google Scholar] [CrossRef]
  27. Zhu, W.; Rezaei, E.E.; Nouri, H.; Yang, T.; Li, B.; Gong, H.; Lyu, Y.; Peng, J.; Sun, Z. Quick detection of field-scale soil comprehensive attributes via the integration of UAV and sentinel-2B remote sensing data. Remote Sens. 2021, 13, 4716. [Google Scholar] [CrossRef]
  28. Yu, G.; Jia, Y.; He, N.; Zhu, J.; Chen, Z.; Wang, Q.; Piao, S.; Liu, X.; He, H.; Guo, X. Stabilization of atmospheric nitrogen deposition in China over the past decade. Nat. Geosci. 2019, 12, 424–429. [Google Scholar] [CrossRef]
  29. Nassi o Di Nasso, N.; Roncucci, N.; Bonari, E. Seasonal dynamics of aboveground and belowground biomass and nutrient accumulation and remobilization in giant reed (Arundo donax L.): A three-year study on marginal land. BioEnergy Res. 2013, 6, 725–736. [Google Scholar] [CrossRef]
  30. Spellerberg, I.F.; Fedor, P.J. A tribute to Claude Shannon (1916–2001) and a plea for more rigorous use of species richness, species diversity and the ‘Shannon–Wiener’Index. Glob. Ecol. Biogeogr. 2003, 12, 177–179. [Google Scholar] [CrossRef] [Green Version]
  31. Sparks, D.L.; Page, A.L.; Helmke, P.A.; Loeppert, R.H. Methods of Soil Analysis, Part 3: Chemical Methods; John Wiley & Sons: New York, NY, USA, 2020; Volume 14. [Google Scholar]
  32. Luke, S.G. Evaluating significance in linear mixed-effects models in R. Behav. Res. Methods 2017, 49, 1494–1502. [Google Scholar] [CrossRef] [PubMed] [Green Version]
  33. Lu, M.; Yang, Y.; Luo, Y.; Fang, C.; Zhou, X.; Chen, J.; Yang, X.; Li, B. Responses of ecosystem nitrogen cycle to nitrogen addition: A meta-analysis. New Phytol. 2011, 189, 1040–1050. [Google Scholar] [CrossRef] [PubMed]
  34. Midolo, G.; Alkemade, R.; Schipper, A.M.; Benítez-López, A.; Perring, M.P.; De Vries, W. Impacts of nitrogen addition on plant species richness and abundance: A global meta-analysis. Glob. Ecol. Biogeogr. 2019, 28, 398–413. [Google Scholar] [CrossRef] [Green Version]
  35. Wang, J.; Xu, T.; Feng, X.; Zhu, W.; Zhang, L.; Pan, D.; Akram, N.A.; Ma, Q.; Zhong, Z.; Mahroof, S. Simulated grazing and nitrogen addition facilitate spatial expansion of Leymus chinensis clones into saline-alkali soil patches: Implications for Songnen grassland restoration in northeast China. Land Degrad. Dev. 2022, 33, 710–722. [Google Scholar] [CrossRef]
  36. Yin, Z.; Yu, X.; Zou, Y.; Ding, S.; Zhang, J. Nitrogen Addition Effects on Wetland Soils Depend on Environmental Factors and Nitrogen Addition Methods: A Meta-Analysis. Water 2022, 14, 1748. [Google Scholar] [CrossRef]
  37. Grisso, R.D.; Alley, M.M.; Holshouser, D.L.; Thomason, W.E. Precision Farming Tools. Soil Electrical Conductivity; Virginia State University: Ettrick, VA, USA, 2005. [Google Scholar]
  38. Šimek, M.; Cooper, J. The influence of soil pH on denitrification: Progress towards the understanding of this interaction over the last 50 years. Eur. J. Soil Sci. 2002, 53, 345–354. [Google Scholar] [CrossRef]
  39. Kuypers, M.M.; Marchant, H.K.; Kartal, B. The microbial nitrogen-cycling network. Nat. Rev. Microbiol. 2018, 16, 263–276. [Google Scholar] [CrossRef]
  40. Tian, D.; Niu, S. A global analysis of soil acidification caused by nitrogen addition. Environ. Res. Lett. 2015, 10, 024019. [Google Scholar] [CrossRef]
  41. Moseman-Valtierra, S.; Gonzalez, R.; Kroeger, K.D.; Tang, J.; Chao, W.C.; Crusius, J.; Bratton, J.; Green, A.; Shelton, J. Short-term nitrogen additions can shift a coastal wetland from a sink to a source of N2O. Atmos. Environ. 2011, 45, 4390–4397. [Google Scholar] [CrossRef]
  42. Liu, C.; Yao, M.; Stegen, J.C.; Rui, J.; Li, J.; Li, X. Long-term nitrogen addition affects the phylogenetic turnover of soil microbial community responding to moisture pulse. Sci. Rep. 2017, 7, 17492. [Google Scholar] [CrossRef] [Green Version]
  43. Long, G.; Li, L.; Wang, D.; Zhao, P.; Tang, L.; Zhou, Y.; Yin, X. Nitrogen levels regulate intercropping-related mitigation of potential nitrate leaching. Agric. Ecosyst. Environ. 2021, 319, 107540. [Google Scholar] [CrossRef]
  44. Bostic, E.; White, J. Soil phosphorus and vegetation influence on wetland phosphorus release after simulated drought. Soil Sci. Soc. Am. J. 2007, 71, 238–244. [Google Scholar] [CrossRef]
  45. Whigham, D.F.; Verhoeven, J.T.; Samarkin, V.; Megonigal, P.J. Responses of Avicennia germinans (black mangrove) and the soil microbial community to nitrogen addition in a hypersaline wetland. Estuaries Coasts 2009, 32, 926–936. [Google Scholar] [CrossRef] [Green Version]
  46. Li, Y.; Niu, S.; Yu, G. Aggravated phosphorus limitation on biomass production under increasing nitrogen loading: A meta-analysis. Glob. Change Biol. 2016, 22, 934–943. [Google Scholar] [CrossRef] [PubMed]
  47. Falster, D.S.; Westoby, M. Plant height and evolutionary games. Trends Ecol. Evol. 2003, 18, 337–343. [Google Scholar] [CrossRef]
  48. Liang, X.; Zhang, T.; Lu, X.; Ellsworth, D.S.; BassiriRad, H.; You, C.; Wang, D.; He, P.; Deng, Q.; Liu, H.; et al. Global response patterns of plant photosynthesis to nitrogen addition: A meta-analysis. Glob. Change Biol. 2020, 26, 3585–3600. [Google Scholar] [CrossRef]
  49. Lissner, J.; Schierup, H.-H. Effects of salinity on the growth of Phragmites australis. Aquat. Bot. 1997, 55, 247–260. [Google Scholar] [CrossRef]
  50. Abd-Alla, M.H.; Nafady, N.A.; Bashandy, S.R.; Hassan, A.A. Mitigation of effect of salt stress on the nodulation, nitrogen fixation and growth of chickpea (Cicer arietinum L.) by triple microbial inoculation. Rhizosphere 2019, 10, 100148. [Google Scholar] [CrossRef]
  51. Hassan, M.S.; Khair, A.; Haque, M.M.; Azad, A.K.; Hamid, A. Genotypic variation in traditional rice varieties for chlorophyll content, SPAD value and nitrogen use efficiency. Bangladesh J. Agric. Res. 2009, 34, 505–515. [Google Scholar] [CrossRef]
  52. Zhao, D.; Raja Reddy, K.; Kakani, V.; Read, J.; Carter, G. Corn (Zea mays L.) growth, leaf pigment concentration, photosynthesis and leaf hyperspectral reflectance properties as affected by nitrogen supply. Plant Soil 2003, 257, 205–218. [Google Scholar] [CrossRef]
  53. Weese, D.J.; Heath, K.D.; Dentinger, B.T.; Lau, J.A. Long-term nitrogen addition causes the evolution of less-cooperative mutualists. Evolution 2015, 69, 631–642. [Google Scholar] [CrossRef] [PubMed]
  54. Rickey, M.A.; Anderson, R.C. Effects of nitrogen addition on the invasive grass Phragmites australis and a native competitor Spartina pectinata. J. Appl. Ecol. 2004, 41, 888–896. [Google Scholar] [CrossRef]
  55. Hirtreiter, J.; Potts, D. Canopy structure, photosynthetic capacity and nitrogen distribution in adjacent mixed and monospecific stands of Phragmites australis and Typha latifolia. Plant Ecol. 2012, 213, 821–829. [Google Scholar] [CrossRef]
  56. Yu, J.; Zhong, J.; Chen, Q.; Huang, W.; Hu, L.; Zhang, Y.; Fan, C. An investigation of the effects of capping on internal phosphorus release from sediments under rooted macrophytes (Phragmites australis) revegetation. Environ. Sci. Pollut. Res. 2018, 25, 24682–24694. [Google Scholar] [CrossRef]
  57. Jiang, J.; Wang, Y.-P.; Yang, Y.; Yu, M.; Wang, C.; Yan, J. Interactive effects of nitrogen and phosphorus additions on plant growth vary with ecosystem type. Plant Soil 2019, 440, 523–537. [Google Scholar] [CrossRef]
Figure 1. Location of the study area (a) and overview of the experimental site (b).
Land 11 02320 g001
Figure 2. Soil pH (a) and water contents (SWC) (b) in the soil profile (0–100 cm) during the experimental periods.
Land 11 02320 g002
Figure 3. Soil EC (a), NO3 contents (b), and Avail. P (c) in the soil profile (0–100 cm) during the experimental periods. * Indicates a significant difference between the plots without N addition and with N addition in terms of soil characteristics under the same soil salinity level in the same determination period (p < 0.05).
Land 11 02320 g003
Figure 4. Plant height (a) and leaf SPAD values (b) of P. australis during experimental periods. * Indicates a significant difference between the plots without N addition and with N addition in terms of soil characteristics under the same soil salinity level in the same determination period (p  < 0.05).
Land 11 02320 g004
Figure 5. Relationship between growth indices of P. australis and soil properties. The coefficient estimate of plant height (a, AIC = 475.2, R2 = 0.56), leaf SPAD value (b, AIC = 328.2, R2 = 0.69), biomass (c, AIC = 285.8, R2 = 0.63) and vegetation diversity (d, AIC = 81.79, R2 = 0.64) effect sizes with ±95% confidence intervals, while accounting for the random effect of soil properties tested using the linear mixed-effects model. Mean coefficient estimates are significant if their 95% confidence intervals did not contain 0. Negative or positive trend values indicate temporal decrease or increase, respectively. *, p < 0.05. **, p < 0.01. ***, p < 0.001. SWCU, soil water content in the upper layer (0–40 cm). SWCD, soil water content in the deeper layer (40–100 cm). NIT, soil NO3 contents. Av. PU, soil Avail. P contents in the upper layer. Av. PD, soil Avail. P contents in the deeper layer.
Land 11 02320 g005
Table 1. Soil physicochemical characteristics of 20 cm topsoil samples at three salinity levels.
Salinity LevelSalt
Contents
(g kg−1)
EC
(ds m−1)
pHOrganic
Matter
(g kg−1)
Total N
(g kg−1)
Avail. P
(mg kg−1)
Avail. N
(mg kg−1)
High
Range13.06–8.542.23–3.398.28–7.978–4.190.53–0.2513.4–12.343.9–18.9
Mean11.03 2.878.07 5.92 0.39 12.7 26.6
S.E.s1.71 0.470.11 1.30 0.11 0.4 9.2
Medium
Range6.94–4.191.11–1.828.49–8.1312.16–2.80.86–0.4712.3–11.249.1–26.7
Mean5.43 1.428.29 6.97 0.55 11.7 40.0
S.E.s0.95 0.270.12 3.66 0.14 0.4 9.0
Low
Range3.97–2.020.55–1.058.65–8.2411.5–5.720.76–0.4312.4–11.182.7–20.7
Mean3.20 0.858.49 7.92 0.60 11.7 49.1
S.E.s0.75 0.220.15 1.90 0.10 0.5 21.9
Table 2. Results of multiple-way ANOVA on the effects of salinity (S), N addition (N), growth stage (G), and soil depth (D) and their interactions on soil pH and water contents.
Soil
Properties
Salinity
(S)
N Addition
(N)
Growth Stage (G)Soil Depth
(D)
S × N
pH*************
SWC***********
The multiple-way ANOVA analysis results are also shown for indicating the significance of main and interaction effects: ***, p < 0.001; **, p < 0.01; *, p < 0.05.
Table 3. Results of multiple-way ANOVA on the effects of salinity (S), N addition (N), growth stage (G), soil depth (D) and their interactions on soil salt and nutrient characteristics.
Soil
Properties
Salinity
(S)
N Addition
(N)
Growth Stage (G)Soil Depth
(D)
S × N
EC**********
NO3*************
Avail. P************
The multiple-way ANOVA analysis results are also shown for indicating the significance of main and interaction effects: ***, p < 0.001; *, p < 0.05; –, not significant.
Table 4. Results of multiple-way ANOVA on the effects of salinity (S), N addition (N), growth stage (G), and soil depth (D) and their interactions on growth indices of P. australis.
Growth
Indices
Salinity
(S)
N Addition
(N)
Growth Stage (G)S × NS × N × G
Plant height ***************
SPAD*******
The multiple-way ANOVA analysis results are also shown for indicating the significance of main and interaction effects: ***, p < 0.001; *, p < 0.05; –, not significant.
Table 5. Mean values and results of multiple-way ANOVA on the effects of salinity (S), N addition (N), and their interactions (S × N) on aboveground biomass and other growth indices of P. australis.
TreatmentsBiomass
(t ha−1 F.W.)
Dry Matter
(t ha−1 D.W.)
Plant Moisture
(%)
Vegetation Diversity
H33.5 ± 1.2 a18.1 ± 0.8 a53.8 ± 0.6 a0.50 ± 0.01 c
HN21.7 ± 0.5 c11.5 ± 0.3 c53.2 ± 0.3 ab0.75 ± 0.01 b
M28.5 ± 1.1 b14.7 ± 0.6 b51.5 ± 0.6 b0.82 ± 0.02 b
MN18 ± 0.4 d8.8 ± 0.2 d48.6 ± 0.3 c1.36 ± 0.02 a
L12.5 ± 0.5 e5.9 ± 0.3 e47 ± 0.5 c0.44 ± 0.01 c
LN7.6 ± 1.2 f3.6 ± 0.5 f46.9 ± 1 c0.74 ± 0.06 b
S************
N**********
S × N*******
Mean values ± S.E.s (n = 3) are displayed. Significant differences are denoted by letters (p < 0.05). The two-way ANOVA analysis results are also shown for indicating the significance of main (S, salinity levels; N, N addition) and interaction effects: ***, p < 0.001; **, p < 0.01; *, p < 0.05; –, not significant.
Publisher’s Note: MDPI stays neutral with regard to jurisdictional claims in published maps and institutional affiliations.

