
Assessment of Agricultural Drought Based on Reanalysis Soil Moisture in Southern China
by
 ,
,
Wei Shangguan
1,* ,
,
Ruqing Zhang
1,
Lu Li
1,
Shulei Zhang
1,
Ye Zhang
1,
Feini Huang
1,
Jianduo Li
2 and
Wei Liu
3 1
Southern Marine Science and Engineering Guangdong Laboratory (Zhuhai), Guangdong Province Key Laboratory for Climate Change and Natural Disaster Studies, School of Atmospheric Sciences, Sun Yat-sen University, Guangzhou 510275, China
2
State Key Laboratory of Severe Weather, Chinese Academy of Meteorological Sciences, Beijing 100081, China
3
Guangdong Climate Center, Guangzhou 510275, China
*
Author to whom correspondence should be addressed.
Land 2022, 11(4), 502; https://doi.org/10.3390/land11040502
Submission received: 5 March 2022
/
Revised: 23 March 2022
/
Accepted: 30 March 2022
/
Published: 31 March 2022
(This article belongs to the Special Issue Soil Moisture and Land Surface Processes: Observation, Modeling and Coupling Analysis)
Abstract
:Accurate assessment of agricultural drought is useful for ecosystem services. This is a successive work of our previous study that assessed agricultural drought using the soil water deficit index (SWDI) based on ERA5-Land in the four southern provinces of China from 2017 to 2019. Firstly, in addition to ERA5-Land, the suitability of CLDAS (China Land Data Assimilation System) soil moisture for drought assessment was investigated. Then, the study was extended with more comprehensive analysis and a much longer period (1981–2020). Based on three climate zones, in situ soil moisture was used for evaluation of both reanalysis datasets and agricultural drought. It was found that ERA5-Land_SWDI and CLDAS_SWDI have a good correlation with the in situ SWDI. ERA5-Land and CLDAS demonstrate some differences in representing agricultural drought but have a similar performance evaluated by in situ soil moisture. Droughts from 2001 to 2010 were more serious than in the other three decades, and droughts have become longer and severer in some areas in the last 40 years. There was a good correlation between agricultural drought and meteorological drought. Our work offers important insights for agricultural drought risk management in the four southern provinces of China.
1. Introduction
Drought is the most complex and influential natural weather hazard event among all natural disasters [1]. Due to the slow development and long duration of drought events, they have a profound impact on agriculture, ecology, hydrology, and the social economy. [2,3]. Like many other places in the world, frequent droughts have caused serious crop production failure and severe social and economic losses [4] in the four southern provinces of China (Yunnan, Guangxi, Guangdong, and Hainan), where about 223 million people reside. For example, from 2009 to 2010, an extremely serious drought event occurred in the southwest region (Yunnan, Guizhou, Chongqing, Tibet, and Sichuan), affecting 6,368,700 km2 of arable land and 5,010,100 km2 of crops. In this region, Yunnan was the most severely affected area, with the largest affected and disaster-stricken area, and 8.89 million people and 4.86 million livestock had drinking water difficulties [5]. Recently, from the autumn of 2020 to February 2022, the Dongjiang River Basin of Guangdong witnessed a persistent drought which led to the most severe drought in the last 60 years, and cities such as Shenzhen suffered a shortage of water supply even though this region is considered to be abundant in rainfall (https://www.sohu.com/a/523481769_121119270) (accessed on 20 March 2022).
In order to assess the impact of drought on agricultural productivity and crop (plant) growth, it is important to study agricultural drought. Agricultural drought occurs when insufficient soil moisture begins to adversely affect crop growth and eventually reduce crop yields [6]. A variety of agricultural drought indices have been developed to define agricultural drought, such as the soil moisture deficit index [7], the normalized difference vegetation index [8], soil wetness deficit index [9], vegetation condition index [10,11], and soil water deficit index [12]. Among them, the soil water deficit index (SWDI) can incorporate a higher biophysics meaning than other approaches by taking both soil moisture and soil properties into account [12], as soil water holding capacity and soil texture vary with locations [13]. Additionally, this index can also efficiently identify the primary features of agricultural drought, such as the duration, severity, and frequency.
The most important parameter of the SWDI is soil moisture (SM), which plays an important role in vegetation productivity. When SM is sufficient, the short-term precipitation shortages only have a slight impact on agriculture [14,15]. There are three major sources of SM data, including in situ observation, remote sensing, and reanalysis data. Conventionally, in situ observation data are from in situ networks, which are generally limited in temporal and spatial coverage and even unavailable in some remote regions [16,17]. However, the rapid development of remote sensing data and reanalysis data has the characteristics of a large scale and long term. These data are very suitable for defining agricultural drought.
Currently, there are many studies that used in situ SM data to verify the accuracy of remote sensing and reanalysis SM data [18,19]. These studies suggested that both products are satisfactory in capturing the annual cycle of SM and its short-term changes. Nevertheless, these studies also showed that reanalysis SM data have higher consistency and better accuracy than remote sensing data. Additionally, remote sensing data are limited to the surface soil layer and may have low accuracy in urban areas and areas with dense vegetation. Based on the better spatial coverage and longer time series, we used two reanalysis SM datasets for drought assessment, including CLDAS (China Land Data Assimilation System) and ERA5-Land, which have been proved to have high accuracy by previous studies. Through evaluating 18 satellite and model-based SM products based on observations majorly from Europe and the USA, Beck et al. (2021) suggested that ERA5-Land is one of the best, with an average R of 0.72 with observations [20]. Han et al. showed that CLDAS SM is of a higher accuracy than ERA and GLDAS (Global Land Data Assimilation System) evaluated using in situ SM of the Qinghai–Tibet Plateau [21].
However, few studies have assessed agricultural drought using SM reanalysis data for the four southern provinces of China. We reviewed studies that investigated droughts in the four southern provinces of China in our previous study [22] and found that reanalysis SM products had not been used for agricultural drought assessment. In our previous study [22], we assessed agricultural drought using the SWDI based on ERA5-Land in the four southern provinces of China from 2017 to 2019, which used a similar methodology to that of Zhu et al. [23]. The above study had some interesting findings such as the finding that the subsurface SM is more suitable for drought monitoring, but it still has some limitations. First, limited data were used in the assessment, i.e., only three years of ERA5-Land and one year of in situ data, while much more data including CLDAS are available for comparisons and a longer-term assessment. Second, the relationship between agricultural drought and meteorological drought was not investigated thoroughly. Third, the previous study focused on the SWDI itself but lacked a long-term trend and drought characteristics such as drought duration.
To fill the above research gaps, the objective of this study was to evaluate the suitability of ERA5-Land and CLDAS to assess agricultural drought and then investigate the characteristics of agricultural drought in the four southern provinces of China (Guangdong, Guangxi, Yunnan, and Hainan). We extended our previous study in the following aspects. First, we added CLDAS SM in addition to ERA5-Land SM to compare their suitability for drought assessment. Second, in the evaluation of reanalysis data, we used in situ observations from 2013 to 2017 instead of only one year of observations, as in Zhang et al. [22]. Third, we extended the study period to 2013–2017 for CLDAS and 1981–2020 for ERA5-Land. Fourth, potential evapotranspiration (PET) in the atmospheric water deficit index (AWD) was replaced by total evaporation (ET) to compare and analyze the relationship between agricultural drought and meteorological drought. Last but not least, we investigated multiple drought characteristics (including drought number, severity, duration, and interval) based on the SWDI and the long-term trends of the SWDI and drought characteristics.
The remaining content of this paper is as follows. The second section introduces the study area, data, methods, and evaluation indices. In the third section, evaluation and comparison of ERA5-Land and CLDAS are provided using in situ SM from 2013 to 2017, and then the results and discussion are presented on agricultural drought based on ERA5-Land in the four southern provinces of China during a 40-year period (1981–2020). The last section is the conclusion.
2. Materials and Methods
2.1. Study Area
The four southern provinces of China (Guangdong, Guangxi, Yunnan, and Hainan) lie between 18–29° N and 92–117° E, covering most of the area of the Pearl River Basin. The total land area is about 846,825 km2. Furthermore, Hong Kong and Macao are in this area, but they have not been analyzed separately due to their small area. Owing to the East Asian Monsoon, this region is more variable in precipitation than other regions in China [24]. The average annual precipitation is 1500–2300 mm, and the monthly average temperature is 6–25 ℃. It is worth noting that the growing season is the whole year in almost all areas of this region, due to the temperature almost always being above 0 °C. This region is a typical tropic and subtropic area with a high population density and produces about 7% of China’s crops (https://data.stats.gov.cn/) (accessed on 20 March 2022).
The study area can be divided into a tropical, monsoon climate zone; tropical, savannah climate zone; temperate, no dry season climate zone; temperate, dry winter climate zone; and cold, dry winter climate zone, according to the Köppen climate classification (http://koeppen-geiger.vu-wien.ac.at/shifts.htm) (accessed on 20 March 2022), as shown in Figure 1 [25]. In this study, we conducted analysis based on three main climate zones, including the tropical climate zone (merging the tropical, monsoon climate zone and the tropical, savannah climate zone), the temperate, no dry season climate zone, and the temperate, dry winter climate zone. The cold, dry winter climate zone in northwestern Yunnan was ignored due to its small area.
2.2. Data
2.2.1. In Situ Data
The in situ SM data were obtained from the China Meteorological Information Center (CMA; http://data.cma.cn/) (accessed on 20 March 2022) for the period of 2013–2017, which have depths of 10 cm and 20 cm. Quality control was carried out as done in Zhang et al. [22]. After quality control, there were a total of 76 stations left, as shown in Figure 1.
2.2.2. CLDAS Data
CLDAS is the second version of the China Meteorological Data Land Surface Data Assimilation System released by the National Meteorological Information Center, which uses the ensemble prediction of three land models [26]. We used CLDAS SM covering the period of 2013–2017 with a spatial resolution of 0.0625° by 0.0625°. For the convenience of comparison with ERA5-Land, we converted these data to a 0.1° by 0.1° spatial resolution using the bilinear interpolation method. The layers of 0–10 cm and 10–40 cm were chosen for our research.
2.2.3. ERA5-Land Data
ERA5-Land is the land component of the fifth generation of European Reanalysis (ERA5) [27]. The spatial resolution of this dataset is 0.1° by 0.1°. In this research, we chose the precipitation, potential evaporation, total evaporation, and second layer (7–28 cm) SM from ERA5-Land for the period of 1981–2020. The units of precipitation, potential evaporation, and total evaporation are mm. The second layer (7–28cm) SM was used because this layer is more suitable for reflecting the characteristics of agricultural drought [22] and can better indicate the available water storage for plant growth than surface (0–7cm) SM, which is highly affected by anomalous temperature or precipitation events [28].
For the convenience of comparison and analysis, the in situ observations, CLDAS SM, and ERA5-Land SM were converted into the units of m3/m3 and the temporal resolution of one day. At the same time, we processed the depth of in situ and CLDAS SM to make it consistent with the depth of ERA5-Land (i.e., 7–28 cm). This process was carried out using a linear weighting as follows:
where Smin situ and Smcldas are the in situ and CLDAS SM for 7–28cm, respectively; Smin situ10 and Smin situ20 are the in situ SM at 10 cm and 20 cm, respectively; and Smcldas10 and Smcldas40 are the CLDAS SM for the layers of 0–10 cm and 10–40 cm, respectively. For Equation (1), as the distance between Smin situ10 and Smin situ20 is 10 cm, and the distance between Smin situ10 and the middle point of the second layer of ERA5-Land with a depth of 17.5 cm is 7.5 cm, the weights of Smin situ10 and Smin situ20 were set to 2.5/10 and 7.5/10, respectively. For Equation (2), as the first layer of CLDAS takes up 3 cm out of the 21 cm of the second layer of ERA5-Land, and the second layer of CLDAS takes up 18 cm, the weights of Smcldas10 and Smin situ20 were set to 3/21 and 18/21, respectively.
2.3. Methods
First, the in situ SM data were used to analyze and evaluate CLDAS and ERA5-Land from 2013 to 2017. After the evaluation, agricultural drought assessed by CLDAS and ERA5-Land SM was compared. Then, ERA5-Land SM was used to analyze the long-term agricultural drought characteristics and their tendency in the four southern provinces from 1981 to 2020. Finally, the atmospheric water deficit index (AWD) was used to analyze the relationship between agricultural drought and meteorological drought.
2.3.1. Soil Water Deficit Index (SWDI)
The SWDI was used to characterize agricultural drought [12]. This index can be calculated as follows:
where θ is the SM content, and θFC, θwp, and θawc represent the field capacity, wilting point, and available water capacity in each dataset, respectively. In this research, the 95th SM and 5th SM of the time series were used to denote θFC and θwp [29]. It should be noted that we used data for as long as possible (i.e., 1981–2020 for ERA5-Land) to calculate θFC and θwp to guarantee that they will not be affected by short-term variation, rather than data of the evaluation and comparison period only (2013–2017). A negative value of the SWDI indicates that the SM content is less than the field capacity, and when the SWDI value drops below 0, the initial water pressure at the beginning of the drought will be witnessed [30]. There are five categories of drought: no drought (>0), mild (0~−2), moderate (−2~−5), severe (−5~−10), and extreme (<−10) [29].
2.3.2. Atmospheric Water Deficit Index (AWD)
The AWD was used as the index of meteorological drought to investigate its relationship with agriculture drought. The AWD, reflecting the drought condition related to meteorological parameters, is the difference between precipitation (P) and potential evapotranspiration (PET) [31]. It is calculated as follows:
where P and PET represent precipitation and potential evapotranspiration, respectively. In our study, these two parameters were taken from ERA5-Land, both with the unit of mm. When the value of the AWD is lower than 0, it indicates drought, and when it is lower than −50 mm, it indicates extreme drought [12].
2.3.3. Drought Characterization and Trend Detection
A drought event starts when the SWDI falls below a threshold of 0, and it ends when the SWDI returns to positive [12]. In our study, we focused on severe and extreme droughts (i.e., SWDI < −5) for at least 30 days. Once a drought event has been determined, the drought number, severity, duration, and interval can be obtained. Drought number refers to the number of drought events. Drought severity is defined as the averaged SWDI during one drought event. Drought duration is the length of days that a drought event lasts. Drought interval is the number of days between adjacent drought events.
The nonparametric Mann–Kendall (M–K) approach is widely used for trend detection in geophysical time series data [32,33]. In this study, we used it to reflect the long-term trend for the SWDI for all periods and for the drought duration and severity of each year. This approach uses the M–K z-score to calculate the significance level using a p value with respect to the Gaussian distribution. A detailed description of the M–K test can be found in Le et al. [34] and Tosunoglu et al. [35]. Regarding the z-score, −1.96 < z-score < −1.64 and 1.64 < z-score < 1.96 represent a weak trend, while z-score < −1.96 or > 1.96 represents a significant trend [36]. In our research, only the significant trend was counted (p value < 0.05).
2.3.4. Evaluation Indices
In this study, CLDAS and ERA5-Land were assessed against in situ SM using common statistical performance metrics, including root mean square error (RMSE), bias, and Pearson’s correlation coefficient (R). The number of samples is due to the available observations at each station. RMSE describes the sample standard deviation of the differences between the reanalysis data and in situ data. Bias measures the error between the reanalysis data and the in situ data. R measures the extent of the interdependence of two datasets. The three indices are defined as follows:
where n is the sample size, Xi is the in situ dataset, Yi is the CLDAS or ERA5-Land dataset, and and are the mean values of these three datasets, respectively.
3. Results and Discussion
3.1. Evaluation of CLDAS and ERA5-Land Soil Moisture
3.1.1. Statistical Characteristics of Soil Moisture
Table 1 provides the statistical characteristics of the SM of the three datasets from 2013 to 2017. It can be seen that the means of the in situ SM in the three climate zones were between 0.26 and 0.32 m3/m3, and those of ERA5-Land and CLDAS were 0.36–0.40 m3/m3 and 0.32–0.34 m3/m3, respectively. Overall, both reanalysis datasets had a wet bias, especially ERA5-Land. Both ERA5-Land and CLDAS had a larger wet bias (about 0.1 and 0.06 m3/m3, respectively) in the tropical climate zone than the other two climate zones (about 0.08 and 0.02 m3/m3, respectively). The wet bias of both datasets according to the median was even larger. However, this wet bias can be reduced to a certain extent by calculating the SWDI through Formulas (1) and (2), as founded by Zhang et al. [22].
For the minimum, both ERA5-Land and CLDAS had larger values than the in situ SM, especially CLDAS, which indicates that these two datasets may ignore some extreme droughts, but ERA5-Land is relatively better than CLDAS. For the standard deviation, the order is CLDAS < in situ < ERA5-Land, which indicates that ERA5-Land overestimated the annual variation while CLDAS underestimated it. The temperate, no dry season climate zone’s standard deviations were smaller than those of the other two climate zones, indicating that the variation in SM in this zone is smaller. This might be related to the high seasonal variation in precipitation associated with an intensified hydrological cycle in tropical and temperate, dry winter climate zones [37].
3.1.2. Spatial Pattern of Soil Moisture
Figure S1 shows the spatial distribution of the average SM of the three datasets from 2013 to 2017. It can be seen from Figure S1a that the in situ SM ranged around 0.15–0.45 m3/m3. The lowest SM appeared in the central area of Yunnan and Hainan. For ERA5-Land and CLDAS, the ranges were about 0.25–0.5 m3/m3 and 0.25–0.4 m3/m3, respectively. Although their ranges were different, these two datasets had a similar spatial distribution, that is, relatively low SM was found in the northwest of Yunnan, the southwest of Guangxi, central Guangdong, and the southwest of Hainan (Figure S1b,c). However, ERA5-Land had a larger spatial variation and a wetter SM than CLDAS in almost all the areas.
3.1.3. Evaluation of CLDAS and ERA5-Land Soil Moisture
In order to verify the accuracy of ERA5-Land and CLDAS, the evaluation indicators (i.e., RMSE, R, and bias) using the in situ soil moisture from 2013 to 2017 in the four southern provinces and three climate zones are shown in Figure S2. This figure shows that the RMSE and bias of ERA5-Land were relatively larger than those of CLDAS. From the perspective of bias, both datasets have a wet bias for the ranges of 0.05–0.15 m3/m3 and 0–0.05 m3/m3. Consistent with our previous study [22], this error can be reduced to a certain extent when calculating the SWDI index (Figure 2). At the same time, the correlation coefficient between these two datasets and the in situ data was between 0.6 and 0.8, indicating that the two datasets can sufficiently reflect the changes in soil moisture in the four southern provinces. Our results for ERA5-Land show a similar correlation to that of Wu et al. [38] (i.e., a mean R of 0.64 in southern humid areas) and Kim et al. [39] (i.e., a mean R of about 0.7 for the global area). Among the three climate zones, the temperate, dry winter climate zone had a lower average RMSE and a higher average R than the other two zones. As ERA5-Land and CLDAS may differ in quality over time, there may be some limitations when evaluating these datasets using in situ data from 2013 to 2017 only.
3.2. Evaluation of CLDAS_SWDI, ERA5-Land_SWDI, and Agricultural Drought Characteristics
To verify the accuracy of ERA5-Land_SWDI and CLDAS_SWDI in the four southern provinces of China, we evaluated them with the in situ data from 2013 to 2017. In addition, we also compared their spatial pattern and temporal variation with the in situ SWDI.
3.2.1. Spatial and Temporal Pattern of SWDI
Figure 2 shows the spatial distribution of the average SWDI based on the in situ, ERA5-Land, and CLDAS data during 2013–2017. ERA5-Land had a similar range of the SWDI to the in situ data (−3~−7), while CLDAS had a lower SWDI in most places (mostly below −4). It can be seen from Figure 2b that ERA5-Land_SWDI coincides well with in situ. The degree of aridity was relatively low in the temperate, no dry season climate zone, while it was relatively high in the northwest of Yunnan in the temperate, dry winter climate zone. Similar to ERA5-Land, CLDAS also identified the northwest of Yunnan as a relatively arid region. However, in contrast to ERA5-Land, CLDAS had low SWDI values in the temperate, no dry season climate zone, and it identified Hainan and the coastal areas of Guangxi and Guangdong as relatively arid regions, too. This was likely an overestimation of drought according to a previous study [40].
Figure 3 shows the SWDI time series of the three datasets in the three climatic zones. The SWDI in all climate zones ranged from approximately −10 to 0, and this was rarely surpassed. In the tropical climate zone, severe and extreme droughts (SWDI < −5) usually happened between January and May (continuous drought). In the temperate, no dry season climate zone, the drought duration was shorter than that in the other two climate zones, and serious drought events usually happened in the spring and winter, though a drought was witnessed in the October of 2017. In the temperate, dry winter climate zone, severe and extreme droughts usually happened between December and June (continuous drought), which was the longest period among the three climate zones. In addition, there was a slight increasing trend of the SWDI in this region. In general, both reanalysis datasets can capture major variation in the SWDI compared with the in situ SWDI, though they may underestimate or overestimate in some periods. The best consistency with the in situ SWDI was observed in the temperate, dry winter climate zone. In the other two climate zones, overestimations of the SWDI were observed for ERA5-Land, while underestimations were observed for CLDAS in some periods.
3.2.2. Evaluation of CLDAS_SWDI and ERA5-Land_SWDI
Figure 4 summarizes the RMSE, R, and bias of ERA5-Land and CLDAS in the four southern provinces and three climatic zones. For the whole study area, both datasets had a similar RMSE and R, which is different from the evaluation of SM. Therefore, we emphasize that the performance of the SWDI is not necessarily in accordance with that of soil moisture. The RMSE mostly ranged from 2 to 3.5, while the correlation coefficient mostly ranged between 0.6 and 0.8. Regarding the bias, ERA5-Land had a positive bias, indicating that droughts were relatively weak, while CLDAS had a negative bias, indicating that droughts were relatively serious. Among the three climate zones, the temperate, dry winter climate zone had the best performance according to the three metrics. In addition, ERA5-Land had a slightly better performance than CLDAS in the temperate, dry winter climate zone, while the opposite trend occurred in the tropical climate zone.
3.2.3. Comparison of CLDAS_SWDI and ERA5-Land_SWDI
Figure S3a shows the difference between the average SWDI of ERA5-Land and CLDAS from 2013 to 2017. The difference varied with locations and was not very large (mainly from −1 to 2.5). Except for the negative value in central and eastern Yunnan, positive values were witnessed in other places. In particular, relatively higher values of ERA5-Land_SWDI were observed in the temperate, no dry season climate zone. Figure S3b shows the distribution of the daily SWDI correlation coefficient between the two datasets. In most regions, the R value was greater than 0.7, and it was even greater than 0.85 in western Yunnan, the coastal areas of Guangdong, and most parts of Hainan. This suggests that these two datasets can consistently show the variations in agricultural drought in the four southern provinces. However, the R value appeared to be below 0.5 in north-central Guangxi, and caution should be exercised when interpreting the results of this area.
3.2.4. Comparison of CLDAS and ERA5-Land SWDIs and Drought Characteristics
Figure 5 shows the performance of ERA5-Land and CLDAS in reflecting drought characteristics based on the SWDI, taking the in situ SM from 2013 to 2017 as the benchmark data. It can be seen from Figure 5a that in all three climate zones, ERA5-Land_SWDI was larger than in situ_SWDI at most stations (a wet deviation), while CLDAS_SWDI was smaller than in situ_SWDI (a dry deviation). For the number of droughts (Figure 5b), ERA5-Land had a better performance than CLDAS as CLDAS overestimated at most stations. For drought duration (Figure 5c), both reanalysis datasets had a similar performance as most stations are around the 1:1 line. For drought interval (Figure 5d), both reanalysis datasets also had a similar performance, with some exceptions at several sites where ERA5-Land had a much larger bias. Finally, in terms of drought severity (Figure 5e), both reanalysis datasets overestimated at most sites.
Through the above analysis, we can understand that ERA5-Land and CLDAS were consistent in representing the time variation in the SWDI in most regions (Figure S3), but ERA5-Land had higher values than CLDAS in most areas, especially in the temperate, no dry season climate zone. Moreover, they had a similar performance in representing agricultural drought characteristics (Figure 5), though some differences existed and ERA5-Land was better than CLDAS in terms of drought number. Due to data availability, we used ERA5-Land for the following long-term analysis of agricultural drought in the four southern provinces of China.
3.3. Agricultural Drought in the Four Southern Provinces from 1981 to 2020
In this section, we used the SWDI and drought characteristics, including drought number, severity, duration, and interval, to analyze the spatial distribution of agricultural drought in the four southern provinces, and we used the M–K test method to observe the trend of changes in the past 40 years.
3.3.1. Spatial Pattern of Average SWDI and Tendency of SWDI
Wang et al. and Ding et al. reported that the East Asian Summer Monsoon system has a decade variation [41,42]. Therefore, in the following analysis, we took this into account and analyzed the agricultural drought for every ten years, i.e., 1981–1990, 1991–2000, 2001–2010, and 2011–2020 (Figure 6). Figure 6a shows that the SWDI was relatively larger in most parts of the temperate, no dry season climate zone. However, the SWDI was relatively smaller in most areas of Yunnan and coastal areas of Hainan, Guangxi, and Guangdong, indicating a drier situation for the period of 1981–2020. The three decades of 1981–1990 (Figure 6b), 1991–2000 (Figure 6c), and 2011–2020 (Figure 6e) had similar spatial distributions to the 40-year pattern, although there were some differences in numerical values. For the period 2001–2010 (Figure 6d), the SWDI of the temperate, no dry season climate zone was smaller than that of other years, indicating that the droughts were relatively severe. In addition, we can acknowledge from Figure 6f that there is a clear downward trend, indicating that the degree of drought is getting increasingly serious in western Yunnan and the junction of Yunnan and Guangxi. We should pay attention to the agricultural drought in this area.
3.3.2. Spatial Pattern of Agricultural Drought Characteristics
The distribution and proportion of drought number, drought interval, drought duration, and drought event severity based on the SWDI classification are shown in Figures S4–S7. From the 40-year-long time series, it can be concluded that drought number, drought interval, and drought duration have consistency in their spatial distributions, since they are related according to their definition. During this 40-year period, the spatial distribution pattern of different drought characteristics is relatively stable in different decades. In these decades, small drought numbers, large drought intervals, and short drought durations appeared in most parts of Guangxi and northern Guangdong, while large drought numbers, small drought intervals, and long drought durations occurred in the northwest to central parts of Yunnan and coastal areas. A high drought severity was recorded in northern Guangxi mostly, while a low drought severity was recorded in southwest Guangxi during 1981–1990 and 2011–2020. One interesting finding is that the temperate, no dry season climate zone witnessed more short droughts with a high severity than other areas.
Except for 2001–2010, the other decades’ distributions of the four agricultural drought characteristics were quite similar to the 40-year distribution. During 2001 to 2010, the drought characteristics reflect more serious droughts than other decades in most areas of Guangxi, i.e., higher drought numbers, shorter drought intervals, longer durations, and higher severities. These distributions correspond to the proportion histogram in Figures S4f, S5f, S6f, and S7f. For example, for drought events, the minimum number is 5–8, and the maximum number of drought events is 15–20 in 1981–1990, 1991–2000, and 2011–2020, but during 2001–2010, the minimum value is obviously higher than the other three decades in Guangxi. This corresponds to the histogram in Figure S4f, and whether in the range of number >5, number >10, or number >15, the proportions from 2001 to 2010 were relatively large.
3.3.3. Tendency of the Agricultural Drought Characteristics
To further explore the changes in agricultural drought during the 40 years from 1981 to 2020, the trends of drought duration and drought severity were computed using the Mann–Kendall (M–K) nonparametric analysis algorithm (Figure 7). This method showed that the drought duration became longer, while the drought severity had a downward trend, which means that both drought characteristics have become more serious in the past 40 years. At the same time, the areas of drought duration with significant changes were located in most parts of Yunnan, a small part of Guangxi, and the southern part of Guangdong, while the areas of drought severity with significant changes were much smaller, including northwest and east Yunnan, and northeast Guangxi. It should be noted that in some areas of Guangdong, the drought severity became less serious.
3.3.4. Comparison between ERA5-Land_SWDI and AWD
Meteorological drought is the basic cause of agricultural drought, and agricultural drought is the long-term response of meteorological drought. There are many meteorological droughts that cause agricultural drought. Niu et al. found that ENSO or the Indian Ocean Dipole was the main reason for the occurrence of extreme drought events in the Pearl River Basin [43]. This section uses the Pearson correlation between the AWD and SWDI to find the relationship between meteorological drought and agricultural drought. The AWDp is derived from the difference between daily precipitation and daily potential evapotranspiration. This index was chosen because, due to global climate warming, the high evaporation caused by the rising temperature leads to dry soil, but continuous rainfall often supplements SM and alleviates soil dryness. Precipitation and potential evapotranspiration are the main factors affecting the SM content. It can be seen from Figure 8a that, except for the positive correlation between the AWDp and SWDI indices in Yunnan Province, other regions show a negative correlation, with a correlation coefficient below 0 mostly. The reason for the negative correlation may be because potential evaporation in ERA5-Land is computed by carrying out a second call to the surface energy balance routine with the vegetation variables set to “crops/mixed farming” and assuming no stress from SM. Therefore, we used the total evapotranspiration in ERA5-Land to replace the potential evapotranspiration (represented by AWDt), and the result is shown in Figure 8b. Almost all areas reached above 0.45, and the western part of Yunnan and the coastal areas of Guangdong also reached above 0.6. The results show that when using total evapotranspiration instead of potential evapotranspiration, agricultural drought and meteorological drought had a better temporal correlation, indicating that it is necessary to use the SWDI to capture agricultural drought as meteorological drought calculated with potential evapotranspiration demonstrated a significant difference. It should be noted that the time lag between meteorological drought and soil moisture drought may have some effect on the daily drought correlation analysis. However, we found that the 1 to 7 day-lagged correlation between the AWD and SWDI did not have a significant change in our case (not shown).
4. Conclusions
In this study, using in situ data as a benchmark, we first evaluated and compared ERA5-Land and CLDAS SM from 2013 to 2017. Then, the subsurface SM was used to calculate the agricultural drought index (SWDI) for both reanalysis datasets, and they were also evaluated and compared for agricultural drought assessment. After this, we used ERA5-Land to analyze agricultural drought in the four southern provinces from 1981 to 2020. Finally, we used the AWD index to analyze the relationship between agricultural drought and meteorological drought. The main conclusions are as follows:
- (1)
- ERA5-Land and CLDAS overestimated SM in each climate zone. However, ERA5-Land_SWDI had a wet bias, while CLDAS_SWDI had a dry bias. ERA5-Land and CLDAS had a similar performance in representing agricultural drought characteristics, though some differences existed and ERA5-Land was better than CLDAS in terms of drought numbers. However, CLDAS has limited data availability, and ERA5-Land is recommended for long-term studies.
- (2)
- During the period 1981–2020, the SWDI was relatively larger in most areas of the temperate, no dry season climate zone, while the SWDI was relatively small in most areas of Yunnan and coastal areas, indicating that the degree of drought was relatively severe. The number, interval, and duration of drought events had a relatively similar spatial distribution in the different decades during the past 40 years. In addition, droughts from 2001 to 2010 were more serious than those from the other three decades.
- (3)
- The drought duration showed a significant upward trend in Yunnan, parts of Guangxi, and parts of the southern coast of Guangdong. At the same time, the drought severity showed an upward trend in areas of northwest and east Yunnan, and northeast Guangxi.
- (4)
- By using total evapotranspiration instead of potential evapotranspiration, a higher correlation between agricultural drought and meteorological drought was witnessed, which indicates that it is necessary to use the SWDI to capture agricultural drought.
Studying the past agricultural drought conditions in the four southern provinces of China is conducive to predicting future drought conditions and preparing in advance to reduce the impact and disasters caused by agricultural drought. We will conduct further research from the following aspects: (1) use of bias correction methods to correct the deviation between the in situ data and our selected dataset; (2) comparison of other methods to obtain the soil moisture field water holding capacity and wilting point; (3) use of a variety of drought indices to analyze agricultural drought conditions; (4) use of other criteria to divide the zones of the four southern provinces, such as vegetation distribution, and altitude; (5) forecast of the future agricultural drought conditions and risks.
Supplementary Materials
The following supporting information can be downloaded at: https://www.mdpi.com/article/10.3390/land11040502/s1, Figure S1: Distribution of average soil moisture about the in situ, ERA5-Land and CLDAS from 2013 to 2017; Figure S2: RMSE (a), R (b) and Bias (c) of the SM between the ERA5-Land and in situ data and between CLDAS and in situ data in the whole study area and the three climate zones; Figure S3: Spatial distribution of difference (a) and correlation coefficient (b) between ERA5-Land and CLDAS. All values of SWDI for the periods from 2013 to 2017; Figure S4: The distribution of drought event number for 1981–1990 (a), 1991–2000 (b), 2001–2010 (c), 2011–2020 (d) and 1981–2020 (e) according to SWDI and the proportion of drought number in each decade (f). Note that Figure S4e has a different legend from others; Figure S5: The distribution of drought event interval for 1981–1990 (a), 1991–2000 (b), 2001–2010 (c), 2011–2020 (d) and 1981–2020 (e) according to SWDI and the proportion of drought interval in each period (f); Figure S6: The distribution of drought event duration for 1981–1990 (a), 1991–2000 (b), 2001–2010 (c), 2011–2020 (d) and 1981–2020 (e) according to SWDI and the proportion of drought duration in each period (f); Figure S7: The distribution of drought event severity for 1981–1990 (a), 1991–2000 (b), 2001–2010 (c), 2011–2020 (d) and 1981–2020 (e) according to SWDI and the proportion of drought severity in each period (f).
Author Contributions
Conceptualization, W.S.; methodology, R.Z., W.L. and W.S.; validation, J.L., R.Z. and W.S.; formal analysis, W.S. and R.Z.; investigation, W.S., S.Z. and R.Z.; writing—original draft preparation, R.Z.; writing—review and editing, W.S., S.Z., Y.Z. and F.H.; visualization, R.Z. and L.L.; supervision, W.S.; project administration, W.S.; funding acquisition, W.S. All authors have read and agreed to the published version of the manuscript.
Funding
This research was funded by the Natural Science Foundation of China under Grants 41975122, U1811464, and 42088101, the National Key R&D Program of China under Grant 2017YFA0604300, the Innovation Group Project of Southern Marine Science and Engineering Guangdong Laboratory (Zhuhai) (NO. 311020008), and the Fundamental Research Funds for the Central Universities, Sun Yat-sen University.
Data Availability Statement
The Köppen climate zone classification map is available at http://koeppen-geiger.vu-wien.ac.at/shifts.htm. The ERA5-Land dataset is available at https://cds.climate.copernicus.eu/cdsapp#!/dataset/reanalysis-era5-land?tab=form. The in situ soil moisture data and CLDAS are available at http://data.cma.cn with certain permissions (all accessed on 15 March 2022).
Acknowledgments
The authors thank the anonymous reviewers for providing such valuable comments.
Conflicts of Interest
The authors declare no conflict of interest.
References
- Nicolai-Shaw, N.; Zscheischler, J.; Hirschi, M.; Gudmundsson, L.; Seneviratne, S.I. A drought event composite analysis using satellite remote-sensing based soil moisture. Remote Sens. Environ. 2017, 203, 216–225. [Google Scholar] [CrossRef]
- Tian, Y.; Xu, Y.P.; Wang, G.Q. Agricultural drought prediction using climate indices based on Support Vector Regression in Xiangjiang River basin. Sci. Total Environ. 2018, 622–623, 710–720. [Google Scholar] [CrossRef] [PubMed]
- Zhong, R.D.; Chen, X.H.; Lai, C.G.; Wang, Z.L.; Lian, Y.Q.; Yu, H.J.; Wu, X.Q. Drought monitoring utility of satellite-based precipitation products across mainland China. J. Hydrol. 2019, 568, 343–359. [Google Scholar] [CrossRef]
- Wang, A.H.; Lattenmaier, D.P.; Sheffield, J. Soil Moisture Drought in China, 1950–2006. J. Clim. 2011, 24, 3257–3271. [Google Scholar] [CrossRef]
- Zhang, X.J.; Tang, Q.H.; Liu, X.C.; Leng, G.Y.; Li, Z. Soil Moisture Drought Monitoring and Forecasting Using Satellite and Climate Model Data over Southwestern China. J. Hydrol. 2017, 18, 5–23. [Google Scholar] [CrossRef]
- Panu, U.S.; Sharma, T.C. Challenges in drought research: Some perspectives and future directions. Hydrol. Sci. 2002, 47, 19–30. [Google Scholar] [CrossRef] [Green Version]
- Narasimhan, B.; Srinivasan, R. Development and evaluation of soil moisture deficit index (SMDI) and evapotranspiration deficit index (ETDI) for agricultural drought monitoring. Agric. For. Meteorol. 2005, 133, 69–88. [Google Scholar]
- Rouse, J.W., Jr.; Deeding, D.W.; Haas, R.H.; Schell, J.A. Monitoring Vegetation Systems in the Great Plains with Erts. NASA Cent. Aerosp. Inform. (CASI) 1974, 1, 309–317. [Google Scholar]
- Keshavarz, M.R.; Vazifedoust, M.; Alizadeh, A. Drought monitoring using a Soil Wetness Deficit Index (SWDI) derived from MODIS satellite data. Agric. Water Manag. 2014, 132, 37–45. [Google Scholar] [CrossRef]
- Kogan, F.N. Droughts of the Late 1980s in the United States as Derived from NOAA Polar-Orbiting Satellite Data. Bull. Am. Meteorol. Soc. 1995, 76, 655–668. [Google Scholar] [CrossRef] [Green Version]
- Kogan, F.N. Application of vegetation index and brightness temperature for drought detection. Adv. Space Res. 1995, 15, 91–100. [Google Scholar] [CrossRef]
- Martínez-Fernández, J.; González-Zamora, A.; Sánchez, N.; Gumuzzio, A. A soil water based index as a suitable agricultural drought indicator. J. Hydrol. 2015, 522, 265–273. [Google Scholar] [CrossRef]
- Shangguan, W.; Dai, Y.J.; Duan, Q.Y.; Liu, B.Y.; Yuan, H. A global soil data set for earth system modeling. J. Adv. Model. Earth Syst. 2013, 6, 249–263. [Google Scholar] [CrossRef]
- Aditi, G.; Andres, R.M.; Ana, C.D. The physiology of plant responses to drought. Am. Assoc. Adv. Sci. 2020, 368, 266–269. [Google Scholar]
- Lian, X.; Piao, S.; Li, L.Z.; Li, Y.; Huntingford, C.; Ciais, P.; Cescatti, A.; Janssens, I.A.; Peñuelas, J.; Buermann, W.; et al. Summer soil drying exacerbated by earlier spring greening of northern vegetation. Sci. Adv. 2020, 6, eaax0255. [Google Scholar] [CrossRef] [Green Version]
- Crow, W.T.; Cosh, M.H.; Berg, A.A.; Loew, A.; Mohanty, B.P.; Panciera, R.; Ryu, D.; De Rosnay, P.; Walker, J.P. Upscaling Sparse Ground-based Soil Moisture Observations for the Validation of Coarse-resolution Satellite Soil Moisture Products. Rev. Geophys. 2012, 50, 2011RG000372. [Google Scholar] [CrossRef] [Green Version]
- Liu, D.; Mishra, A.K.; Yu, Z.B. Evaluating uncertainties in multi-layer soil moisture estimation with support vector machines and ensemble Kalman filtering. J. Hydrol. 2016, 538, 243–255. [Google Scholar] [CrossRef] [Green Version]
- Albergel, C.; Rosnay, P.; Gruhier, C.; Muńoz-Sabater, J.; Hasenauer, S.; Isaksen, L.; Kerr, Y.; Wagner, W. Evaluation of Remotely Sensed and Modelled Soil Moisture Products Using Global Ground-based in Situ Observations. Remote Sens. Environ. 2012, 118, 215–226. [Google Scholar] [CrossRef]
- Holgate, C.M.; De Jeu, R.A.M.; Van Dijk, A.I.J.M.; Liu, Y.Y.; Renzullo, L.J.; Dharssi, I.; Parinussa, R.M.; Van Der Schalie, R.; Gevaert, A.; Walker, J.; et al. Comparison of Remotely Sensed and Modelled Soil Moisture Data Sets across Australia. Remote Sens. Environ. 2016, 186, 479–500. [Google Scholar] [CrossRef]
- Beck, H.E.; Pan, M.; Miralles, D.G.; Reichle, R.H.; Dorigo, W.A.; Hahn, S.; Sheffield, J.; Karthikeyan, L.; Balsamo, G.; Parinussa, R.M.; et al. Evaluation of 18 satellite- and model-based soil moisture products using in situ measurements from 826 sensors. Hydrol. Earth Syst. Sci. 2021, 25, 17–40. [Google Scholar] [CrossRef]
- Han, S.; Shi, C.; Jiang, L.; Zhang, T.; Liang, X.; Jiang, Z.; Xu, B.; Li, X.; Zhu, Z.; Lin, H. The simulation and evaluation of soil moisture based on CLDAS. J. Appl. Meteorol. Sci. 2017, 28, 369–378. [Google Scholar]
- Zhang, R.Q.; Li, L.; Zhang, Y.; Huang, F.N.; Li, J.D.; Liu, W.; Mao, T.N.; Xiong, Z.L.; Shangguan, W. Assessment of Agricultural Drought using Soil Water Deficit Index based on ERA5-Land soil moisture data in four southern provinces of China. Agriculture 2021, 11, 411. [Google Scholar] [CrossRef]
- Zhu, Q.; Luo, Y.; Xu, Y.-P.; Tian, Y.; Yang, T. Satellite Soil Moisture for Agricultural Drought Monitoring: Assessment of SMAP-Derived Soil Water Deficit Index in Xiang River Basin, China. Remote Sens. 2019, 11, 362. [Google Scholar] [CrossRef] [Green Version]
- Lu, L.H.; Zhang, D.E. The temporal and spatial variation characteristics of annual precipitation in China and its relationship with the East Asian summer monsoon. Quat. Stud. 2013, 33, 11. [Google Scholar]
- Rubel, F.; Kottek, M. Observed and projected climate shifts 1901–2100 depicted by world maps of the Köppen-Geiger climate classification. Meteorol. Z. 2010, 19, 135–141. [Google Scholar]
- Shi, C.X.; Xie, Z.H.; Qian, H.; Liang, M.L.; Yang, X.C. China land soil moisture EnKF data assimilation based on satellite remote sensing data. Sci. China Earth Sci. 2011, 54, 1430–1440. [Google Scholar] [CrossRef]
- Muñoz-Sabater, J.; Dutra, E.; Agustí-Panareda, A.; Albergel, C.; Arduini, G.; Balsamo, G.; Boussetta, S.; Choulga, M.; Harrigan, S.; Hersbach, H.; et al. ERA5-Land: A state-of-the-art global reanalysis dataset for land applications. Earth Syst. Sci. Data 2021, 13, 4349–4383. [Google Scholar] [CrossRef]
- Pablos, M.; González-Zamora, Á.; Sánchez, N.; Martínez-Fernández, J. Assessment of SMADI and SWDI agricultural drought indices using remotely sensed root zone soil moisture. Int. Assoc. Hydrol. Sci. 2018, 380, 55–66. [Google Scholar] [CrossRef] [Green Version]
- Miriam, P.; Martínez-Fernández, J.; Sánchez, N.; González-Zamora, Á. Temporal and Spatial Comparison of Agricultural Drought Indices from Moderate Resolution Satellite Soil Moisture Data over Northwest Spain. Remote Sens. 2017, 9, 1168–1195. [Google Scholar]
- Mishra, A.; Vu, T.; Veettil, A.V.; Entekhabi, D. Drought monitoring with soil moisture active passive (SMAP) measurements. J. Hydrol. 2017, 552, 620–632. [Google Scholar] [CrossRef]
- Torres, G.M.; Lollato, R.P.; Ochsner, T.E. Comparison of Drought Probability Assessments Based on Atmospheric Water Deficit and Soil Water Deficit. Agron. J. 2013, 105, 428–436. [Google Scholar] [CrossRef]
- Dorigo, W.; Chung, D.; Wagner, W.; De Jeu, R.; Parinussa, R.; Liu, Y.; Fernández-Prieto, D. Evaluating global trends (1988–2010) in harmonized multi-satellite surface soil moisture. Geophys. Res. Lett. 2012, 39, L18405. [Google Scholar] [CrossRef] [Green Version]
- Hu, Y.M.; Liang, Z.M.; Liu, Y.W.; Zeng, X.F.; Wang, D. Uncertainty assessment of estimation of hydrological design values. Stoch. Environ. Res. Risk Assess. 2015, 29, 501–511. [Google Scholar] [CrossRef]
- Le, M.H.; Kim, H.; Moon, H.; Zhang, R.; Lakshmi, V.; Nguyen, L.B. Assessment of drought conditions over Vietnam using standardized precipitation evapotranspiration index, MERRA-2 reanalysis, and dynamic land cover. J. Hydrol. Reg. Stud. 2020, 32, 100767. [Google Scholar] [CrossRef]
- Tosunoglu, F.; Kisi, O. Trend analysis of maximum hydrologic drought variables using Mann–Kendall and Şen’s innovative trend method. River Res. Appl. 2017, 33, 597–610. [Google Scholar] [CrossRef]
- Mann, H.B. Nonparametric tests again trend. Econometrica 1945, 13, 245–259. [Google Scholar] [CrossRef]
- Zohaib, M.; Choi, M.; Kim, H. Evaluating the patterns of spatiotemporal trends of root zone soil moisture in major climate regions in east Asia. J. Geophys. Res. 2017, 122, 7705–7722. [Google Scholar] [CrossRef]
- Wu, Z.; Feng, H.; He, H.; Zhou, J.; Zhang, Y. Evaluation of soil moisture climatology and anomaly components derived from ERA5-land and GLDAS-2.1 in China. Water Resour. Manag. 2020, 35, 629–643. [Google Scholar] [CrossRef]
- Kim, H.; Wigneron, J.P.; Kumar, S.; Dong, J.; Wagner, W.; Cosh, M.H.; Bosch, D.D.; Collins, H.C.; Starks, P.J.; Starks, P.J.; et al. Global scale error assessments of soil moisture estimates from microwave-based active and passive satellites and land surface models over forest and mixed irrigated/dryland agriculture regions. Remote Sens. Environ. 2020, 251, 112052. [Google Scholar] [CrossRef]
- Dai, M.; Huang, S.Z.; Huang, Q.; Leng, G.Y.; Guo, Y.; Wang, L.; Fang, W.; Li, P.; Zheng, X.D. Assessing agricultural drought risk and its dynamic evolution characteristics. Agric. Water Manag. 2020, 231, 106003–106015. [Google Scholar] [CrossRef]
- Wang, H.J. The weakening of the Asian monsoon circulation after the end of 1970’s. Adv. Atmos. Sci. 2001, 18, 376–386. [Google Scholar]
- Ding, Y.H.; Si, D.; Liu, Y.J.; Wang, Z.Y.; Li, Y.; Zhao, L.; Song, Y.F. On the characteristics, driving forces and inter-decadal variability of the East Asian summer monsoon. Chin. J. Atmos. Sci. 2018, 42, 533–558. (In Chinese) [Google Scholar]
- Niu, J. Precipitation in the Pearl River basin, South China: Scaling, regional patterns, and influence of large-scale climate anomalies. Stoch. Environ. Res. Risk Assess. 2013, 27, 1253–1268. [Google Scholar] [CrossRef]
Figure 1.
Climate zones according to the Köppen–Geiger climate classification in the study area and the distribution of in situ stations.
Figure 1.
Climate zones according to the Köppen–Geiger climate classification in the study area and the distribution of in situ stations.

Figure 2.
Spatial distribution of the average SWDI based on the in situ (a), ERA5-Land (b), and CLDAS (c) soil moisture data from 2013 to 2017.
Figure 2.
Spatial distribution of the average SWDI based on the in situ (a), ERA5-Land (b), and CLDAS (c) soil moisture data from 2013 to 2017.
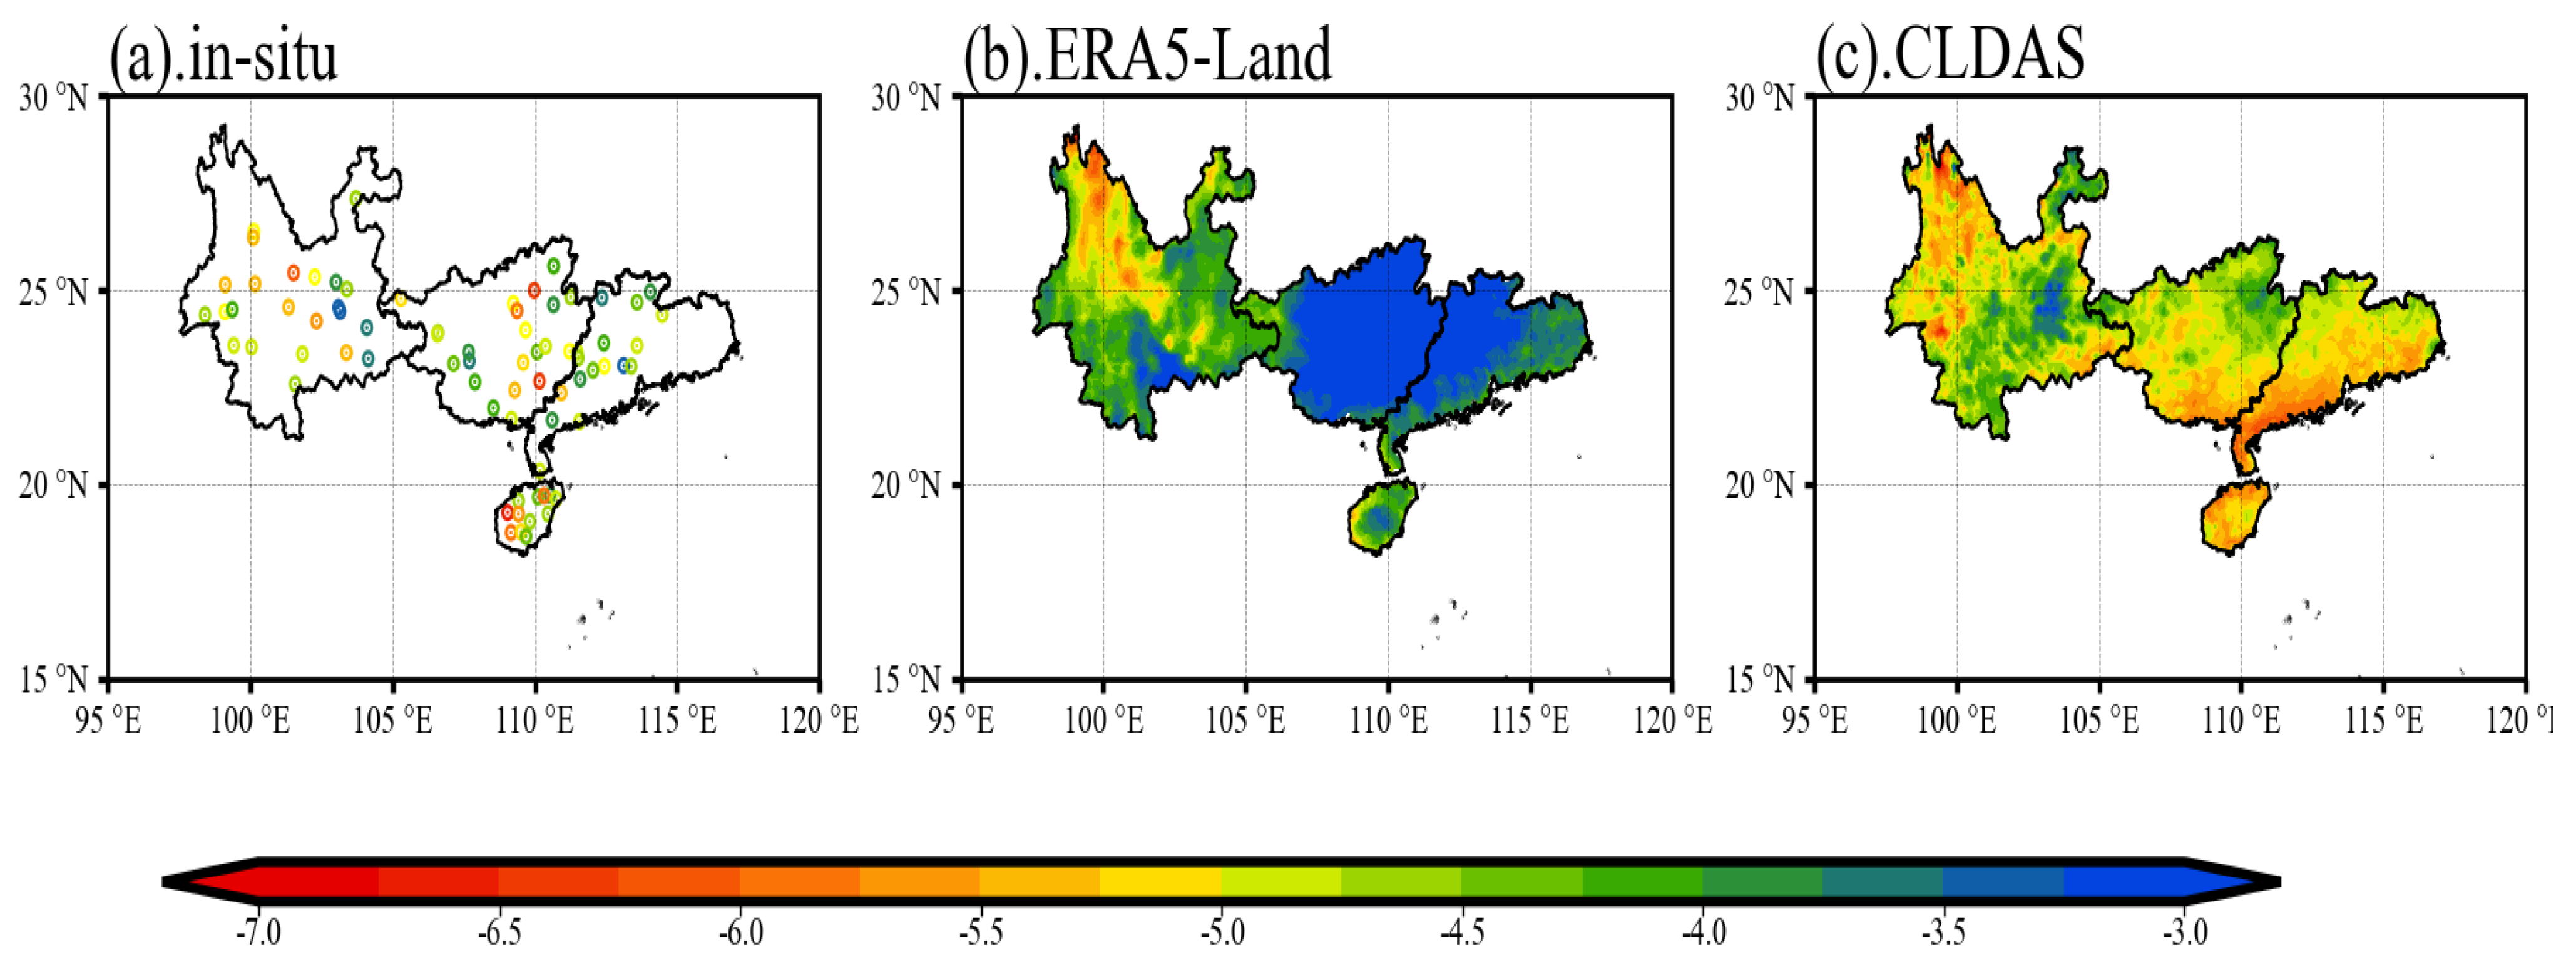
Figure 3.
Time series of SWDI from in situ (solid red line), ERA5-Land (solid green line), and CLDAS (solid blue line) data in three climate zones: (a) tropical climate zone, (b) temperate, no dry season climate zone, and (c) temperate, dry winter climate zone.
Figure 3.
Time series of SWDI from in situ (solid red line), ERA5-Land (solid green line), and CLDAS (solid blue line) data in three climate zones: (a) tropical climate zone, (b) temperate, no dry season climate zone, and (c) temperate, dry winter climate zone.

Figure 4.
RMSE (a), R (b), and Bias (c) of the SWDI between the ERA5-Land and in situ data and between the CLDAS and in situ data in the whole study area and the three climate zones. RMSE is root mean squared error, R is correlation coefficient, and Bias is bias.
Figure 4.
RMSE (a), R (b), and Bias (c) of the SWDI between the ERA5-Land and in situ data and between the CLDAS and in situ data in the whole study area and the three climate zones. RMSE is root mean squared error, R is correlation coefficient, and Bias is bias.

Figure 5.
Comparison of ERA5-Land minus in situ and CLDAS minus in situ regarding the average SWDI (a), number (b), duration (c), interval (d), and severity (e) at each site (yellow points are sites in the tropical climate zone; green points are sites in the temperate, no dry season climate zone; and red points are sites in the temperate, dry winter climate zone) from 2013 to 2017.
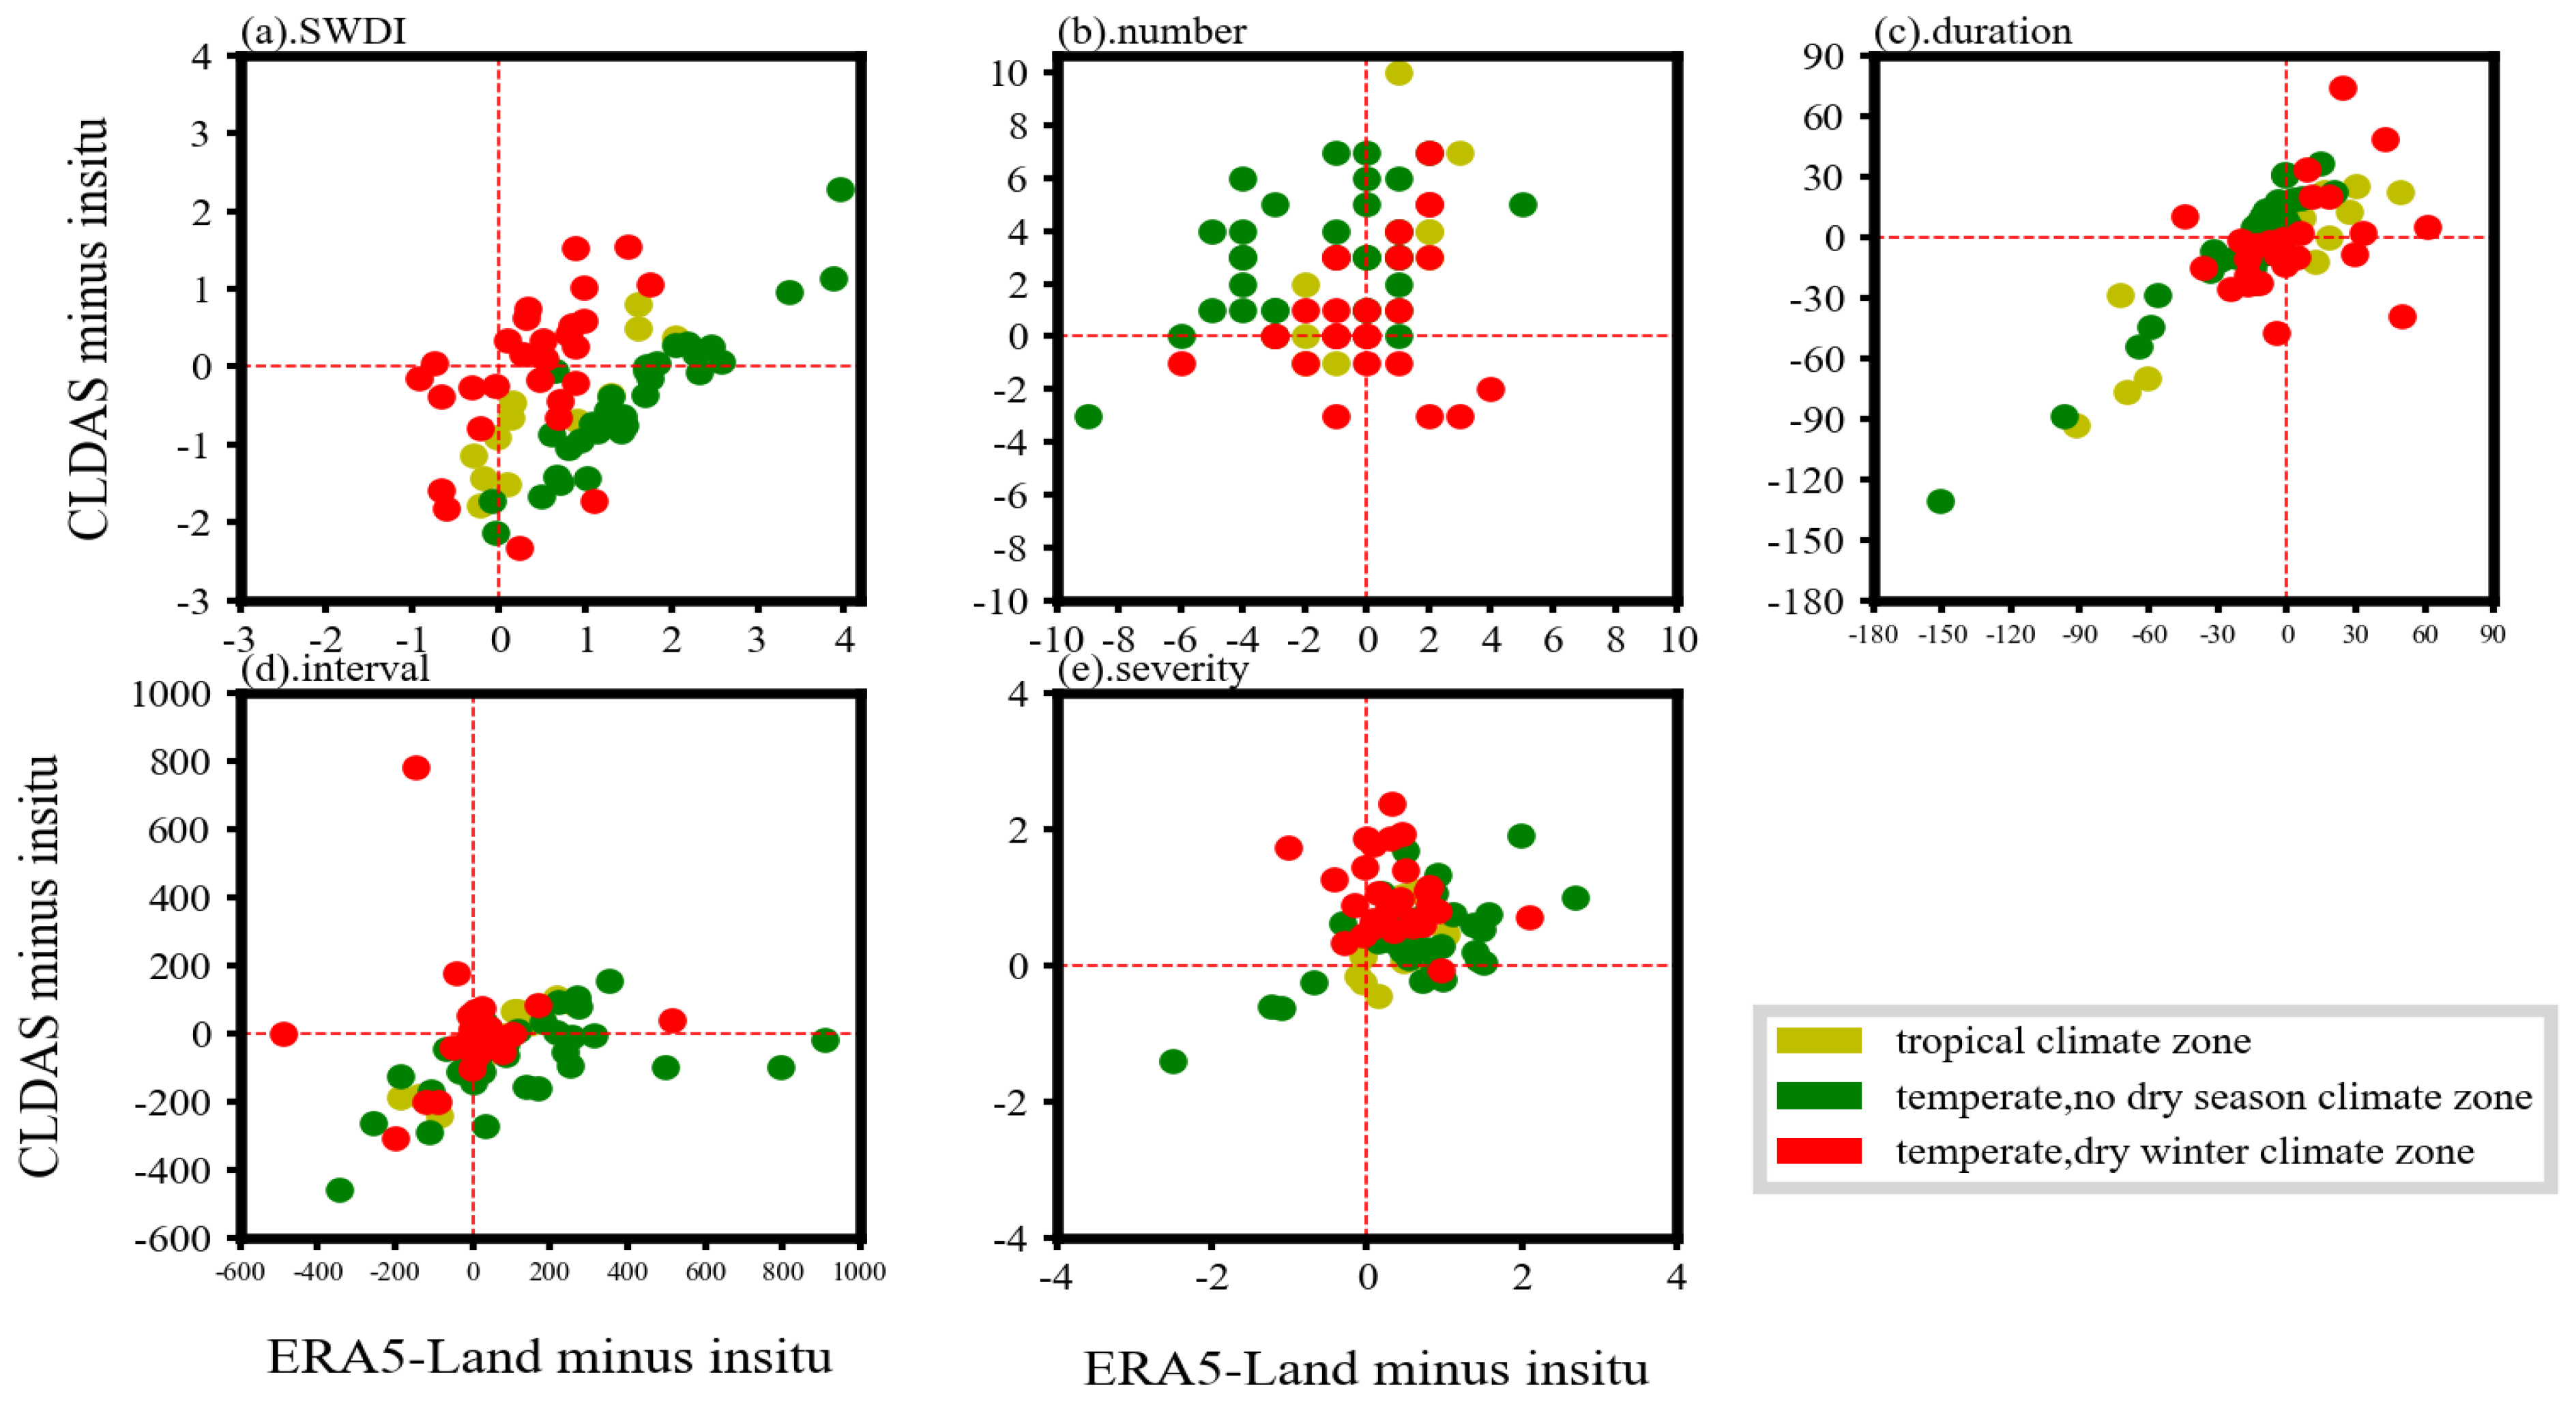
Figure 6.
Distribution of the average SWDI of 1981–2020 (a), 1981–1990 (b), 1991–2000 (c), 2001–2010 (d), and 2011–2020 (e) and variation tendency from 1981 to 2020 (f).
Figure 6.
Distribution of the average SWDI of 1981–2020 (a), 1981–1990 (b), 1991–2000 (c), 2001–2010 (d), and 2011–2020 (e) and variation tendency from 1981 to 2020 (f).

Figure 7.
Mann–Kendall trends of drought duration (a) and drought severity (b) for 1981–2020. Values larger than 1.96 or smaller than −1.96 pass the 0.05 significance test level, while values larger than 1.64 or smaller than −1.64 pass the 0.1 significance test level.
Figure 7.
Mann–Kendall trends of drought duration (a) and drought severity (b) for 1981–2020. Values larger than 1.96 or smaller than −1.96 pass the 0.05 significance test level, while values larger than 1.64 or smaller than −1.64 pass the 0.1 significance test level.
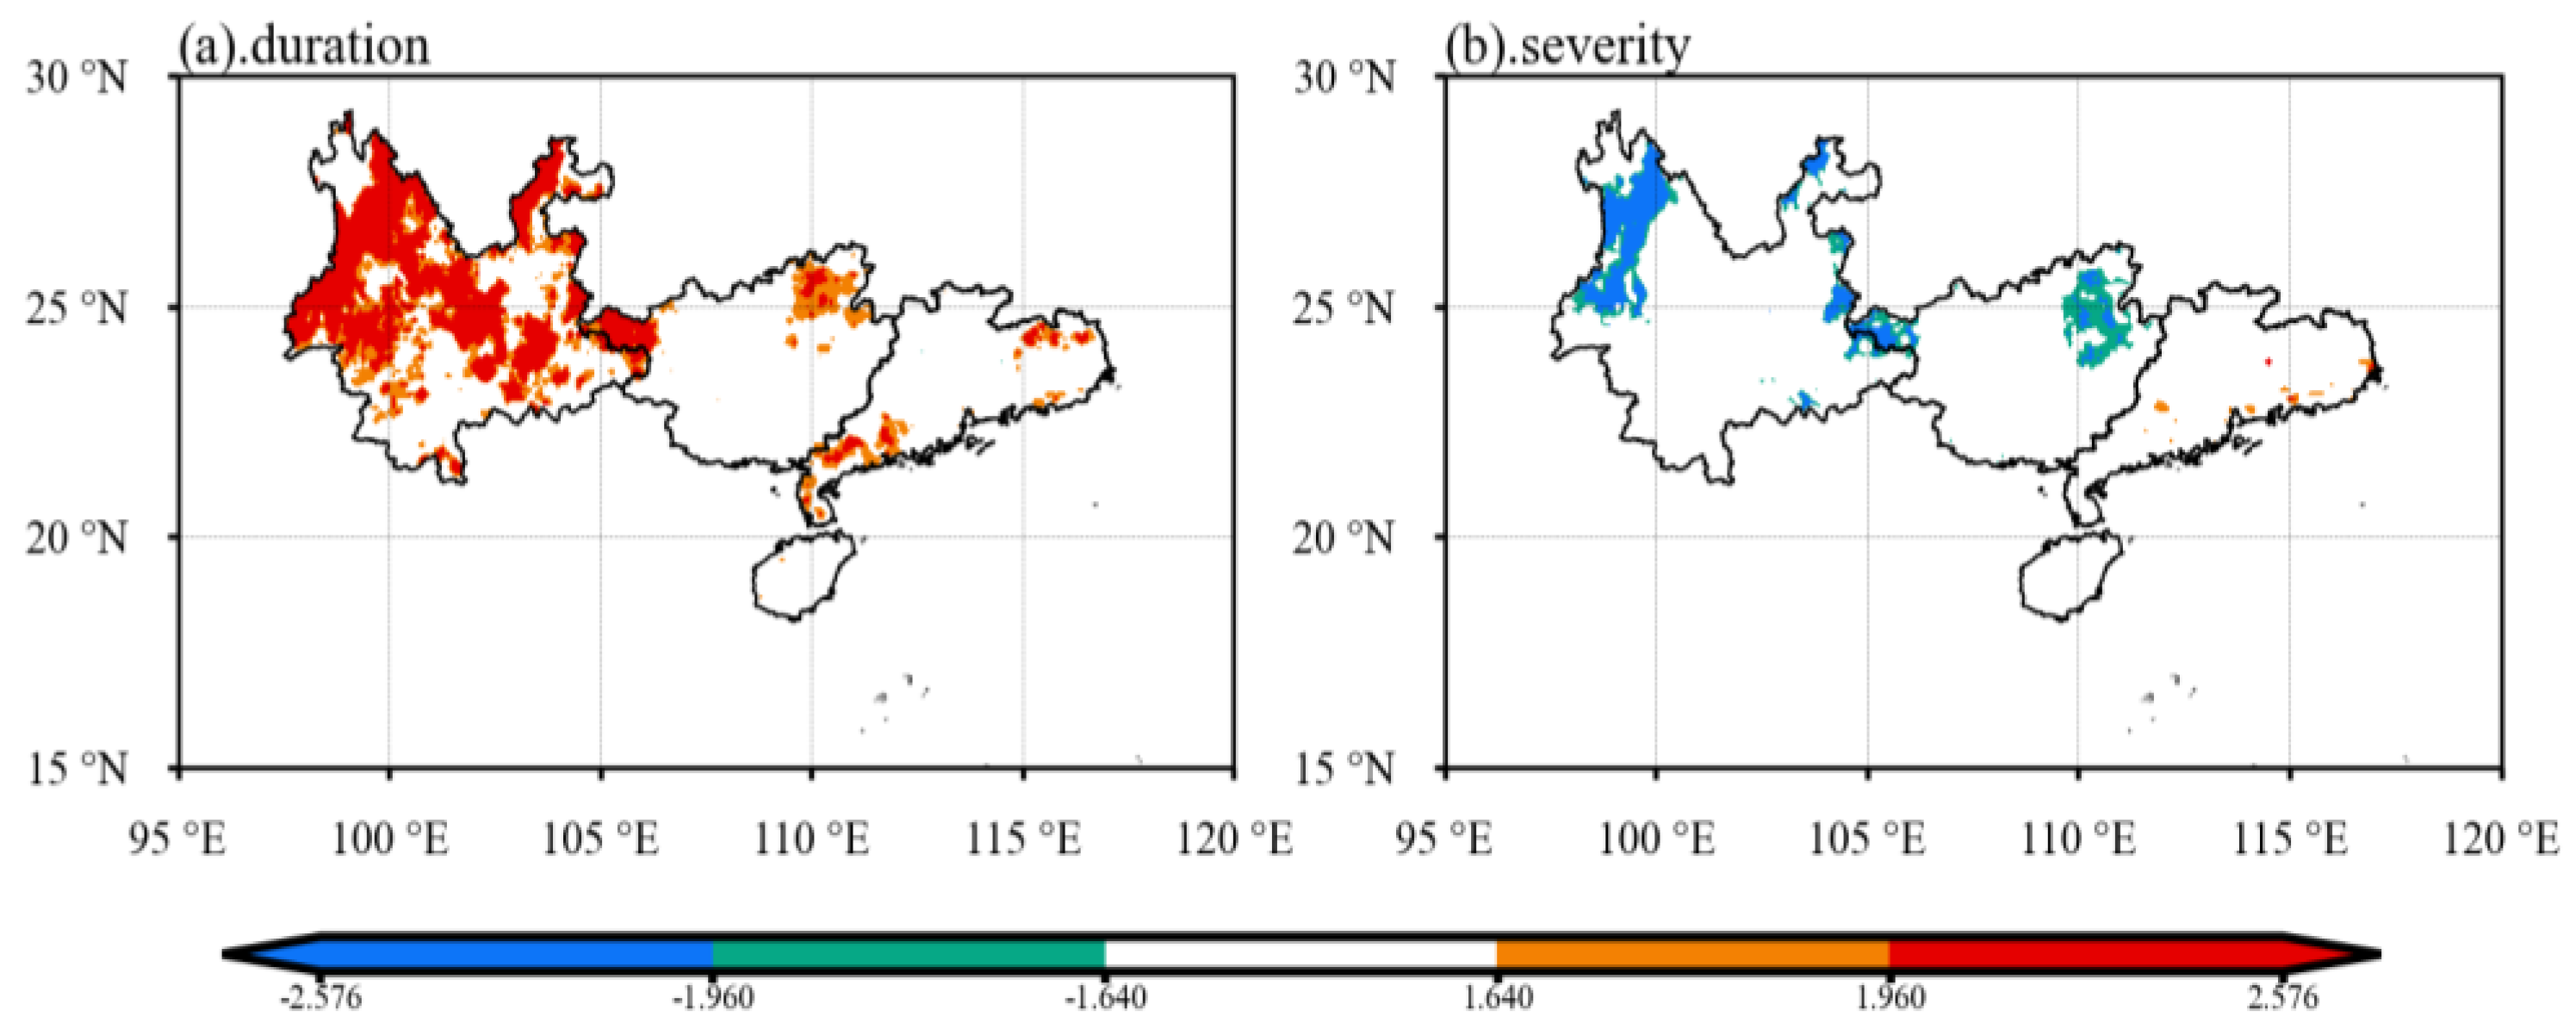
Figure 8.
The distribution of the Pearson correlation of the AWDp (precipitation–potential evaporation) and the SWDI (a) and the AWDt (precipitation–total evaporation) and the SWDI (b) in the four southern provinces of China.
Figure 8.
The distribution of the Pearson correlation of the AWDp (precipitation–potential evaporation) and the SWDI (a) and the AWDt (precipitation–total evaporation) and the SWDI (b) in the four southern provinces of China.


Table 1.
Statistical characteristics of the in situ, CLDAS, and ERA5-Land SM (m3/m3) of different climate zones.
Table 1.
Statistical characteristics of the in situ, CLDAS, and ERA5-Land SM (m3/m3) of different climate zones.
| Climate Zone | Data | Mean | Min | Max | Median | Standard Deviation | Number of Observations (Grids) |
|---|---|---|---|---|---|---|---|
| tropical | In situ | 0.2666 | 0.0501 | 0.641 | 0.268 | 0.058 | 15 |
| ERA5-Land | 0.3628 | 0.0592 | 0.517 | 0.371 | 0.066 | 245 | |
| CLDAS | 0.3254 | 0.1613 | 0.552 | 0.326 | 0.034 | 245 | |
| temperate, no dry season | In situ | 0.3222 | 0.0588 | 0.614 | 0.319 | 0.041 | 34 |
| ERA5-Land | 0.4067 | 0.0784 | 0.520 | 0.418 | 0.050 | 2957 | |
| CLDAS | 0.3435 | 0.2158 | 0.585 | 0.343 | 0.029 | 2957 | |
| temperate, dry winter | In situ | 0.3039 | 0.084 | 0.5317 | 0.299 | 0.049 | 28 |
| ERA5-Land | 0.3850 | 0.086 | 0.5185 | 0.397 | 0.061 | 4145 | |
| CLDAS | 0.3269 | 0.198 | 0.5955 | 0.332 | 0.034 | 4145 |
Publisher’s Note: MDPI stays neutral with regard to jurisdictional claims in published maps and institutional affiliations. |
© 2022 by the authors. Licensee MDPI, Basel, Switzerland. This article is an open access article distributed under the terms and conditions of the Creative Commons Attribution (CC BY) license (https://creativecommons.org/licenses/by/4.0/).
Share and Cite
MDPI and ACS Style
Shangguan, W.; Zhang, R.; Li, L.; Zhang, S.; Zhang, Y.; Huang, F.; Li, J.; Liu, W. Assessment of Agricultural Drought Based on Reanalysis Soil Moisture in Southern China. Land 2022, 11, 502. https://doi.org/10.3390/land11040502
AMA Style
Shangguan W, Zhang R, Li L, Zhang S, Zhang Y, Huang F, Li J, Liu W. Assessment of Agricultural Drought Based on Reanalysis Soil Moisture in Southern China. Land. 2022; 11(4):502. https://doi.org/10.3390/land11040502
Chicago/Turabian StyleShangguan, Wei, Ruqing Zhang, Lu Li, Shulei Zhang, Ye Zhang, Feini Huang, Jianduo Li, and Wei Liu. 2022. "Assessment of Agricultural Drought Based on Reanalysis Soil Moisture in Southern China" Land 11, no. 4: 502. https://doi.org/10.3390/land11040502
Note that from the first issue of 2016, this journal uses article numbers instead of page numbers. See further details here.