
Revealing the Impact of Protected Areas on Land Cover Volatility in China


School of Public Administration, Sichuan University, Chengdu 610065, China
*
Author to whom correspondence should be addressed.
Land 2022, 11(8), 1361; https://doi.org/10.3390/land11081361
Submission received: 1 August 2022
/
Revised: 18 August 2022
/
Accepted: 19 August 2022
/
Published: 21 August 2022
(This article belongs to the Special Issue Trends in Land Change Monitoring)
Abstract
:Protected areas are fundamental for maintaining ecosystem functions and have generally been considered to affect land use change. Here, we explored how protected areas affected land cover volatility in China from 2011 to 2020 with LandTrendr using the Google Earth Engine (GEE) platform by comparing the difference in volatility of the Normalized Difference Vegetation Index (NDVI) in protected and unprotected areas. The results show that the regions with frequent land cover volatility are mainly located in eastern, central, and southwestern China, indicating that land cover volatility with high NDVI loss values is spatially aggregated in most cases. Considering the impact of protected areas, land cover volatility is relatively consistent inside and outside the protected area throughout the study period, showing a trend of first fluctuating and then rising. Approximately 22% of detected land cover volatility occurred in protected areas, though the average NDVI loss value (0.56) for protected areas was greater than unprotected areas (0.51). Combined with the outliers, land cover volatility accompanied by larger NDVI loss values is still primarily distributed in unprotected areas in most years. The detection of NDVI gain values in protected areas shows that protected areas (average value is 0.48) are larger than unprotected areas (average value is 0.47) almost every year, even combined with the outliers, and land cover volatility accompanied by larger NDVI gain values is also primarily distributed in protected areas in most years. Elucidating land cover volatility is helpful in understanding land cover changes and how to formulate an effective land use policy.
1. Introduction
Most human activities occur directly on the land surface, fundamentally changing the physical properties of the Earth’s land surface and triggering a series of environmental and climate consequences [1,2,3]. For global ecosystems, different land uses and land cover changes could result in different outcomes [4,5]. Humans derive high-quality resources from natural ecosystems to sustain themselves or improve their development status, influencing biogeochemical cycles as well as ecosystem services [1,6,7]. Numerous studies have shown that land use change can have an impact on climate change [8]. Anthropogenic land use and land cover change, including urbanization, defined as the expansion of urban land, affect local and global climates and the water and energy balance through the modification of surface albedo and impact the magnitude and pattern of temperature and rainfall [7,9,10], even creating an urban heat island effect in urban areas [11,12]. The same situation occurs in the hydrological cycle [13,14], as land use/cover changes also affect changes in surface runoff [15]. Land use and land cover change are closely linked to the ecosystem, especially in forest areas. Research has showed that ecosystem service value loss is mainly due to the loss of ecosystem functions, such as nutrient cycling, the provision of raw materials, and erosion control, due to deforesting [16]. The multiple relationships between land use/cover change and ecosystems will further intensify as a result of the continuously growing population and the scarcity of natural resources [17]. It is thus necessary for human beings to use land intensively and economically, reduce the damage to ecosystems and natural resources, and promote sustainable land use [18]. In order to map land use/cover changes, previous researchers monitored their dynamics by analyzing current characteristics [19], which has become the basis for studying the driving mechanisms of land use/cover change [20,21]. With improved computer power and remote sensing, spatial modeling is common in the process of land use change analysis [22], and mapping land use and land cover changes can be realized by deeply mining and analyzing the spatial characteristics and simulating them [23,24].
Expanding and enhancing protected areas are fundamental for maintaining ecosystem functions and protecting the Earth’s biodiversity [25]. Numerous studies indicate the effectiveness of protected areas for local biodiversity [26,27], water and soil retention [28], carbon sequestration [29], and human well-being [30]. However, there is still an ongoing debate on the positive role of protected areas in the global situation. For example, recent reporting has revealed the uncertainty about the protection of avian species hotspots globally [31]. As of April 2014, the global number of nationally designated terrestrial protected areas is 155,584, covering 18.4 million km2, or 12.5% of the terrestrial realm, and 7318 marine protected areas cover about 10.1 million km2 (or 3%) of the world’s marine environments [32]. However, these figures are still short of meeting core 2020 targets outlined in the Convention on Biological Diversity [33]. There is a strong global consensus that the primary role of protected areas is nature conservation, but in practice, they are always expected to make much wider ecological, economic, and social contributions to the local community. Thus, failure to achieve one or more of these objectives, such as the growth of protected areas, is in conflict with the needs of local society to achieve economic development, which will greatly affect the enthusiasm for managing protected areas. Global studies point out that 50–80% of protected areas are ineffectively managed [34,35]. For example, research examining vegetation loss in protected areas in South Asia has shown that the trajectory of habitat conversion rates inside protected areas is indistinguishable from that on unprotected lands, and habitat conversion rates do not decline following the gazettement of a protected area, which indicates the ineffectiveness of protected area establishment [36].
China has paid considerable attention to the protection of the nation’s ecological functions, and with the issuance of the National Ecological Protection Program, the importance of ecological protection was further clarified [37]. Assessing the effectiveness of protected areas in China is crucial to developing adaptive management approaches to conservation [38]. Research has indicated that we could further understand the spatial and temporal patterns of land use and land cover change by learning the aggregation and volatility properties of land use [39]. Based on this, we can analyze the driving forces of land use change and propose relevant countermeasures and recommendations [40,41,42]. To further understand the effectiveness of protected area establishment in China, we could analyze the characteristics of land cover volatility in protected areas and unprotected areas to gain insight into the conservation effectiveness of protected areas and provide policy recommendations for conservation and development. Therefore, the purpose of this study is to map the current status of land cover volatility in China from 2011 to 2020 in protected and unprotected areas, and by comparing the difference, to analyze how protected areas affect land cover volatility. Specifically, we (1) identified the strong land cover volatility in time and space based on LandTrendr in the whole study area; (2) achieved cluster/outlier analysis of land cover volatility in protected areas and unprotected areas; and (3) analyzed the impact of protected areas on land use and land cover change.
2. Materials and Methods
2.1. Description of the Study Area
The study area covers all of China and is located in the southeastern part of Eurasia, at latitude 4°15′~53°31′ N and longitude 73°34′~135°5′ E. The geomorphological types are complex, with three major terraces from west to east. The first is the Qinghai–Tibet Plateau, with an average altitude of over 4000 m. The second order ranges from the northern and eastern edges of the Qinghai–Tibet Plateau to the line between the Daxinganling and Taihang Mountains, Wushan, and Xuefengshan, with an altitude of 1000 to 2000 m. The third one is the eastern part of China with an altitude of less than 500 m. Unique climatic and geomorphological features are the natural basis for the development and evolution of various terrestrial ecosystems such as forests, grasslands, wetlands, and deserts.
2.2. Priority Criteria for Data Source
2.2.1. Priority Criteria for Satellite Data
Landsat 7/8 satellite images from 2011 to 2020 were used in our research to identify the strong land cover volatility in time and space in the whole study area. Considering the accuracy and reliability of land cover volatility identification based on NDVI, which is closely related to vegetation cover, the time period of remote sensing images was mainly limited from May to October. We retrieved multiple images from May to October in each year, masked out clouds and cloud shadows from each image by using CFMASK [43], and finally used medoid compositing to create a composite of those images. The remote sensing analysis is based on the composite image.
2.2.2. Protected Area Networks in China
Various ecosystems in China have been exploited, disturbed, and destroyed to varying degrees due to thousands of years of development and enormous population pressure, and ecological services have been significantly reduced. This has led to a series of ecological problems and a serious threat to national ecological security. Therefore, since 2001, China has carried out a national ecological status survey, and on this basis, facilitated the establishment of protected areas. The National Ecological Function Zoning Plan was published in 2008, which is based on the ecological status, sensitivity, and service function evaluation. The protected areas comprise about 2,336,700 km2, accounting for 24.34% of China. National protected areas in China mainly undertake six types of functions, namely, water conservation, species resources conservation, soil and water conservation, flood control, windbreak and sand fixation, and marine conservation. As our study is focused on land use and land cover change, we removed the zones in which the protected areas are mostly marine to ensure the rationality of the study, including Zhoushan Islands, the Yangtze River Estuary, and the Gulf of Tonkin Ecological Functional Protected Areas (Figure 1). At present, the effectiveness of protection induced by the delineation of protected areas is gradually emerging, but there are disparities within different regions [44].
2.3. Methods
2.3.1. Research Framework
In order to assess the impact of protected areas on land cover volatility, we used Landsat 7/8 satellite images from 2011 to 2020 to create an annual composite image so as to extract the NDVI values of all pixels by LandTrendr in the study area during the study period. We selected DNVI as the spectral index to finish the calculation of the original NDVI values, and then fit them to a time series mathematical model to identify abnormal inflection points or breakpoints in the trend, when the NDVI values have a large difference between adjacent years (Figure 2). We extracted all pixels with NDVI rapid decline values greater than 400 in the whole study area to represent strong land cover volatility. We identified different degrees of land cover volatility and their basic change characteristics from amount identification (including pixel numbers of strong land cover volatility with different NDVI loss values and of NDVI loss occurring in different years) and spatial identification (including distribution of strong land cover volatility and analysis of hot and cold spots). Then, combined with the protected area network product in the study area, we analyzed the land cover volatility in different types of protected areas and in unprotected areas to gauge the impact of protected areas on land cover volatility based on NDVI loss. Considering the effectiveness of protected areas in vegetation restoration, we further extracted the NDVI gain to analyze the impact of protected areas on vegetation restoration, and comprehensively considered the effect of protected areas on land cover volatility.
2.3.2. LandTrendr Algorithm
The LandTrendr algorithm based on Google Earth Engine (GEE) is a useful tool for monitoring and screening land use and land cover changes [41]. It is a set of spectral–temporal segmentation algorithms that are useful for change detection in a time series of moderate-resolution satellite imagery (primarily Landsat) and for generating trajectory-based spectral time series data largely devoid of inter-annual signal noise [45]. Specifically, the LandTrendr algorithm extracts the relevant information of the Landsat image pixels in the study area year by year (the image is the composite Landsat image in this paper). It then calculates the spectral information correlation index (NDVI is selected in this paper) of the pixel over time to select the pixels that are meaningful for the research. We further fit them to a similar mathematical model, and we calculated the root mean square error between the original values and the segmentation-fitted values as the accuracy assessment, and finally selected a breakpoint or an inflection point where the corresponding spectral index fluctuates violently, indicating that the land use and land cover changed violently.
The most important preparation for the LandTrendr application is to adjust and correct spectral–temporal segmentation and the annual image collection by setting variations of 8 control parameters to see what works best for the environment we are working in, as land use cover also has its own unique characteristics given the actual geographical conditions. The original LandTrendr paper describes the effect and sensitivity of changing some of these argument values [45].
2.3.3. Selection of Spectral Index in LandTrendr
A reasonable spectral index is also a necessary condition to indicate land use and land cover change in addition to the correct setting of parameters. Considering that vegetation coverage is important for protected areas and that vegetation coverage could, to some extent, reflect the land use and land cover change, previous research has shown that the NDVI index, as the normalized difference vegetation index, could adequately complete the characterization of the vegetation growth state and vegetation coverage [46,47,48]. Therefore, we use the NDVI to run LandTrendr in our study area and calculate the root mean square error (RMSE) between the original values and the segmentation-fitted values. The results indicate the reliability of choosing NDVI as the spectral index to run LandTrendr and reveal the land use and land cover change in the study area (Figure 3). All calculation results are enlarged by 1000 times to show the details of variation.
2.3.4. Identification of Strong Land Cover Volatility
Strong land cover volatility indicates rapid loss in NDVI, which corresponds to the fast decrease in land vegetation coverage. We identified the area with an NDVI rapid loss greater than 400 (the actual NDVI value was 0.4) within the study area based on LandTrendr and regarded it as strong land cover volatility in our study.
We identified the similarities and differences in land cover volatility mainly concerning the loss of NDVI in quantity, time, and space, and we analyzed the intensity of regional land use change based on the extracted number of pixels, which represent the land cover volatility area, and the trend characteristics of land use change by combining the temporal changes in different NDVI loss values. We quantified the pixel numbers of strong land cover volatility in all years of the whole study area to analyze land cover volatility difference based on various NDVI loss values and time series. We extracted the spatial distribution of land cover volatility to analyze the spatial differences, and using the spatial distance as the calculation basis, we carried out local spatial autocorrelation analysis based on the grid scale to explore the spatial aggregation effect of land cover volatility.
2.3.5. Cluster/Outlier Analysis of Land Cover Volatility and Restoration in Protected and Unprotected Area
Expanding and enhancing protected areas is of great significance for conserving and restoring global biodiversity, and the establishment of protected areas will also significantly affect land use change [25]. We firstly quantified the number of varied NDVI loss values in protected areas, analyzed NDVI loss value differences in different protected area types, and carried out time series research to analyze the land cover volatility inside and outside the protected area by calculating the average median and mean NDVI loss values in all years in protected and unprotected areas. Considering that protected areas would also have an obvious impact on vegetation restoration, we extracted gain values of NDVI to further analyze the degree of land vegetation restoration inside and outside the protected area. The cluster/outlier analysis of land cover volatility including loss and gain of NDVI values showed the impact of protected areas on land use.
3. Results
3.1. Amount Identification of Strong Land Cover Volatility
We quantified the pixel numbers of strong land cover volatility, represented by NDVI loss values greater than 400 within the study area, and divided them into classes (Figure 4). Throughout the study period, values of 400–500 were dominant, covering approximately 57.4% of the total, followed by values of 500–600 (approx. 21.8%). The remaining classes were relatively small, accounting for approximately 20.8% of the total, and the proportion with NDVI loss values greater than 800 only accounted for 7.98% of pixels. Overall, the number of pixels decreases rapidly with increasing NDVI loss values. The larger the loss value, the fewer the pixels.
The amount identification of strong land cover volatility based on time series demonstrated that the pixel numbers with NDVI loss values vary greatly over time, with an overall fluctuating, rising tendency over the research period (Figure 5). The most severe land cover volatility occurred in 2011, with the NDVI loss value accounting for 29% of the overall change value. The lowest numbers of NDVI loss values were recorded in 2012 and 2013, accounting for 5.3% and 2.5% of the total, respectively. Continuous growth patterns occurred from 2015 to 2017 and from 2018 to 2020. In terms of the loss values, pixel numbers with NDVI loss values of 700–800 and larger than 800 had the biggest proportions in 2020. The patterns in the number of NDVI loss values of 300–400 and 400–500 were similar to the general trend, all exhibiting a falling tendency followed by a fluctuating rise.
3.2. Spatial Identification of Strong Land Cover Volatility
We identified the spatial distribution of NDVI loss values greater than 400 within the study area, which indicated strong land cover volatility (Figure 6). The regions with frequent land cover volatility are mainly located in eastern, central, and southwestern China. Among them, strong land cover volatility is mainly found in southeastern Tibet and the central part of Yunnan and Sichuan Province, while relatively less land cover volatility is observed in the North China Plain and the Yangtze River Delta. We identified that the NDVI loss value has aggregation characteristics, with more volatile areas clustered together and less volatile areas clustered together.
Land cover volatility in the study area exhibits distinct aggregation characteristics, and to further elucidate the spatial characteristics of their distribution, we used hot and cold spot analysis to measure land cover volatility in China (Figure 7). Hot spots of land cover volatility are mainly concentrated in eastern, southeastern coastal, and southwestern China, including Shandong, Hebei, Zhejiang, Jiangsu, Yunnan, Sichuan, and Guizhou provinces. The volatility of land cover in these areas is more easily affected by the surrounding land use patterns, showing a positive spatial correlation. Cold spots are mainly concentrated in the northwest and northeast of China, including Xinjiang, Tibet, Qinghai, Gansu, Inner Mongolia, and other provinces, showing the characteristics of concentrated contiguous distribution and predisposition to land cover volatility. The cold/hot spots with 90–95% confidence intervals are distributed around the spatially clustered areas with 99% confidence intervals, and these areas are also spatially clustered. It is noteworthy that the confidence interval for the distribution of cold spots is only 90–95%. The spatial aggregation area of land cover volatility in the study area overlaps to a certain extent with the protected areas in China, which are responsible for species resources and water conservation, and located in the hot spots of land cover volatility.
3.3. Cluster/Outlier Analysis of Land Cover Volatility Based on Protected Area
3.3.1. Cluster/Outlier Analysis of NDVI Loss Based on Protected Area
The land cover volatility indicating an NDVI loss value greater than 400 located in protected areas accounted for 22.72% of the total identified areas (Figure 8). The largest NDVI loss value was noted for the species resources protected areas, accounting for 49.37% of the area, followed by the flood control and water conservation protected areas, accounting for 22.87% and 16.53%, respectively. Protected areas of windbreak and sand fixation are only 2.18%, representing the smallest proportion in all protected areas without considering the marine protected areas. Considering the magnitude of NDVI loss value, the decrease in NDVI in the species resources protected areas is more obvious.
The results based on the analysis of land cover volatility of NDVI loss value over time indicate that the changing trend of NDVI is relatively consistent inside and outside the protected area throughout the study period, showing a trend of first fluctuating and then rising (Figure 9). At the same time, it is worth noting that the quantile value of 25–75% of protected areas is generally larger than that of unprotected areas (it does not mean the ineffectiveness of protected areas, but could be discussed from more dimensions [35]). The median and mean NDVI loss values in all years for protected areas were still more significant than those for unprotected areas. Specifically, the median NDVI loss value in protected areas was 499.9, while that of unprotected areas was 470.7. The average value in protected areas was 558.13, and in unprotected areas was 512.78. Combined with the outliers, stronger land cover volatility and larger NDVI loss values are primarily distributed in unprotected areas in most years. Overall, the average level of land cover volatility in protected areas is greater than that in unprotected areas, but the most significant land cover volatility mostly occurs in unprotected areas.
3.3.2. Cluster/Outlier Analysis of NDVI Gain Based on Protected Area
To gain further insight into vegetation restoration in protected areas, we identified the amount and spatial distribution of NDVI gain in the study area. The areas with an NDVI gain value greater than 400 located in protected areas accounted for 21.84% of the total areas identified (Figure 10), among which the highest NDVI gain value was in the species resources protected areas, accounting for 50.98%, followed by the flood control and water conservation protected areas, with 18.56% and 14.03%, respectively, similar to the situation of NDVI loss. The smallest percentage was windbreak and sand fixation protected areas, accounting for only 7.71%. As the value of NDVI gain increases, the proportion of species resources protected areas has the biggest increase in various types of protected areas.
The NDVI gain value in the protected areas showed a fluctuating downward trend during the study period (Figure 11). NDVI gain values in protected areas are larger than those in unprotected areas almost every year. Meanwhile, the average NDVI gain values also have notable differences inside and outside the protected area—the average value is 481.62 in protected areas and 465.38 in unprotected areas, indicating that the vegetation restoration in protected areas is greater than in unprotected areas. Combined with the outliers, stronger land cover volatility and larger NDVI gain values are primarily distributed in protected areas in most years.
4. Discussion and Conclusions
4.1. Discussion
Land cover volatility is influenced by human activities, and even directly related, to some extent, and could indicate a regular characteristic coinciding with regular human activities [39,49]. The establishment of protected areas at the forefront of efforts to conserve and restore global biodiversity has important ecological significance, but will inevitably affect regional land cover volatility [33,36], and it is essential to clarify the effectiveness and feasibility of protected areas and to explore land use change in protected areas. Thus, the main purpose of this research was to map the current status of land cover volatility in China from 2011 to 2020 and analyze how protected areas affect land cover volatility so as to guarantee the rationality of expanding protected areas and enhance their effectiveness.
The identification of strong land cover volatility, with NDVI loss values greater than 400 (which means the actual value is 0.4), based on LandTrendr reveals that the NDVI loss value regions are widely distributed in the study area, mainly in eastern, central, and southwestern China. Most NDVI loss values lie within 400–500, and the pixels where large land cover volatility occurs are mainly located in southern Tibet and part of southwest China, while the regions with less volatility are mainly located in the North China Plain and the middle and lower reaches of the Yangtze River Plain. The spatial aggregation of land cover volatility is further illustrated—the pixels with high NDVI loss values are adjacent to other pixels with high NDVI loss values in most cases. This is closely related to the scope of human activities. Humans always give priority to the exploitation of easy-to-use land, and will also develop new land nearby to expand their use scale, thus forming a spatial cluster of hot and cold spots. Areas that are prone to NDVI loss value are mainly concentrated in two different settings. One is frequently affected by human activities, mainly located in the densely populated and economically developed North China Plain, the middle and lower reaches of the Yangtze River Plain, and the Sichuan Basin. The other setting has high vegetation coverage, which is sensitive to frequent land cover volatility, and is mainly concentrated in southern Tibet and part of southwest China. It is necessary to strengthen the protection of the ecological environment and vegetation in these areas.
Our cluster/outlier analysis of land cover volatility based on protected areas further illustrated the effect of protected areas on land volatility, and different types of protected areas showed different results. Notably, species resources protected areas have the greatest loss values in the study area. The results of the spatial and temporal analysis based on NDVI loss values showed that the trends of NDVI changes in protected and unprotected areas during the study period were relatively consistent, showing a trend of first fluctuating and then rising. Meanwhile, the average median and mean NDVI loss values in all years for protected areas were still greater than those for unprotected areas, which is quite different from the generally recognized notion that land use change is less extensive in protected areas than in unprotected areas. However, combined with the outliers, stronger land cover volatility, accompanied by larger NDVI loss values, is primarily distributed in unprotected areas in most years. We could speculate that protected areas generally have higher vegetation coverage and are more sensitive to changes in NDVI.
To further explore the role of protected areas on NDVI, we identified the amount and spatial distribution of NDVI gain in the study area. The results show that NDVI gain values in protected areas are larger than in unprotected areas almost every year, even combined with the outliers. Moreover, stronger land cover volatility and larger NDVI gain values are also primarily distributed in protected areas in most years.
4.2. Conclusions
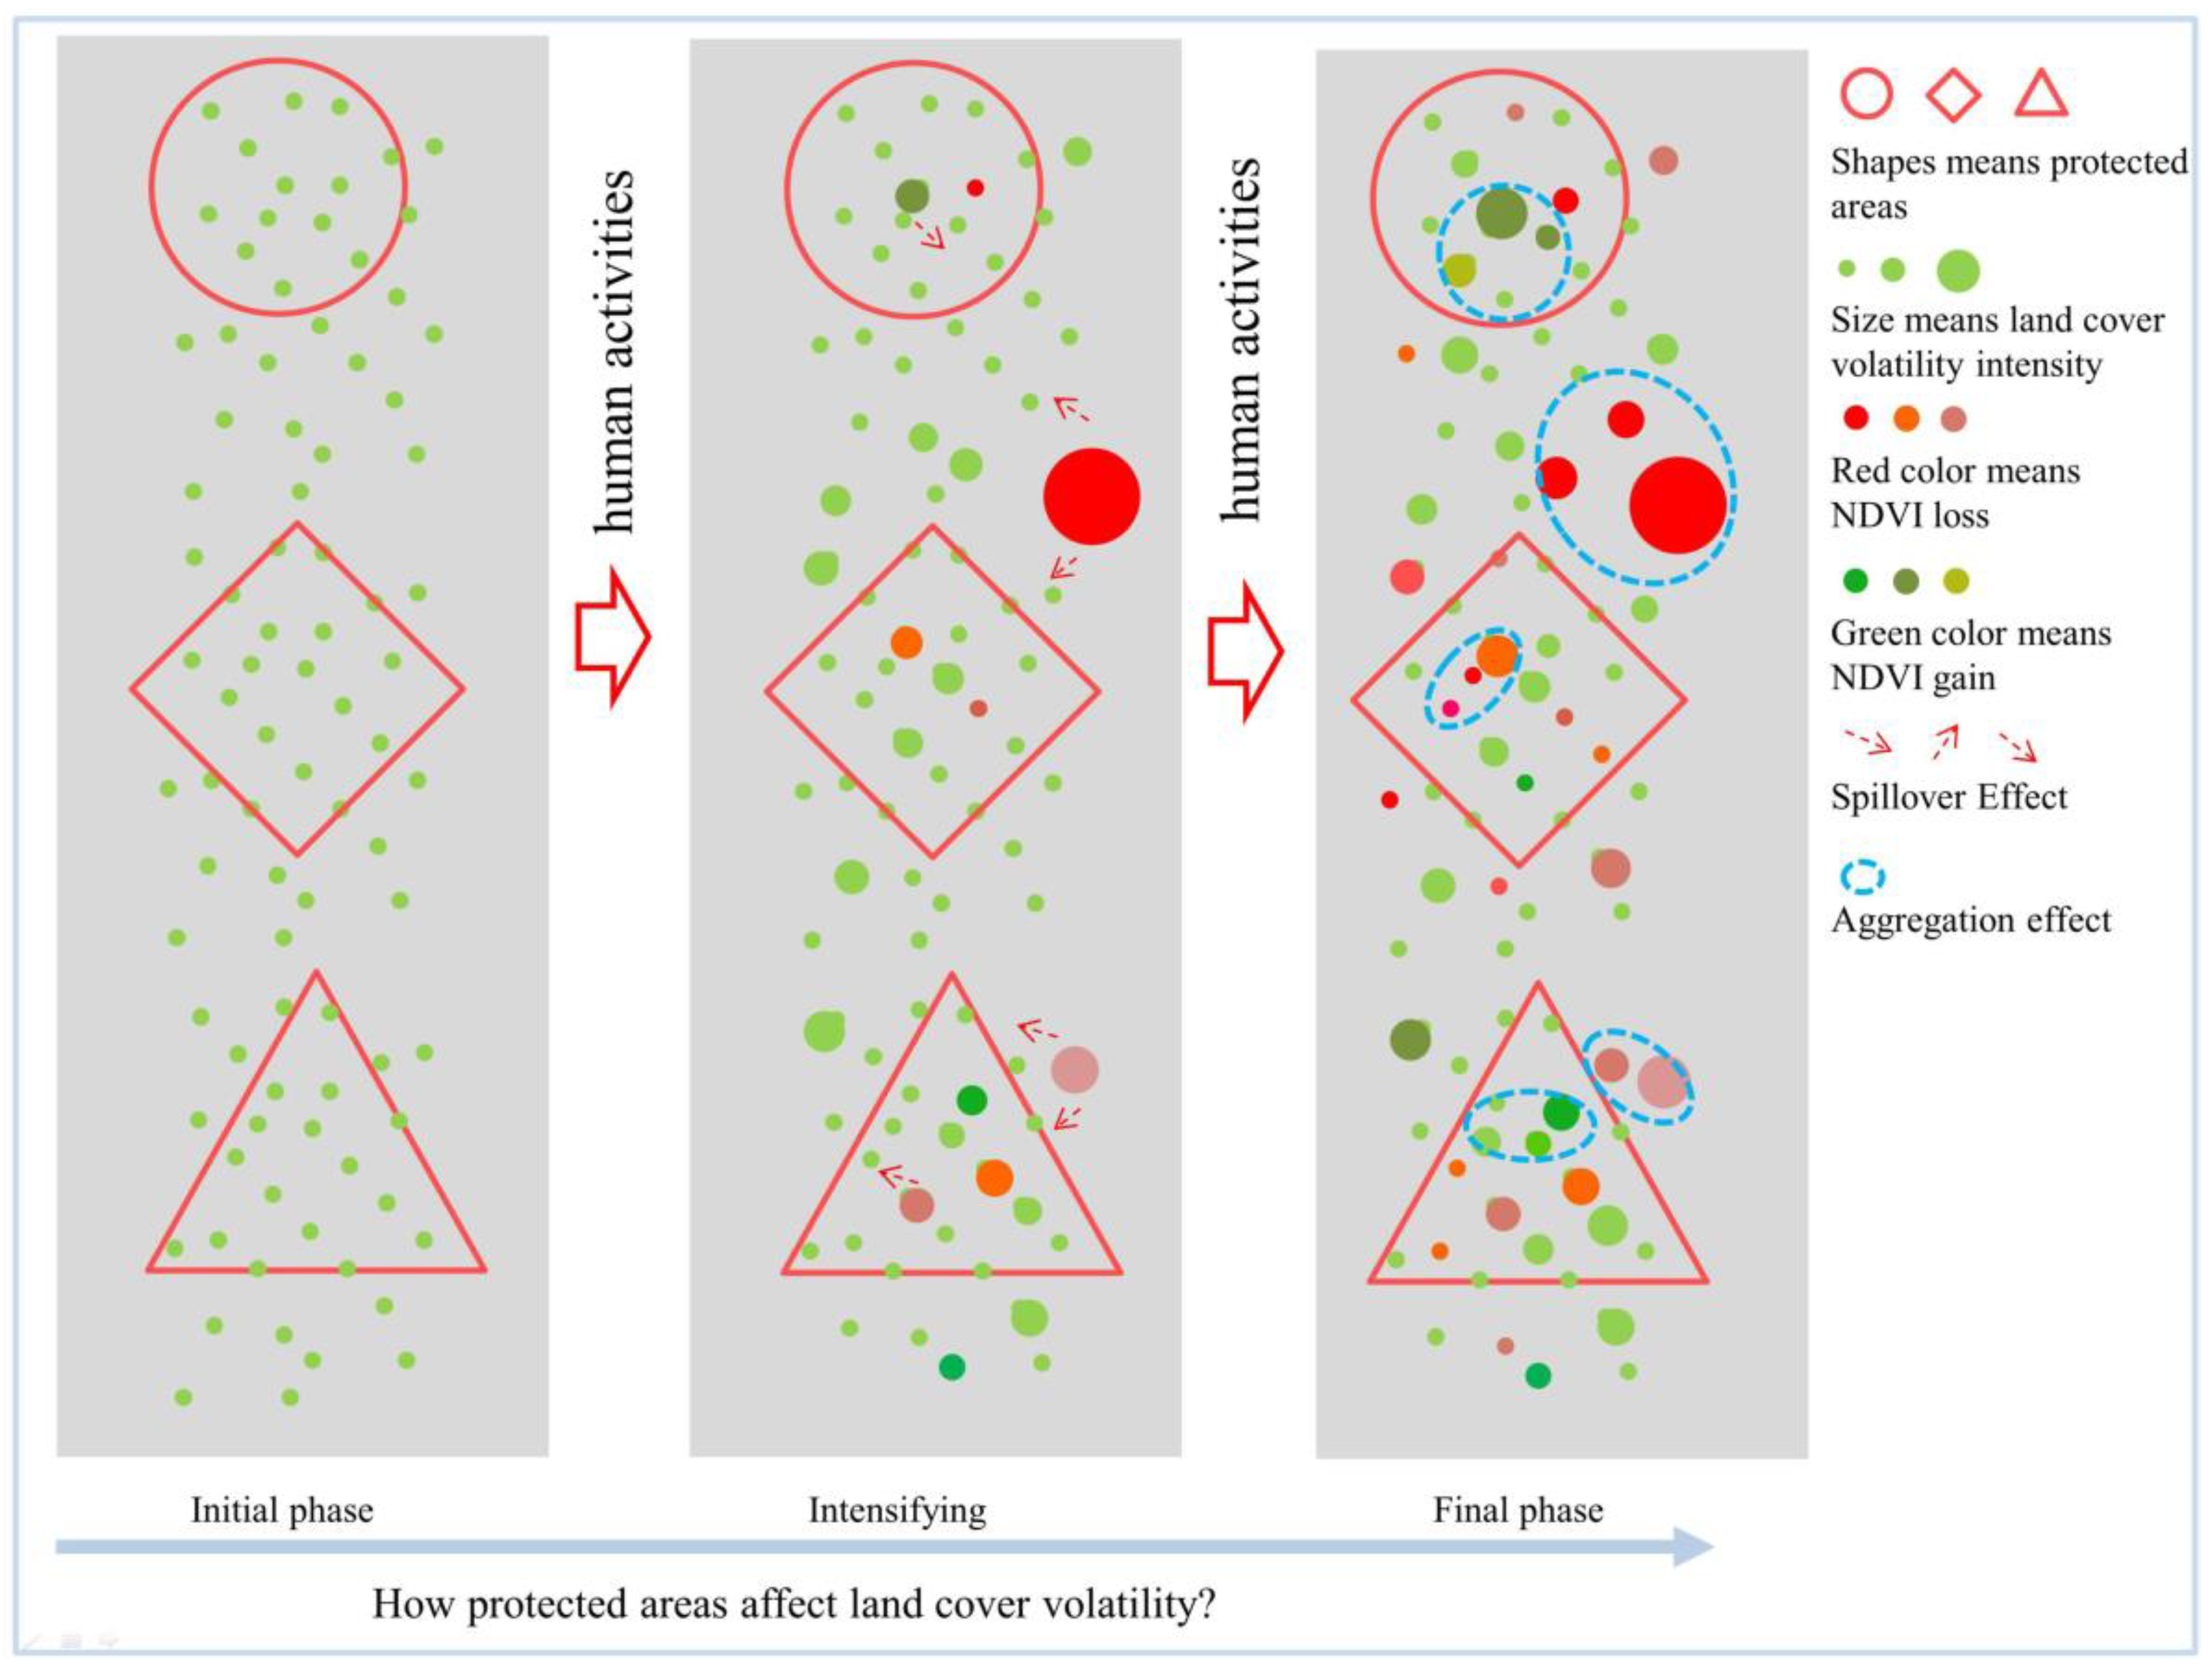
Our research shows that the occurrence of land cover volatility decreases with increasing land cover intensity and exhibits a clustering effect in spatial patterns. This is consistent with the previous studies [50], and the agglomeration effect of land cover volatility is evidently caused by frequent human activities. Different protected areas have different effects on land cover volatility, which are related to the dominant land cover type in the protected area. Areas with lush vegetation often have stronger land cover volatility, represented by NDVI changes that occur more frequently. At the same time, the inhibitory effect of protected areas on the decline in vegetation coverage is not obvious due to protected areas having better ecological conditions and being more sensitive to human activities. Thus, the inhibitory effect is inconspicuous. In contrast, protected areas have an obvious role in promoting the restoration of vegetation coverage, which also indicates the effectiveness of the establishment of protected areas in protecting global biodiversity. Figure 12 shows that land cover volatility is relatively stable in natural ecosystems without human activity. With the gradual intervention of human activities, different protected areas responded differently, and various types of land cover volatility began to appear, showing spatial aggregation. Although some protected areas are sensitive to human activities, resulting in strong land cover volatility in regional land cover, most land cover volatility occurs in unprotected areas, indicating the effectiveness of protected areas in suppressing suppress human activities. The result is more obvious when combined with vegetation coverage. The extreme value of vegetation coverage reduction mostly occurs in protected areas, and vegetation restoration mostly occurs in protected areas.
Most of the land cover volatility in protected areas is different, but the basic idea is the same, in that all volatility affects land use change by affecting human activities. Therefore, it is necessary to formulate reasonable land use policies in combination with local natural conditions, geographical environment, economic conditions, land policies, and other factors on the basis of exploring the characteristics of land cover volatility for expanding protected areas.
4.3. Limitations and Uncertainties
In this study, we identified land cover volatility in time and space based on the GEE platform, using long time series and a wide range of data. The identification results of land cover volatility were then combined with protected areas in China, and we analyzed the characteristics of land cover volatility in the protected and unprotected areas and revealed the influence of protected areas on land cover volatility. The accuracy of the research results was directly affected by the extraction results of land cover volatility, which is calculated by NDVI, but considering that the chief purpose was to reveal how protected areas affect the trend of land cover volatility, the research method has a certain degree of reliability.
We focus more on the effects of protected areas on land cover volatility in our research and less on the effects of the natural environment and policy factors. Subsequent research will consider the influence of the natural environment, topography, economic conditions, and local policies on environmental protection in different regions, and the results could be more practical. For example, it is of significant interest to rationally arrange and manage protected areas if we could clarify how different protected areas affect land cover volatility. Although the research results are not applicable to all situations, they are effective in explicating land cover volatility in China and analyzing the construction and management of Chinese protected areas. This study idea is helpful in improving land use management measures and providing suggestions.
Author Contributions
Conceptualization, Y.R. and H.Z.; methodology, Y.R.; software, Y.W.; validation, H.Z. and Y.R.; formal analysis, Y.W. and Y.R.; investigation, Y.R.; resources, Y.R.; data curation, Y.W.; writing—original draft preparation, Y.W.; writing—review and editing, Y.R.; visualization, Y.R.; supervision, Y.R. and H.Z.; project administration, H.Z.; funding acquisition, Y.R. All authors have read and agreed to the published version of the manuscript.
Funding
This research was funded by the National Natural Science Foundation of China (grant number 42101268).
Acknowledgments
The authors are grateful to the anonymous reviewers for their comments and suggestions which contributed to the further improvement of this paper.
Conflicts of Interest
The authors declare no conflict of interest.
References
- Lawler, J.J.; Lewis, D.J.; Nelson, E.; Plantinga, A.J.; Polasky, S.; Withey, J.C.; Helmers, D.P.; Martinuzzi, S.; Pennington, D.; Radeloff, V.C. Projected land-use change impacts on ecosystem services in the United States. Proc. Natl. Acad. Sci. USA 2014, 111, 7492–7497. [Google Scholar] [CrossRef] [Green Version]
- Roe, S.; Streck, C.; Obersteiner, M.; Frank, S.; Griscom, B.; Drouet, L.; Fricko, O.; Gusti, M.; Harris, N.; Hasegawa, T.; et al. Contribution of the land sector to a 1.5 °C world. Nat. Clim. Chang. 2019, 9, 817–828. [Google Scholar] [CrossRef]
- van Marle, M.J.E.; van Wees, D.; Houghton, R.A.; Field, R.D.; Verbesselt, J.; van der Werf, G.R. New land-use-change emissions indicate a declining CO2 airborne fraction. Nature 2022, 603, 450–454. [Google Scholar] [CrossRef] [PubMed]
- Schulze, K.; Malek, Z.; Verburg, P.H. How will land degradation neutrality change future land system patterns? A scenario simulation study. Environ. Sci. Policy 2021, 124, 254–266. [Google Scholar] [CrossRef]
- Machmuller, M.B.; Kramer, M.G.; Cyle, T.K.; Hill, N.; Hancock, D.; Thompson, A. Emerging land use practices rapidly increase soil organic matter. Nat. Commun. 2015, 6, 6995. [Google Scholar] [CrossRef]
- Albert, J.S.; Destouni, G.; Duke-Sylvester, S.M.; Magurran, A.E.; Oberdorff, T.; Reis, R.E.; Winemiller, K.O.; Ripple, W.J. Scientists’ warning to humanity on the freshwater biodiversity crisis. Ambio 2021, 50, 85–94. [Google Scholar] [CrossRef]
- Duan, J.; Ren, C.; Wang, S.; Zhang, X.; Reis, S.; Xu, J.; Gu, B. Consolidation of agricultural land can contribute to agricultural sustainability in China. Nat. Food 2021, 2, 1014–1022. [Google Scholar] [CrossRef]
- Trenberth, K.E. Rural land-use change and climate. Nature 2004, 427, 213. [Google Scholar] [CrossRef]
- Dado, J.M.; Narisma, G.T. The Effect of Urban Expansion in Metro Manila on the Southwest Monsoon Rainfall. Asia-Pac. J. Atmos. Sci. 2022, 58, 1–12. [Google Scholar] [CrossRef]
- Liu, S.; Wang, Y.; Zhang, G.J.; Wei, L.; Wang, B.; Yu, L. Contrasting influences of biogeophysical and biogeochemical impacts of historical land use on global economic inequality. Nat. Commun. 2022, 13, 2479. [Google Scholar] [CrossRef]
- Singh, P.; Kikon, N.; Verma, P. Impact of land use change and urbanization on urban heat island in Lucknow city, Central India. A remote sensing based estimate. Sustain. Cities Soc. 2017, 32, 100–114. [Google Scholar] [CrossRef]
- Ouyang, Z.; Sciusco, P.; Jiao, T.; Feron, S.; Lei, C.; Li, F.; John, R.; Fan, P.; Li, X.; Williams, C.A.; et al. Albedo changes caused by future urbanization contribute to global warming. Nat. Commun. 2022, 13, 3800. [Google Scholar] [CrossRef] [PubMed]
- Guzha, A.C.; Rufino, M.C.; Okoth, S.; Jacobs, S.; Nobrega, R.L.B. Impacts of land use and land cover change on surface runoff, discharge and low flows: Evidence from East Africa. J. Hydrol.-Reg. Stud. 2018, 15, 49–67. [Google Scholar] [CrossRef]
- Zhou, G.; Wei, X.; Chen, X.; Zhou, P.; Liu, X.; Xiao, Y.; Sun, G.; Scott, D.F.; Zhou, S.; Han, L.; et al. Global pattern for the effect of climate and land cover on water yield. Nat. Commun. 2015, 6, 5918. [Google Scholar] [CrossRef] [Green Version]
- Sterling, S.M.; Ducharne, A.; Polcher, J. The impact of global land-cover change on the terrestrial water cycle. Nat. Clim. Chang. 2013, 3, 385–390. [Google Scholar] [CrossRef]
- Tolessa, T.; Senbeta, F.; Kidane, M. The impact of land use/land cover change on ecosystem services in the central highlands of Ethiopia. Ecosyst. Serv. 2017, 23, 47–54. [Google Scholar] [CrossRef]
- Yin, H.; Pflugmacher, D.; Li, A.; Li, Z.; Hostert, P. Land use and land cover change in Inner Mongolia—understanding the effects of China’s re-vegetation programs. Remote Sens. Environ. 2018, 204, 918–930. [Google Scholar] [CrossRef]
- Tran, D.X.; Pla, F.; Latorre-Carmona, P.; Myint, S.W.; Gaetano, M.; Kieu, H.V. Characterizing the relationship between land use land cover change and land surface temperature. Isprs J. Photogramm. Remote Sens. 2017, 124, 119–132. [Google Scholar] [CrossRef] [Green Version]
- Musaoglu, N.; Gurel, M.; Ulugtekin, N.; Tanik, A.; Seker, D.Z. Use of remotely sensed data for analysis of land-use change in a highly urbanized district of mega city, Istanbul. J. Environ. Sci. Health Part a-Toxic/Hazard. Subst. Environ. Eng. 2006, 41, 2057–2069. [Google Scholar] [CrossRef]
- Zhai, J.H.; Xiao, C.W.; Feng, Z.M.; Liu, Y. Spatio-Temporal Patterns of Land-Use Changes and Conflicts between Cropland and Forest in the Mekong River Basin during 1990–2020. Land 2022, 11, 927. [Google Scholar] [CrossRef]
- Loukika, K.N.; Keesara, V.R.; Buri, E.S.; Sridhar, V. Predicting the Effects of Land Use Land Cover and Climate Change on Munneru River Basin Using CA-Markov and Soil and Water Assessment Tool. Sustainability 2022, 14, 5000. [Google Scholar] [CrossRef]
- Huang, Z.H.; Li, X.J.; Du, H.Q.; Mao, F.J.; Han, N.; Fan, W.L.; Xu, Y.X.; Luo, X. Simulating Future LUCC by Coupling Climate Change and Human Effects Based on Multi-Phase Remote Sensing Data. Remote Sens. 2022, 14, 1698. [Google Scholar] [CrossRef]
- Liu, Y.E.; Yu, K.K.; Zhao, Y.Q.; Bao, J.C. Impacts of Climatic Variation and Human Activity on Runoff in Western China. Sustainability 2022, 14, 942. [Google Scholar] [CrossRef]
- Geng, J.C.; Shen, S.; Cheng, C.X.; Dai, K.X. A hybrid spatiotemporal convolution-based cellular automata model (ST-CA) for land-use/cover change simulation. Int. J. Appl. Earth Obs. Geoinf. 2022, 110, 102789. [Google Scholar] [CrossRef]
- Asamoah, E.F.; Beaumont, L.J.; Maina, J.M. Climate and land-use changes reduce the benefits of terrestrial protected areas. Nat. Clim. Chang. 2021, 11, 1105–1110. [Google Scholar] [CrossRef]
- Pereira, P.H.C.; Araujo, J.C.; Lima, G.V.; Côrtes, L.G.F.; Gomes, E.; Magris, R.A. Effectiveness of management zones for recovering parrotfish species within the largest coastal marine protected area in Brazil. Sci. Rep. 2022, 12, 12232. [Google Scholar] [CrossRef] [PubMed]
- Rodrigues, A.S.L.; Andelman, S.J.; Bakarr, M.I.; Boitani, L.; Brooks, T.M.; Cowling, R.M.; Fishpool, L.D.C.; da Fonseca, G.A.B.; Gaston, K.J.; Hoffmann, M.; et al. Effectiveness of the global protected area network in representing species diversity. Nature 2004, 428, 640–643. [Google Scholar] [CrossRef] [PubMed]
- Chung, M.G.; Frank, K.A.; Pokhrel, Y.; Dietz, T.; Liu, J. Natural infrastructure in sustaining global urban freshwater ecosystem services. Nat. Sustain. 2021, 4, 1068–1075. [Google Scholar] [CrossRef]
- Graham, V.; Geldmann, J.; Adams, V.M.; Negret, P.J.; Sinovas, P.; Chang, H.-C. Southeast Asian protected areas are effective in conserving forest cover and forest carbon stocks compared to unprotected areas. Sci. Rep. 2021, 11, 23760. [Google Scholar] [CrossRef]
- Naidoo, R.; Gerkey, D.; Hole, D.; Pfaff, A.; Ellis, A.M.; Golden, C.D.; Herrera, D.; Johnson, K.; Mulligan, M.; Ricketts, T.H.; et al. Evaluating the impacts of protected areas on human well-being across the developing world. Sci. Adv. 2019, 5, eaav3006. [Google Scholar] [CrossRef] [Green Version]
- Cazalis, V.; Prince, K.; Mihoub, J.-B.; Kelly, J.; Butchart, S.H.M.; Rodrigues, A.S.L. Effectiveness of protected areas in conserving tropical forest birds. Nat. Commun. 2020, 11, 1–8. [Google Scholar] [CrossRef] [PubMed]
- Hilborn, R.; Kaiser, M.J. A path forward for analysing the impacts of marine protected areas. Nature 2022, 607, E1–E2. [Google Scholar] [CrossRef] [PubMed]
- Watson, J.E.M.; Dudley, N.; Segan, D.B.; Hockings, M. The performance and potential of protected areas. Nature 2014, 515, 67–73. [Google Scholar] [CrossRef] [PubMed]
- Laurance, W.F.; Useche, D.C.; Rendeiro, J.; Kalka, M.; Bradshaw, C.J.A.; Sloan, S.P.; Laurance, S.G.; Campbell, M.; Abernethy, K.; Alvarez, P.; et al. Averting biodiversity collapse in tropical forest protected areas. Nature 2012, 489, 290–294. [Google Scholar] [CrossRef] [Green Version]
- Leverington, F.; Costa, K.L.; Pavese, H.; Lisle, A.; Hockings, M. A Global Analysis of Protected Area Management Effectiveness. Environ. Manag. 2010, 46, 685–698. [Google Scholar] [CrossRef]
- Clark, N.E.; Boakes, E.H.; McGowan, P.J.K.; Mace, G.M.; Fuller, R.A. Protected Areas in South Asia Have Not Prevented Habitat Loss: A Study Using Historical Models of Land-Use Change. PLoS ONE 2013, 8, e65298. [Google Scholar] [CrossRef]
- Liu, Y.J.; Zou, X.T.; Chen, J.; Pan, T. Impacts of protected areas establishment on pastoralists’ livelihoods in the Three-River-Source Region on the Qinghai-Tibetan Plateau. Land Use Policy 2022, 115, 106018. [Google Scholar] [CrossRef]
- Ghoddousi, A.; Loos, J.; Kuemmerle, T. An Outcome-Oriented, Social-Ecological Framework for Assessing Protected Area Effectiveness. Bioscience 2022, 72, 201–212. [Google Scholar] [CrossRef]
- Rao, Y.H.; Zhang, J.J.; Wang, K.; Jepsen, M.R. Understanding land use volatility and agglomeration in northern Southeast Asia. J. Environ. Manag. 2021, 278, 111536. [Google Scholar] [CrossRef]
- Solecka, I.; Krajewski, P.; Krzyzanek, A.; Garczynska, A. Citizens’ Perceptions of Landscape Changes and Their Driving Forces: Evidence from Poland. Int. J. Environ. Res. Public Health 2022, 19, 1688. [Google Scholar] [CrossRef]
- Ren, Y.; Li, Z.H.; Li, J.N.; Dashtseren, A.; Li, Y.; Altanbagana, M. Comparative analysis of driving forces of land use/cover change in the upper, middle and lower reaches of the Selenga River Basin*. Land Use Policy 2022, 117, 106118. [Google Scholar] [CrossRef]
- Dai, L.L.; Zhan, Z.X.; Shu, Y.S.; Rong, X. Land Use Change in the Cross-Boundary Regions of a Metropolitan Area: A Case Study of Tongzhou-Wuqing-Langfang. Land 2022, 11, 153. [Google Scholar] [CrossRef]
- Zhu, Z.; Wang, S.; Woodcock, C.E. Improvement and expansion of the Fmask algorithm: Cloud, cloud shadow, and snow detection for Landsats 4–7, 8, and Sentinel 2 images. Remote Sens. 2015, 159, 269–277. [Google Scholar] [CrossRef]
- Chen, Z.Q.; Dong, K.K.; Zhang, Y.H.; Hou, G.L.; Liu, Z.L. Regional comparative evaluation of biodiversity conservation effectiveness in National Important Ecological Function Areas. Acta Ecologica Sinica 2022, 42, 5264–5274. [Google Scholar] [CrossRef]
- Kennedy, R.E.; Yang, Z.; Gorelick, N.; Braaten, J.; Cavalcante, L.; Cohen, W.B.; Healey, S. Implementation of the LandTrendr Algorithm on Google Earth Engine. Remote Sens. 2018, 10, 691. [Google Scholar] [CrossRef] [Green Version]
- Veraverbeke, S.; Lhermitte, S.; Verstraeten, W.W.; Goossens, R. Evaluation of pre/post-fire differenced spectral indices for assessing burn severity in a Mediterranean environment with Landsat Thematic Mapper. Int. J. Remote Sens. 2011, 32, 3521–3537. [Google Scholar] [CrossRef] [Green Version]
- Escuin, S.; Navarro, R.; Fernandez, P. Fire severity assessment by using NBR (Normalized Burn Ratio) and NDVI (Normalized Difference Vegetation Index) derived from LANDSAT TM/ETM images. Int. J. Remote Sens. 2008, 29, 1053–1073. [Google Scholar] [CrossRef]
- Lozano, F.J.; Suarez-Seoane, S.; de Luis, E. Assessment of several spectral indices derived from multi-temporal Landsat data for fire occurrence probability modelling. Remote Sens. Environ. 2007, 107, 533–544. [Google Scholar] [CrossRef]
- Barnes, A.D.; Jochum, M.; Mumme, S.; Haneda, N.F.; Farajallah, A.; Widarto, T.H.; Brose, U. Consequences of tropical land use for multitrophic biodiversity and ecosystem functioning. Nat. Commun. 2014, 5, 5351. [Google Scholar] [CrossRef]
- Rao, Y.; Zhang, J. Revealing the Land Use Volatility Process in Northern Southeast Asia. Land 2022, 11, 1092. [Google Scholar] [CrossRef]
Figure 1.
Distribution of national protected areas in China, which mainly undertake six types of functions.
Figure 1.
Distribution of national protected areas in China, which mainly undertake six types of functions.

Figure 2.
Research framework—basic data, whole process, and main purposes.

Figure 3.
Examples of the fitting process of LandTrendr. The root mean square error (RMSE) of the final fitting based on NDVI is enlarged by 1000 times. Panels (a,b) show that vegetation coverage gradually recovered after the sudden drop; panels (c,d) show that the vegetation coverage did not recover after the decrease.
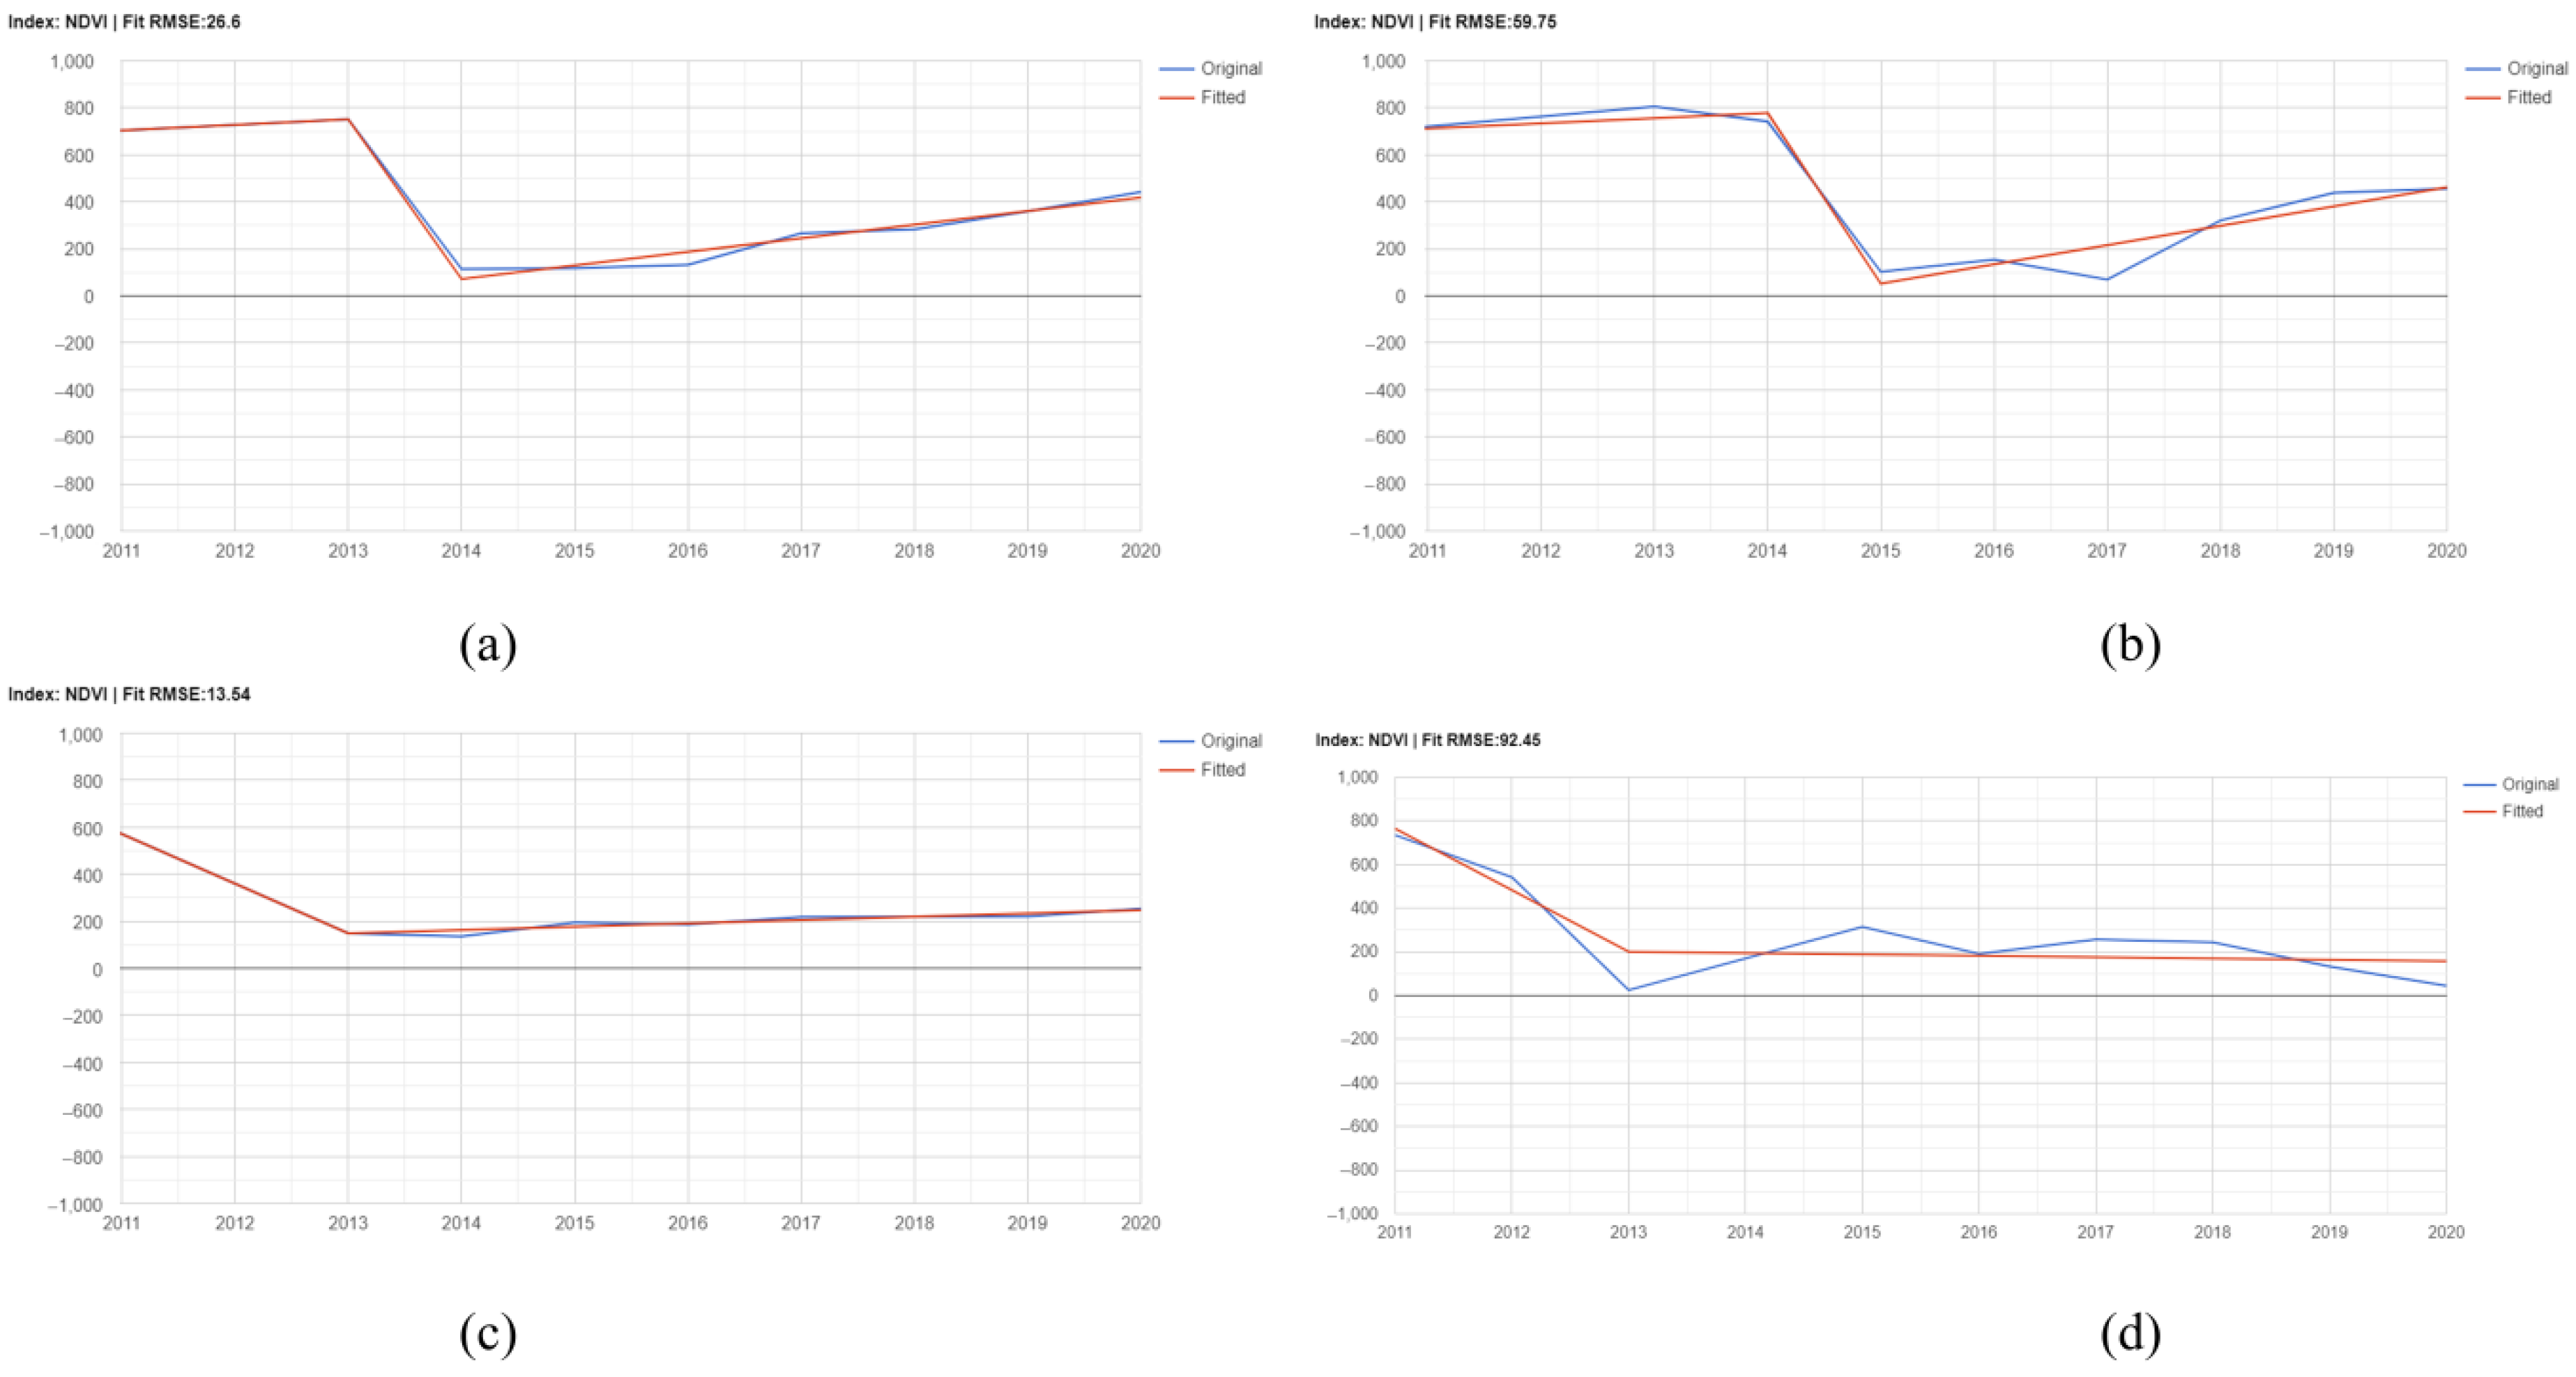
Figure 4.
Amount identification of strong land cover volatility based on different NDVI loss values.
Figure 4.
Amount identification of strong land cover volatility based on different NDVI loss values.
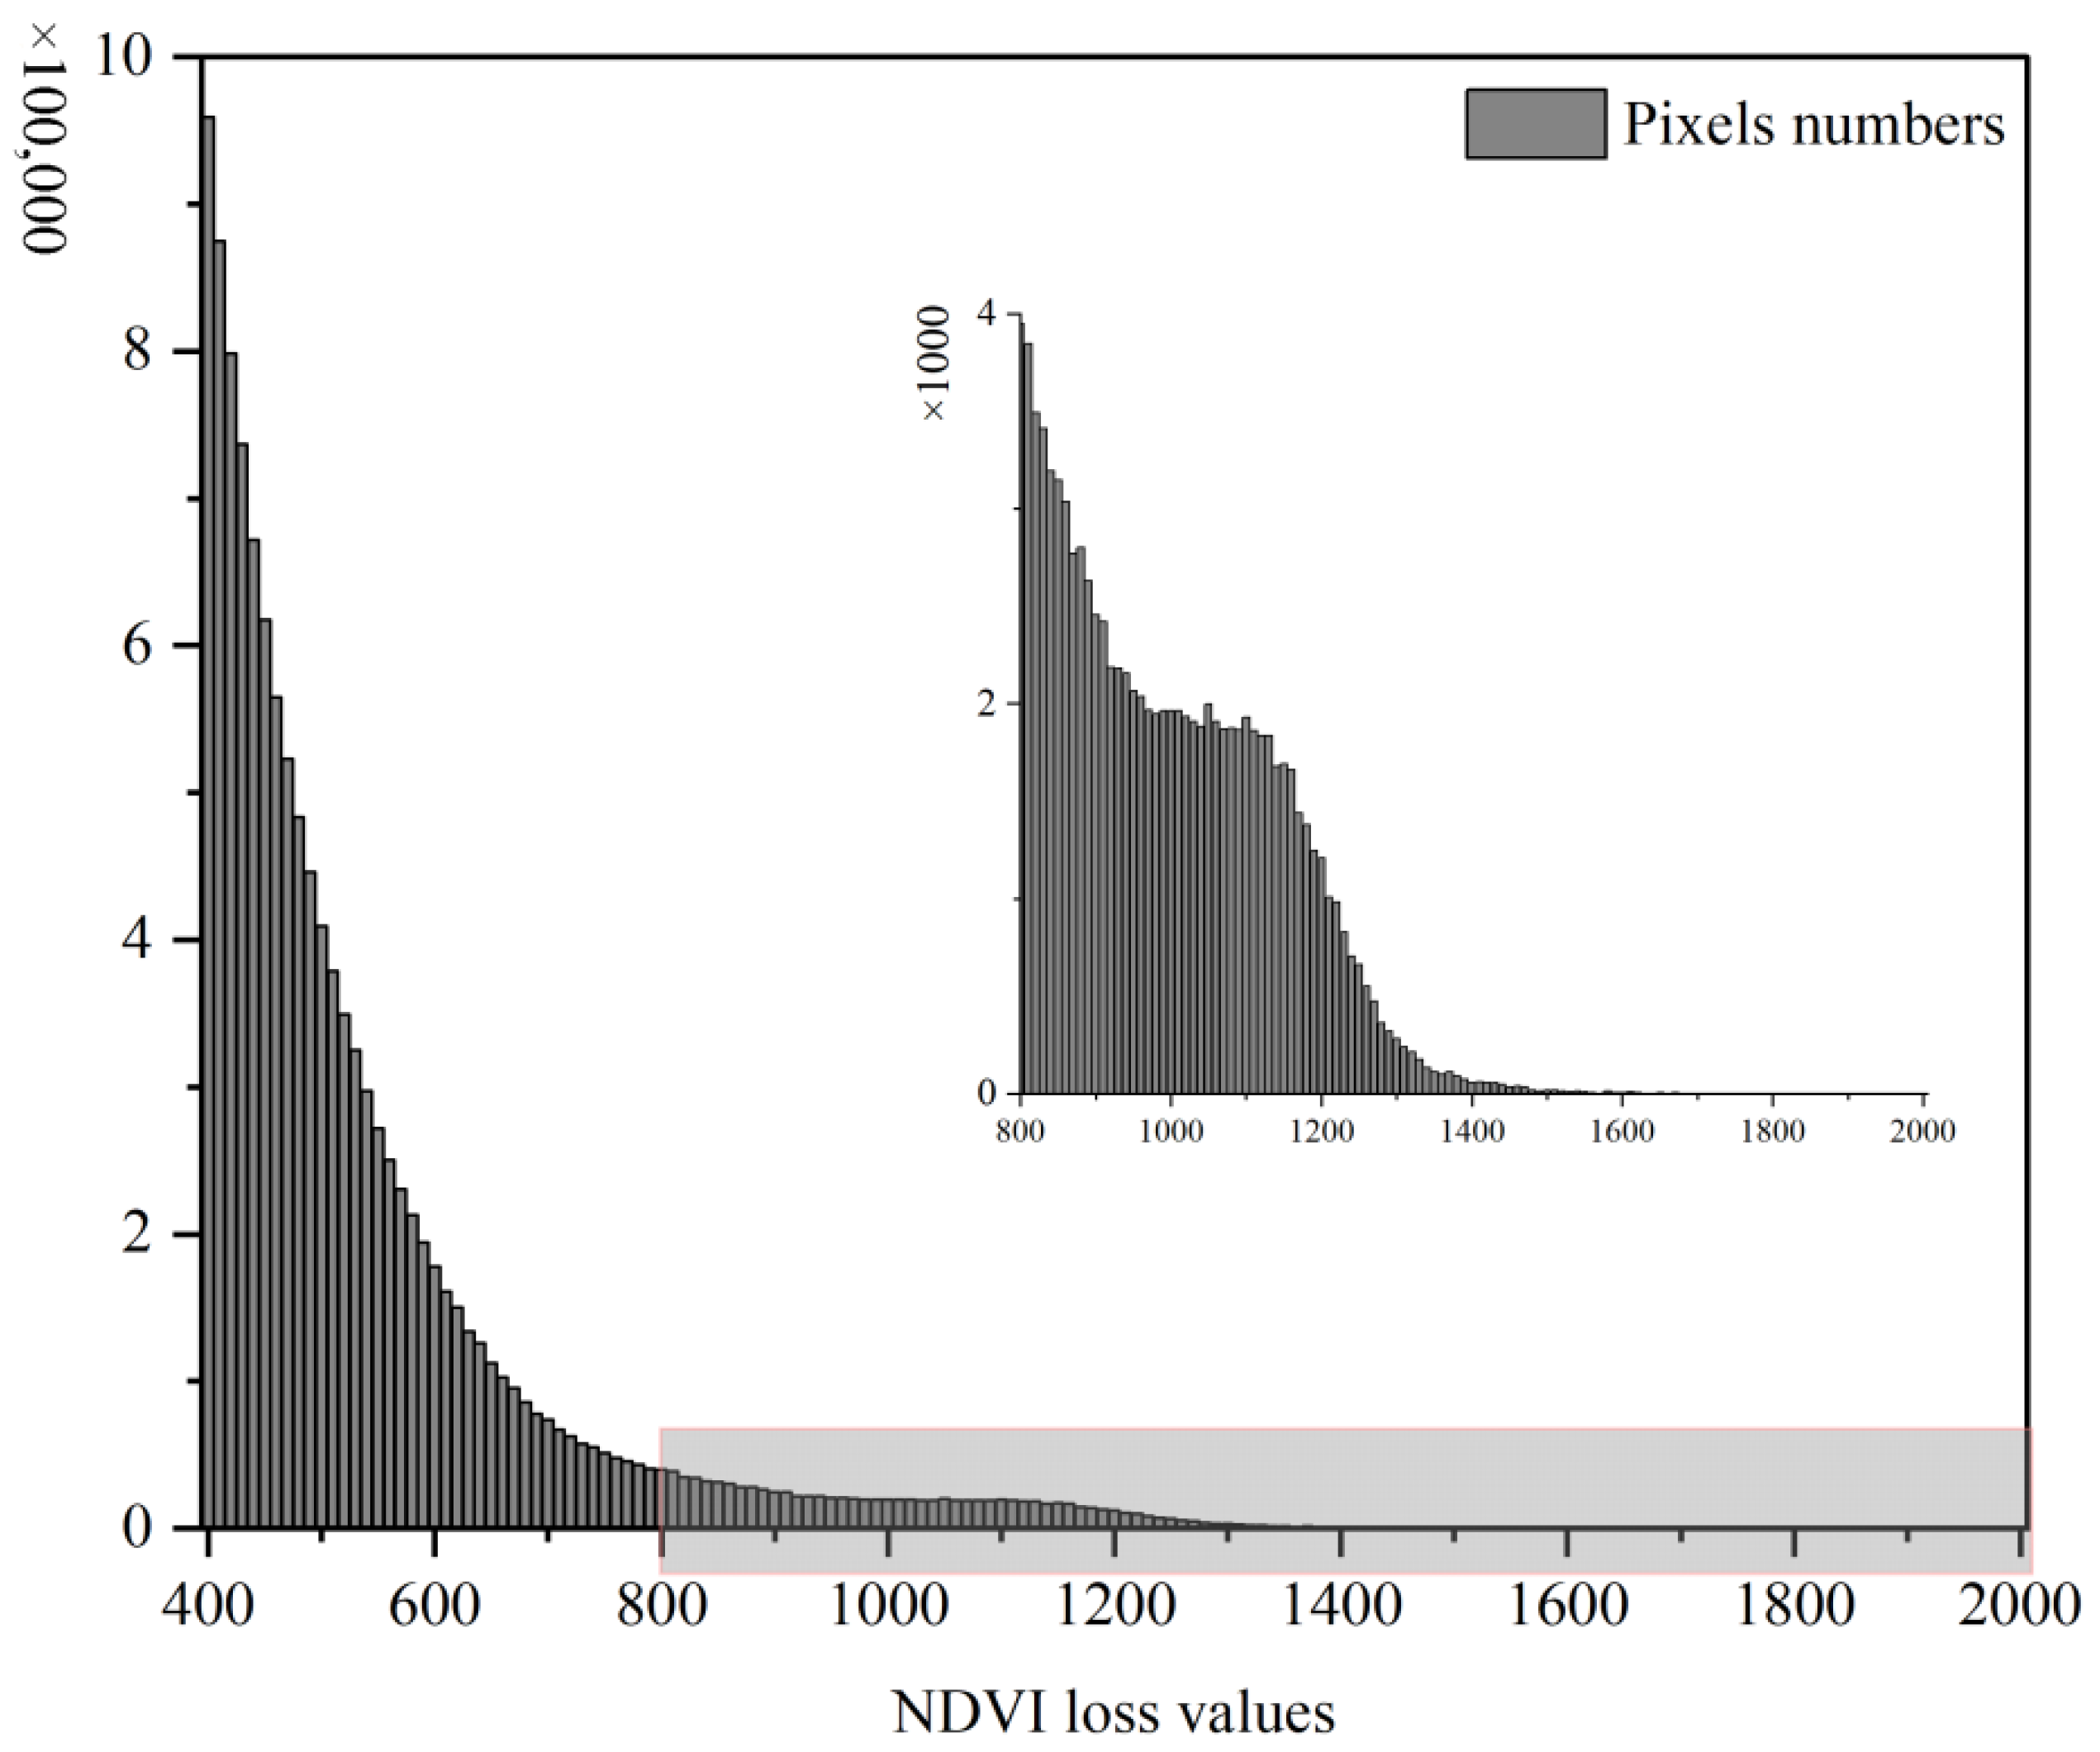
Figure 5.
Amount identification of strong land cover volatility based on time series.

Figure 6.
Distribution of strong land cover volatility, mainly located in four areas (red ellipses).
Figure 6.
Distribution of strong land cover volatility, mainly located in four areas (red ellipses).
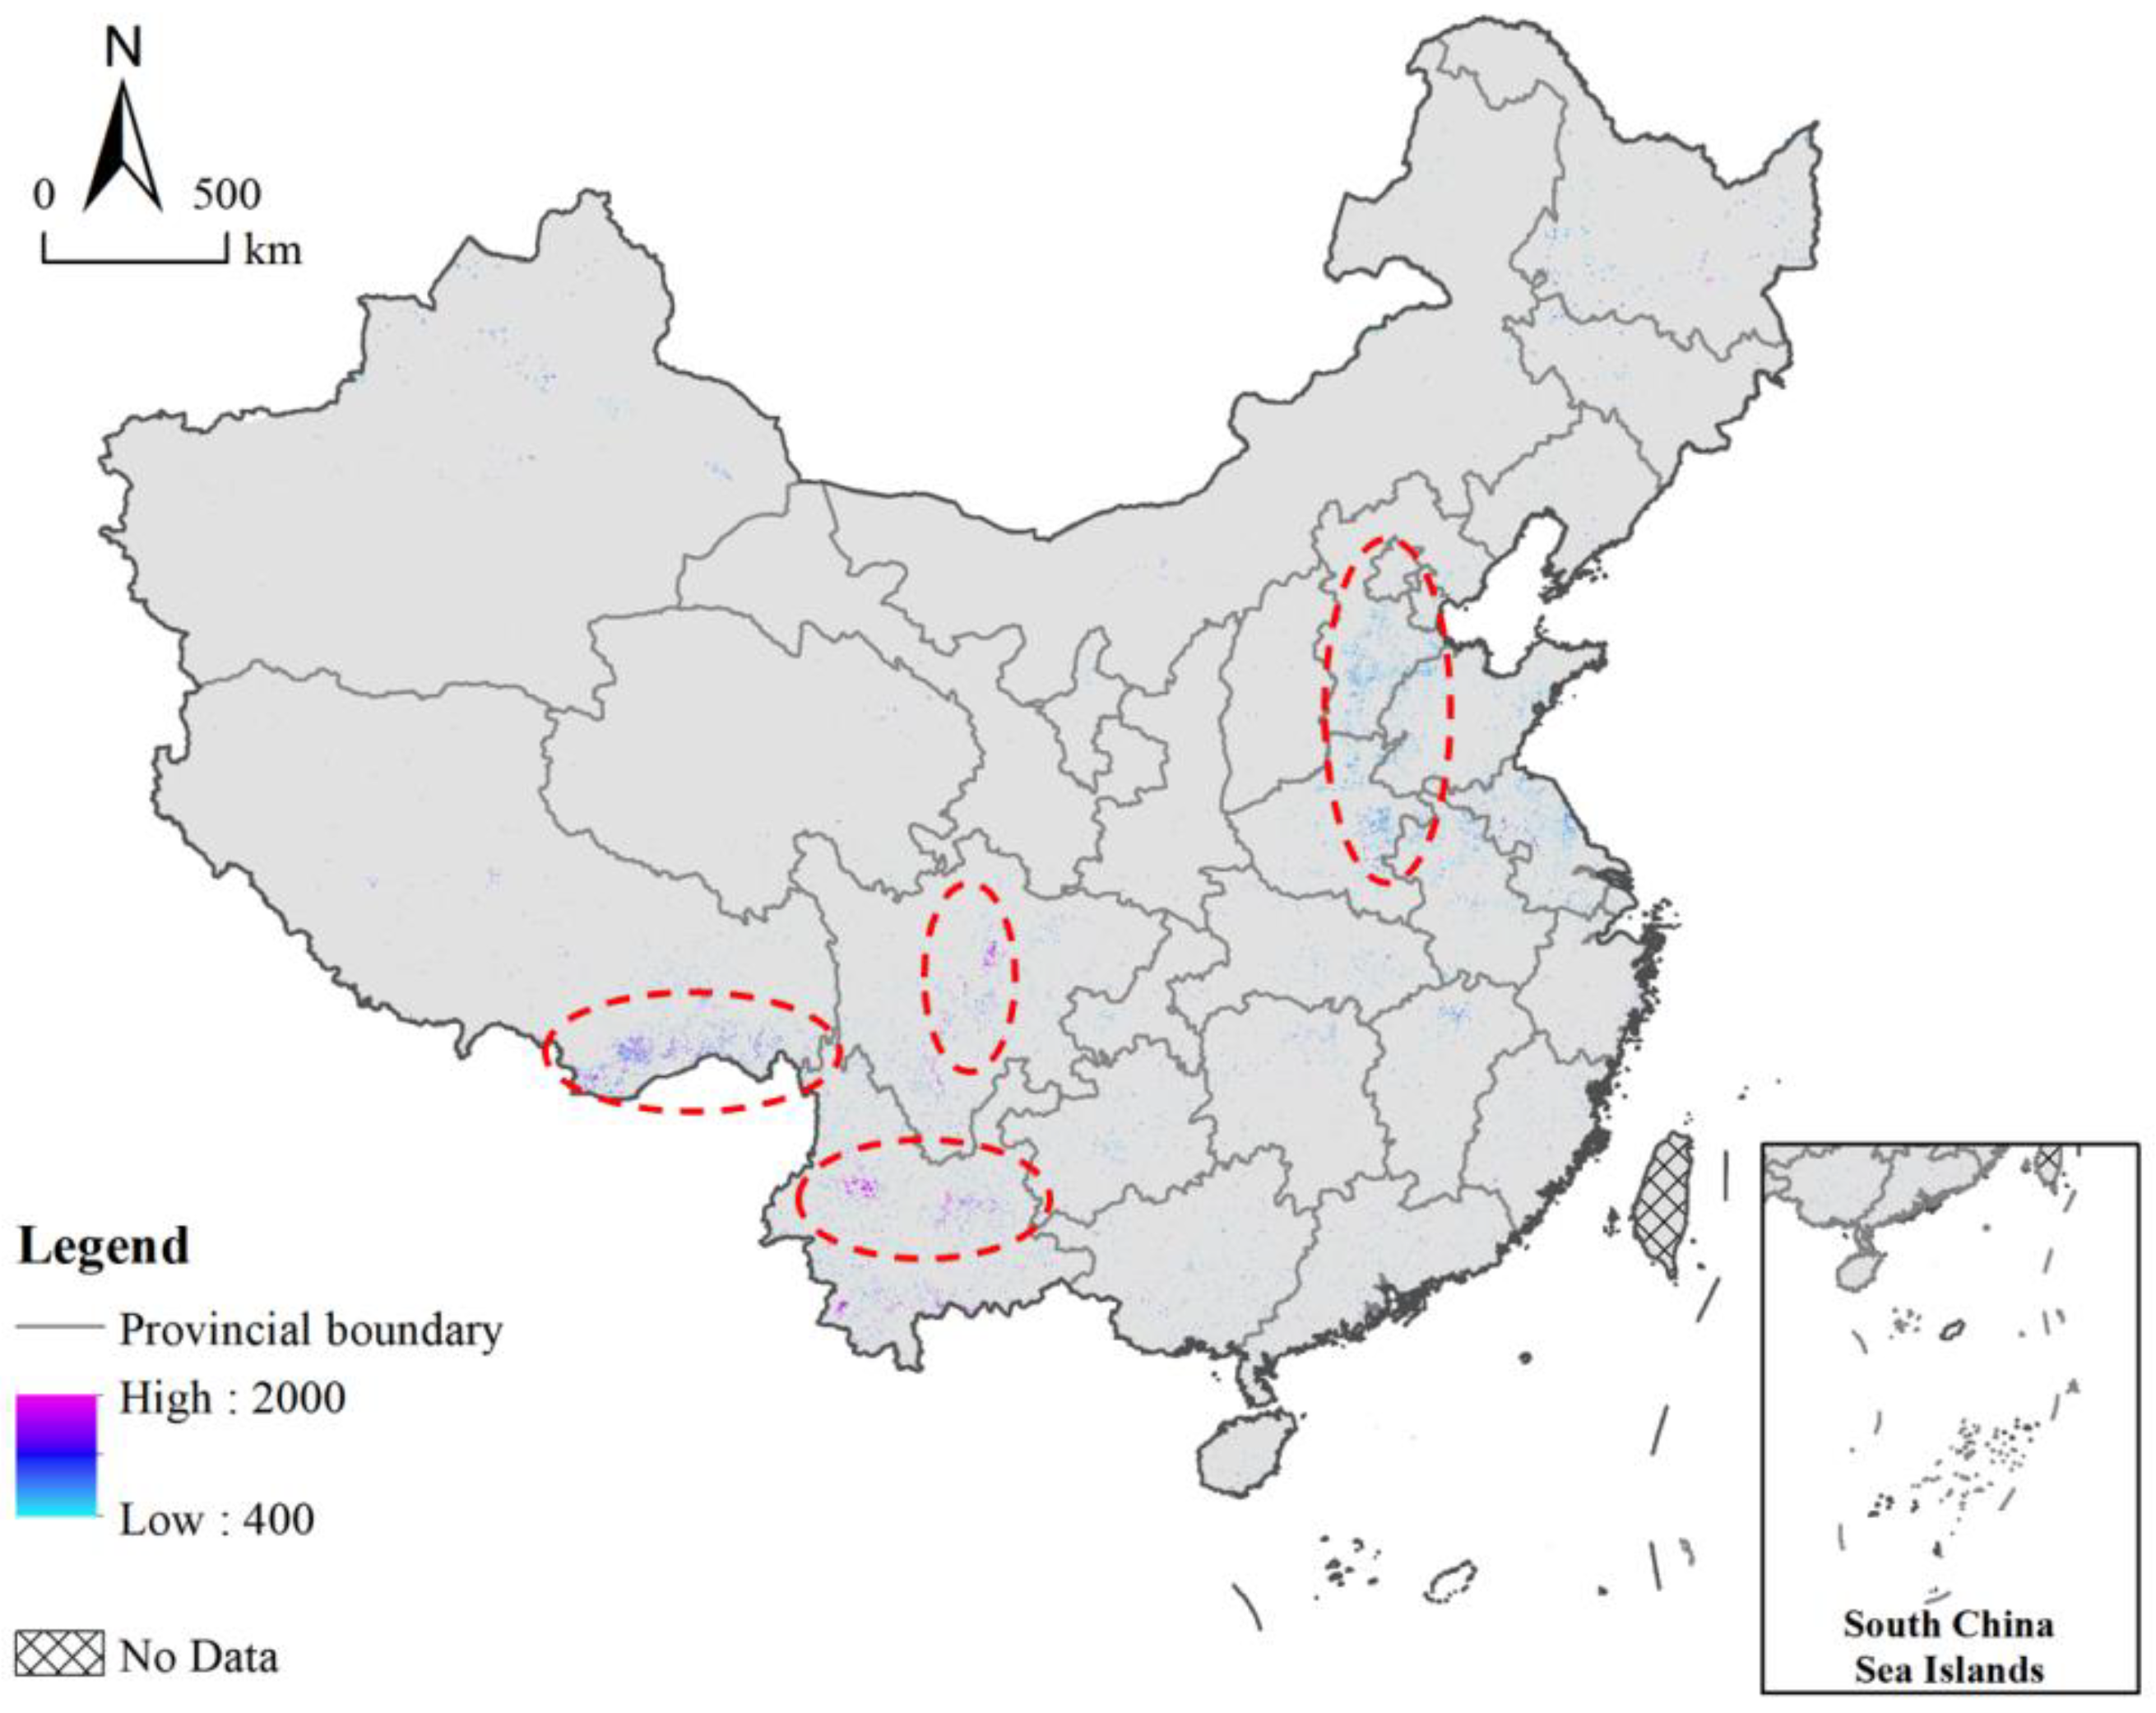
Figure 7.
Analysis of hot and cold spots for land cover volatility. The hot and cold spot observation value G is used to describe the hot and cold distribution. If the index is a statistically significant positive value, with a higher value and a more concentrated distribution of hot spot clusters, the region is a hot spot region, and vice versa for a cold spot region.

Figure 8.
Land cover volatility with NDVI loss in different protected areas.

Figure 9.
Land cover volatility with NDVI loss in protected and unprotected areas.

Figure 10.
Land cover volatility with NDVI gain in different protected areas.

Figure 11.
Land cover volatility with NDVI gain in protected and unprotected areas.
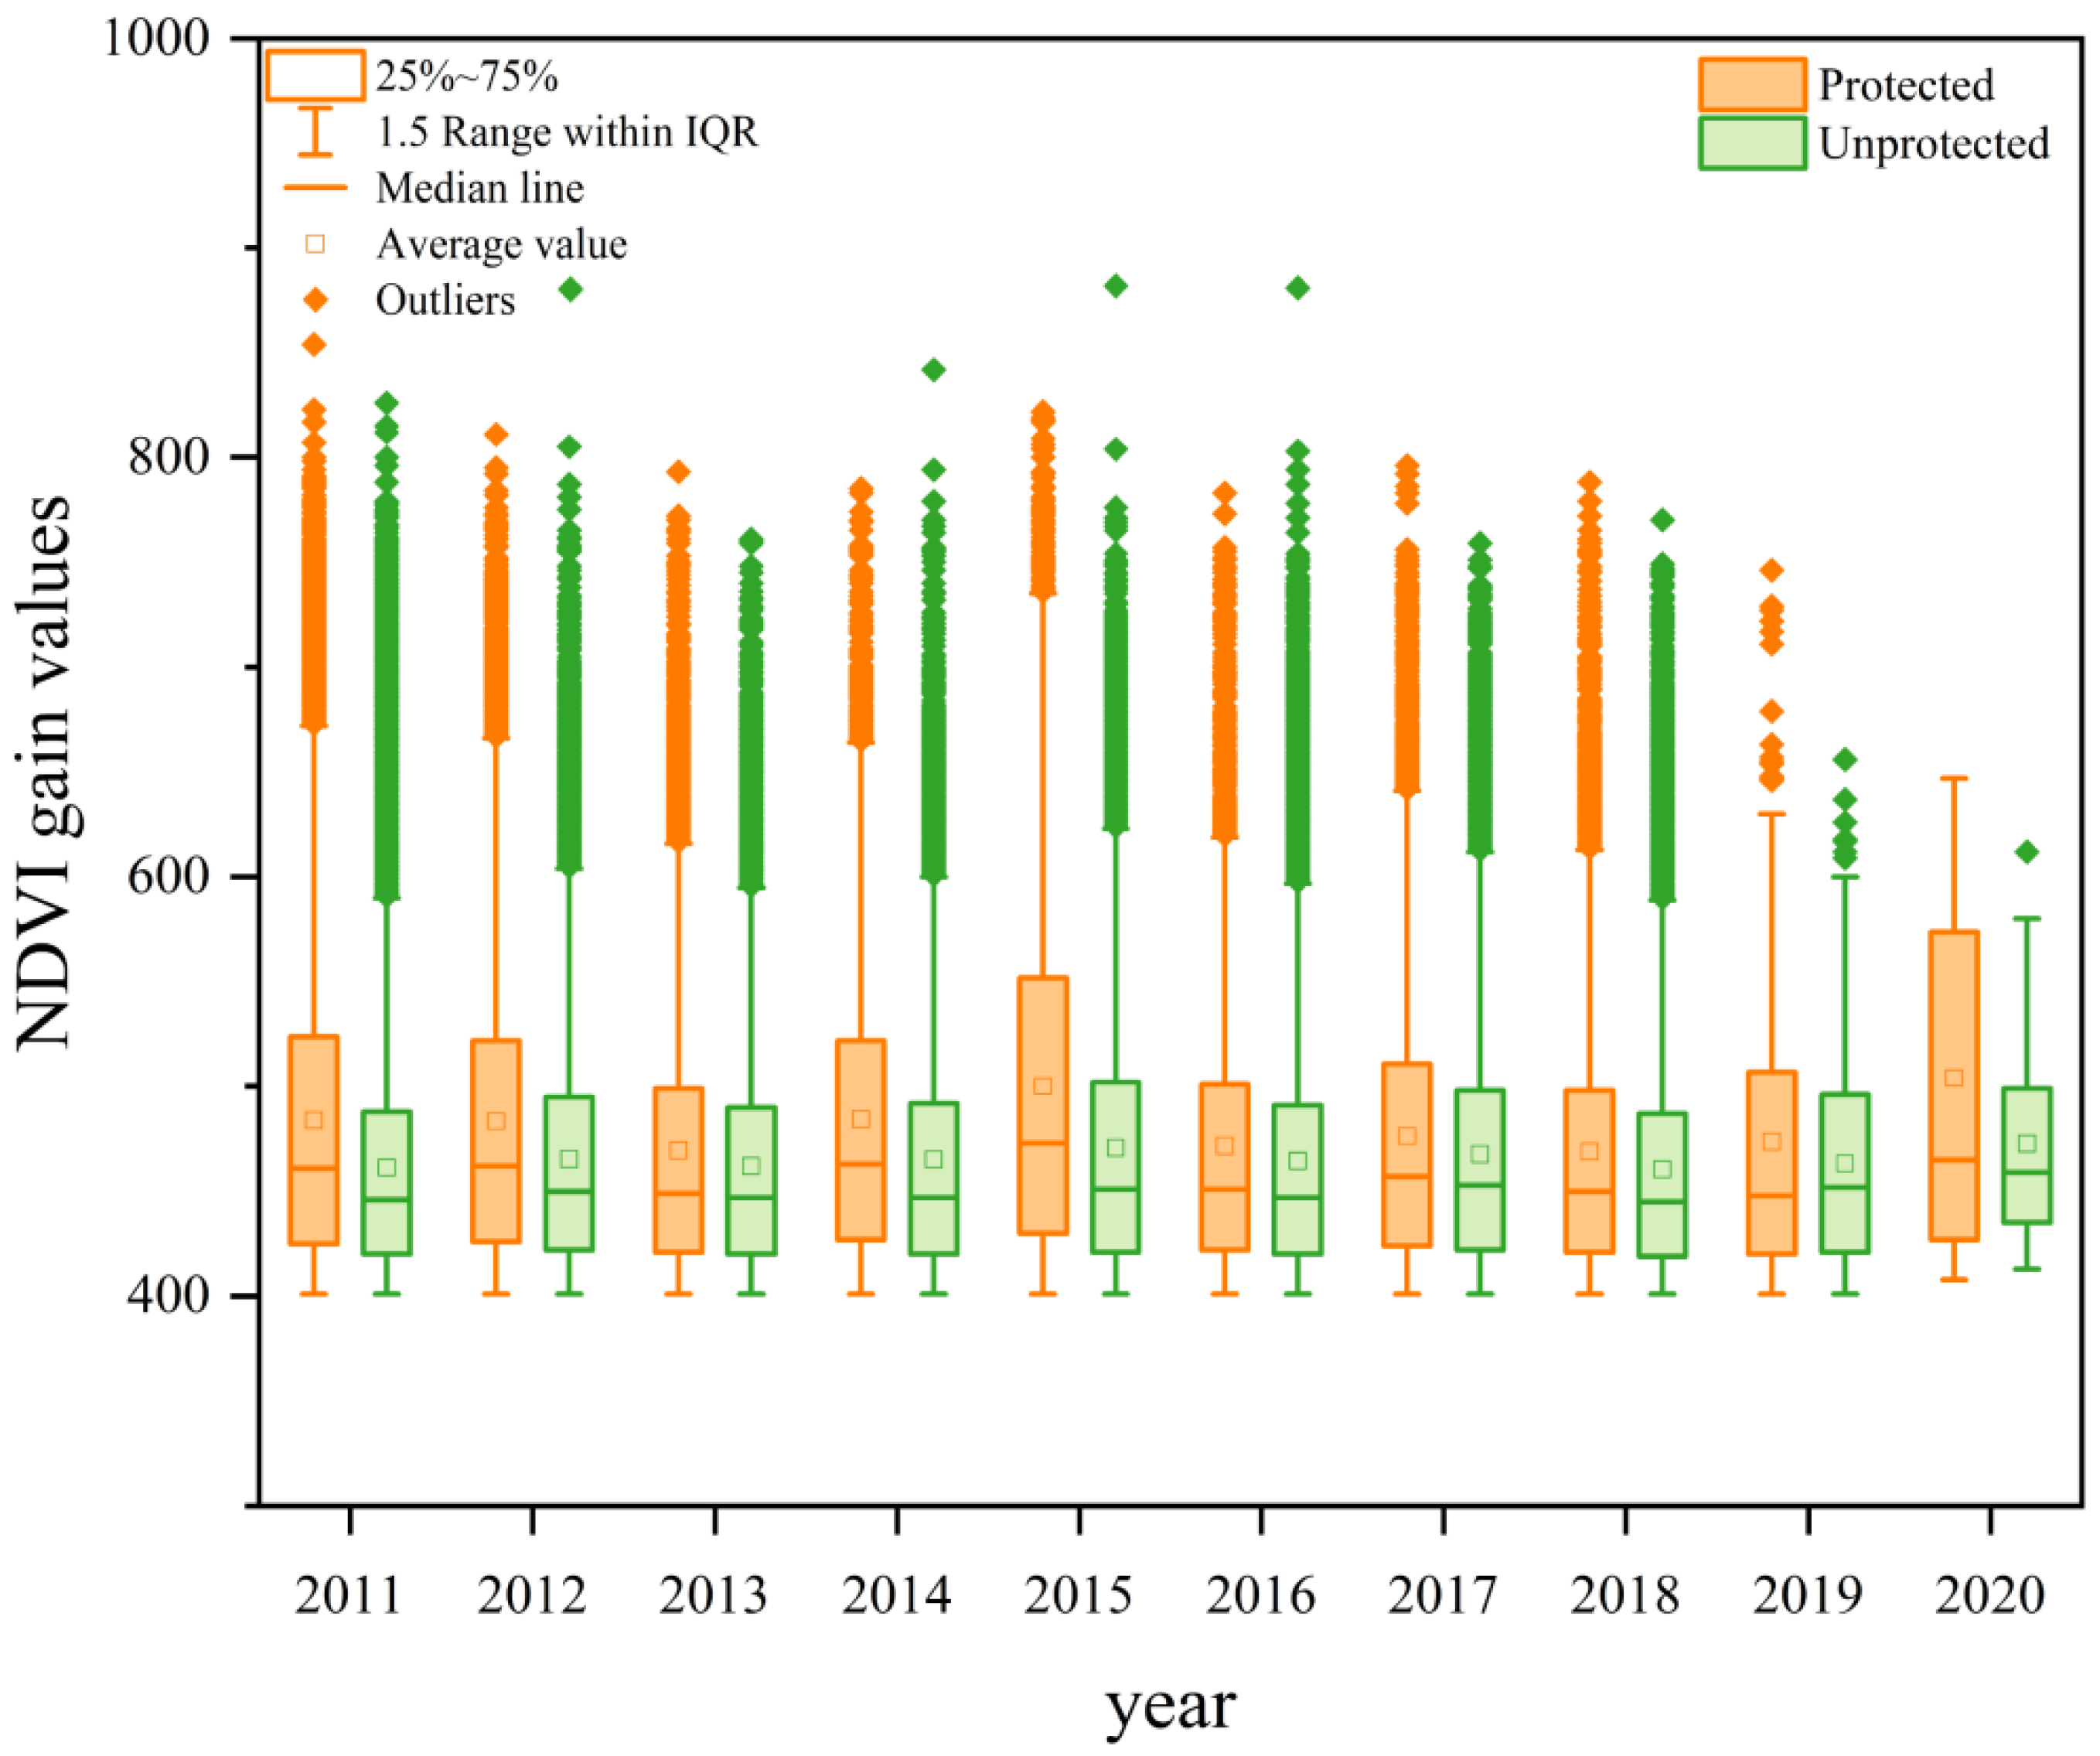
Figure 12.
Land cover volatility in protected and unprotected areas. Different shapes represent different protected areas. Different sizes represent the land cover intensity. Red and green indicate the NDVI loss and gain, respectively. The figure shows the process of how protected areas affect land cover volatility.
Publisher’s Note: MDPI stays neutral with regard to jurisdictional claims in published maps and institutional affiliations. |
© 2022 by the authors. Licensee MDPI, Basel, Switzerland. This article is an open access article distributed under the terms and conditions of the Creative Commons Attribution (CC BY) license (https://creativecommons.org/licenses/by/4.0/).
Share and Cite
MDPI and ACS Style
Wang, Y.; Rao, Y.; Zhu, H. Revealing the Impact of Protected Areas on Land Cover Volatility in China. Land 2022, 11, 1361. https://doi.org/10.3390/land11081361
AMA Style
Wang Y, Rao Y, Zhu H. Revealing the Impact of Protected Areas on Land Cover Volatility in China. Land. 2022; 11(8):1361. https://doi.org/10.3390/land11081361
Chicago/Turabian StyleWang, Yajuan, Yongheng Rao, and Hongbo Zhu. 2022. "Revealing the Impact of Protected Areas on Land Cover Volatility in China" Land 11, no. 8: 1361. https://doi.org/10.3390/land11081361
Note that from the first issue of 2016, this journal uses article numbers instead of page numbers. See further details here.