
Spatial Spillover Effects of “New Farmers” on Diffusion of Sustainable Agricultural Practices: Evidence from China

1
School of Geography and Ocean Science, Nanjing University, Nanjing 210023, China
2
School of Humanities and Law, Northeastern University, Shenyang 110819, China
*
Author to whom correspondence should be addressed.
Land 2024, 13(1), 119; https://doi.org/10.3390/land13010119
Submission received: 17 December 2023
/
Revised: 9 January 2024
/
Accepted: 18 January 2024
/
Published: 22 January 2024
(This article belongs to the Section Water, Energy, Land and Food (WELF) Nexus)
Abstract
:Sustainable agricultural development has been the policy priority for countries with limited natural resources. New farmers’ emergence and growth have not only helped to address the labor crisis in agriculture to some extent, but they have also improved, integrated, and expanded the agricultural sectors. However, less attention has been paid to the performance of new farmers in adopting sustainable agricultural practices and the related spatial effects. Also, few studies have combined the composite adoption intensity of sustainable agricultural practices with the effects of various specific measures. Therefore, this study constructed the Tobit MLE spatial cross-section regression models to empirically study a sample of 174 farmers. We attempted to analyze the impact of the new farmers group on the diffusion of sustainable agricultural practices as well as farmers’ influence on various sorts of sustainable agricultural practices. The results show that new farmers greatly enhanced the adoption of sustainable agricultural practices, as evidenced by the fact that their adoption level was 69.9% greater than that of traditional farmers. However, they had statistically significant negative spillover effects on their neighboring farmers. For the composite adoption intensity of sustainable agricultural practices, there were also statistically significant negative spillover effects. Additionally, there were notable disparities among the factors influencing farmers’ decisions to adopt various types of sustainable agricultural practices and the spatial effects of those adoptions, particularly in the farm size, the number of plots, and the variety of marketing methods employed by farmers. Therefore, measures need to be proposed to address the barriers to the implementation and diffusion of various types of sustainable agricultural practices. This would increase farmers’ willingness to adopt sustainable agricultural practices and the effectiveness of their motivation to neighboring farmers.
1. Introduction
There is considerable interest in shifting agricultural systems that guarantee food security to more sustainable modes in a period of rising tension between resource degradation and growing demand [1]. Sustainable agricultural practices (SAPs) are a set of techniques that contribute to the productivity and resilience of agricultural systems; such techniques include crop rotation, a combination of breeding and feeding, improving the soil, planting hedges/flower belts, using organic or farmyard manure, employing pest-proof nets, and so on [1,2]. Sustainable agriculture is a key task in the transformation of modern agriculture for countries with human–land tensions or low-potential agricultural areas [3,4]. Although adopting SAPs has been widely acknowledged by researchers as having both economic and environmental advantages, adoption rates are still low in developing nations [5,6,7]. Therefore, identifying the barriers to and motivators for farmers’ adoption of SAPs will have significant effects on agricultural transformation.
The literature on SAPs identifies the factors that influence farmers’ decision making [5,6,8] and the intensity of adoption [9,10], for example, the farmers’ sociodemographic characteristics, farms’ attributes [11], farmers’ attitudes and intentions [12,13], and government subsidies and tax incentives [1,2,14]. Additionally, an increasing number of researchers have focused on the spatial effects of farmers’ decisions. Wollni and Andersson [4] analyzed the decision-making traits of farmers in low-potential agricultural areas like the Honduran hillsides and found that farmers who adopted organic production techniques were spatially grouped. According to Zheng, Ma [15], the adoption of drought-tolerant wheat varieties in China was spatially dependent and farmers’ decisions were influenced by those of their neighbors as well as by farmers with whom they had close connections via smartphones or extension services. In an empirical study of New Zealand dairy farmers, Yang and Wang [16] found that the social interactions between neighboring farmers significantly contributed to SAP adoption. Exploring the spatial effects of SAPs is of great significance in guiding the agriculture transition.
Within the Chinese context, during the rapid transformation phase to modern agriculture, new urban–rural population migration trends have emerged, influenced by policies such as the popularity of rural e-commerce, the new professional farmer training program [17], the policy of supporting graduates in farming [18], and the “Three Villages Project”, which supports citizens, capable people, and enterprises to set up businesses in the countryside [19]. In addition to the existing rural–urban migration of farmers, many rural–urban, urban–rural, and rural–rural agricultural migrants have emerged in rural areas and suburbs of large cities [20,21]. Among them, cross-border entrepreneurial groups (e.g., citizens, graduates, returning farmers, etc.) who actively migrate from urban to rural areas and from nonagricultural to agricultural sectors are considered the “New Farmers” by researchers [21,22,23]. Similarly, farmers with little or no agricultural background, who are well educated and practice sustainable agriculture, have emerged on farmland in other countries [24,25]. These farmers have been described as new-generation farmers [26], beginning farmers [27], alternative farmers [28], etc., and most of them are different from the traditional farmers. Our study combines the views of different researchers and argues that “new farmers” have a comprehensive Internet and marketing mindset, hold the principle of sustainable development, master modern agricultural technology, are younger than traditional farmers, and have a higher level of education on average [22,29]. Although the definition of the new farmers and related statistical data standards have not yet been unified, the scale of the new farmers should not be underestimated, judging from the data of various types of people returning to their hometowns or entering the countryside to carry out innovation and entrepreneurship released by the Ministry of Agriculture and Rural Affairs of China; by the end of 2022, the cumulative amount has reached 12.2 million [30]. A rising number of studies have shown that the emergence and development of new farmers have contributed to the transformation of farmers’ structure and agriculture and brought new impetus to the development of sustainable agriculture [31]. Exploring the spatial effects of new farmers’ farming decisions is of great practical significance for the development of farmer training programs.
Taken together, most of the research related to SAPs focuses on certain sustainable agricultural technologies, such as the use of intercropping, organic fertilizers, and improved varieties, but rarely uses a comprehensive set of indicators of SAPs. Also, less attention has been paid to the possible spatial effects among SAPs of the “new farmer” group. To address these research gaps, we used field survey data to explore the question, “Do new farmers contribute to the diffusion of SAPs, and how?” It contributes to an understanding of the nexus between farmer transformation and the diffusion of agricultural technologies in the context of the promoting transition to sustainable agriculture. Under the dual pressures of agricultural labor shortages and natural resource constraints, this study helps to determine the direction of farmer cultivation and is of critical importance for China and other developing countries. Although various regions have diverse agricultural resource endowments and socio-economic contexts, our examination can inform and refer to the understanding of future agricultural development.
There are four main challenges we face in quantifying the spatial effects of SAPs. First, a comprehensive system of indicators for evaluating SAPs may be affected by the subjectivity of experts, leading to biased estimates. Second, farmers’ decisions on SAPs may be influenced by the neighboring farmers and characteristics of measures taken, such as the difficulties, costs, and benefits. Third, uncertainty in the distribution of new farmers may affect the sampling and lead to estimation bias. In addition, the portrayal of spatial dependence among farmers may be affected by missing neighbor samples due to sampling. To address these challenges, for a comprehensive evaluation index system of SAPs, we synthesized the relevant literature, as well as the opinions of experts and farmers. We investigated farmers’ strategies in six areas: nutrient cycling, pest control, disease control, weed management, diversification, and farm certification. We adopted two evaluation algorithms to capture farmers’ strategies in SAPs as comprehensively as possible. This could provide a more thorough understanding than other research that focuses on a single practice [8,9]. For the farmer samples, we sought help from the agricultural departments in each district and adopted snowball sampling to obtain as large samples of new farmers as possible and set up three sets of control variables in the model, namely, farmers’ characteristics, attitudes, and their farm business characteristics. For the spatial effects of farmers’ decisions, we estimated globally and locally generated spillovers of SAPs and used three spatial weight matrices to characterize spatial dependencies among farmers. Our spatial econometric model analyzed a sample of 174 farmers collected in June 2021 from the suburbs of Nanjing, China.
The next section theoretically constructs an analytical framework for exploring the spatial effects of adopting SAPs. Section 3 introduces the empirical research framework, including the model construction and descriptions of variables and data sources. Section 4 reports the empirical results. Section 5 provides discussions regarding the results in Section 4. Finally, conclusions, policy implications, and research agendas are summarized in Section 6.
2. Imitation across Space: Diffusion of Sustainable Agricultural Practices
As a composited farming strategy, a growing number of studies reveal the spatial effects of SAP adoption within and amongst neighborhoods [4,15,16]. The adoption of SAPs is influenced by three types of spatial effects: combined effect, spillover effect, and distance decay effect (see Figure 1).
The adoption of SAPs is a choice shared by nearby farmers, which illustrates the spatial dependence of farmers’ decisions [32]. This is due to the fact that farmers’ social networks play a role in their farming decisions [4]. Farmers who are geographically close can share information and knowledge, exchange beliefs and attitudes towards different practices, and transfer skills and experiences more easily [33]. These interactions between farmers may alter, preserve, or strengthen their preferences for implementing certain SAPs. Farmers could gain information on agricultural technology from nearby farmers by communicating, which is more quick and dependable and does not cost extra money [32], as the number of farmers within a community adopting SAPs (i.e., ‘new farmers’) increases. Farmers are more likely to change their decision preferences when they are aware of the advantages of sustainable agriculture through frequent communication [34]. Thus, farmers who adopt SAPs are probably geographically clustered.
Although SAPs could contribute to environmental improvement and agricultural productivity enhancement, preferences and decisions vary between farmers [35]. Altruistic farmers are willing to sacrifice their own utility in order to help others [4]. Thus, these farmers are more likely to be proactive in learning, emulating, and adopting SAPs after being influenced by neighboring farmers who have adopted SAPs [33]. Farmers who prefer to be egoistic are hesitant to adopt SAPs when they perceive that their neighbors will benefit from piggybacking on them and that they will benefit less [4]. It is not until the majority of farmers in the community have adopted SAPs that they are willing to do so. The efficiency of technology diffusion is also impacted by neighbors’ features. For instance, according to Läpple, Holloway [32], after being influenced by neighborhood effects, neighbors who ran larger farms or had obtained agricultural education were more likely to adopt SAPs. Thus, the spatial spillover effects of SAP adoption are uncertain.
The greater the distance between farmers, the less reciprocal impact there is on their decisions. The technology diffusion theory states that the spillover effects of agricultural technology are only locally effective [36]. Furthermore, Maertens and Barrett [37] asserted that social ties were comparatively higher between farmers in close proximity, even though the closeness of communication between farmers varies and they might not always communicate and learn from others. Ambali and Begho [33] found that smallholder farmers in Nigeria who were within the neighborhood threshold had comparable risk preferences. Therefore, it is necessary to take the distance decay effect of SAP adoption into account while setting the model.
3. Empirical Framework
3.1. Methodology
3.1.1. Model Specification
The socioeconomic factors that affect farming decisions at the individual, household, and regional levels [38], as well as the outcomes of interactions between farmers and the traits of nearby farmers, are likely to be spatially unique [39,40]. We thus concentrate on the spatial effects of farmers’ adoption of SAPs, especially the ‘new farmers’ group. The fundamental premise of this study is that nearby farmers will interact and exchange information on their perceptions and experiences with SAPs. There are two types of spatial effects that might occur when nearby farmers adopt SAPs: endogenous spatial effects and exogenous spatial effects. The former is related to interactions between neighboring farmers, while the latter is related to the characteristics of neighboring farmers. For instance, large-scale farms are more likely to spread the new technology directly to their neighbors [32]. Since the adoption of SAPs by farmers is random and there are farmers who do not adopt SAPs, the sustainability score exhibits the traits of merge data (is greater than or equal to 0) [41]. Thus, the sustainability score of farmers’ practices that we used as the dependent variable in the model is a continuous variable. We used the Tobit spatial cross-section regression model (the great likelihood estimation) to estimate global spillovers and localized spillovers. We compared the estimates with those from the general Tobit model as a nonspatial reference. The first model is the spatial Durbin model (SDM), which estimates global spillover effects. It takes the following formula, which nests the SLX model if .
where is a vector representing the farmer’s adoption of SAPs, and we consider two types of specifications, which will be described later. is a matrix of explanatory variables comprising three sets of covariates, and are vectors of parameters to be estimated, is a vector normally distributed error terms , is a scalar parameter indicating global spatial dependence, and is an n-dimensional identity matrix. is a spatial weight matrix. We consider three different specifications, which are described subsequently. The term implies that each farmer’s adoption decision varies with a weighted average of the remaining farmers’ decisions, i.e., it accounts for global spillover effects.
The second model is the spatial Durbin error model (SDEM), which estimates the local spillover effects. This model does not take endogenous interaction effects between the explanatory variables into account. It takes the following formula, which nests the SLX model if and nests the SEM model if .
3.1.2. Spatial Weight Matrix Specifications
The impact between farmers decreases as the distance between them increases [36]. The commonly used adjacency matrix makes a broader judgment about the proximity between farmers and its impractical assumption that the effects of neighboring farmers are equivalent. So, to reflect the spatial dependence and mutual influence between farmers with different distances, instead of using the neighboring spatial weight matrix (which is set according to whether the farmers were in the same district or in the district where the edges are shared), we used the inverse distance spatial weight matrix. We have set two additional treatments for the inverse distance weight matrix to better characterize the spatial dependence between farmers [42]. Firstly, we adapted the inverse distance weight matrix , in which is the inverse of the Euclidean distance between the farms run by farmer and farmer . Secondly, we set the inverse distance weight matrix based on the threshold of the distance between farmers. When the Euclidean distance is less than the threshold , we set , otherwise . We set the minimum distance between farmers (0.215 km) as the distance threshold that would allow all surveyed farmers to have at least one neighbor. This matrix assumes that farmer interactions are the same for those with a distance less than the threshold. In addition, for more densely distributed farmers, the impact of interactions on altering preferences or decisions is probably more noticeable [32]. The number of farmers surveyed in each district was determined based on the proportion of agricultural employees in each district in 2020. And the higher the proportion, the more farmers were surveyed. Accordingly, the spatial effect analysis of the survey data on farmers’ decision making may be affected by “the missing neighbor problem” [32]. That is, the very small number of neighbors of some farmers who have adopted SAPs may be related to the survey sampling instead of the actual situation. Therefore, we included an agricultural laborers intensity distance indicator to measure the average intensity of agricultural laborers in the area where farmer and farmer are located () while setting the spatial weighting matrix. The ‘agricultural laborers intensity matrix’ further sets the intensity of the spatial weights between farmer and farmer , who are regarded as neighbors in the matrix (), as the corresponding agricultural laborers intensity indicator value (). This matrix assumes that the interaction between farmers whose distances are less than a threshold equals the average intensity of agricultural laborers in the area where the farmers are located.
3.2. Dependent and Independent Variable
3.2.1. Dependent Variables
Farmers’ farming practices are characterized by diversity and complexity, and different behaviors may have different levels of impact on agricultural sustainability. Therefore, we combined relevant studies [16,33], experts’ advice, and farmers’ feedback [10] to collect farmers’ adoption of SAPs in six aspects: nutrient cycling, pest control, disease control, weed treatment, diversification, and farm certification. While evaluating the sustainability level of farmers’ farming strategies, we adopted expert scoring and counting methods to calculate the weights and obtained two sets of scores. Considering that the difficulty and ecological impact of various practices vary, we assigned scores to the various practices based on expert advice and applied the entropy weighting method to calculate the weights of each type of practices (the specific description and weight values of the indicator system are shown in Table 1), as well as the farmer’s score on the adoption of each type of SAPs and the composite sustainability score (recorded as score 1). Specifically, the scores for nutrient cycling, pest control, disease control, and weed treatment were mainly judged by whether the practice relied on external inputs, and the role of the practice in restoring the ecosystem’s material cycle and improving the ecosystem’s ability to self-regulate. For example, insecticides, pesticides, and herbicides are all external inputs and pose a threat to the ecosystem and physical health, so they are all assigned a value of 0. The scores for diversification are based on the combination of planting and breeding and the abundance of species. The combination of planting and raising helps the farm to recycle materials, while monoculture makes the ecosystem more fragile [11]. For the farm certification scores, we refer to the difficulty of obtaining different certifications to assign values, for example, organic product certification is relatively the most difficult and costly, so is assigned the highest value. In addition, there is a certain degree of subjectivity in the scoring of experts, and experts’ views on certain SAPs may differ from that of farmers. Therefore, we counted the number of types of various SAPs adopted by farmers and calculated the weights and scores of each type of SAPs and the composite sustainability score (recorded as score 2). In addition, we also set the dummy variable Sustainable to distinguish whether farmers have adopted SAPs or not (see Table 2).
3.2.2. Main Independent Variables
As newcomers to the agricultural sector, new farmers’ beliefs and competencies differ significantly from those of traditional farmers [10,43]. New farmers place a greater emphasis on a sustainable development perspective and tend to adopt technologies that integrate ecological principles and circular economy development principles into the farming process [22,44]. With reference to the existing literature and China’s previous household registration system, we grouped the sample of returning farmers (those with local farmer registration and more than six months of experience in nonagricultural work, such as migrant workers and retired soldiers), returning students (those with local farmer registration and more than six months experience in studying outside of the countryside), and citizens (those with urban registration) into the new farmers group, while local non-returning farmers and foreign farmers (farmers with household registration in other rural areas) were grouped into the traditional farmers group [10]. Accordingly, we used the dummy variable FType to distinguish new farmers from traditional farmers.
3.2.3. Covariates
As farmers’ decisions are also influenced by other factors, we included three sets of covariates in the model to lessen estimate bias caused by omitted variables (see Table 2).
The first set of variables characterizes farmer characteristics (FC). Farmers’ decisions have been demonstrated to be complicatedly impacted by intergenerational disparities among farmers and involvement in agricultural training. Although Zhang, Liu [45] found that the new generation of farmers had a relatively lower sense of responsibility for arable land conservation, Zhang, Zhou [46] found that the new generation of farmers could significantly promote the recycling of straw resources. We take the division approach for farmer generations in Chen, Yuan [47] as the reference and set the dummy variable GGap to distinguish older-generation farmers from newer-generation farmers, with birth in 1975 as the cut-off year. Regarding the impact of agricultural training, Jørs, Konradsen [48] demonstrated that agricultural technology training changed most farmers’ poor management practices of pests and diseases. Also, Damalas and Koutroubas [49] concluded that training could motivate farmers to use pesticides in a safe and correct manner. However, some farmers are not willing to participate in agricultural training because they believe some of the training is not sufficiently integrated with production practices and is not helpful [11,50]. We set the dummy variable Certificate to distinguish whether or not farmers were certified as professional farmers and used the continuous variable NTraining to describe farmers’ participation in agricultural production training. Farmers’ educational level is strongly related to their perceptions of SAPs [51] and farm management competencies [52]. Better-educated farmers are more likely to increase the adoption of SAPs because they have a relatively higher understanding of agricultural policies and acceptance of new technologies [53]. Therefore, we set the categorical variable ELevel to characterize the education level of farmers. In addition, there are gender differences in farmers’ decision making in most regions, influenced by social status. For instance, Zawedde, Harris [54] reported that male farmers were more inclined to adopt diversification production strategies than female farmers. Thus, we set the dummy variable Gender to differentiate the male and female.
The second set of variables characterizes farm business characteristics (FBC). It has been discovered that farm size and land fragmentation could impact the economic efficiency of farming strategies [55,56]. For example, the economic efficiency of large-scale production with machinery depends on the farm size and degree of land fragmentation [57]. Farmers can adopt rich agricultural practices if the plot fragmentation is large [58,59]. Therefore, we set the continuous variables lnFSize, FPlot, and NMarketing to characterize farm size, the number of plots, and the variety of marketing strategies for agricultural products, respectively. Furthermore, the majority of studies have stated that the decision of whether or not to hire farm laborers depends on the number of household agricultural laborers [60,61,62]. However, Tesfaye and Tirivayi [63] found that the impact of household size on crop diversity was negligible. Therefore, we set the continuous variable HAgrilabor to characterize household agricultural laborers and the dummy variable Employment to indicate whether a farm has employed supplementary laborers.
The third set of variables characterizes the farmer’s viewpoint (FV). Different types of farmers have different goals and objectives when it comes to farming [11]. And farmers’ perceptions and attitudes towards agriculture could directly influence their decisions. For example, Cakirli Akyüz and Theuvsen [12] found that increasing farmers’ positive intentions towards organic practices could help to achieve sustainable agricultural development. Therefore, we set the dummy variables FReason and FCha to characterize farmers’ reasons for farming and their viewpoint on future challenges, respectively.
3.3. Data Sources
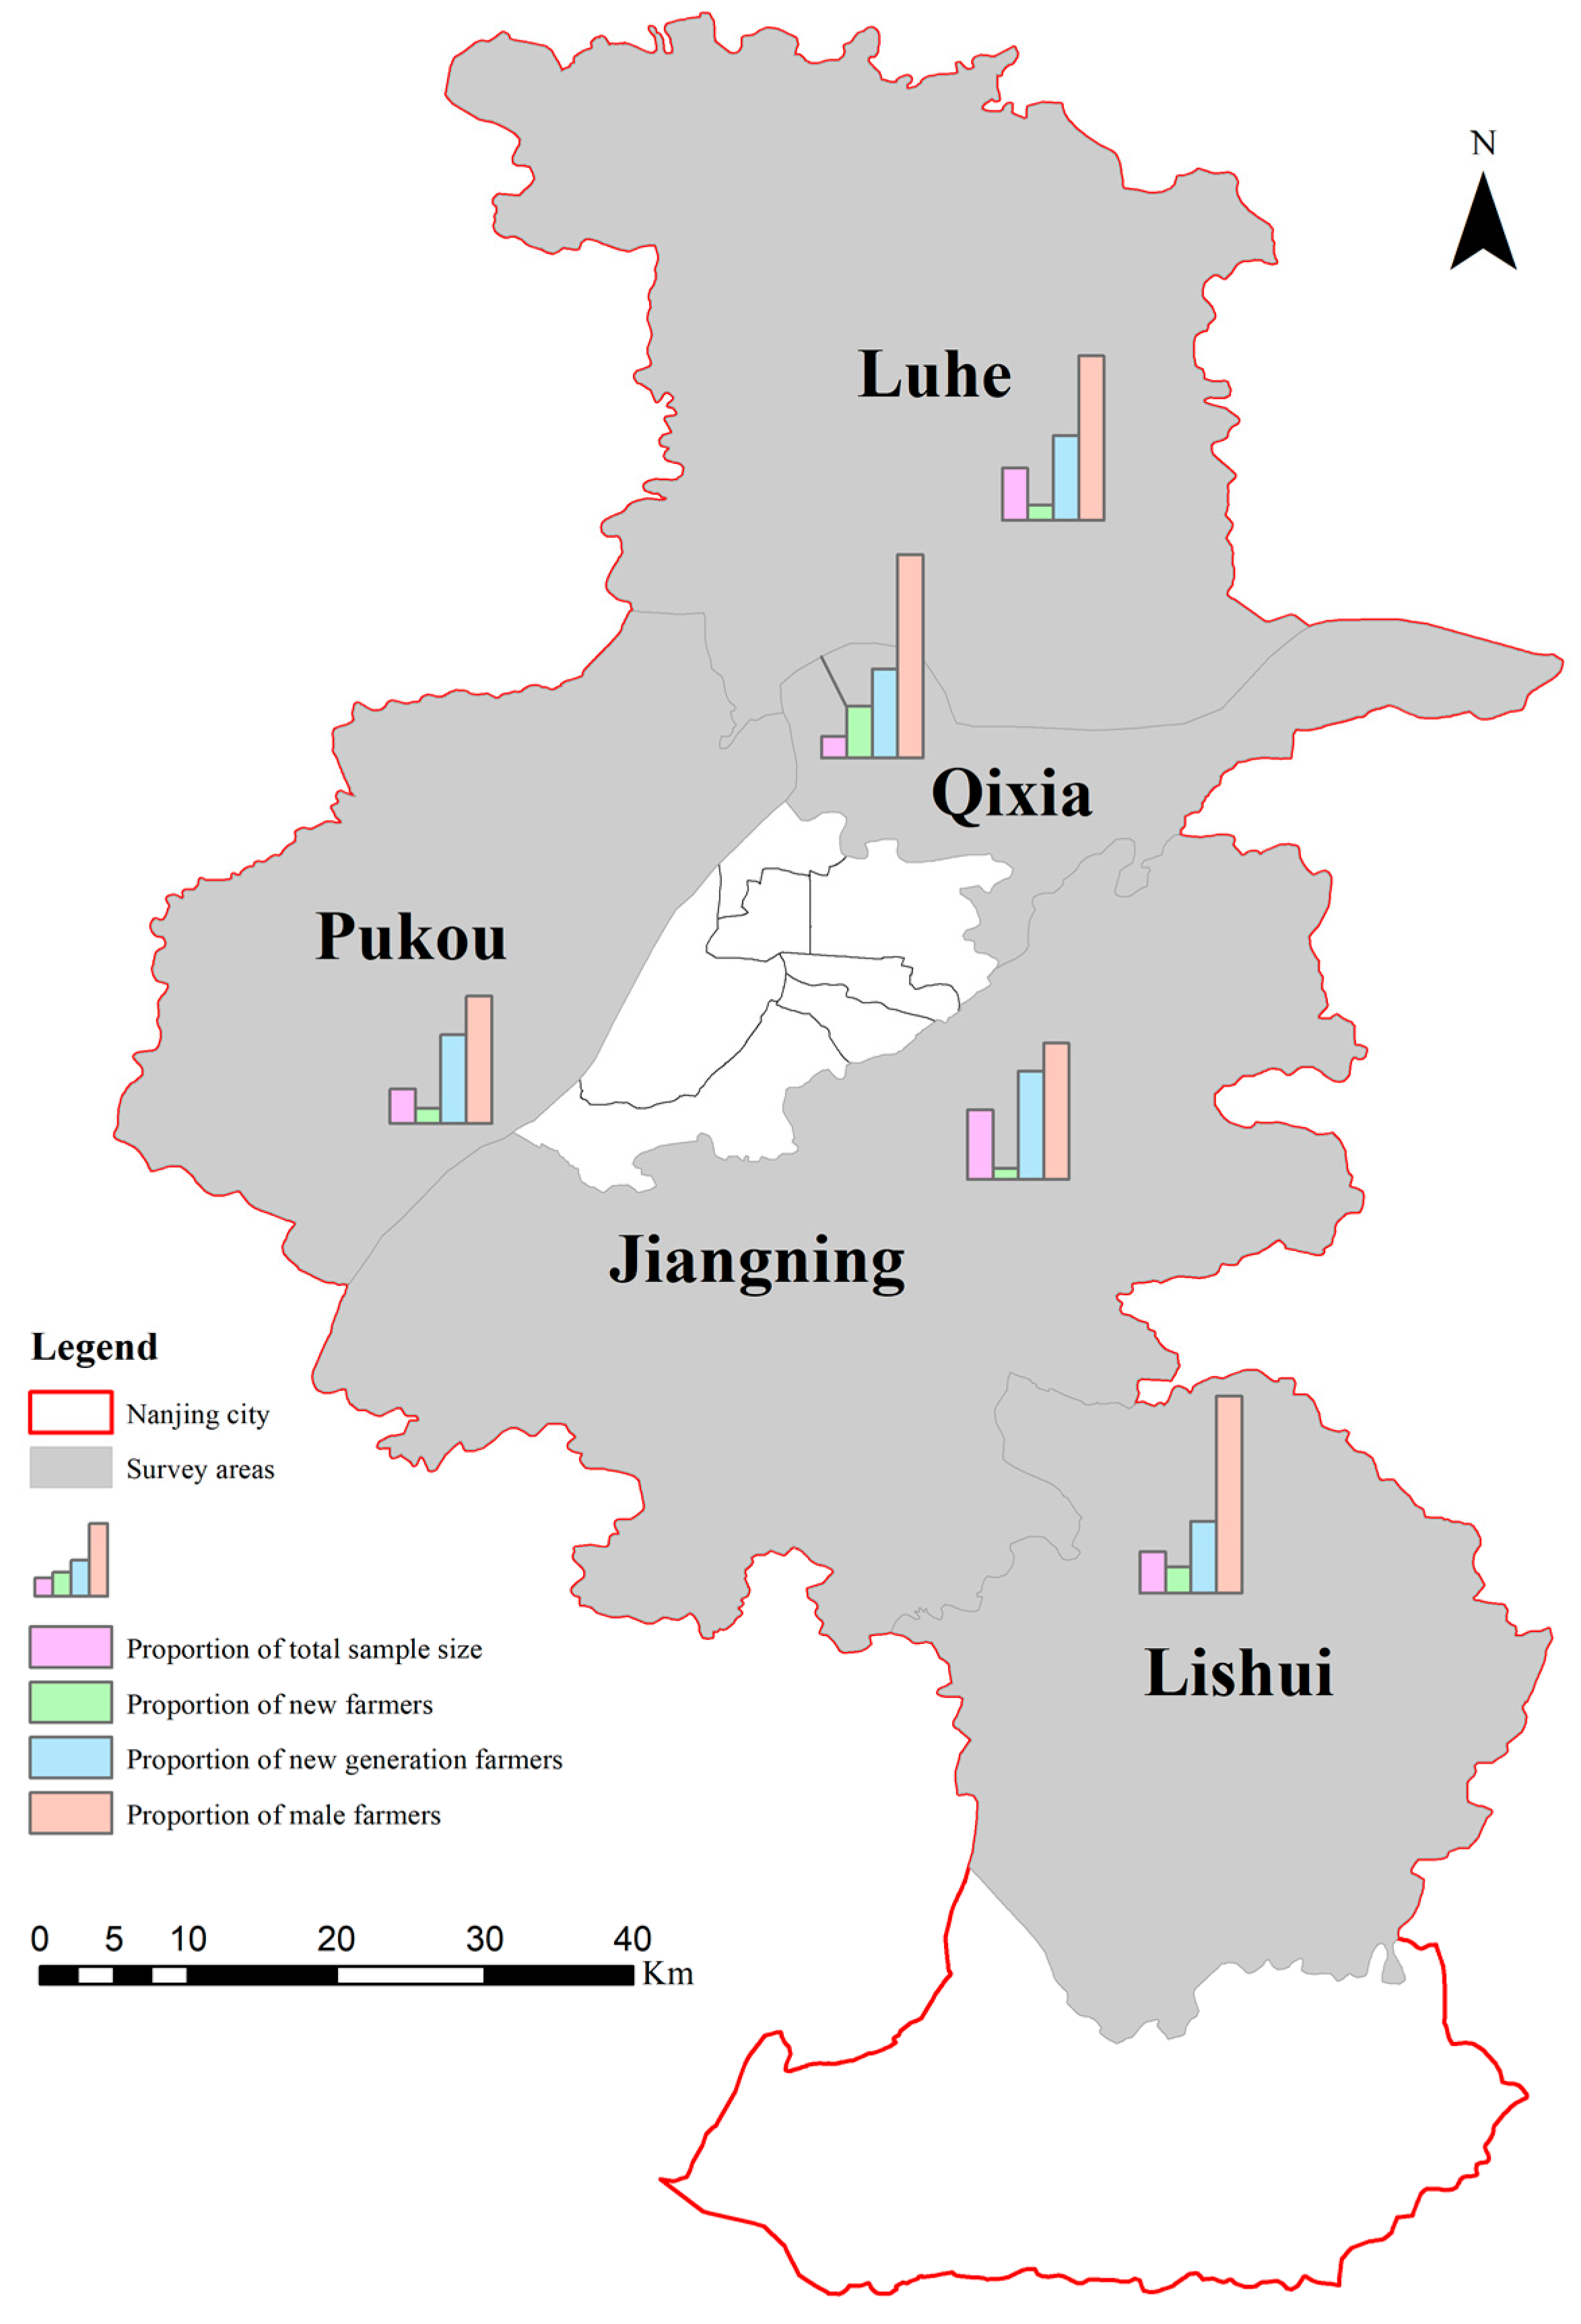
The empirical data used in this paper are derived from a survey conducted in June 2021 in the suburbs of Nanjing, China [10]. The case study of Nanjing is located in an important economic center in eastern China, where the local government has long placed priority on the growth of ecological agriculture1 [64,65]. And a survey indicated that the city’s high-quality land resources have attracted a large number of ‘new farmers’ to the agriculture sector [66]. Therefore, studying farmers’ transformation and sustainable agricultural development in Nanjing is of great reference significance and can provide instructive suggestions for agricultural development in other metropolitan areas. Specifically, we first identified the survey areas based on the current status of arable land in each district of Nanjing, including Luhe (41 samples), Pukou (27 samples), Qixia (17 samples), Jiangning (56 samples), and Lishui (33 samples) (see Figure 2). Further, we determined the expected sample size for the survey in each district with reference to the proportion of agricultural laborers in these five districts from the Nanjing Statistical Yearbook 2021 [67]. We conducted a field survey by using the snowball sampling methods and surveyed a total of 174 farmers. The survey focused on the characteristics of farmers in terms of adopting different SAPs.
4. Empirical Results
4.1. Estimated Results of the Spatial Dependence of Sustainable Agricultural Practices
In order to examine the spatial effects of new farmers on SAPs, we first tested the spatial dependence on whether farmers adopt SAPs, the composite adoption intensity of SAPs, and the adoption intensity of the specific six categories of SAPs. We compared the estimated effects of using various spatial weight matrices and different spatial models (see Table 3). For the majority of the SAP scores, the estimates of the global Moran’s I index or Geary’s C index were statistically significant, demonstrating a strong spatial dependence on SAPs adoption. Next, we employed the (robust) Lagrange multiplier (LM) test method to test for the existence of spatial lag dependence and spatial error dependence in the OLS models [68]. Most of the variables defining the SAP scores were significant for the spatial lag (robust) LM test, while the variable PCS2 was significant for the spatial error (robust) LM test. The results of the (robust) LM test for both the spatial lag and spatial error for the variables DCS1 and CPS2 were statistically significant, whereas the results of the (robust) LM test for the variables Sustainable, DCS2, and DFS2 were not. This indicates that adoption of SAPs has a spatial effect and it is necessary to differentiate farmers’ performance in various types of SAPs adoption.
4.2. Results of the Spatial Effects of Sustainable Agricultural Practices
We introduced three spatial weight matrices (, , ) set into the Tobit MLE spatial cross-section regression spatial regression models (SLM, SEM, SDM, and SDEM) to measure the composite adoption intensity of SAPs and the spatial effects of the specific six categories of SAPs adoption intensity, respectively. After testing, we found that the majority of the models using and passed the LR test, while none of the spatial effects measured by the inverse distance-weighted neighborhood matrix did. This may be due to the fact that the inverse distance weights contain complex spatial interaction effects, and the estimation of spatial dependence between farmers at different distances is not well fitted. Using the matrices with threshold distances and agricultural laborers’ intensity had relatively better fitting results. Thus, we do not display and analyze the estimations of .
4.2.1. Adoption of Composited Sustainable Agricultural Practices
For the spatial effects of SAPs’ composite adoption scores (variables CSS1 and CSS2), the Tobit MLE SDM and the Tobit SDEM performed better. According to Table 4, the majority of explanatory variables, their lagged terms, as well as the spatially lagged dependent variable Rho in the global Tobit MLE SDM model and the spatial lagged error term Lambda in the local Tobit MLE SDEM model, were all statistically significant. Also, all of these models passed the LR test. Comparing the reported goodness of fit values (R2) and log-likelihood values of the models in Table 4, it is clear that the spatial econometric models all fit better than the general Tobit model. This indicates that the composite adoption intensity of SAPs was spatially dependent and was influenced by the farmers themselves, their neighbors’ characteristics, and the degree of their neighbors’ adoption of SPAs. That is, it is necessary to take into account the spatial effects of neighbors when analyzing the characteristics of farmers’ decisions, otherwise, the accuracy of the estimates will be affected. The spatial and explanatory variables’ effects measured by spatial weight matrices and for the same composite SAP score were similar, but the model using fit slightly better than the model using . This confirms the robustness of the estimation. It also demonstrates that considering the number of regional agricultural laborers when setting the spatial weight matrix for the survey sample could mitigate the effect of missing neighbors to some extent. This is consistent with the finding of LeSage and Pace [69] who suggested that fine-tuning the spatial weight matrix has little impact on the estimation and judgment of the spatial econometric model. Furthermore, the results in Table 4 clearly show that spatial spillover is a global process in which both endogenous and exogenous spatial effects are important, and this is consistent with the analysis in our model specification section. As the global Tobit MLE SDM model fits slightly better than the local Tobit MLE SDEM model, we focus on the estimation results of the SDM model.
As shown in the estimated coefficients of the spatially lagged dependent variable Rho, there was a significant negative spatial spillover effect on the composite adoption degree of SAPs among neighboring farmers (the coefficient corresponding to the variable CSS1 was −0.021 and the variable CSS2 was −0.024). This indicates that the SAPs had not been widely adopted. According to the estimated coefficients of the explanatory variables and their lagged terms, both farmers’ characteristics as new farmers and possessing the new professional certificate had a significant positive effect on increasing their composite adoption degree of SAPs. However, there was a significant adverse impact from the neighboring new farmers and farmers with a new professional certificate. The education level, the variety of marketing strategies, and the employment of farm workers among the farmer’s own and neighboring farmers’ characteristics all significantly increased the composite adoption degree of SAPs. The adoption of SAPs significantly decreased as a result of both male farmers and farmers who believe that technology issues will affect their farms in the future. In addition, the traits of the new-generation farmers themselves and the neighboring farms’ size also had a significant negative impact on the composite adoption level of SAPs.
Since the Tobit MLE SDM contains spatially lagged terms, the coefficient estimates cannot be directly used to demonstrate how changes in the explanatory variables and their lagged terms have influenced the composite adoption level of SAPs. Therefore, we divided the total marginal effect into direct marginal effect and indirect marginal effect by using the partial differential approach [70]. Considering the slight differences among the estimated spatial effects corresponding to the two composited SAPs scores, we divided these spatial effects separately on the basis of the Tobit MLE SDM and the spatial weight matrix .
According to the decomposition of the explanatory variables’ marginal effects (see Table 5), the SAP adoption degree of farmers themselves was significantly and positively influenced by new farmers, farmers who employed on-farm workers, farmers with new professional farmer certificates, farmers who adopted a variety of marketing strategies, and farmers’ education level. These factors had significant negative spatial spillover effects on neighboring farmers and their overall effects were decreasing. In addition, the degree to which farmers themselves adopt SAPs was significantly and negatively impacted by the new generation of farmers, male farmers, and farmers who perceived that technology would be the main source of future challenges. Overall, new farmers tended to prioritize SAPs. Those who were better educated and had more experience and knowledge of farming practices were more likely to adopt SAPs, though they had very little advantage over nearby farmers. However, farmers who were concerned about the future farming technology, male farmers, and young farmers had a positive influence on their neighbors, although they did not adopt SAPs to a greater extent.
4.2.2. Adoption of Specific Sustainable Agricultural Practices
We found that the adoption of four types of SAPs (weed control, diversity, insect management, and nutrient cycling) had noticeable diverse regional effects. The impacts of various factors on the adoption of various SAPs also differed greatly. Table 6 reports the results of the decomposition of the spatial effects, including the spatial effects of the weed treatment practice scores (WTS1), diversified seeding practice scores (DFS1), and pest control practice scores (PCS2), obtained with the Tobit MLE SLM and the spatial weight matrix , and the spatial effects of the nutrient cycling practice scores (NCS1) obtained with the Tobit MLE SDM.
For weed treatment practices, the estimated coefficient of the spatially lagged dependent variable Rho was 0.002, that is, there were significant positive spatial spillover effects amongst neighboring farmers. The degree of marketing diversification, farm size, and new farmers had significant positive effects on the weed treatment practices adoption extent among farmers themselves. The total effect of these factors increased in order and all had significant positive spatial spillovers to neighboring farmers. However, employing workers on the farm had a significant negative effect on the weed treatment practices adoption extent among farmers themselves as well as a significant negative spatial spillover effect on neighboring farmers.
For diversified farming practices, the estimated coefficient of the variable Rho was −0.003, indicating a strong negative spatial spillover impact between nearby farmers. The total significant positive effects of farm size, farmers’ confidence in the prospects of local agriculture, and the degree of marketing diversification on the diversification practices adoption extent of farmers themselves were in ascending order. But these factors all had significant negative spatial spillover effects on neighboring farmers. In addition, the new-generation farmers had a weak positive spatial spillover effect on neighboring farmers but a significant negative effect on the adoption degree of diversification practices.
For pest control practices, the estimated coefficient of the Rho was 0.003, indicating that there was a significant positive spatial spillover effect amongst neighboring farmers. The variety of marketing strategies and the number of farm plots both had a significant positive effect on the pest control practices adoption extent among farmers themselves. Both factors significantly improved the spatial spillover effect on nearby farmers, and their total effects grew in sequence. However, obtaining the new professional farmer certificate had a significant negative effect on both farmers’ own and neighboring farmers’ adoption of pest control practices.
For nutrient cycling practices, the estimated coefficient of the variable Rho was −0.016, suggesting a significant negative spatial spillover effect between nearby farmers. The total significant negative effects of farm size, the number of household agricultural laborers, and new-generation farmers on the nutrient cycling practices adoption extent of farmers themselves were in increasing order. But all had significant positive spatial spillover effects on neighboring farmers. The number of farm plots had a significant positive effect on both farmers’ own and neighboring farmers’ adoption of nutrient cycling practices. In addition, both neighboring new-generation farmers and the farm size of neighboring farmers had a significant negative effect on the nutrient cycling practices adoption extent among farmers themselves. Neighboring farmers’ educational level, the diversity of their marketing practices, whether they employed farm workers, and whether they had confidence in the agricultural future all had a significant positive effect on the nutrient cycling practices adoption extent among farmers themselves. Due to variations in farmers’ individual traits, perceptions, and farm conditions, the spatial effects of farmers’ adoption of various types of sustainable agricultural practices vary considerably.
5. Discussions
5.1. Spillover Effects of ‘New Farmers’ on Sustainable Agricultural Practices Diffusion
There are large differences in the adoption extent of SAPs between new farmers and traditional farmers. The average adoption degree of SAPs by new farmers is higher than that of traditional farmers (see Table 2), and new farmers have a significant positive impact on increasing the composite adoption extent of SAPs by farmers (see the significantly positive direct and total effects of the Ftype variable in Table 5). However, the estimated coefficient of the lagged term wx-Ftype in Table 4 and the indirect effect corresponding to the variable Ftype in Table 5 both demonstrate that the new farmers had a significant negative spatial spillover effect on their neighboring farmers. This suggests that the new farmers have a weak negative shock to the adoption degree of SAPs by neighboring farmers. This suggests that the neighborhood effect among farmers may exacerbate decision differences rather than necessarily causing a convergence of decisions. This may be due to the fact that farmers’ decisions regarding SAPs are influenced by a combination of their own and neighboring farmers’ traits as well as neighboring farmers’ decisions.
The new farmers group holds a positive attitude toward the adoption of SAPs due to their considerably higher level of education and specialization traits. As shown in Table 4, the education level, the variety of marketing strategies, as well as farmers with new professional farmer certificates, and farmers who employed workers on their farms all enhanced the adoption of SAPs, and there is a significant upward trend in effectiveness. The subsample statistics in Table 2 clearly reflect the differences in competencies and business practices between new farmers and traditional farmers. Compared to traditional farmers, new farmers were generally more educated (average years of education was 14.688), had a greater diversity of marketing strategies (average number of agricultural marketing practices was 4), had a higher proportion who were certified as new professional farmers (18.8%), and had a greater proportion who employed farm workers (93.8%). New farmers who switch from other sectors to agriculture have greater advantages in terms of accessing policy support, comprehending sustainable development concepts, mastering new production technologies, innovating business models, and expanding marketing channels [11,23,44]. They are more eager to test out innovative sustainable agricultural development models and are more likely to adopt specialized business strategies [43]. As a result, they are less likely to adopt unsafe farming practices [48,51] and overall have a more positive attitude toward the correct application of SAPs. The adoption of SAPs in this group is comparable to the traits of the new farmers group in our survey sample, with higher scores for the level of marketing diversification and higher adoption of SAPs.
The diffusion of SAPs among farmers is hampered by the closeness of farmers’ connections and the difficulty of SAPs. As shown in Table 5, farmers with the above-mentioned positive traits all had negative spatial spillover effects on neighboring farmers’ adoption of SAPs. Among them, the new farmers group had the largest negative spatial spillover effect on their neighboring farmers. Additionally, the adoption of SAPs was significantly negatively impacted by neighboring male farmers, neighboring farmers who perceived that their farms would face technological challenges in the future, and the size of neighboring farms (see Table 4). This result is different from the positive impacts of neighborhood effects found in some studies that can promote communication, learning, and imitation among farmers, as well as raise farmers’ willingness to adopt SAPs [4,15]. On the one hand, it may be due to the fact that geographically neighboring farmers are not necessarily more connected to each other. As a cross-border entrepreneurial and outsider group, new farmers may have difficulty integrating into the local community [71], which limits mutual communication and learning between new farmers and their neighbors. Also, since SAPs improve the quality of agricultural outputs and the environment [6], with the rising demand for healthy food, producing high-quality agricultural products could assist farmers in capturing a larger share of the market for mid- to high-end products, which in turn could lead to higher economic returns [7]. Thus, farmers who prefer egoism may not be closely allied with their neighbors, due to their unwillingness to let their neighbors piggyback or compete on the market for mid- to high-end products [4]. On the other hand, SAPs are more challenging to adopt and have a longer payoff period and high economic benefit uncertainty [16]. For farmers who adopt SAPs, especially new farmers, the farming experience is not always easy, and the economic returns might not be great. Due to the ‘neighborhood effects’, these farmers’ neighbors can be well informed about the advantages and disadvantages of SAPs. Farmers’ decisions are mostly based on rational judgments about their personal circumstances, including whether their families could afford higher economic and labor inputs, unpredictable risks, longer reward cycles, and faith in competitively favorable prices. Therefore, neighboring farmers may prefer to remain conservative rather than adopt SAPs. As Xie, Tian [72] found, communication with nearby villagers could raise farmers’ acceptance of ecological farming, but it does not significantly boost their willingness to adopt it.
Overall, the new farmers group did significantly contribute to the adoption extent of SAPs, but it only had a small demonstrative impact on neighboring farmers’ adoption of these practices. The promotion of sustainable agriculture by the new farmers has not been sufficiently successful in the area, and it is necessary to think more carefully about how to strengthen their catalytic function.
5.2. Heterogeneity in Diffusion of Different Sustainable Agricultural Practices
There were significantly different spatial effects when farmers adopted various types of SAPs. As shown in Table 6, there were significant positive spatial spillover effects on neighboring farmers for both weed treatment and pest control practices and negative spatial spillover effects on nearby farmers for both diversification and nutrient cycling practices, all with a significance level of 10%. Farmers who adopted disease management and farm certification practices had no discernible spatial effects. In addition, there was considerable variation in the impact of the farm size, the number of plots, and the variety of marketing practices on the extent of various types of SAP adoption by neighboring farmers. Specifically, diversification of marketing practices had a significant positive effect on increasing the neighboring farmers’ adoption of weed treatment and pest control practices, but it had a significant negative effect on the neighboring farmers’ adoption of diversified farming practices. The farm size had a significant positive impact on increasing the neighboring farmers’ adoption of weed treatment and nutrient cycling practices, and a significant negative impact on the neighboring farmers’ adoption of diversification practices. Whilst the number of farm plots had a significant negative effect on neighboring farmers’ adoption of nutrient cycling practices, it had a significant positive effect on promoting the adoption of pest control practices by neighboring farmers. These may be related to the challenges of implementing SAPs, farmers’ perceptions of comparative efficiency, and relevant policy prescriptions.
As for the weed treatment and pest control practices, the majority of the practices mentioned in Table 1 with a rating of 1 or 3 are typical, fundamental farming practices that could have a direct impact on agricultural product yield and compliance with market demand and food safety standards, for example, manual/mechanical weeding, manual/mechanical pest trapping, the use of yellow/blue boards, planting of tree hedges/flower strips, etc. Therefore, rational farmers are highly motivated to adopt weed treatment and pest control practices. According to Table 3, the results of Moran’s I (global) index for these two types of corresponding practices show that farmers who adopted weed treatment and pest control practices were spatially characterized by a substantial positive correlation of clustering. This indicates that neighboring farmers are willing to share their experiences in weed treatment and pest control, which could have positive effects for both.
As for the diversification and nutrient cycling practices, farmers’ decisions are influenced by farm size and the extent of farmers’ dependence on agriculture [11]. As shown in Table 6, the larger the farm size and the higher diversification of marketing practices, the greater the likelihood of farming diversification increase, while with smaller farm size and less household agricultural labor force, the greater the likelihood that farmers will increase the adoption extent of nutrient cycling practices. However, the standard deviations of the three variables in our sample—the number of household agricultural laborers, the farm size, and the variety of marketing practices—were all relatively high, at 0.796, 1.414, and 1.581, respectively. The majority of farmers did adopt these two types of practices. However, the adoption extent of these two types of practices varied greatly, with the largest difference in scores exceeding 2. This suggests that farmers’ motivations for implementing diversity and nutrient cycling vary greatly. Farmers’ decisions are further complicated by the fact that the more prominent long-term economic and environmental benefits of the diversification and nutrient cycling categories are relative to the short-term ones. As illustrated by Wollni and Andersson [4], farmers are more likely to adopt these SAPs when they perceive it would benefit them more in the process of benefiting others. However, farmers with this mindset are few. Overall, farmers are reluctant to share their experiences with their neighbors due to their diverse attitudes regarding varied farming and nutrient cycling practices as well as their unwillingness to let neighboring farmers piggyback on them.
As for the disease control and farm certification practices, most of the practices mentioned in Table 1 are difficult to implement and require additional financial investments, as well as being viewed as unnecessary by most farmers [10]. These would be practices such as enhancing the soil, cultivating disease-resistant varieties, and applying for organic certification. Farmers’ willingness to adopt these two types of practices was extremely low, with only 18.966% of the survey farmers adopting disease control measures and 16.667% having certification. Moreover, there are no discernible clustering characteristics among farmers who have implemented these two types of practices. In other words, farmers’ willingness to adopt disease management and farm certification practices is directly impacted by the difficulty and high expense of doing so, as well as the likelihood that they will discuss them with nearby farmers.
In terms of specific farming strategies, most countries have issued clear regulations on the application standards of some chemical fertilizers, pesticides, and herbicides and, at the same time, encourage farmers to use fewer chemical fertilizers, apply organic/green fertilizers, use bio-agents, release natural enemies, and take measures such as combining breeding and feeding. However, most traditional farmers’ farming strategies maximize their benefits by setting the national standards as the bottom line. Their willingness to adopt state-encouraged, more costly, and difficult measures is unclear. This reminds us that we should not generalize when looking at issues relating to SAPs. We need a combination of comprehensive and specific analyses to draw reliable conclusions.
6. Conclusions
For China, where the human–land conflict is prominent, policy attention has been focused on how to achieve sustainable development. Sustainable agriculture is a development strategy that promotes the coevolution of social, economic, and environmental advantages [3]. The emergence and development of new farmers has not only addressed the labor crisis in agriculture but also advanced the development, integration, and modernization of the agricultural industry [10,44]. Few studies have coupled the spatial effects of the composite adoption degree of sustainable agricultural practices with the implementation of various individual activities. And less focus has been placed on how well new farmers perform in adopting sustainable agricultural practices. This study conducted an empirical analysis of a sample of 174 farmers to summarize the impact of new farmers on the adoption of sustainable agricultural practices and the heterogeneous characteristics of various sustainable agricultural practices’ diffusion that help to narrow the research gap.
The results of this study demonstrate that the relatively higher levels of education and specialization of the new farmers group have a significant positive impact on enhancing the composite adoption level of sustainable agricultural practice, which was significantly higher than that of traditional farmers by 69.9%. Additionally, the neighborhood effect of farmers did not significantly contribute to the diffusion of sustainable agricultural practices. There was a significant negative spatial spillover effect between new farmers and their neighboring farmers in terms of the composite adoption level of sustainable agricultural practice. This may be due to the fact that the new farmers, as a group of outsiders, have not established close bonds with their neighboring farmers or that the new farmers may alienate their neighboring farmers for the motive of capturing the market for mid-to-high-end products, which results in fewer opportunities for mutual communication and learning between the new farmers and their neighboring farmers. Meanwhile, the neighboring farmers may choose more conservative practices out of their own rational judgment. Because of these, the new farmers group has a considerable negative spatial spillover effect on their neighboring farmers. In addition, there were notable disparities in the spatial effects of various types of sustainable agricultural practices adoption. Specifically, there were significant positive spatial spillovers from the weed treatment and pest control practices adoption and negative spatial spillovers from the diversification and nutrient recycling practices adoption. This may be related to the complexity of putting these techniques into practice, farmers’ perceptions of the comparative benefits, and the rigor of pertinent governmental rules. Moreover, there were significant differences in the factors that influenced farmers’ decisions to adopt various types of sustainable agricultural practices, particularly the farm size, the number of plots, and the variety of marketing practices.
Despite the increasing focus on sustainable development, it is important to note that sustainable agricultural practices are still not widely adopted in the majority of nations and regions, and the composite adoption content of sustainable agricultural practices by traditional farmers is not very high [73]. New farmers have brought new impetus to the agricultural modernization transformation [22] and have had a significant positive impact on increasing the composite adoption level of sustainable agricultural practices. However, we need to recognize that new farmers have not generated a strong driving effect on neighboring farmers in terms of increasing the composite adoption level of sustainable agricultural practices and have only contributed to the proliferation of sustainable weed treatment and pest control practices. To this end, referring to our findings, it can be said that governments could continue to enhance both the adoption of sustainable agricultural practices by new farmers and the effectiveness of new farmers’ incentives, as well as address the obstacles to the implementation and spread of various sustainable agricultural practices. For instance, the construction of regional or national farmers’ online communication platforms and the regular organization of farmers’ learning and sharing activities will promote interaction among farmers, thereby improving the mutual driving effect among farmers, which may also attract more new farmers to cross-border entrepreneurship. Enhancing the development of online agricultural trading platforms and delivery systems, providing traditional farmers with targeted marketing programs for agricultural products, and providing subsidies for agricultural certification will improve the benefits of sustainable agriculture and thus increase the willingness of farmers to adopt sustainable agricultural practices.
In addition, this study provides referable research methods and ideas for exploring the spatial impacts of sustainable agricultural practices and farmers’ strategies. When exploring the topics related to sustainable agricultural practices, it is important to take into account the diversity of such practices and the complexity of their implementation. We should count as many farming strategies adopted by farmers as possible to make comparative analyses from the perspective of synthesis and decomposition. When analyzing farmers’ decision making, endogenous and exogenous effects should be considered, and marginal effects should be decomposed into direct, indirect, and total effects, which helps us to understand deeply the factors influencing decision making and the impacts of relevant decisions, as well as to improve the pertinence of relevant policies. And when constructing the spatial weight matrix that portrays the connection between neighboring farmers, solving the problem of missing neighbors existing in the survey sample helps to achieve more robust results.
We also acknowledge that there are limitations to this study. Despite adopting two algorithms for evaluating the adoption extent of sustainable agricultural practices, there may still remain subjective perception bias. Social relationships among farmers are more complicated in an environment where the Internet is common. Although we used three different methods to characterize the connections between farmers, there is still insufficient information on whether and to what extent farmers communicate with each other. In addition, our findings are based on cross-sectional data from surveyed farmers in Nanjing, which could not represent the whole country. And it is also difficult to broaden into a time-series panel analysis and explore the influence of pioneers on farmers’ decisions. To this end, subsequent studies could further explore and improve the indicator system for evaluating farmers’ adoption of sustainable agricultural practices by expanding the survey sample. It is possible to portray the strength of social connections among farmers by counting the number and frequency of online and offline interactions between the surveyed farmers with other farmers or experts and to untangle the evolutionary characteristics of farmers’ decision making through multiple follow-up surveys and time-series analyses. Through the in-depth analysis of farmers’ influence on sustainable agricultural practices, we could provide references for policy recommendations to promote sustainable agricultural development.
Author Contributions
Conceptualization, M.L. and T.Z.; methodology, M.L.; software, M.L.; validation, M.L.; formal analysis, M.L.; investigation, M.L.; resources, M.L.; data curation, M.L.; writing—original draft preparation, M.L.; writing—review and editing, T.Z.; visualization, M.L.; supervision, T.Z.; project administration, T.Z. and X.L.; funding acquisition, T.Z. and X.L. All authors have read and agreed to the published version of the manuscript.
Funding
This research was funded by the National Natural Science Foundation of China, grant numbers 42261144750 and 41771189.
Institutional Review Board Statement
Not applicable.
Informed Consent Statement
Informed consent was obtained from all subjects involved in the study.
Data Availability Statement
The original contributions presented in the study are included in the article, further inquiries can be directed to the corresponding author.
Conflicts of Interest
The authors declare no conflicts of interest.
| 1 | Ecological agriculture is one of the primary responsibilities included in Nanjing’s development goal, which dates back to 2006 and calls for the creation of a national eco-city. Nanjing was the first city in China to create an organization for certifying organic foods. |
References
- Piñeiro, V.; Arias, J.; Dürr, J.; Elverdin, P.; Ibáñez, A.M.; Kinengyere, A.; Opazo, C.M.; Owoo, N.; Page, J.R.; Prager, S.D.; et al. A scoping review on incentives for adoption of sustainable agricultural practices and their outcomes. Nat. Sustain. 2020, 3, 809–820. [Google Scholar] [CrossRef]
- Huan, M.; Li, Y.; Chi, L.; Zhan, S. The Effects of Agricultural Socialized Services on Sustainable Agricultural Practice Adoption among Smallholder Farmers in China. Agronomy 2022, 12, 2198. [Google Scholar] [CrossRef]
- Yu, J.; Wu, J. The Sustainability of Agricultural Development in China: The Agriculture–Environment Nexus. Sustainability 2018, 10, 1776. [Google Scholar] [CrossRef]
- Wollni, M.; Andersson, C. Spatial patterns of organic agriculture adoption: Evidence from Honduras. Ecol. Econ. 2014, 97, 120–128. [Google Scholar] [CrossRef]
- Oyetunde-Usman, Z.; Olagunju, K.O.; Ogunpaimo, O.R. Determinants of adoption of multiple sustainable agricultural practices among smallholder farmers in Nigeria. Int. Soil Water Conserv. Res. 2021, 9, 241–248. [Google Scholar] [CrossRef]
- Midingoyi, S.-K.G.; Kassie, M.; Muriithi, B.; Diiro, G.; Ekesi, S. Do Farmers and the Environment Benefit from Adopting Integrated Pest Management Practices? Evidence from Kenya. J. Agric. Econ. 2019, 70, 452–470. [Google Scholar] [CrossRef]
- Ma, W.; Wang, X. Internet Use, Sustainable Agricultural Practices and Rural Incomes: Evidence from China. Aust. J. Agric. Resour. Econ. 2020, 64, 1087–1112. [Google Scholar] [CrossRef]
- Blackman, A.; Naranjo, M.A. Does eco-certification have environmental benefits? Organic coffee in Costa Rica. Ecol. Econ. 2012, 83, 58–66. [Google Scholar] [CrossRef]
- Dubbert, C.; Abdulai, A.; Mohammed, S. Contract farming and the adoption of sustainable farm practices: Empirical evidence from cashew farmers in Ghana. Appl. Econ. Perspect. Policy 2023, 45, 487–509. [Google Scholar] [CrossRef]
- Liu, M.; Zhong, T. Impact of “New Farmers” on the Development of Ecological Agriculture in Suburban of Large Cities: A Case Study of Nanjing City. Mod. Urban Res. 2022, 11, 20–26. [Google Scholar]
- Liu, M.; Zheng, W.; Zhong, T. Impact of migrant and returning farmer professionalization on food production diversity. J. Rural Stud. 2022, 94, 23–36. [Google Scholar] [CrossRef]
- Cakirli Akyüz, N.; Theuvsen, L. The Impact of Behavioral Drivers on Adoption of Sustainable Agricultural Practices: The Case of Organic Farming in Turkey. Sustainability 2020, 12, 6875. Available online: https://www.mdpi.com/2071-1050/12/17/6875 (accessed on 1 November 2023). [CrossRef]
- Zeweld, W.; Van Huylenbroeck, G.; Tesfay, G.; Speelman, S. Smallholder farmers’ behavioural intentions towards sustainable agricultural practices. J. Environ. Manag. 2017, 187, 71–81. [Google Scholar] [CrossRef] [PubMed]
- Bernal Hoyo, D.; Giraldo, O.F.; Rosset, P.M.; López Corona, O.; Perez Cassarino, J.; Nautiyal, S. Building an agroecological model to understand the effects of agrochemical subsidies on farmer decisions. Agroecol. Sustain. Food Syst. 2022, 46, 712–735. [Google Scholar] [CrossRef]
- Zheng, H.; Ma, W.; Li, G. Learning from neighboring farmers: Does spatial dependence affect adoption of drought-tolerant wheat varieties in China? Can. J. Agric. Econ./Rev. Can. D’agroecon. 2021, 69, 519–537. [Google Scholar] [CrossRef]
- Yang, W.; Wang, L. Impact of farmer group participation on the adoption of sustainable farming practices—Spatial analysis of New Zealand dairy farmers. Ann. Public Coop. Econ. 2023, 94, 701–717. [Google Scholar] [CrossRef]
- Wang, Z.; Liu, J.; Li, T.; Chao, J.; Gao, X. Factors Affecting New Agricultural Business Entities’ Adoption of Sustainable Intensification Practices in China: Evidence from the Main Apple-Producing Areas in the Loess Plateau. Agronomy 2021, 11, 2435. [Google Scholar] [CrossRef]
- Hu, H. Zhejiang Province, College Graduates “Urban Residents Become Rural Residents” Policy System Analysis and Improvement Strategies. Master’s Thesis, East China University of Political Science and Law, Shanghai, China, 2011. [Google Scholar]
- Ou, Z.; Le, M. Study on Rural Problems and Countermeasures in the Implementation of “Three Township” Projects in Wuhan. Urban. Archit. 2021, 18, 53–55. [Google Scholar] [CrossRef]
- Xie, S.; Chen, J.; Xu, Z. Rural–urban migration and urban identity differentiation in China. Eurasian Geogr. Econ. 2023, 1–27. [Google Scholar] [CrossRef]
- Huang, L.; Goh, H.C.; Said, R. Understanding the social integration process of rural–urban migrants in urban china: A bibliometrics review. J. Popul. Res. 2023, 40, 19. [Google Scholar] [CrossRef]
- Research Group of Rural Economic System and Management Department Ministry of Agriculture; Zhang, H. Survey on the Development of New Farmers in the Context of Structural Reform on the Supply Side of Agriculture. Chin. Rural Econ. 2016, 4, 2–11. [Google Scholar]
- Wang, J.; Wu, L. Research on new farmers’ driving effects on small household farmers under the background of rural revitalization—Based on the perspective of different benefit linkage modes. J. Fujian Agric. For. Univ. (Philos. Soc. Sci.) 2022, 25, 36–43. [Google Scholar] [CrossRef]
- Mailfert, K. New farmers and networks: How beginning farmers build social connections in France. Tijdschr. Voor Econ. En Soc. Geogr. 2007, 98, 21–31. [Google Scholar] [CrossRef]
- Wilbur, A. Growing a Radical Ruralism: Back-to-the-Land as Practice and Ideal. Geogr. Compass 2013, 7, 149–160. [Google Scholar] [CrossRef]
- Milone, P.; Ventura, F. New generation farmers: Rediscovering the peasantry. J. Rural Stud. 2019, 65, 43–52. [Google Scholar] [CrossRef]
- Rissing, A. Alternative economic strategies and the technology treadmill: Beginning vegetable farmers in Iowa. Econ. Anthropol. 2016, 3, 304–314. [Google Scholar] [CrossRef]
- Minkoff-Zern, L.-A.; Welsh, R.; Ludden, M.T. Immigrant farmers, sustainable practices: Growing ecological and racial diversity in alternative agrifood spaces. Agroecol. Sustain. Food Syst. 2020, 44, 947–972. [Google Scholar] [CrossRef]
- Guo, Y.; Tan, Y. Influencing Factors and Policy Paths for the Growth of New Farmers. Agric. Econ. 2016, 4, 68–69. [Google Scholar]
- Yu, C. In 10 years, 12.2 million people returned to their hometowns as “new farmers”. Poster News. 2023. Available online: https://news.sina.com.cn/zx/gj/2023-12-22/doc-imzywsmz6519971.shtml (accessed on 29 December 2023).
- Carlisle, L.; Montenegro de Wit, M.; DeLonge, M.S.; Iles, A.; Calo, A.; Getz, C.; Ory, J.; Munden-Dixon, K.; Galt, R.; Melone, B.; et al. Transitioning to Sustainable Agriculture Requires Growing and Sustaining an Ecologically Skilled Workforce. Front. Sustain. Food Syst. 2019, 3, 96. [Google Scholar] [CrossRef]
- Läpple, D.; Holloway, G.; Lacombe, D.J.; O’Donoghue, C. Sustainable technology adoption: A spatial analysis of the Irish Dairy Sector. Eur. Rev. Agric. Econ. 2017, 44, 810–835. [Google Scholar] [CrossRef]
- Ambali, O.I.; Begho, T. My neighbour as myself? An experimental investigation of spatial patterns of risk preferences among smallholder farmers. Sci. Afr. 2022, 16, e01261. [Google Scholar] [CrossRef]
- Läpple, D.; Kelley, H. Spatial dependence in the adoption of organic drystock farming in Ireland. Eur. Rev. Agric. Econ. 2015, 42, 315–337. [Google Scholar] [CrossRef]
- Wang, Y.; Möhring, N.; Finger, R. When my neighbors matter: Spillover effects in the adoption of large-scale pesticide-free wheat production. Agric. Econ. 2023, 54, 256–273. [Google Scholar] [CrossRef]
- Holloway, G.; Shankar, B.; Rahman, S. Bayesian spatial probit estimation: A primer and an application to HYV rice adoption. Agric. Econ. 2002, 27, 383–402. [Google Scholar] [CrossRef]
- Maertens, A.; Barrett, C.B. Measuring Social Networks’ Effects on Agricultural Technology Adoption. Am. J. Agric. Econ. 2013, 95, 353–359. [Google Scholar] [CrossRef]
- Illukpitiya, P.; Gopalakrishnan, C. Decision-making in soil conservation: Application of a behavioral model to potato farmers in Sri Lanka. Land Use Policy 2004, 21, 321–331. [Google Scholar] [CrossRef]
- Mazzocchi, C.; Orsi, L.; Ferrazzi, G.; Corsi, S. The Dimensions of Agricultural Diversification: A Spatial Analysis of Italian Municipalities. Rural Sociol. 2020, 85, 316–345. [Google Scholar] [CrossRef]
- Xia, H.; Li, C.; Zhou, D.; Zhang, Y.; Xu, J. Peasant households’ land use decision-making analysis using social network analysis: A case of Tantou Village, China. J. Rural Stud. 2020, 80, 452–468. [Google Scholar] [CrossRef]
- Stewart, J. Tobit or Not Tobit? Institute of Labor Economics (IZA): Bonn, Germany, 2009. [Google Scholar]
- Chen, Q. Advanced Econometrics with Stata Applications, 2nd ed.; Higher Education Press: Beijing, China, 2014. [Google Scholar]
- Chatzitheodoridis, F.; Kontogeorgos, A. New entrants policy into agriculture: Researching new farmers’ satisfaction. Rev. Econ. Sociol. Rural 2020, 58, e193664. [Google Scholar] [CrossRef]
- Ding, D.; Liu, P.; Ravenscroft, N. The new urban agricultural geography of Shanghai. Geoforum 2018, 90, 74–83. [Google Scholar] [CrossRef]
- Zhang, Y.; Liu, G.; Ma, Z.; Deng, X.; Song, J.; Xu, D. The Influence of Land Attachment on Land Abandonment from the Perspective of Generational Difference: Evidence from Sichuan Province, China. Int. J. Environ. Res. Public Health 2022, 19, 11651. [Google Scholar] [CrossRef] [PubMed]
- Zhang, F.; Zhou, W.; He, J.; Qing, C.; Xu, D. Effects of Land Transfer on Farmer Households’ Straw Resource Utilization in Rural Western China. Land 2023, 12, 373. [Google Scholar] [CrossRef]
- Chen, M.; Yuan, D.; Kuang, F.; Wu, Q.; Xie, X. Household differentiation, generational difference and ecological farming adoption. China Popul. Resour. Environ. 2019, 29, 79–86. [Google Scholar]
- Jørs, E.; Konradsen, F.; Huici, O.; Morant, R.C.; Volk, J.; Lander, F. Impact of Training Bolivian Farmers on Integrated Pest Management and Diffusion of Knowledge to Neighboring Farmers. J. Agromed. 2016, 21, 200–208. [Google Scholar] [CrossRef] [PubMed]
- Damalas, C.A.; Koutroubas, S.D. Farmers’ Training on Pesticide Use Is Associated with Elevated Safety Behavior. Toxics 2017, 5, 19. [Google Scholar] [CrossRef] [PubMed]
- Jørs, E.; Lander, F.; Huici, O.; Morant, R.C.; Gulis, G.; Konradsen, F. Do Bolivian small holder farmers improve and retain knowledge to reduce occupational pesticide poisonings after training on Integrated Pest Management? Environ. Health 2014, 13, 75. [Google Scholar] [CrossRef] [PubMed]
- Nastis, S.A.; Mattas, K.; Baourakis, G. Understanding Farmers’ Behavior towards Sustainable Practices and Their Perceptions of Risk. Sustainability 2019, 11, 1303. [Google Scholar] [CrossRef]
- van Eeden, M.; Korsten, L. Factors determining use of biological disease control measures by the avocado industry in South Africa. Crop Prot. 2013, 51, 7–13. [Google Scholar] [CrossRef]
- Maini, E.; De Rosa, M.; Vecchio, Y. The Role of Education in the Transition towards Sustainable Agriculture: A Family Farm Learning Perspective. Sustainability 2021, 13, 8099. [Google Scholar] [CrossRef]
- Zawedde, B.M.; Harris, C.; Alajo, A.; Hancock, J.; Grumet, R. Factors Influencing Diversity of Farmers’ Varieties of Sweet Potato in Uganda: Implications for Conservation. Econ. Bot. 2014, 68, 337–349. [Google Scholar] [CrossRef]
- Karipidis, P.; Karypidou, S. Factors that Impact Farmers’ Organic Conversion Decisions. Sustainability 2021, 13, 4715. [Google Scholar] [CrossRef]
- Guo, Q.; Ola, O.; Benjamin, E.O. Determinants of the Adoption of Sustainable Intensification in Southern African Farming Systems: A Meta-Analysis. Sustainability 2020, 12, 3276. [Google Scholar] [CrossRef]
- Vik, J.; McElwee, G. Diversification and the Entrepreneurial Motivations of Farmers in Norway. J. Small Bus. Manag. 2011, 49, 390–410. [Google Scholar] [CrossRef]
- Dessie, A.B.; Abate, T.M.; Mekie, T.M.; Liyew, Y.M. Crop diversification analysis on red pepper dominated smallholder farming system: Evidence from northwest Ethiopia. Ecol. Process. 2019, 8, 50. [Google Scholar] [CrossRef]
- Michler, J.D.; Josephson, A.L. To Specialize or Diversify: Agricultural Diversity and Poverty Dynamics in Ethiopia. World Dev. 2017, 89, 214–226. [Google Scholar] [CrossRef]
- Chen, X.; Chen, J.; Huang, C. Too Risky to Focus on Agriculture? An Empirical Study of China’s Agricultural Households’ Off-Farm Employment Decisions. Sustainability 2019, 11, 697. [Google Scholar] [CrossRef]
- Juvančič, L.; Erjavec, E. Intertemporal analysis of employment decisions on agricultural holdings in Slovenia. Agric. Econ. 2005, 33, 153–161. [Google Scholar] [CrossRef]
- Chang, Y.-M.; Huang, B.-W.; Chen, Y.-J. Labor supply, income, and welfare of the farm household. Labour Econ. 2012, 19, 427–437. [Google Scholar] [CrossRef]
- Tesfaye, W.; Tirivayi, N. Crop diversity, household welfare and consumption smoothing under risk: Evidence from rural Uganda. World Dev. 2020, 125, 104686. [Google Scholar] [CrossRef]
- Nanjing Daily. Empowered by Technology—New Professional Farmers in Nanjing Reached 136,000. Available online: http://www.zgjssw.gov.cn/shixianchuanzhen/nanjing/202007/t20200715_6728736.shtml (accessed on 1 November 2023).
- Nanjing Municipal People’s Government. Notice of the Municipal Government on the Issuance of the Outline of the Nanjing Ecological City Construction Plan; Nanjing Municipal People’s Government: Nanjing, China, 2006.
- Qi, D.; Si, Z.; Scott, S. Can We Be More Collaborative? Top-Down Policies and Urban–Rural Divides in the Ecological Agriculture Sector in Nanjing, China. Soc. Nat. Resour. 2021, 34, 208–226. [Google Scholar] [CrossRef]
- Nanjing Municipal Bureau Statistics. Nanjing Statistical Yearbook; Wang, G., Zhong, Y., Eds.; Nanjing Municipal Bureau Statistics: Nanjing, China, 2021.
- Jeanty, P.W. ANKETEST: Stata Module to Perform Diagnostic Tests for Spatial Autocorrelation in the Residuals of OLS, SAR, IV, and IV-SAR Models. 2010. Available online: https://EconPapers.repec.org/RePEc:boc:bocode:s457113 (accessed on 1 November 2023).
- LeSage, J.P.; Pace, R.K. The Biggest Myth in Spatial Econometrics. Econometrics 2014, 2, 217–249. [Google Scholar] [CrossRef]
- Elhorst, J.P. Matlab Software for Spatial Panels. Int. Reg. Sci. Rev. 2012, 37, 389–405. [Google Scholar] [CrossRef]
- Zhu, J.; Li, B.; He, B.-J. Is linked migration overlooked in peri-urban Shanghai? Uncovering the domino effect of driving away interregional migrants. Habitat Int. 2019, 94, 102046. [Google Scholar] [CrossRef]
- Xie, X.; Tian, Y.; Chen, M.; Yuan, D.; Liao, X.; Yao, D. The Farmers’ Ecological Farming Behavior and the Influencing Factors—A Case Study in Jiangxi Province. Chin. J. Agric. Resour. Reg. Plan. 2020, 41, 38–47. [Google Scholar]
- Pierrette Coulibaly, T.; Du, J.; Diakité, D.; Abban, O.J.; Kouakou, E. A Proposed Conceptual Framework on the Adoption of Sustainable Agricultural Practices: The Role of Network Contact Frequency and Institutional Trust. Sustainability 2021, 13, 2206. [Google Scholar] [CrossRef]
Figure 1.
Diffusion of sustainable agricultural practices. (a) Purple background refers to the combined effects of farmers adopting sustainable agricultural practices; (b) dark blue background refers to the spillover effects of farmers adopting sustainable agricultural practices on neighboring farmers; and (c) light blue background refers to the decay effects of farmers adopting sustainable agricultural practices on faraway farmers.

Figure 2.
Overview of the survey area and sample in Nanjing City.

Table 1.
The evaluation index system for the sustainability level of farmers’ practices.
| Criterion | Indicators | Scores by Assignment Method | Weights by Assignment Method | Scores by Counting Method | Weights by Counting Method |
|---|---|---|---|---|---|
| Nutrient Cycling (NC) | Whether the farmer adopts natural farming practices | If Yes, NC = 5; otherwise, NC = 0 | 0.32 | If Yes, NC = 1; otherwise, NC = 0 | 0.36 |
| Whether the farmer adopts intercropping, combined farming (e.g., rice-fishery), methane and digestate, straw return, leguminous crops, green manure, or organic fertilizer/animal manure, etc. | If Yes, NC = 3; otherwise, NC = 0 | If Yes, NC = 1; otherwise, NC = 0 | |||
| Whether the farmer has only used little chemical fertilizer | If Yes, NC = 1; otherwise, NC = 0 | If Yes, NC = 1; otherwise, NC = 0 | |||
| Whether the farmer has not adopted any of the three types of nutrient cycling practices mentioned above | If Yes, NC = 0 | If Yes, NC = 0 | |||
| Pest Control (PC) | Whether the farmer adopts natural farming practices | If Yes, PC = 5; otherwise, PC = 0 | 0.07 | If Yes, PC = 1; otherwise, PC = 0 | 0.14 |
| Whether the farmer adopts practices that do not kill or clean up pests artificially (e.g., planting pest-resistant varieties, periodically cleaning the plots, planting hedges/flower strips, releasing natural enemies, etc.) | If Yes, PC = 3; otherwise, PC = 0 | If Yes, PC = 1; otherwise, PC = 0 | |||
| Whether the farmer uses tools such as yellow/blue boards, pest-proof nets, manual/mechanical traps, insecticidal lamps, etc. | If Yes, PC = 1; otherwise, PC = 0 | If Yes, PC = 1; otherwise, PC = 0 | |||
| Whether the farmer has sprayed insecticides | If Yes, PC = 0 | If Yes, PC = 0 | |||
| Disease Control (DC) | Whether the farmer adopts natural farming practices | If Yes, DC = 5; otherwise, DC = 0 | 0.04 | If Yes, DC = 1; otherwise, DC = 0 | 0.06 |
| Whether the farmer adopts disease-resistant varieties or improved soil | If Yes, DC = 3; otherwise, DC = 0 | If Yes, DC = 1; otherwise, DC = 0 | |||
| Whether the farmer adopts physical treatment measures (e.g., spraying vinegar, using grass ashes, etc.) | If Yes, DC = 1; otherwise, DC = 0 | If Yes, DC = 1; otherwise, DC = 0 | |||
| Whether the farmer has sprayed pesticides | If Yes, DC = 0 | If Yes, DC = 0 | |||
| Weed Treatment (WT) | Whether the farmer breeds poultry to weed or adopts biological weeding measures | If Yes, WT = 5; otherwise, WT = 0 | 0.26 | If Yes, WT = 1; otherwise, WT = 0 | 0.34 |
| Whether the farmer pulls weeds by hand | If Yes, WT = 3; otherwise, WT = 0 | If Yes, WT = 1; otherwise, WT = 0 | |||
| Whether the farmer uses machines to weed | If Yes, WT = 1; otherwise, WT = 0 | If Yes, WT = 1; otherwise, WT = 0 | |||
| Whether the farmer has sprayed herbicides | If Yes, WT = 0 | If Yes, WT = 0 | |||
| Diversified Farming (DF) | Whether the farmer raises aquaculture, poultry, and livestock and also grows crops on the farm at the same time | If Yes, DF = 5; otherwise, DF = 0 | 0.28 | If Yes, DF = 1; otherwise, DF = 0 | 0.06 |
| Whether the farmer raises any two types of aquaculture, poultry, and livestock at the same time as growing crops on the farm | If Yes, DF = 4; otherwise, DF = 0 | If Yes, DF = 1; otherwise, DF = 0 | |||
| Whether the farmer raises any one type of aquaculture, poultry, and livestock at the same time as growing crops on the farm | If Yes, DF = 3; otherwise, DF = 0 | If Yes, DF = 1; otherwise, DF = 0 | |||
| Whether the farmer only grows more than ten types of crops on the farm | If Yes, DF = 2; otherwise, DF = 0 | If Yes, DF = 1; otherwise, DF = 0 | |||
| Whether the farmer only grows more than one but less than ten types of crops on the farm | If Yes, DF = 1; otherwise, DF = 0 | If Yes, DF = 1; otherwise, DF = 0 | |||
| Whether the farmer only grows one type of crop on the farm | If Yes, DF = 0 | If Yes, DF = 0 | |||
| Certification of Agricultural Products (CP) | Whether the farm has received organic product certification | If Yes, CP = 5; otherwise, CP = 0 | 0.03 | If Yes, CP = 1; otherwise, CP = 0 | 0.04 |
| Whether the farm has received green food certification | If Yes, CP = 4; otherwise, CP = 0 | If Yes, CP = 1; otherwise, CP = 0 | |||
| Whether the farm has received certification for pollution-free agricultural products | If Yes, CP = 3; otherwise, CP = 0 | If Yes, CP = 1; otherwise, CP = 0 | |||
| Whether the farm has received geographical indication certification | If Yes, CP = 2; otherwise, CP = 0 | If Yes, CP = 1; otherwise, CP = 0 | |||
| Whether the farm has received good agricultural practices certification | If Yes, CP = 1; otherwise, CP = 0 | If Yes, CP = 1; otherwise, CP = 0 | |||
| Whether the farm has not obtained any certifications | If Yes, CP = 0 | If Yes, CP = 0 |
Table 2.
Variable description and descriptive statistics of the sample.
| Set | Variable (Variable Symbol) | Definition (Unit) | Total | New Farmer | Traditional Farmer | Test Statistic a |
|---|---|---|---|---|---|---|
| Mean (Std. Dev.) | Mean (Std. Dev.) | Mean (Std. Dev.) | Value | |||
| Y | Sustainable | Dummy, =1 if the surveyed farmer adopts sustainable agricultural practices. | 0.966 (0.182) | 1.000 (0.000) | 0.962 (0.192) | −0.038 |
| Composite sustainability score (CSS) | The composite sustainability score of farmers’ practices: composite sustainability score 1 (CSS1) measured by assignment method, and composite sustainability score 2 (CSS2) measured by counting method. | 2.339 (1.393), 2.535 (1.520) | 4.343 (1.445), 4.540 (1.292) | 2.136 (1.224), 2.332 (1.396) | −2.207 *** −2.209 *** | |
| Nutrient cycling score (NCS) | The sustainability score of farmers’ nutrient cycling practices: nutrient cycling score 1 (NCS1) measured by assignment method, and nutrient cycling score 2 (NCS2) measured by counting method. | 0.940 (0.635), 1.373 (0.894) | 1.423 (0.687), 1.921 (0.732) | 0.891 (0.612), 1.317 (0.895) | −0.531 *** −0.604 *** | |
| Pest control score (PCS) | The sustainability score of farmers’ pest control practices: pest control score 1 (PCS1) measured by assignment method, and pest control score 2 (PCS2) measured by counting method. | 0.060 (0.128), 0.235 (0.397) | 0.180 (0.200), 0.694 (0.439) | 0.047 (0.113), 0.189 (0.365) | −0.133 *** −0.505 *** | |
| Disease control score (DCS) | The sustainability score of farmers’ disease control practices: disease control score 1 (DCS1) measured by assignment method, and disease control score 2 (DCS2) measured by counting method. | 0.032 (0.073), 0.048 (0.108) | 0.104 (0.116), 0.178 (0.180) | 0.024 (0.064), 0.035 (0.089) | −0.080 *** −0.143 *** | |
| Weed treatment score (WTS) | The sustainability score of farmers’ weed treatment practices: weed treatment score 1 (WTS1) measured by assignment method, and weed treatment score 2 (WTS2) measured by counting method. | 0.650 (0.561), 0.837 (0.707) | 1.261 (0.611), 1.597 (0.699) | 0.588 (0.521), 0.760 (0.665) | −0.672 *** −0.838 *** | |
| Diversified farming score (DFS) | The sustainability score of farmers’ diversified farming practices: diversified farming score 1 (DFS1) measured by assignment method, and diversified farming score 2 (DFS2) measured by counting method. | 0.639 (0.622), 0.024 (0.076) | 1.301 (0.629), 0.087 (0.164) | 0.572 (0.584), 0.018 (0.058) | −0.729 *** −0.069 *** | |
| Certification of agricultural products score (CPS) | The sustainability score of agricultural products certification: certification of agricultural products score 1 (CPS1) measured by assignment method, and certification of agricultural products score 2 (CPS2) measured by counting method. | 0.019 (0.048), 0.018 (0.047) | 0.075 (0.059), 0.063 (0.049) | 0.013 (0.044), 0.013 (0.045) | −0.062 *** −0.050 *** | |
| X | Farmer type (FType) | Categorical variables: =0, traditional farmer (including local and foreign farmers) (set as the base); =1, new farmer (including returning farmer, returning student, and citizen). | 0.092 (0.289) | - | - | - |
| Farmer Characteristics (FC) | Gender | Dummy=1 if the surveyed farmer is male. | 0.736 (0.441) | 0.875 (0.342) | 0.722 (0.450) | −0.153 |
| Generation gap (GGap) | Categorical variables: =0, old generation (someone born before 1975, set as the base); =1, new generation (someone born in 1975 and after). | 0.420 (0.493) | 0.438 (0.512) | 0.418 (0.495) | −0.020 | |
| Education year (ELevel) | Years of surveyed farmers’ education level (scales), where =0, illiterate (set as the base); =6, primary school level; =9, junior high school level; =12, high school/technical secondary school level; =15, junior college level; =16, undergraduate level; =19, graduate level. | 9.368 (3.964) | 14.688 (1.662) | 8.829 (3.739) | −5.858 *** | |
| Agricultural training (NTraining) | The total number of agricultural training sessions attended by the farmer as of the date of the survey (numbers). | 2.011 (0.499) | 3.938 (8.805) | 1.816 (4.039) | −2.121 * | |
| Certificate | Dummy=1 if the surveyed farmer has obtained a certificate as a new type of professional farmer. | 0.063 (0.243) | 0.188 (0.403) | 0.051 (0.220) | −0.137 ** | |
| Farm Business Characteristic (FBC) | Farm size (lnFSize) | The log value of current farming land (mu b). | 3.637 (1.414) | 4.774 (1.289) | 3.522 (1.383) | −1.252 *** |
| Farm plots (FPlot) | The total number of plots on the farm (pieces). | 1.638 (2.234) | 2.000 (2.221) | 1.601 (2.246) | −0.399 | |
| Marketing practices (NMarketing) | The number of types of agricultural marketing practices (numbers). | 1.741 (1.294) | 4.000 (2.633) | 1.519 (1.240) | −1.248 | |
| Household agricultural laborer (HAgrilabor) | The number of surveyed farmers’ household agricultural laborers (numbers). | 2.103 (0.796) | 1.625 (0.719) | 2.152 (0.791) | 0.527 ** | |
| Employment | Dummy=1 if the farm has employed workers. | 0.839 (0.367) | 0.938 (0.250) | 0.829 (0.378) | −0.108 | |
| Farmer’s Viewpoint (FV) | Farming reason (FReason) | Dummy=1 if a strong positive outlook for farming in this area is the main reason for farmers to start farming. | 0.425 (0.494) | 0.313 (0.479) | 0.437 (0.498) | 0.124 |
| Future challenge (FCha) | Dummy=1 if the farmer considers that the future challenges are mainly in terms of technology. | 0.207 (0.405) | 0.250 (0.447) | 0.203 (0.403) | −0.047 |
a In the case of continuous variables, independent samples t-test is used to compare mean values. In the case of dummy variables, Pearson’s chi2 test is used to compare distributions. *, **, and *** represent statistically significant at the level of 10%, 5%, and 1%, respectively. b One mu equals 0.067 ha.
Table 3.
Estimation results of spatial autocorrelation tests.
| Variable (Model) | Sustainable | CSS1 | CSS2 | NCS1 | NCS2 | PCS1 | PCS2 | DCS1 |
| Moran’s I (Global) | −0.008 | 0.110 | 0.070 | −0.023 | 0.042 | 0.121 * | 0.151 ** | 0.159 ** |
| Geary’s C (Global) | 0.782 | 0.488 *** | 0.622 *** | 0.867 | 0.924 | 0.519 ** | 0.507 *** | 0.583 ** |
| LM (Spatial Error) | 0.000 | 1.708 | 1.005 | 0.151 | 1.744 | 0.657 | 0.689 | 3.761 * |
| Robust LM (Spatial Error) | 0.193 | 0.019 | 0.075 | 0.367 | 0.000 | 0.058 | 0.822 | 1.349 |
| LM (Spatial Lag) | 3.211 * | 3.542 * | 3.745 * | 1.543 | 3.780 | 0.602 | 0.308 | 2.743 * |
| Robust LM (Spatial Lag) | 3.404 * | 1.853 | 2.815 * | 1.759 | 3.780 * | 0.003 | 0.441 | 0.332 |
| Variable (Model) | DCS2 | WTS1 | WTS2 | DFS1 | DFS2 | CPS1 | CPS2 | |
| Moran’s I (Global) | 0.086 | 0.137 * | 0.134 * | 0.164 ** | −0.012 | 0.085 | 0.097 | |
| Geary’s C (Global) | 0.568 ** | 0.622 ** | 0.603 *** | 0.514 *** | 0.880 | 0.364 ** | 0.307 ** | |
| LM (Spatial Error) | 0.657 | 1.719 | 1.657 | 0.427 | 0.000 | 0.051 | 0.004 | |
| Robust LM (Spatial Error) | 0.518 | 0.043 | 0.224 | 0.000 | 0.004 | 0.036 | 0.018 | |
| LM (Spatial Lag) | 0.392 | 3.122 * | 3.742 * | 0.519 | 0.000 | 0.090 | 0.011 | |
| Robust LM (Spatial Lag) | 0.252 | 1.466 | 2.309 | 0.092 | 0.004 | 0.075 | 0.026 | |
| Variable (Model) | Sustainable | CSS1 | CSS2 | NCS1 | NCS2 | PCS1 | PCS2 | DCS1 |
| Moran’s I (Global) | −0.018 * | 0.036 *** | 0.011 ** | −0.004 | −0.013 | 0.014 ** | 0.012 ** | 0.013 ** |
| Geary’s C (Global) | 0.997 | 0.869 *** | 0.955 | 0.982 | 1.052 ** | 0.897 * | 0.922 ** | 0.928 |
| LM (Spatial Error) | 1.455 | 0.954 | 0.155 | 1.481 | 1.029 | 0.526 | 3.381 * | 0.292 |
| Robust LM (Spatial Error) | 1.511 | 0.584 | 0.187 | 1.216 | 1.839 | 0.260 | 5.741 ** | 3.217 * |
| LM (Spatial Lag) | 0.025 | 0.794 | 0.006 | 0.270 | 0.473 | 0.267 | 0.021 | 3.281 * |
| Robust LM (Spatial Lag) | 0.081 | 0.424 | 0.038 | 0.006 | 1.283 | 0.001 | 2.381 | 6.206 ** |
| Variable (Model) | DCS2 | WTS1 | WTS2 | DFS1 | DFS2 | CPS1 | CPS2 | |
| Moran’s I (Global) | −0.000 | 0.011 ** | 0.011 * | 0.039 *** | 0.005 | 0.000 | 0.004 | |
| Geary’s C (Global) | 0.915 * | 0.985 | 0.952 | 0.884 *** | 0.715 ** | 0.912 | 0.843 * | |
| LM (Spatial Error) | 0.253 | 1.522 | 1.227 | 0.010 | 0.000 | 0.128 | 0.014 | |
| Robust LM (Spatial Error) | 2.365 | 1.507 | 0.388 | 0.601 | 1.151 | 1.598 | 0.922 | |
| LM (Spatial Lag) | 0.298 | 0.090 | 1.660 | 1.856 | 0.236 | 2.339 | 1.578 | |
| Robust LM (Spatial Lag) | 2.410 | 0.076 | 0.821 | 2.447 | 1.387 | 2.810 | 2.487 | |
| Variable (Model) | Sustainable | CSS1 | CSS2 | NCS1 | NCS2 | PCS1 | PCS2 | DCS1 |
| Moran’s I (Global) | −0.021 * | 0.042 *** | 0.016 ** | −0.004 | −0.017 | 0.013 ** | 0.016 ** | 0.020 *** |
| Geary’s C (Global) | 1.125 | 0.832 *** | 0.931 * | 1.023 | 1.091 *** | 0.909 | 0.902 ** | 0.863 * |
| LM (Spatial Error) | 1.876 | 1.057 | 0.074 | 1.698 | 1.299 | 0.129 | 2.393 | 0.685 |
| Robust LM (Spatial Error) | 1.705 | 0.382 | 0.004 | 0.960 | 1.052 | 0.198 | 3.587 * | 0.664 |
| LM (Spatial Lag) | 0.617 | 2.841 * | 0.606 | 1.318 | 0.273 | 0.610 | 0.072 | 2.180 |
| Robust LM (Spatial Lag) | 0.446 | 2.166 | 0.537 | 0.581 | 0.026 | 0.679 | 1.266 | 2.159 |
| Variable (Model) | DCS2 | WTS1 | WTS2 | DFS1 | DFS2 | CPS1 | CPS2 | |
| Moran’s I (Global) | 0.002 | 0.015 ** | 0.015 ** | 0.038 *** | 0.007 * | 0.004 | 0.007 | |
| Geary’s C (Global) | 0.850 ** | 0.989 | 0.951 | 0.774 *** | 0.693 * | 0.784 ** | 0.730 ** | |
| LM (Spatial Error) | 0.378 | 1.660 | 1.424 | 0.018 | 0.000 | 0.561 | 0.276 | |
| Robust LM (Spatial Error) | 2.427 | 1.123 | 0.435 | 1.210 | 1.472 | 3.776 * | 2.978 * | |
| LM (Spatial Lag) | 0.055 | 0.614 | 2.219 | 3.450 * | 0.271 | 0.724 | 1.175 | |
| Robust LM (Spatial Lag) | 2.104 | 0.077 | 1.230 | 4.642 ** | 1.742 | 3.939 ** | 3.877 ** | |
Notes: *, **, and *** represent statistically significant at the level of 10%, 5%, and 1%, respectively.
Table 4.
Estimation results of regression models for Tobit and Tobit MLE spatial Durbin cross-sections of the composite score for sustainable agricultural practices.
Table 4.
Estimation results of regression models for Tobit and Tobit MLE spatial Durbin cross-sections of the composite score for sustainable agricultural practices.
| Variable | Y = CSS1 | ||||
| Tobit | |||||
| FType | 1.088 *** | 0.692 ** | 0.699 ** | 0.739 ** | 0.701 ** |
| Gender | −0.350 * | −0.690 *** | −0.573 *** | −0.662 *** | −0.544 ** |
| GGap | −0.521 *** | −0.403 ** | −0.378 ** | −0.410 * | −0.405 ** |
| ELevel | 0.087 *** | 0.132 *** | 0.106 *** | 0.138 *** | 0.108 *** |
| NTraining | −0.003 | −0.002 | −0.013 | −0.004 | −0.015 |
| Certificate | 0.607 * | 0.302 | 0.608 * | 0.429 | 0.634 * |
| lnFSize | 0.131 * | −0.084 | −0.031 | −0.082 | −0.034 |
| FPlot | −0.045 | −0.042 | −0.038 | −0.033 | −0.038 |
| NMarketing | 0.292 *** | 0.293 *** | 0.320 *** | 0.258 *** | 0.301 *** |
| HAgrilabor | −0.193 * | −0.137 | −0.160 | −0.115 | −0.150 |
| Employment | 0.282 | 0.638 ** | 0.622 ** | 0.601 * | 0.645 ** |
| FReason | −0.045 | −0.064 | 0.090 | −0.028 | 0.100 |
| FCha | −0.645 *** | −0.793 *** | −0.987 *** | −0.886 *** | −0.965 *** |
| wx_FType | −0.373 * | −0.153 ** | −0.334 | −0.166 * | |
| wx_Gender | −0.590 *** | −0.207 *** | −0.580 *** | −0.204 *** | |
| wx_GGap | −0.084 | −0.052 | −0.063 | −0.057 | |
| wx_EYear | 0.068 *** | 0.024 *** | 0.069 ** | 0.023 ** | |
| wx_NTraining | 0.011 | 0.006 | 0.009 | 0.005 | |
| wx_Certificate | −0.428 * | −0.197 * | −0.354 | −0.167 | |
| wx_lnFSize | −0.110 *** | −0.044 *** | −0.137 *** | −0.055 *** | |
| wx_FPlot | −0.011 | 0.001 | 0.004 | 0.002 | |
| wx_NMarketing | 0.132 *** | 0.074 *** | 0.102 ** | 0.069 *** | |
| wx_HAgrilabor | −0.039 | −0.017 | −0.031 | −0.015 | |
| wx_Employment | 0.442 ** | 0.138 *** | 0.407 * | 0.141 ** | |
| wx_FReason | −0.067 | 0.028 | −0.023 | 0.034 | |
| wx_Fcha | −0.360 ** | −0.239 *** | −0.423 ** | −0.233 *** | |
| Constant | 1.260 *** | 1.860 *** | 1.538 *** | 1.504 ** | 1.440 *** |
| var (e.CSS1) | 1.040 *** | ||||
| Rho | −0.056 ** | −0.021 ** | |||
| Lambda | −0.062 ** | −0.019 * | |||
| Sigma | 0.818 *** | 0.803 *** | 0.811 *** | 0.810 *** | |
| LR Test SDM vs. OLS (Rho = 0) | 5.998 ** | 5.339 ** | |||
| LR Test (wX’s = 0) | 55.859 *** | 65.009 *** | |||
| LR Test SEM vs. OLS (Lambda = 0) | 4.910 ** | 3.318 * | |||
| Pseudo R2 | 0.191 *** | ||||
| Adjust R2 | 0.435 *** | 0.449 *** | 0.395 *** | 0.387 *** | |
| AIC | 526.305 | 1.280 | 1.247 | 3.121 | 2.698 |
| BIC | 573.691 | 2.089 | 2.036 | 5.095 | 4.405 |
| Log likelihood | −248.152 | −211.576 | −207.398 | −211.317 | −208.180 |
| Variable | Y = CSS2 | ||||
| Tobit | |||||
| FType | 1.079 *** | 0.888 ** | 0.950 *** | 0.956 ** | 0.823 ** |
| Gender | −0.237 | −0.371 | −0.34 | −0.379 | −0.426 * |
| GGap | −0.21 | −0.196 | −0.05 | −0.213 | −0.089 |
| ELevel | 0.067 ** | 0.123 *** | 0.079 * | 0.126 ** | 0.093 ** |
| NTraining | −0.006 | −0.015 | −0.027 | −0.007 | −0.022 |
| Certificate | 0.542 | −0.172 | 0.252 | −0.104 | 0.334 |
| lnFSize | 0.153 * | 0.038 | 0.088 | 0.069 | 0.080 |
| FPlot | −0.047 | −0.085 | −0.069 | −0.069 | −0.065 |
| NMarketing | 0.347 *** | 0.341 *** | 0.354 *** | 0.282 *** | 0.328 *** |
| HAgrilabor | −0.136 | −0.059 | −0.071 | −0.054 | −0.104 |
| Employment | 0.426 | 0.292 | 0.491 * | 0.097 | 0.574 * |
| FReason | −0.368 * | −0.452 ** | −0.361 * | −0.428 * | −0.353 * |
| FCha | −0.623 *** | −0.665 ** | −0.853 *** | −0.689 ** | −0.759 ** |
| wx_FType | −0.313 | −0.092 | −0.245 | −0.169 * | |
| wx_Gender | −0.295 * | −0.126 * | −0.285 | −0.172 ** | |
| wx_GGap | −0.163 | −0.038 | −0.158 | −0.056 | |
| wx_EYear | 0.072 ** | 0.016 | 0.072 | 0.022 * | |
| wx_NTraining | 0.008 | −0.001 | 0.013 | 0.000 | |
| wx_Certificate | −0.636 ** | −0.193 | −0.691 ** | −0.190 | |
| wx_lnFSize | −0.085 * | −0.018 | −0.074 | −0.030 | |
| wx_FPlot | −0.043 | −0.008 | −0.017 | −0.004 | |
| wx_NMarketing | 0.136 ** | 0.065 *** | 0.073 | 0.052 ** | |
| wx_HAgrilabor | −0.018 | 0.004 | −0.021 | −0.013 | |
| wx_Employment | 0.152 | 0.081 | −0.009 | 0.107 | |
| wx_FReason | −0.132 | −0.046 | −0.092 | −0.040 | |
| wx_Fcha | −0.315 | −0.218 ** | −0.305 | −0.179 * | |
| Constant | 1.156 ** | 0.655 | 1.193 ** | 0.298 | 1.251 ** |
| var (e.CSS2) | 1.368 *** | ||||
| Rho | −0.056 ** | −0.024 *** | |||
| Lambda | −0.073 ** | −0.021 ** | |||
| Sigma | 0.982 *** | 0.965 *** | 0.963 *** | 0.975 *** | |
| LR Test SDM vs. OLS (Rho = 0) | 5.935 ** | 8.157 *** | |||
| LR Test (wX’s = 0) | 33.835 *** | 42.458 *** | |||
| LR Test SEM vs. OLS (Lambda = 0) | 5.461 ** | 4.888 ** | |||
| Pseudo R2 | 0.156 *** | ||||
| Adjust R2 | 0.362 *** | 0.354 *** | 0.3379 *** | 0.326 *** | |
| AIC | 572.571 | 1.72 | 1.74 | 1.784 | 2.864 |
| BIC | 619.957 | 2.808 | 2.841 | 2.913 | 4.676 |
| Log likelihood | −271.285 | −242.304 | −239.336 | −242.116 | −240.326 |
Notes: *, **, and *** represent statistically significant at the level of 10%, 5%, and 1%, respectively. The variable prefixed with wx is the lag term of the corresponding explanatory variable
Table 5.
Estimations of the marginal effect of the composite score for sustainable agricultural practices.
Table 5.
Estimations of the marginal effect of the composite score for sustainable agricultural practices.
| Variable | SDM: Y = CSS1 | SDM: Y = CSS2 | ||||
|---|---|---|---|---|---|---|
| Direct | Indirect | Total | Direct | Indirect | Total | |
| FType | 2.258 ** | −1.591 ** | 0.667 ** | 3.273 *** | −2.375 *** | 0.898 *** |
| Gender | −1.852 *** | 1.305 *** | −0.547 *** | −1.170 | 0.849 | −0.321 |
| GGap | −1.223 ** | 0.862 ** | −0.361 ** | −0.173 | 0.125 | −0.047 |
| ELevel | 0.341 *** | −0.240 *** | 0.101 *** | 0.273 * | −0.198 * | 0.075 * |
| NTraining | −0.042 | 0.030 | −0.012 | −0.092 | 0.067 | −0.025 |
| Certificate | 1.964 * | −1.384 * | 0.580 * | 0.869 | −0.630 | 0.238 |
| lnFSize | −0.100 | 0.070 | −0.030 | 0.303 | −0.220 | 0.083 |
| FPlot | −0.124 | 0.088 | −0.037 | −0.239 | 0.174 | −0.066 |
| NMarketing | 1.033 *** | −0.728 *** | 0.305 *** | 1.221 *** | −0.886 *** | 0.335 *** |
| HAgrilabor | −0.518 | 0.365 | −0.153 | −0.246 | 0.179 | −0.068 |
| Employment | 2.008 ** | −1.415 ** | 0.593 ** | 1.692 * | −1.228 * | 0.464 * |
| FReason | 0.290 | −0.205 | 0.086 | −1.244 * | 0.903 * | −0.341 * |
| FCha | −3.189 *** | 2.247 *** | −0.942 *** | −2.938 *** | 2.132 *** | −0.806 *** |
Notes: *, **, and *** represent statistically significant at the level of 10%, 5%, and 1%, respectively.
Table 6.
Estimations of the marginal effect of the specific sustainable agricultural practices.
| Variable | SLM: Y = WTS1 | SLM: Y = DFS1 | |||||
| Direct | InDirect | Total | Direct | InDirect | Total | ||
| FType | 0.175 ** | 0.065 ** | 0.239 ** | 0.059 | −0.0158 | 0.043 | |
| Gender | −0.070 | −0.026 | −0.096 | −0.207 | 0.055 | −0.151 | |
| GGap | −0.030 | −0.011 | −0.041 | −0.229 ** | 0.061 ** | −0.168 ** | |
| ELevel | 0.009 | 0.003 | 0.013 | 0.030 | −0.008 | 0.022 | |
| NTraining | −0.004 | −0.002 | −0.005 | 0.007 | −0.002 | 0.005 | |
| Certificate | 0.051 | 0.019 | 0.070 | 0.055 | −0.015 | 0.040 | |
| lnFSize | 0.037 * | 0.014 * | 0.050 * | 0.095 ** | −0.025 ** | 0.069 ** | |
| FPlot | −0.015 | −0.006 | −0.020 | −0.021 | 0.006 | −0.016 | |
| NMarketing | 0.031 * | 0.012 * | 0.043 * | 0.179 *** | −0.048 *** | 0.131 *** | |
| HAgrilabor | −0.0001 | −0.0001 | −0.0002 | 0.004 | −0.001 | 0.003 | |
| Employment | −0.147 * | −0.054 * | −0.201 * | 0.103 | −0.028 | 0.076 | |
| FReason | 0.033 | 0.012 | 0.045 | 0.173 * | −0.046 * | 0.127 * | |
| FCha | −0.086 | −0.032 | −0.118 | 0.006 | −0.002 | 0.005 | |
| Constant | 0.721 *** | 0.470 * | |||||
| Rho (Sigma) | 0.002 * (0.328 ***) | −0.003 * (0.415 ***) | |||||
| LR Test SAR vs. OLS (Rho = 0) | 2.757 * | 3.437 * | |||||
| R2 | 0.071 | 0.261 *** | |||||
| AIC (BIC) | 0.592 (0.764) | 0.336 (0.433) | |||||
| Log likelihood | −35.737 | −73.162 | |||||
| Variable | SAR: Y = PCS2 | SDM: Y = NCS1 | |||||
| Direct | InDirect | Total | Coef._wx | Direct | InDirect | Total | |
| FType | 0.003 | 0.002 | 0.006 | 0.001 | 0.167 | −0.109 | 0.058 |
| Gender | −0.052 | −0.039 | −0.091 | 0.005 | 0.169 | −0.110 | 0.059 |
| GGap | 0.007 | 0.005 | 0.012 | −0.049 ** | −0.622 ** | 0.405 ** | −0.217 ** |
| ELevel | 0.003 | 0.002 | 0.005 | 0.007 * | 0.054 | −0.035 | 0.019 |
| NTraining | −0.002 | −0.002 | −0.004 | −0.002 | −0.032 | 0.021 | −0.011 |
| Certificate | −0.109 ** | −0.082 ** | −0.191 ** | 0.010 | 0.655 | −0.426 | 0.229 |
| lnFSize | 0.007 | 0.005 | 0.012 | −0.022 *** | −0.251 *** | 0.163 *** | −0.088 *** |
| FPlot | 0.020 * | 0.015 * | 0.036 * | −0.001 | 0.153 ** | −0.100 ** | 0.054 ** |
| NMarketing | 0.036 *** | 0.027 *** | 0.063 *** | 0.017 ** | 0.025 | −0.016 | 0.009 |
| HAgrilabor | −0.010 | −0.007 | −0.017 | −0.017 | −0.275 * | 0.179 * | −0.096 * |
| Employment | 0.002 | 0.002 | 0.004 | 0.045 * | 0.348 | −0.226 | 0.122 |
| FReason | −0.012 | −0.009 | −0.021 | 0.054 ** | 0.182 | −0.118 | 0.064 |
| FCha | 0.009 | 0.007 | 0.016 | 0.005 | −0.125 | 0.081 | −0.044 |
| Constant | 0.570 * | 1.113 *** | |||||
| Rho (Sigma) | 0.003 * (0.199 ***) | −0.016 * (0.361 ***) | |||||
| LR Test SAR vs. OLS (Rho = 0) | 2.591 * | ||||||
| LR Test SDM vs. OLS (Rho = 0) | 3.012 * | ||||||
| R2 | 0.0001 | 0.094 | |||||
| AIC (BIC) | 1.431 (1.845) | 0.498 (0.812) | |||||
| Log likelihood | 9.141 | −59.089 | |||||
Notes: *, **, and *** represent statistically significant at the level of 10%, 5%, and 1%, respectively.
Disclaimer/Publisher’s Note: The statements, opinions and data contained in all publications are solely those of the individual author(s) and contributor(s) and not of MDPI and/or the editor(s). MDPI and/or the editor(s) disclaim responsibility for any injury to people or property resulting from any ideas, methods, instructions or products referred to in the content. |
© 2024 by the authors. Licensee MDPI, Basel, Switzerland. This article is an open access article distributed under the terms and conditions of the Creative Commons Attribution (CC BY) license (https://creativecommons.org/licenses/by/4.0/).
Share and Cite
MDPI and ACS Style
Liu, M.; Zhong, T.; Lyu, X. Spatial Spillover Effects of “New Farmers” on Diffusion of Sustainable Agricultural Practices: Evidence from China. Land 2024, 13, 119. https://doi.org/10.3390/land13010119
AMA Style
Liu M, Zhong T, Lyu X. Spatial Spillover Effects of “New Farmers” on Diffusion of Sustainable Agricultural Practices: Evidence from China. Land. 2024; 13(1):119. https://doi.org/10.3390/land13010119
Chicago/Turabian StyleLiu, Min, Taiyang Zhong, and Xiao Lyu. 2024. "Spatial Spillover Effects of “New Farmers” on Diffusion of Sustainable Agricultural Practices: Evidence from China" Land 13, no. 1: 119. https://doi.org/10.3390/land13010119
Note that from the first issue of 2016, this journal uses article numbers instead of page numbers. See further details here.