


Spatial Optimization Based on the Trade-Off between Ecosystem Conservation and Opportunity Cost of Tarim National Park in Xinjiang, China


1
School of Ecology and Environmental Science, Yunnan University, Kunming 650500, China
2
State Key Laboratory of Urban and Regional Ecology, Research Center for Eco-Environmental Sciences, Chinese Academy of Sciences, Beijing 100085, China
*
Author to whom correspondence should be addressed.
Land 2024, 13(1), 121; https://doi.org/10.3390/land13010121
Submission received: 20 December 2023
/
Revised: 12 January 2024
/
Accepted: 21 January 2024
/
Published: 22 January 2024
(This article belongs to the Special Issue Biodiversity Investigation and Conservation in China: Current Status, Challenges, and Perspectives)
Abstract
:National parks (NPs) are the flagship protected areas in China’s conservation network and play a key role in the ecological protection of core objects and important natural landscapes. However, the shortage of spatial optimization methods based on quantitative indicators has limited the spatially explicit identification of national parks. Therefore, in this study, we selected the main area of the Tarim River (MTR) in Xinjiang as an example to optimize the spatial boundary of a national park. We constructed an evaluation system based on representativeness, ecological importance, and the foundation of the existing protected area. Subsequently, we comprehensively employed a species distribution model to simulate the habitat of the primary conservation targets. Additionally, we spatially optimized the region using an integer linear model, considering multiple scenarios. The results of this study show that fewer than 30% of the existing protected areas in the MTR protect conservation objects. Using different protection objects and quantitative goals, the spatial optimization results for the eight protection scenarios show that the most effective national park establishment scenario covers a total area of 15,009.3 km2, which is 8157.5 km2 more than the protected area already in place and would include the Tarim Populus National Nature Reserve and Luntai Tarim Populus Forest Park. The opportunity cost to be paid for protection according to this boundary is approximately USD 115.14 million. The protection ratios of each protection object for the expanded park are more than 50%, which is 27.7% higher than the protection effect produced by the existing protected area, so we recommend that Tarim National Park be set up on the basis of this boundary.
1. Introduction
Many protected areas have been established globally to conserve biodiversity [1]. China’s nature reserves have substantially expanded since the establishment of the first reserve in 1956. Currently, China hosts over 12,000 nature reserves of various types, which have played a crucial role in the conservation of regional ecosystems and biodiversity [2]. Nevertheless, the increases in protected areas have been accompanied by the emergence of issues that are not conducive to the sustainable development of these areas. These issues include overlapping functional orientations and spatial boundaries and the institutional fragmentation of protected areas [3,4]. The Chinese government has initiated the establishment of national parks as part of its efforts to increase the efficacy of conservation by improving its system of nature reserves. Considering the indicators of national representativeness, significance, ecosystem integrity, and biodiversity in the selection and construction of national parks [5,6], China has identified nine establishment indicators, including ecosystem representativeness, biological species representativeness, and uniqueness of the natural landscape [7], which have served as the foundation for the assessment and construction of national parks. Alternative lists for the creation of national parks have been suggested in certain studies [8]. However, more investigation is needed regarding the process of identifying the spatial boundaries of national parks.
Given the continual development and expansion of economies and metropolitan areas, achieving a state of harmonious equilibrium between the preservation of the environment and the promotion of economic development is of utmost importance. The optimization of space and the definition of the boundaries of national parks are crucial to maximize the benefits of preservation within the confines of the limited protected areas. To optimize the boundary of a protected area, the area of protection, the boundary, and the cost required to build it must be considered [9]. The conservation targets identified in established studies include critical areas based on the habitat distribution of protected or threatened species and biodiversity [10], ecosystem service assessment [11], ecological integrity assessment [12], interference from human activities, and focusing on top predators to identify priority conservation areas for biodiversity [13,14]. Few studies have focused on evaluating entire national parks and spatial optimization. When establishing the program, the national representativeness, ecological significance, and management feasibility of the national parks must be considered [15]. The purpose of China’s national parks is to ensure the ecological security of the nation as well as to preserve the authenticity and integrity of natural ecosystems. Furthermore, the roles and objectives of community development and ecological education must be considered [16]. To ensure reasonable costs and that fundamental conservation objectives are met, national parks are established to fulfill a variety of goals, including the preservation of ecosystems, ecological services, and biodiversity. In order to objectively assess whether and where a region should become a national park, a system of quantitatively assessable indicators should be proposed.
The Tarim River basin, which features a variety of natural landscapes and ecosystems, including desert oasis and desert-adapted species, has been identified as one of the areas in the arid and semiarid ecological region in the western part of China that requires an investigation into its spatial distribution for national parks [7]. The Populus euphratica forest found in the Tarim River basin is the most expansive contiguous natural forest globally, encompassing 54% of the total basin area. Furthermore, this area hosts the most representative and best-preserved Populus euphratica forest in China [17,18]. Desert riparian forests are predominantly inhabited by this tree species, whose existence is crucial for the maintenance of a stable ecological equilibrium for watersheds and rivers, the sustenance of desert oases, and the prevention of the Kuruk and Taklamakan deserts from merging [19]. However, since the 1950s, human agricultural activity has substantially reduced the cover and population structure of these poplar forests [20]. Furthermore, the arid climate and precipitation-deficient topography of the area have played a role in the degradation of the stability of this desert riparian forest ecosystem. Since 2001, in an effort to safeguard riparian forests and strengthen the delicate environment, the Chinese government has invested USD 149 million in the Ecological Water Conveyance Project (EWCP) [21]. However, due to the enormous scale of the Tarim River basin, ensuring protection for each individual area is impractical. Hence, pivotal ecological conservation zones must be identified in the vicinity of the Tarim River and alternate locations for national parks must be suggested.
In this study, we aimed to identify crucial conservation targets and the boundary of the Tarim National Park within the main area of the Tarim River (MTR). Subsequently, we simulated the habitats of these targets and evaluated the conservation impact of the national park. This evaluation was based on three factors: representativeness, ecological importance, and the presence of existing protected areas. A total of eight conservation scenarios were subsequently formulated to determine key ecological conservation areas, considering various conservation objectives and quantitative targets. By evaluating the conservation impact associated with each scenario, the scenario yielding the highest conservation benefit was chosen. The proposed methodology involved the derivation of a spatial boundary scheme for the Tarim National Park based on the results of both the species distribution and spatial optimization models. This study offers valuable insight into the preservation of ecologically vulnerable regions in terms of the identification and enhancement of national parks.
2. Materials and Methods
2.1. Study Area
The MTR is situated on the northern periphery of the Tarim Basin within the southern region of Xinjiang. The Tarim River is a representative example of an inland river located in the arid region in China. It spans a total length of 1321 km and exhibits a topography that varies from high in the western region to low in the eastern region (Figure 1). The mean annual temperature ranges from 14 to 16 °C, with evaporation rates ranging from 2000 to 3000 mm per year and average precipitation levels between 30 and 50 mm. The region exhibits a climatic pattern characterized by limited precipitation, elevated rates of evaporation, notable variations in temperature, and prolonged exposure to sunlight. The dominant tree species in the desert ecosystem is Populus euphratica, which, accompanied by important animal species such as Cervus yarkandensis, establishes this location as representative of a desert oasis.
2.2. Screening for Conservation of Important Species and Habitat Modeling
The geographical distribution of the associated species was determined through a comprehensive examination of the national literature [22,23], the Global Biodiversity Information Facility “http://www.gbif.org/ (accessed on 21 May 2022)”, the IUCN Red List of Threatened Species “https://www.iucnredlist.org/ (accessed on 21 May 2022)”, the Chinese Virtual Herbarium “https://cvh.ac.cn/ (accessed on 18 May 2022)”, the List of National Key Protected Wildlife in China [24], the List of State Key Protected Wildlife in Xinjiang [25], fieldwork expeditions, and consultations with local government personnel. In addition, we have collected essential information for evaluating protected areas, such as the level of protection, the indication of endemism, the altitude of the habitat, the kind of habitat, and the extent of the primary habitats for each species [26]. A flowchart of this study is shown in Figure S1. Important protected species include Populus euphratica, the representative tree species of arid and semiarid zones; Cervus yarkandensis, the only subspecies of deer adapted to arid environments and a first-level nationally protected animal; and the endemic species of the Tarim, Lepus yarkandensis, which is classified as a second-level nationally protected animal in China.
Maxent models enable the examination and forecasting of potential distributions under the constraints of environmental variables and species presence points [27]. Both the information regarding the distribution points of species that are present inside the regions that are included on the IUCN Red List and the distribution points that were produced from satellite vegetation maps were included in the data that were used in the Maxent model. Additionally, the model incorporated the species distribution points listed in Figure 2. The current climate scenario involved the acquisition of nineteen bioclimatic variables (bio1–bio19) from the World Climate Database “https://worldclim.org/ (accessed on 18 February 2022)”. To increase the precision of the model, correlation analyses were conducted on these variables using the “Species distribution model” SDMtoolbox within ArcGIS 10.8 software [28]. Factors with smaller contributions were omitted from the analysis if their correlation coefficient |r| was greater than or equal to 0.8 [29,30]. The final selection of environmental variables included bio2 (mean diurnal range (mean of monthly temp (max temp − min temp))), bio4 (temperature seasonality (standard deviation ×100)), bio7 (temperature annual range), bio11 (mean temperature of coldest quarter), bio15 (precipitation seasonality (coefficient of variation)), bio16 (precipitation of wettest quarter), and bio17 (precipitation of driest quarter), in addition to elevation, slope, and land use type [31,32]. Then, we conducted 10 replications and a maximum of 500 iterations for each species, utilizing a cross-validation procedure. The dataset was divided, with 75% of the data used for model calibration and the remaining 25% retained for evaluation. The species distribution models were validated using kappa coefficients and through field investigation.
2.3. Selection of Ecological Importance Indicators
An evaluation index system for Tarim National Park was developed based on the specifications for national park establishment [7] (Table 1). Representativeness, ecological significance, and feasibility are the three basic categories that comprise the index system. Additionally, these three primary categories include six subcategories. The study site is located within a desert ecosystem characterized by Populus euphratica as the predominant tree species. The vegetation diversity within this region is limited, resulting in a relatively uncomplicated food chain structure. As a result, the major evaluation metrics encompassed the aboveground biomass density “http://www.ceode.cas.cn/sjyhfw/ (accessed on 6 April 2023)”, fractional vegetation cover “https://modis.gsfc.nasa.gov/data/dataprod/mod13.php (accessed on 6 April 2023)” and four distinct ecosystem services, specifically sand fixation, soil conservation, water retention, and carbon sequestration, which follow the ecological process modeling developed by Ouyang et al. [33]; the data for 2020 were collected and re-evaluated for acquisition. To increase the comparability of conservation indicators, a standardization process was implemented to ensure that the resulting values were confined within the range of 0 to 1. The standardized values X1 were obtained using the following formula:
where Xmin and Xmax are the maximum and minimum values of the indicator data, respectively.
X1 = (X − Xmin)/(Xmax − Xmin)
2.4. Boundary Identification and Spatial Optimization
2.4.1. Opportunity Cost Calculation
Due to the limited availability of resources and the need to safeguard specific regions, allocating a portion of an area for ecological conservation entails foregoing advantages that could otherwise be obtained. Therefore, the opportunity cost associated with the preservation of the forests and grasslands within the designated study area was calculated utilizing the following formulae:
where Vj represents the opportunity cost of the forest ecosystem, Aj denotes the area of plot j, denotes the net income of timber per unit area, refers to the timber production per unit area [34], refers to the maintenance cost of forestry production per unit area, refers to the rotation time value fixed at 20 years, and represents the annual discount rate, which is fixed at the long-term deposit interest rate of 5% provided by the bank. Hereafter, this notation is employed. The opportunity cost () of grassland ecosystems, measured in sheep units, represents the theoretical annual carrying capacity. The market retail price of sheep (E) is valued at USD 210 per head, as obtained from the Administration of Bayanbulak National Nature Reserve. Additionally, the grass–animal balance subsidy () and the pasture seed subsidy contribute to the overall value. The estimated cost of the grassland ecosystem is approximately USD 26.18 per hectare per year. Additionally, is the contracted price of pasture land [35].
2.4.2. Scenario Settings and Spatial Optimization Algorithms
Different perspectives exist at the global level regarding the appropriate extent of the protection of a particular region. The conservation of a minimum of 30% of the Earth’s surface is an important objective outlined in both the Post-2020 Global Biodiversity Framework and the Convention on Biological Diversity (CBD) [36,37,38,39]. A minimum of 40% of the total area should be designated for landscape protection [40]. A range of 25% to 75% of land or water is recommended to be designated for nature conservation, with the objective of safeguarding a minimum of 50% of the natural habitats by the year 2030 [41]. Therefore, we considered 50% to 60% to be a high-priority conservation target and 30% to 50% to be a medium-priority conservation target for protected species.
Explicit protection ratios and targets were established to safeguard these assets, as described by the findings of various studies (refer to Table 2). The study area was partitioned into 1932 planning units, with each unit being 4.5 km × 4.5 km. The conservation opportunity cost zoning and assessment results for each indicator were documented for every planning unit using ArcGIS 10.8. Subsequently, a distribution matrix was generated wherein the conservation object name was the row variable and the unit distribution value was the column variable. The distribution matrix was subsequently incorporated into the Marxan model in conjunction with the pre-existing conservation scenarios [42]. The Marxan model is a commonly utilized open source decision support system that is grounded in the conservation field and operates on the principles of the integer linear model. The purpose of the Marxan initiative is to establish interconnected systems of protected areas that effectively address various ecological, social, and economic considerations [43]. The planning process involves a total of 100 operations, with a boundary length correction value of 0.01. Additionally, the process includes 1,000,000 iterations and a compensation value of 10. The parameters in the model are configured as follows: the number of unit selections in the design outcome is depicted on a numerical scale ranging from 0 to 100, which serves as an indicator of the unit’s irreplaceability and the corresponding ranking in terms of protection priority.
3. Results
3.1. Simulating Species Habitat and Assessing Ecological Indicators
The Maxent model was employed for 10 simulation iterations to assess the primary species. The average area under the curve (AUC) values for Populus euphratica, Cervus yarkandensis, and Lepus yarkandensis were 0.968, 0.957, and 0.874, respectively. The reliability of the simulation results was deemed to be high [44]. The kappa coefficients for assessing the validity of the species distribution model simulation were 0.695, 0.732, and 0.767, respectively. The reliability of the results was confirmed through the administration of a consistency test, which indicated the accuracy of the model simulation. The outcomes of the modeling conducted on habitats of important species and the distribution of indicators of ecological importance are presented in Figure 3.
The findings suggest that the predominant habitat for Populus euphratica is situated primarily in the upper and middle regions adjacent to the Tarim River. The geographical region exhibiting favorable environmental conditions for the growth and survival of Populus euphratica spans an extensive area of approximately 6732.22 km2. The potential habitat of Cervus yarkandensis primarily encompasses the upper and middle regions of the Tarim River, situated at a considerable distance from the riverbed. This habitat predominantly consists of desert terrain, spanning an area of approximately 3925.31 km2. Lepus yarkandensis inhabits a considerable area of suitable habitat that is distributed along the main course of the Tarim River. The primary concentration of this habitat occurs in the upper and middle portions of the river, which are in close proximity to agricultural land and other rivers. In total, this species inhabits an estimated 9173.18 km2 of suitable habitat. The findings from the evaluation of the six ecological importance indicators indicate that regions exhibiting elevated levels of aboveground biomass density and fractional vegetation cover are primarily concentrated along the course of the river, with a gradual decline in distribution as distance from the river increases. The areas where four ecological services are most abundant are concurrent with the geographic distribution of grassland and forest ecosystems.
3.2. Optimization of Protection Scenarios
The spatial planning results for the eight conservation scenarios for different conservation objectives are as follows (Figure 4): The central segment of the Tarim River exhibits the highest density of high-priority regions in all the conservation scenarios. Moreover, the ecological importance of these areas extends beyond the boundaries of the currently designated protected areas. The upper section of the study area exhibits the second highest level of priority areas in terms of spatial extent, closely following the central section. Notably, the areas of ecological importance largely align with the boundaries of the currently designated protected areas. Additionally, the four SOC scenarios indicate the presence of priority areas in the lower section of the Tarim River and Taitema Lake. The vicinity adjacent to the Taitema Lake exhibits a notable likelihood of hosting keystone species, thereby offering valuable ecosystem services in terms of water retention. In comparison to the four scenarios proposed by the SNCs, the distribution of the areas of conservation significance exhibit a greater degree of dispersion in the SOCs. The prioritized regions for conservation efforts are located in the upper, middle, and lower sections of the Tarim River. The regions of conservation significance in the SOC-3 scenario are notably smaller than in the SOC-1 and SOC-2 scenarios.
For each scenario, the cumulative conservation curves for priority protection ratios and protected area priority ratios for synergistic optimization options are depicted in Figure 5. The results indicate that the SNC-1 scenario, which applies a high protection target to all protected objects, can safeguard 6314.82 km2 or 93.8% of the Populus euphratica. The percentage of protected area decreases by an average of 42.8% under the SNC-2 scenario, which entails a 20% reduction in the protection objectives for the six indicators of ecological significance. This represents a more pronounced reduction ratio. In the SOC-1 scenario, Cervus yarkandensis is safeguarded through the expansion of the priority conservation area boundaries. Configuring SOC-1 and SNC-1 with high protection target parameters makes them capable of more rapidly enhancing protection.
3.3. Choosing the Optimal Protection Option and Establishing the Boundary
A statistical representation of the protective effects of the eight scenarios is provided in Table 3. The two scenarios that exhibit the most extensive collective protection area within the region are SNC-1 and SOC-1. In both scenarios, the protection rate of each protection object exceeds 60%, with Populus euphratica demonstrating a protection rate exceeding 93% in both instances. The inclusion of opportunity costs in scenario SOC-1, as opposed to scenario SNC-1, results in a reduction in the average protected area by 6.7%. A notable increase of 17.8% occurs in the proportion of protected area dedicated to fractional vegetation cover. In the SOC-1 scenario, the conservation efforts for Populus euphratica, Cervus yarkandensis, and Lepus yarkandensis encompass areas of 6207.10, 2551.45, and 7045 km2, respectively. The implementation of these conservation measures leads to a reduction in expenses of USD 5,499,400 compared with that of the SNC-1 scenario.
The conservation benefits of the eight scenarios are presented in Figure 6. The SOC-1 scenario, when considered in its entirety, yields the most conservation advantages, requiring an opportunity cost of USD 115.14 million to safeguard a priority nature conservation area spanning 15,901.20 km2. This area overlaps the existing protected areas in four regions, for a total area of 6637.03 km2, including the Tarim Populus National Nature Reserve, the Shaya County Upper Tarim River Wetland Nature Reserve, the Luntai Tarim Populus Forest Park, and the Kuqa Qiuci National Desert Park.
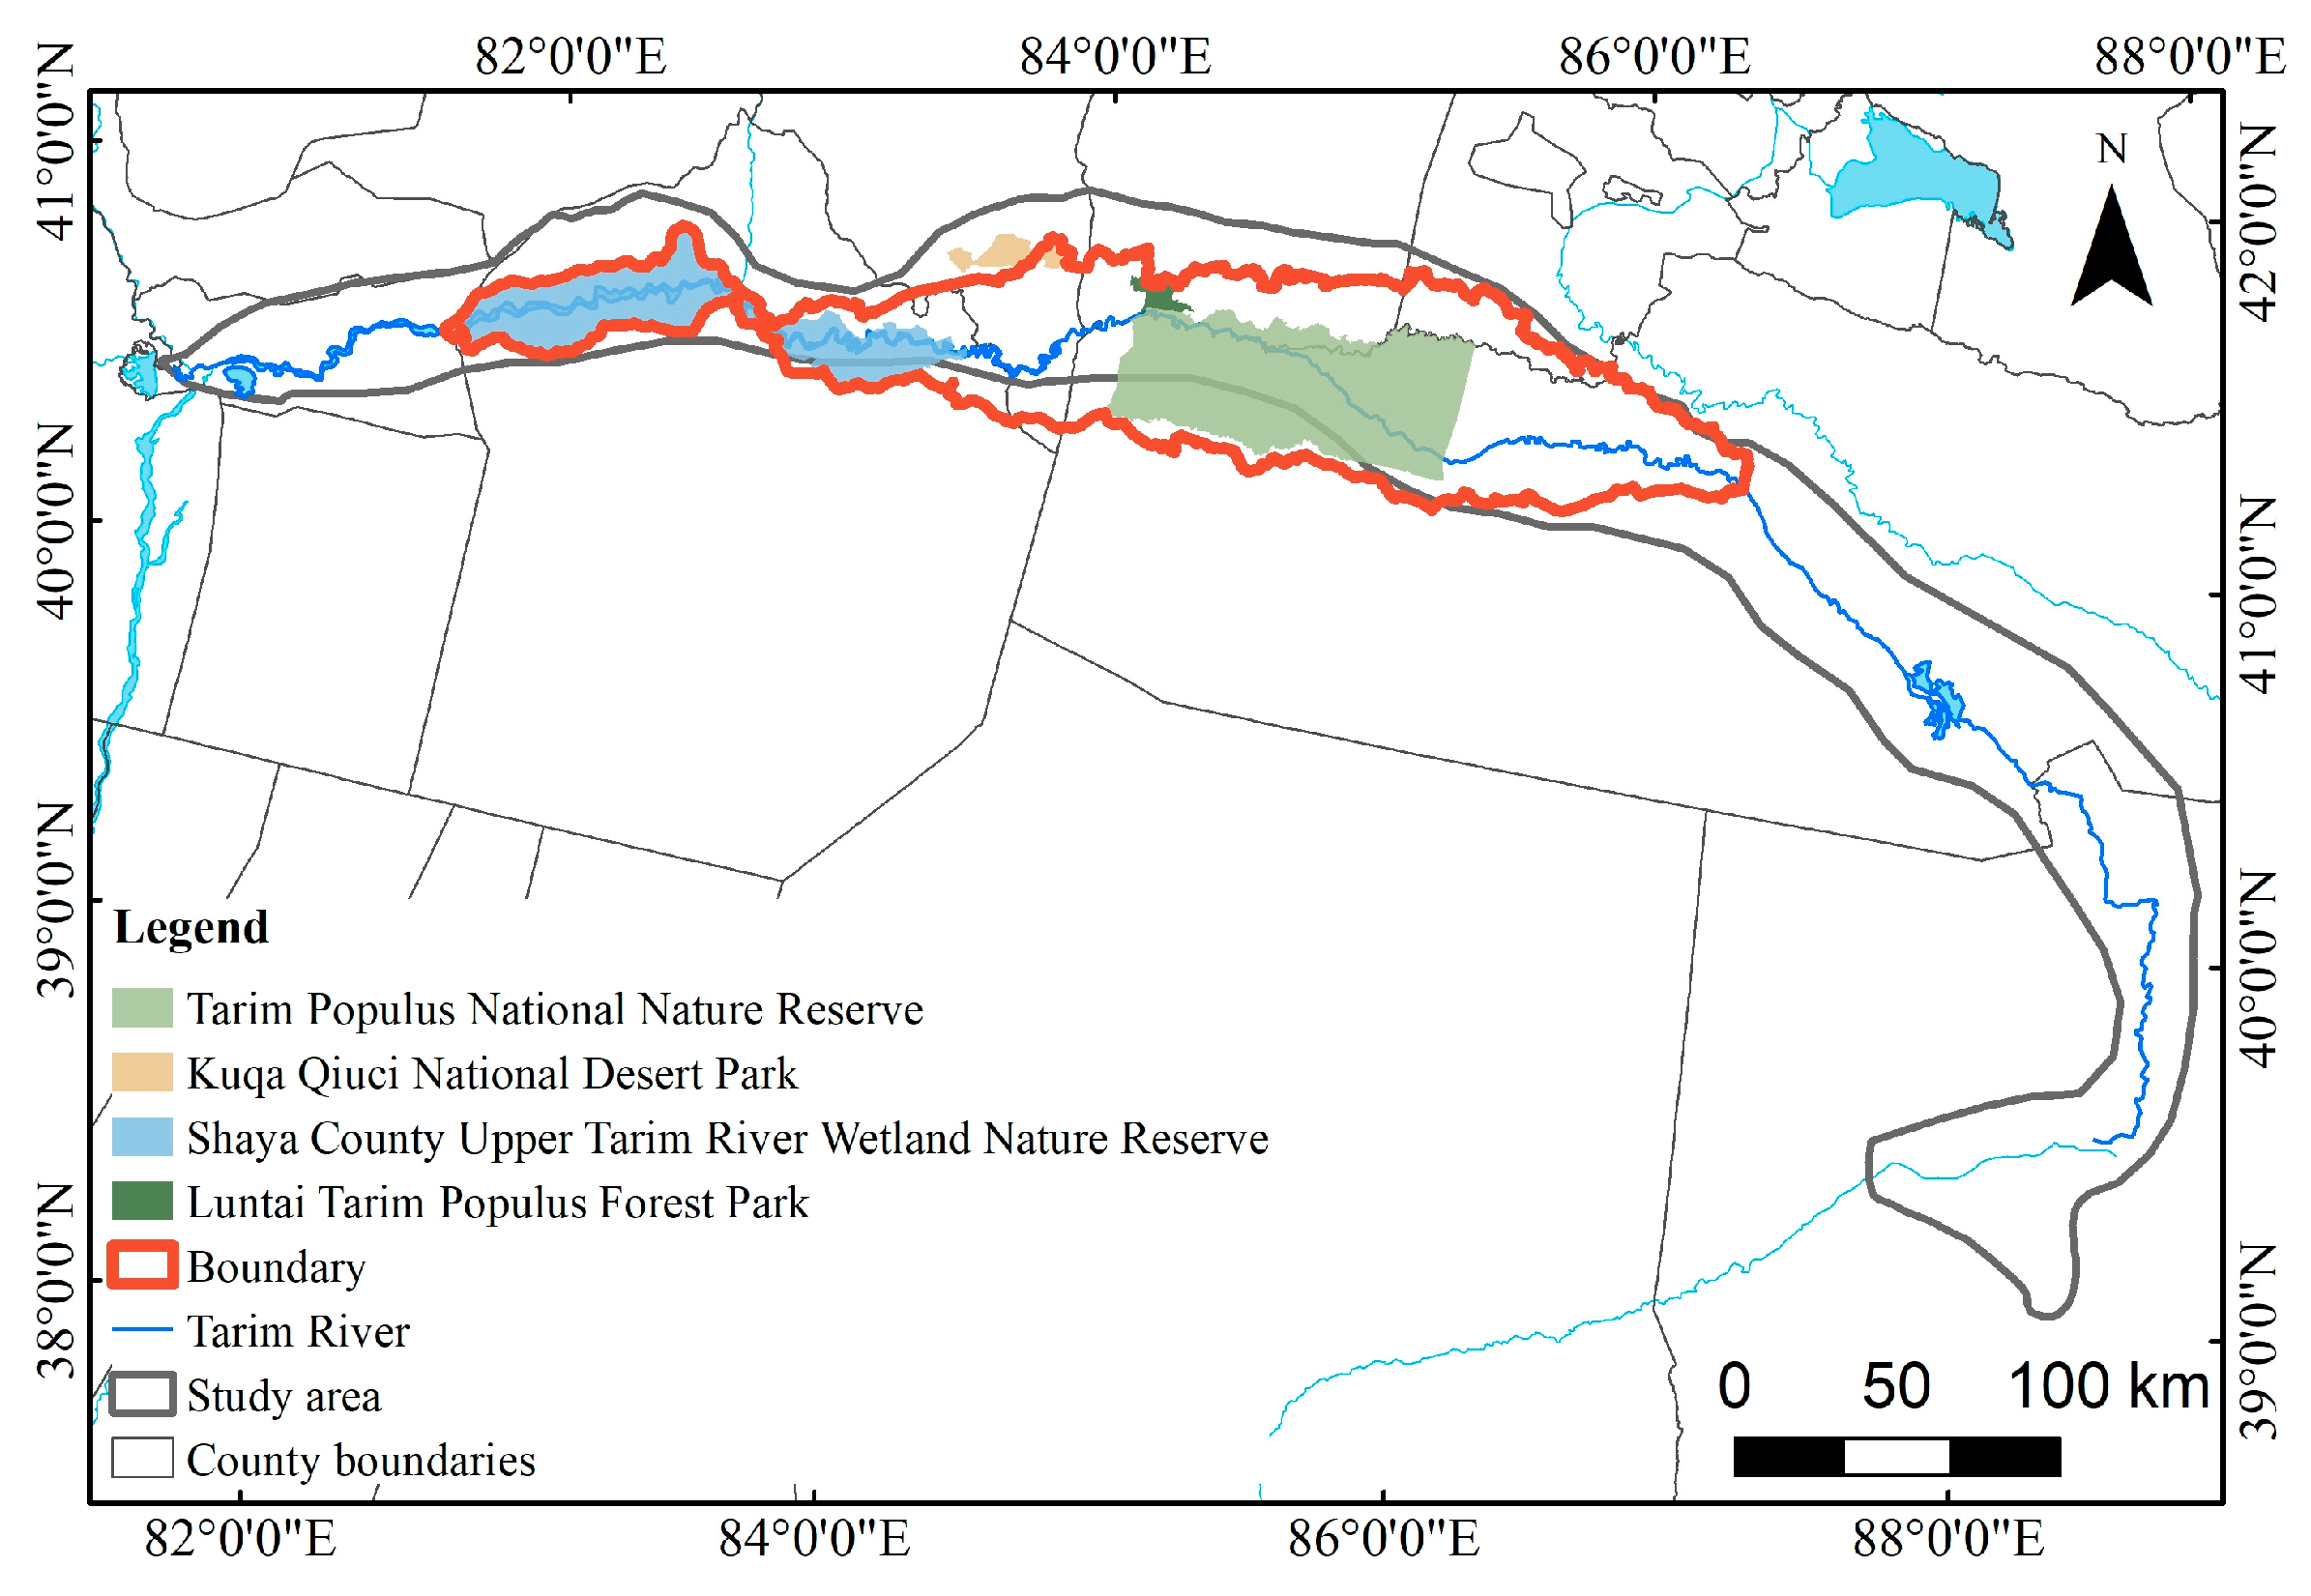
The existing protected areas exhibit conservation ratios of 38.3%, 33.8%, and 21.7% for Populus euphratica, Cervus yarkandensis, and Lepus yarkandensis, respectively. Notably, these values do not meet the conservation standards. Based on the optimization of scenario SOC-1 and considering the spatial limitations imposed by the presence of protected areas, enhanced connectivity, and the impacts of concentrated settlements and agricultural distribution areas, a suitable boundary was established (Figure 7). The Tarim National Park encompasses a total area of 15,009.30 km2, providing enhanced protection for 21.7% of the Populus euphratica, 29.5% of the Cervus yarkandensis, 31.6% of the Lepus yarkandensis, and 27.8% of the fractional vegetation cover. The implementation of enhanced protection measures is anticipated to yield a notable rise in aboveground biomass density, specifically by 32.9%, along with a corresponding enhancement in ecosystem services, estimated at 22.3%, in comparison with those of the existing protected areas.
4. Discussion
In this study, we focused on three key elements: representativeness, significance, and the foundation of the current protected areas. These aspects were used to develop a method for assessing national parks and creating a spatial optimization scenario plan specifically for Tarim National Park.
The authenticity and integrity of ecosystems are crucial factors in the optimization and assessment of national park spatial boundaries [45]. Contemporary conceptions of authenticity primarily pertain to the extent to which a location maintains its original and unspoiled ecosystems [46]. Authenticity is typically assessed by considering factors such as the presence of wilderness; the level of human interference; and the ecological structure, processes, and functioning [47,48]. The inclusion of explicit distribution and quantitative indicators is crucial in facilitating the optimization of site selection during the process of optimizing national park boundaries. The MTR represents an ecologically vulnerable region located within the Tarim Basin, being characterized by a distinctive arrangement of desert ecosystems. In comparison with the intricate population mechanisms observed in vegetation communities within the humid central and eastern regions of China, the vegetation community in the MTR is characterized by a singular type, predominantly Populus euphratica as the primary established tree species. The expansion of its communities is indicative of the prevailing ecosystem conditions. Therefore, using the density of aboveground biomass as a metric for evaluating the inherent integrity of the ecosystem is justifiable [49]. The gaps between ecosystems in the study area and ecosystems with similar background conditions were identified using the remote sensing monitoring results of biomass in conjunction with field survey data. This approach ensured the authenticity of the findings while allowing for the collection of monitoring data at the raster scale, which is advantageous for facilitating spatial optimization studies in national parks.
The definition of ecosystem integrity encompasses various dimensions, such as biological diversity, ecosystem stability and resilience, ecosystem condition, and ecosystem quality and value [12]. The assessment of ecological integrity commonly relies on a set of widely used indicators, including environmental pressures, ecological processes, biological diversity, functional structural integrity, and the regional integrity of significant species’ habitats [50]. Through a comparative analysis of the alterations in the overall distribution area and the proportion of the MTR area under protection for various conservation entities, we ascertained that the established objectives have been fulfilled for each conservation entity considered in the calculations in accordance with the specific attributes of the Tarim Basin. Additionally, this approach serves to enhance the safeguarding of peripheral units surrounding the core conservation entities.
We selected priority regions for conservation that are representative and ecologically important. We then considered eight optimization scenarios, each with different protection percentage aims for various conservation items. These scenarios offer alternative approaches for the development of the Tarim National Park from multiple perspectives. The majority of the studies that have been conducted on optimization scenarios have used scenarios that adopt uniform conservation aims or accelerate the rate at which numerous objects’ conservation changes [51]. Based on several policy conservation objectives, we established distinct conservation goals for each of the six conservation objects that were chosen, and we obtained conservation planning outcomes that consider regional specifics. In addition, the planning domain pertaining to important conservation objects offers potential for the conservation of other entities, thereby enhancing the efficacy of protection measures, even in the absence of explicitly defined conservation objectives for the safeguarded objects [52]. The Gross Domestic Product (GDP) of the region and the human footprint were used to calculate the cost of the protected areas. Previous studies have examined the opportunity costs in relation to different conservation objectives [53,54]. We considered the opportunity cost of safeguarding grassland and forest ecosystems, which provide valuable insights for the establishment of national parks and the optimal delineation of their boundaries.
The analysis of the advantages of conservation is of utmost importance [55]. The optimized solutions for each of the eight conservation scenarios varied in the protected area and the conservation impact, depending on whether opportunity costs were considered. The outcome is indicative of the necessity to consider opportunity costs. The study area is predominantly characterized by the presence of Populus euphratica, and the considered scenarios primarily focused on the extent of protected land allocated specifically for the conservation of Populus euphratica. The scenarios averaged 53.5% protection for the six ecologically important indicators. The most substantial disparity observed among the scenarios was in the safeguarding of aboveground biomass density, with a difference of 54.8% in the proportion protected. A thorough compilation of the results was used to identify the most important cases requiring protection across all indicators. The resulting selection was then integrated with the existing protected area, which spans 40°44′34″ N to 41°7′14″ N and 81°43′57″ E to 86°36′27″ E, accounting for 44% of the study area. The boundary scheme demonstrates the capacity to safeguard a large proportion of various species and ecological indicators. Specifically, it protects 60% of Populus euphratica, 63.3% of Cervus yarkandensis, 53.2% of Lepus yarkandensis, 54.2% of the vegetation cover, 55.7% of the aboveground biomass density, and 50% of the ecosystem services. The results of our study can provide a reference for the construction of national parks in arid zones in terms of the construction of regional ecological conservation target lists, the evaluation and spatial layout of national parks, the establishment of national park boundaries based on conservation priorities, and appropriate consideration of the opportunity costs of conservation to minimize potential conflicts in the establishment of national parks. For the next step in our research, we will consider the ecological importance of climatic characteristics, protected species and ecosystem types in different regions to further determine the proportion of protection and the appropriate method for the demarcation of national park boundaries.
5. Conclusions
By assessing the priority zones for the conservation of various objects and comparatively analyzing the conservation impacts under various scenarios, our findings indicate that the current protected areas are insufficient to meet the requirements of both conservation and development. Consequently, we recommend that the boundaries of the existing protected areas in the upper and central regions of the Tarim River be expanded outward. The establishment of the Tarim National Park encompasses a vast area measuring 15,009.3 km2. The endeavor to safeguard this park incurs an estimated opportunity cost of approximately USD 115.14 million. The Tarim National Park has exhibited a notable increase of 27.7% in the average conservation impact compared with conservation areas that solely rely on species distribution as a criterion and focus on a single objective. At the same time, it can also provide some guidance for the selection and construction of quantitative assessment indicators for the world’s arid national parks.
Supplementary Materials
The following supporting information can be downloaded at: https://www.mdpi.com/article/10.3390/land13010121/s1. Figure S1: Flowchart of this study.
Author Contributions
Conceptualization, X.Z and L.Z; methodology, X.Z. and L.Z; software, X.Z.; validation, X.Z.; investigation, X.Z. and L.Z.; resources, L.Z.; data curation, X.Z. and L.Z.; writing—original draft preparation, X.Z.; writing—review and editing, X.Z. and L.Z.; visualization, X.Z. and L.Z; supervision, L.Z. and Z.Z.; project administration, L.Z.; funding acquisition, L.Z. All authors have read and agreed to the published version of the manuscript.
Funding
This research was funded by The Third Xinjiang Scientific Expedition Project (Grant No. 2021XJKK1202); National Social Science Foundation (23AZD062); the Carbon Peak Carbon Neutrality Eco-Environmental Technology Project of the Research Center for Eco-Environmental Sciences, Chinese Academy of Sciences (Grant RCEES-TDZ-2021-16).
Data Availability Statement
Data will be made available on request.
Acknowledgments
We thank the Daxikul Management Station of the Tarim River in Xinjiang for their assistance during the field surveys.
Conflicts of Interest
The authors declare no conflicts of interest.
References
- Wu, R.; Hua, C.; Yu, G.; Ma, J.; Yang, F.; Wang, J.; Jin, T.; Long, Y.; Guo, Y.; Zhao, H. Assessing protected area overlaps and performance to attain China’s new national park system. Biol. Conserv. 2020, 241, 108382. [Google Scholar] [CrossRef]
- Du, A.; Cui, T.; Song, T.Y.; Ouyang, Z.Y. International experiences of national park selection criteria and the inspiration to China. Acta Ecol. Sin. 2020, 40, 7231–7237. (In Chinese) [Google Scholar] [CrossRef]
- Zang, Z.H.; Zhang, D.; Wang, N.; Du, A.; Kong, L.Q.; Xu, W.H.; Ouyang, Z.Y. Experiences, achievement, problems and recommendations of the first batch of China’s national park system pilots. Acta Ecol. Sin. 2020, 40, 8839–8850. (In Chinese) [Google Scholar] [CrossRef]
- Xu, W.; Pimm, S.L.; Du, A.; Su, Y.; Fan, X.; An, L.; Liu, J.; Ouyang, Z. Transforming protected area management in China. Trends Ecol. Evol. 2019, 34, 762–766. [Google Scholar] [CrossRef]
- Lewis, E.; MacSharry, B.; Juffe-Bignoli, D.; Harris, N.; Burrows, G.; Kingston, N.; Burgess, N.D. Dynamics in the global protected-area estate since 2004. Conserv. Biol. 2019, 33, 570–579. [Google Scholar] [CrossRef] [PubMed]
- Yu, H.; Zhong, L.S. Discussion on the selection criteria of national parks in China based on international experience. Acta Ecol. Sin. 2019, 39, 1309–1317. (In Chinese) [Google Scholar] [CrossRef]
- GB/T 39737-2021; Specification for National Park Establishment. National Forestry and Grassland Administration: Beijing, China, 2021. Available online: https://openstd.samr.gov.cn/bzgk/gb/newGbInfo?hcno=7F9CF60018CF8E6EB8A441C7434337C4 (accessed on 21 May 2022). (In Chinese)
- Tang, X.P.; Ouyang, Z.Y.; Jiang, Y.F.; Ma, W.; Xu, W.H.; Chen, S.; Liu, Z.L. Spatial planning of national parks in China. Natl. Park. 2023, 1, 1–10. (In Chinese) [Google Scholar]
- Margules, C.R.; Pressey, R.L.; Williams, P.H. Representing biodiversity: Data and procedures for identifying priority areas for conservation. J. Biosci. 2002, 27, 309–326. [Google Scholar] [CrossRef]
- Peng, Y.; Yang, R.; Cao, Y.; Wang, F.; Hou, S.; Tseng, T.; Wang, X.; Wang, P.; Zhao, Z.; Yu, L.; et al. One-third of lands face high conflict risk between biodiversity conservation and human activities in China. J. Environ. Manag. 2021, 299, 113449. [Google Scholar] [CrossRef]
- Xue, S.; Fang, Z.; Bai, Y.; Alatalo, J.M.; Yang, Y.; Zhang, F. The next step for China’s national park management: Integrating ecosystem services into space boundary delimitation. J. Environ. Manag. 2023, 329, 117086. [Google Scholar] [CrossRef]
- Rohwer, Y.; Marris, E. Ecosystem integrity is neither real nor valuable. Conserv. Sci. Pract. 2021, 3, e411. [Google Scholar] [CrossRef]
- Zhang, J.; Jiang, F.; Li, G.; Qin, W.; Li, S.; Gao, H.; Cai, Z.; Lin, G.; Zhang, T. Maxent modeling for predicting the spatial distribution of three raptors in the Sanjiangyuan National Park, China. Ecol. Evol. 2019, 9, 6643–6654. [Google Scholar] [CrossRef] [PubMed]
- Natsukawa, H.; Yuasa, H.; Sutton, L.J.; Amano, H.; Haga, M.; Itaya, H.; Kawashima, H.; Komuro, S.; Konno, T.; Mori, K.; et al. Utilizing a top predator to prioritize site protection for biodiversity conservation. J. Environ. Manag. 2023, 347, 119110. [Google Scholar] [CrossRef]
- National Parks Spatial Layout Program Issued. Available online: https://www.forestry.gov.cn/c/www/ze/29773.jhtml (accessed on 30 May 2023). (In Chinese)
- Zhong, L.; Zhao, Z.C.; Tang, J.L. Nature Education Planning Conception and Framework of China’s National Parks. Chin. Landsc. Archit. 2022, 38, 116–120. (In Chinese) [Google Scholar]
- Chen, Y.N.; Chen, Y.P.; Li, W.H.; Zhang, H.F. Response of the accumulation of proline in the bodies of Populus euphratica to the change of groundwater level at the lower reaches of Tarim River. Chin. Sci. Bull. 2003, 48, 1995–1999. [Google Scholar] [CrossRef]
- Hou, L.G.; Xiao, H.L.; Si, J.H.; Xiao, S.C.; Zhou, M.X.; Yang, Y.G. Evapotranspiration and crop coefficient of Populus euphratica Oliv forest during the growing season in the extreme arid region northwest China. Agric. Water Manag. 2010, 97, 351–356. [Google Scholar] [CrossRef]
- Ling, H.; Guo, B.; Zhang, G.; Xu, H.; Deng, X. Evaluation of the ecological protective effect of the “large basin” comprehensive management system in the Tarim River basin, China. Sci. Total Environ. 2019, 650, 1696–1706. [Google Scholar] [CrossRef]
- Zhu, C.G.; Aikeremu, A.; Li, W.H.; Zhou, H.H. Ecosystem restoration of Populus euphratica forest under the ecological water conveyance in the lower reaches of Tarim River. Arid. Land Geogr. 2021, 44, 629–636. (In Chinese) [Google Scholar] [CrossRef]
- Zhang, P.; Deng, X.; Long, A.; Xu, H.; Ye, M.; Li, J. Change in Spatial Distribution Patterns and Regeneration of Populus euphratica under Different Surface Soil Salinity Conditions. Sci. Rep. 2019, 9, 9123. [Google Scholar] [CrossRef]
- Tuohetahong, Y. Effects of Climate Change on the Distribution of Six Species Important Wild Animals and Plants in Tarim Basin and Its Adaptive Countermeasures. Master’s Thesis, Xinjiang University, Urumqi, China, 2020. (In Chinese). [Google Scholar]
- Guo, F.L.; Xu, G.B.; Lu, M.Z.; Meng, Y.H.; Yuan, C.Z.; Guo, K.Q. Prediction of Potential Suitable Distribution Areas for Populus euphratica using the MaxEnt Model. Sci. Silae Sin. 2020, 56, 184–192. (In Chinese) [Google Scholar] [CrossRef]
- The List of National Key Protected Wildlife in China. Available online: https://www.gov.cn/xinwen/2021-02/09/content_5586227.htm (accessed on 1 February 2022).
- The List of State Key Protected Wildlife in Xinjiang, China. Available online: https://www.xinjiang.gov.cn/xinjiang/ (accessed on 29 September 2022).
- Pimm, S.L.; Jenkins, C.N.; Abell, R.; Brooks, T.M.; Gittleman, J.L.; Joppa, L.N.; Raven, P.H.; Roberts, C.M.; Sexton, J.O. The biodiversity of species and their rates of extinction, distribution, and protection. Science 2014, 344, 1246752. [Google Scholar] [CrossRef] [PubMed]
- Phillips, S.J.; Dudík, M. Modeling of Species Distributions with Maxent: New Extensions and a Comprehensive Evaluation. Ecography 2008, 31, 161–175. [Google Scholar] [CrossRef]
- Brown, J.L. SDMtoolbox: A python-based GIS toolkit for landscape genetic, biogeographic and species distribution model analyses. Methods Ecol. Evol. 2014, 5, 694–700. [Google Scholar] [CrossRef]
- Li, Y.; Gao, X.; An, Q.; Sun, Z.; Wang, H. Ecological niche modeling based on ensemble algorithms to predicting current and future potential distribution of African swine fever virus in China. Sci. Rep. 2022, 12, 15614. [Google Scholar] [CrossRef] [PubMed]
- Carroll, C.; Johnson, D.S.; Dunk, J.R.; Zielinski, W.J. Hierarchical Bayesian spatial models for multispecies conservation planning and monitoring. Conserv. Biol. J. Soc. Conserv. Biol. 2010, 24, 1538–1548. [Google Scholar] [CrossRef] [PubMed]
- China Multi-Period Land Use Remote Sensing Monitoring Data Set (CNLUCC). 2018. Available online: https://www.resdc.cn/DOI/DOI.aspx?DOIID=54 (accessed on 21 May 2022). [CrossRef]
- Spatial Distribution of Annual Vegetation Index (NDVI) Dataset in China. 2018. Available online: https://www.resdc.cn/DOI/DOI.aspx?DOIID=49 (accessed on 21 May 2022). [CrossRef]
- Ouyang, Z.; Zheng, H.; Xiao, Y.; Polasky, S.; Liu, J.; Xu, W.; Wang, Q.; Zhang, L.; Xiao, Y.; Rao, E.; et al. Improvements in ecosystem services from investments in natural capital. Science 2016, 352, 1455–1459. [Google Scholar] [CrossRef] [PubMed]
- Zhang, Q.; Zhang, D.F.; Wu, M.L.; Guo, J.; Sun, C.Z.; Xie, C.X. Predicting the global areas for potential distribution of Gastrodia elata based on ecological niche models. Chin. J. Plant Ecol. 2017, 41, 770–778. [Google Scholar] [CrossRef]
- Wang, H.Y.; Zuo, X.; Wang, D.L.; Bi, Y.Y. The estimation of forest residue resources in China. J. Cent. South Univ. For. Technol. 2017, 37, 29–43. (In Chinese) [Google Scholar]
- Yao, Y. The Study on the Market of Internal Conversion of Contracted Managerial Rower of Grassland in Inner Mongolia. Master’s Thesis, Inner Mongolia Agricultural University, Huhhot, China, 2009. (In Chinese). [Google Scholar]
- Waldron, A.; Mooers, A.O.; Miller, D.C.; Nibbelink, N.; Redding, D.; Kuhn, T.S.; Roberts, J.T.; Gittleman, J.L. Targeting global conservation funding to limit immediate biodiversity declines. Proc. Natl. Acad. Sci. USA 2013, 110, 12144–12148. [Google Scholar] [CrossRef]
- Xu, H.; Cao, Y.; Yu, D.; Cao, M.; He, Y.; Gill, M.; Pereira, H.M. Ensuring effective implementation of the post-2020 global biodiversity targets. Nat. Ecol. Evol. 2021, 5, 411–418. [Google Scholar] [CrossRef]
- Pimm, S.L. From aspiration to implementation of the 30% solution. Natl. Sci. Rev. 2023, 10, nwad195. [Google Scholar] [CrossRef] [PubMed]
- Arroyo Rodríguez, V.; Fahrig, L.; Tabarelli, M.; Watling, J.I.; Tischendorf, L.; Benchimol, M.; Cazetta, E.; Faria, D.; Leal, I.R.; Melo, F.P.L.; et al. Designing optimal human-modified landscapes for forest biodiversity conservation. Ecol. Lett. 2020, 23, 1404–1420. [Google Scholar] [CrossRef]
- Dinerstein, E.; Vynne, C.; Sala, E.; Joshi, A.R.; Fernando, S.; Lovejoy, T.E.; Mayorga, J.; Olson, D.; Asner, G.P.; Baillie, J.; et al. A Global Deal for Nature: Guiding principles, milestones, and targets. Sci. Adv. 2019, 5, w2869. [Google Scholar] [CrossRef] [PubMed]
- Evans, J.L.; Peckett, F.; Howell, K.L. Combined application of biophysical habitat mapping and systematic conservation planning to assess efficiency and representativeness of the existing High Seas MPA network in the Northeast Atlantic. Ices J. Mar. Sci. 2015, 72, 1483–1497. [Google Scholar] [CrossRef]
- Zhang, L.; Ouyang, Z.Y.; Xu, W.H. Theory, work frame and hot issues of systematic conservation planning. Acta Ecol. Sin. 2015, 35, 1284–1295. (In Chinese) [Google Scholar] [CrossRef]
- Hou, M.; Tang, X.P.; Huang, G.L.; Li, R.Q. Identification of the priority conservation areas of national park: A case study of Lishui City, Zhejiang Province, China. Chin. J. Appl. Ecol. 2020, 31, 2332–2340. [Google Scholar] [CrossRef]
- Zhao, Z.C.; Yang, R. The concept of national park authenticity and integrity in China and its evaluation framework. Biodivers. Sci. 2021, 29, 1271–1278. [Google Scholar] [CrossRef]
- Xia, M.; Jia, K.; Wang, X.; Bai, X.; Li, C.; Zhao, W.; Hu, X.; Cherubini, F. A framework for regional ecosystem authenticity evaluation–a case study on the Qinghai-Tibet Plateau of China. Glob. Ecol Conserv. 2021, 31, e1849. [Google Scholar] [CrossRef]
- Fabbrizzi, E.; Giakoumi, S.; De Leo, F.; Tamburello, L.; Chiarore, A.; Colletti, A.; Coppola, M.; Munari, M.; Musco, L.; Rindi, F.; et al. The challenge of setting restoration targets for macroalgal forests under climate changes. J. Environ. Manag. 2023, 326, 116834. [Google Scholar] [CrossRef]
- Gatiso, T.T.; Kulik, L.; Bachmann, M.; Bonn, A.; Bösch, L.; Eirdosh, D.; Freytag, A.; Hanisch, S.; Heurich, M.; Sop, T.; et al. Effectiveness of protected areas influenced by socio-economic context. Nat. Sustain. 2022, 5, 861–868. [Google Scholar] [CrossRef]
- Smith, T.; Boers, N. Reliability of vegetation resilience estimates depends on biomass density. Nat. Ecol. Evol. 2023, 7, 1799–1808. [Google Scholar] [CrossRef] [PubMed]
- Roche, P.K.; Campagne, C.S. From ecosystem integrity to ecosystem condition: A continuity of concepts supporting different aspects of ecosystem sustainability. Curr. Opin. Environ. Sustain. 2017, 29, 63–68. [Google Scholar] [CrossRef]
- Zhang, Y.; Li, Y.; Lv, J.; Wang, J.; Wu, Y. Scenario simulation of ecological risk based on land use/cover change–A case study of the Jinghe county, China. Ecol. Indic. 2021, 131, 108176. [Google Scholar] [CrossRef]
- Wang, Y.; Zhao, R.; Zhou, X.; Zhang, X.; Zhao, G.; Zhang, F. Prediction of potential distribution areas and priority protected areas of Agastache rugosa based on Maxent model and Marxan model. Front. Plant Sci. 2023, 14, 1200796. [Google Scholar] [CrossRef] [PubMed]
- Adams, V.M.; Pressey, R.L.; Naidoo, R. Opportunity costs: Who really pays for conservation? Biol. Conserv. 2010, 143, 439–448. [Google Scholar] [CrossRef]
- Sinden, J.A. Estimating the opportunity costs of biodiversity protection in the Brigalow Belt, New South Wales. J. Environ. Manag. 2004, 70, 351–362. [Google Scholar] [CrossRef]
- Rodrigues, A.; Rouyer, M.M. Measuring the ecological benefits of protected areas. Nature 2023, 622, 39–40. [Google Scholar] [CrossRef]
Figure 1.
Study area location.
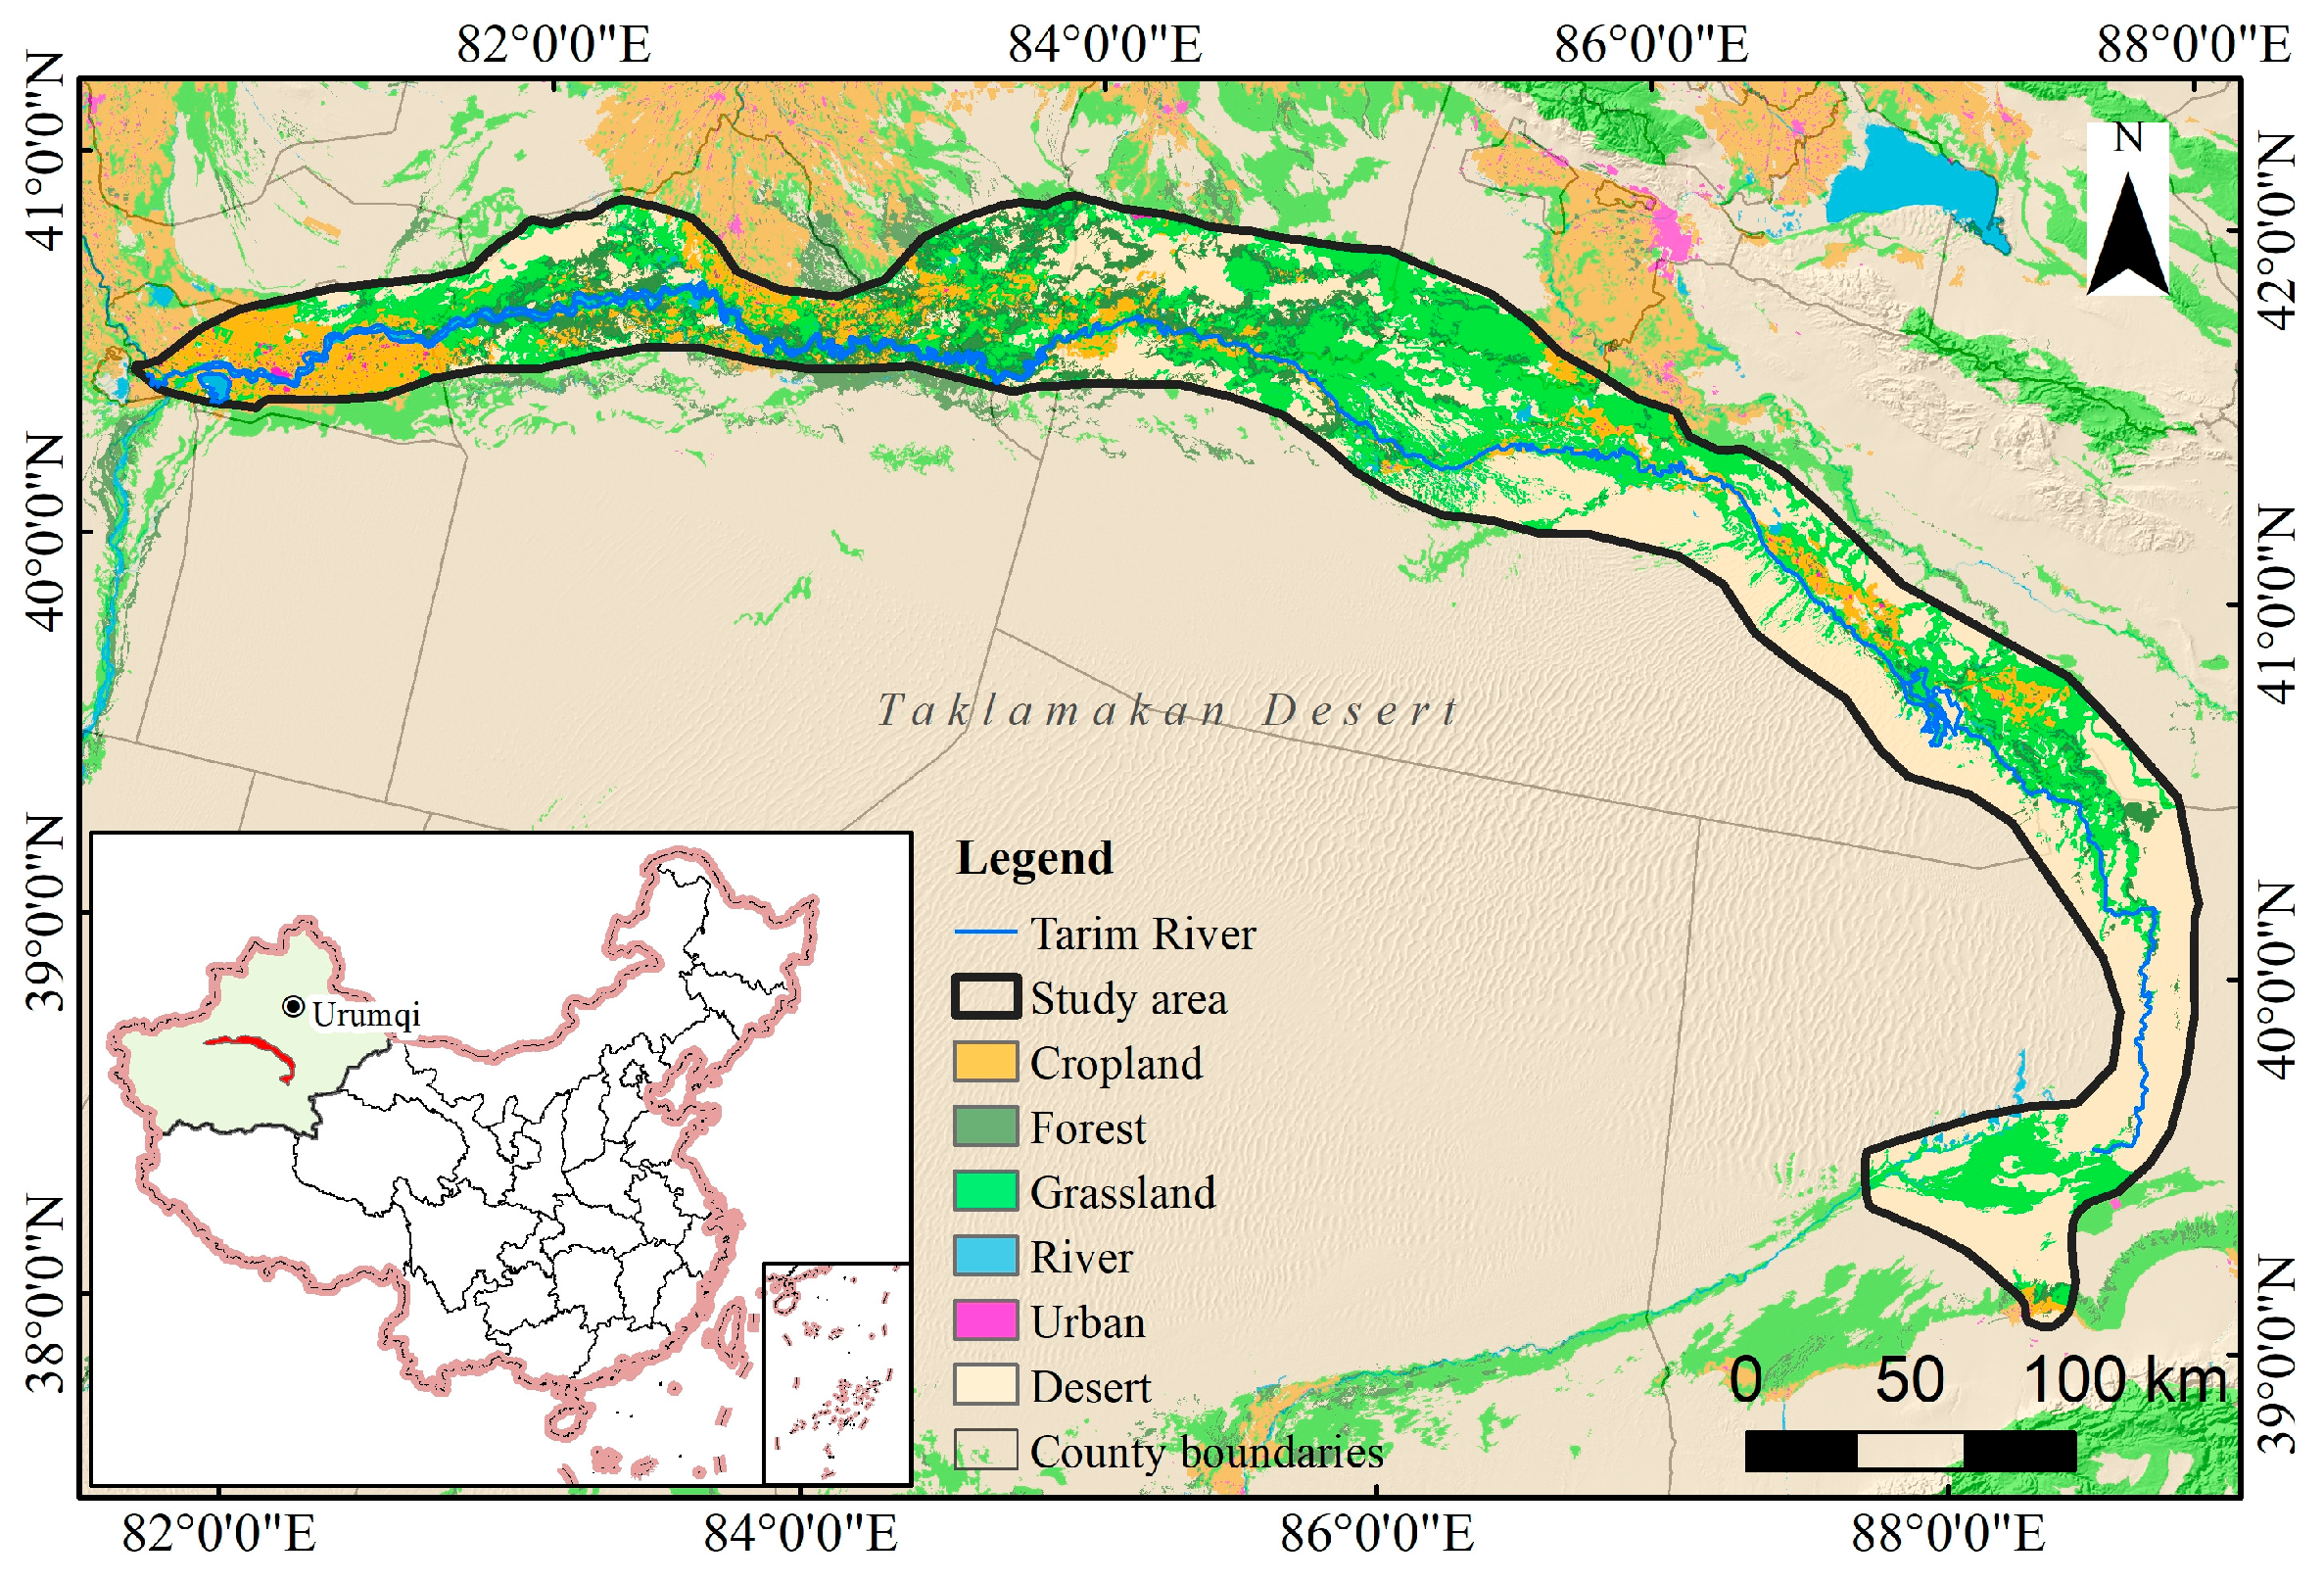
Figure 2.
The distribution of selected species.

Figure 3.
Spatial distribution of protected species and indicators of ecological importance.

Figure 4.
Conservation planning results for each protection scenario.

Figure 5.
Proportion of protected areas for protection objects in different scenarios.

Figure 6.
Protection benefit analysis of scenarios.
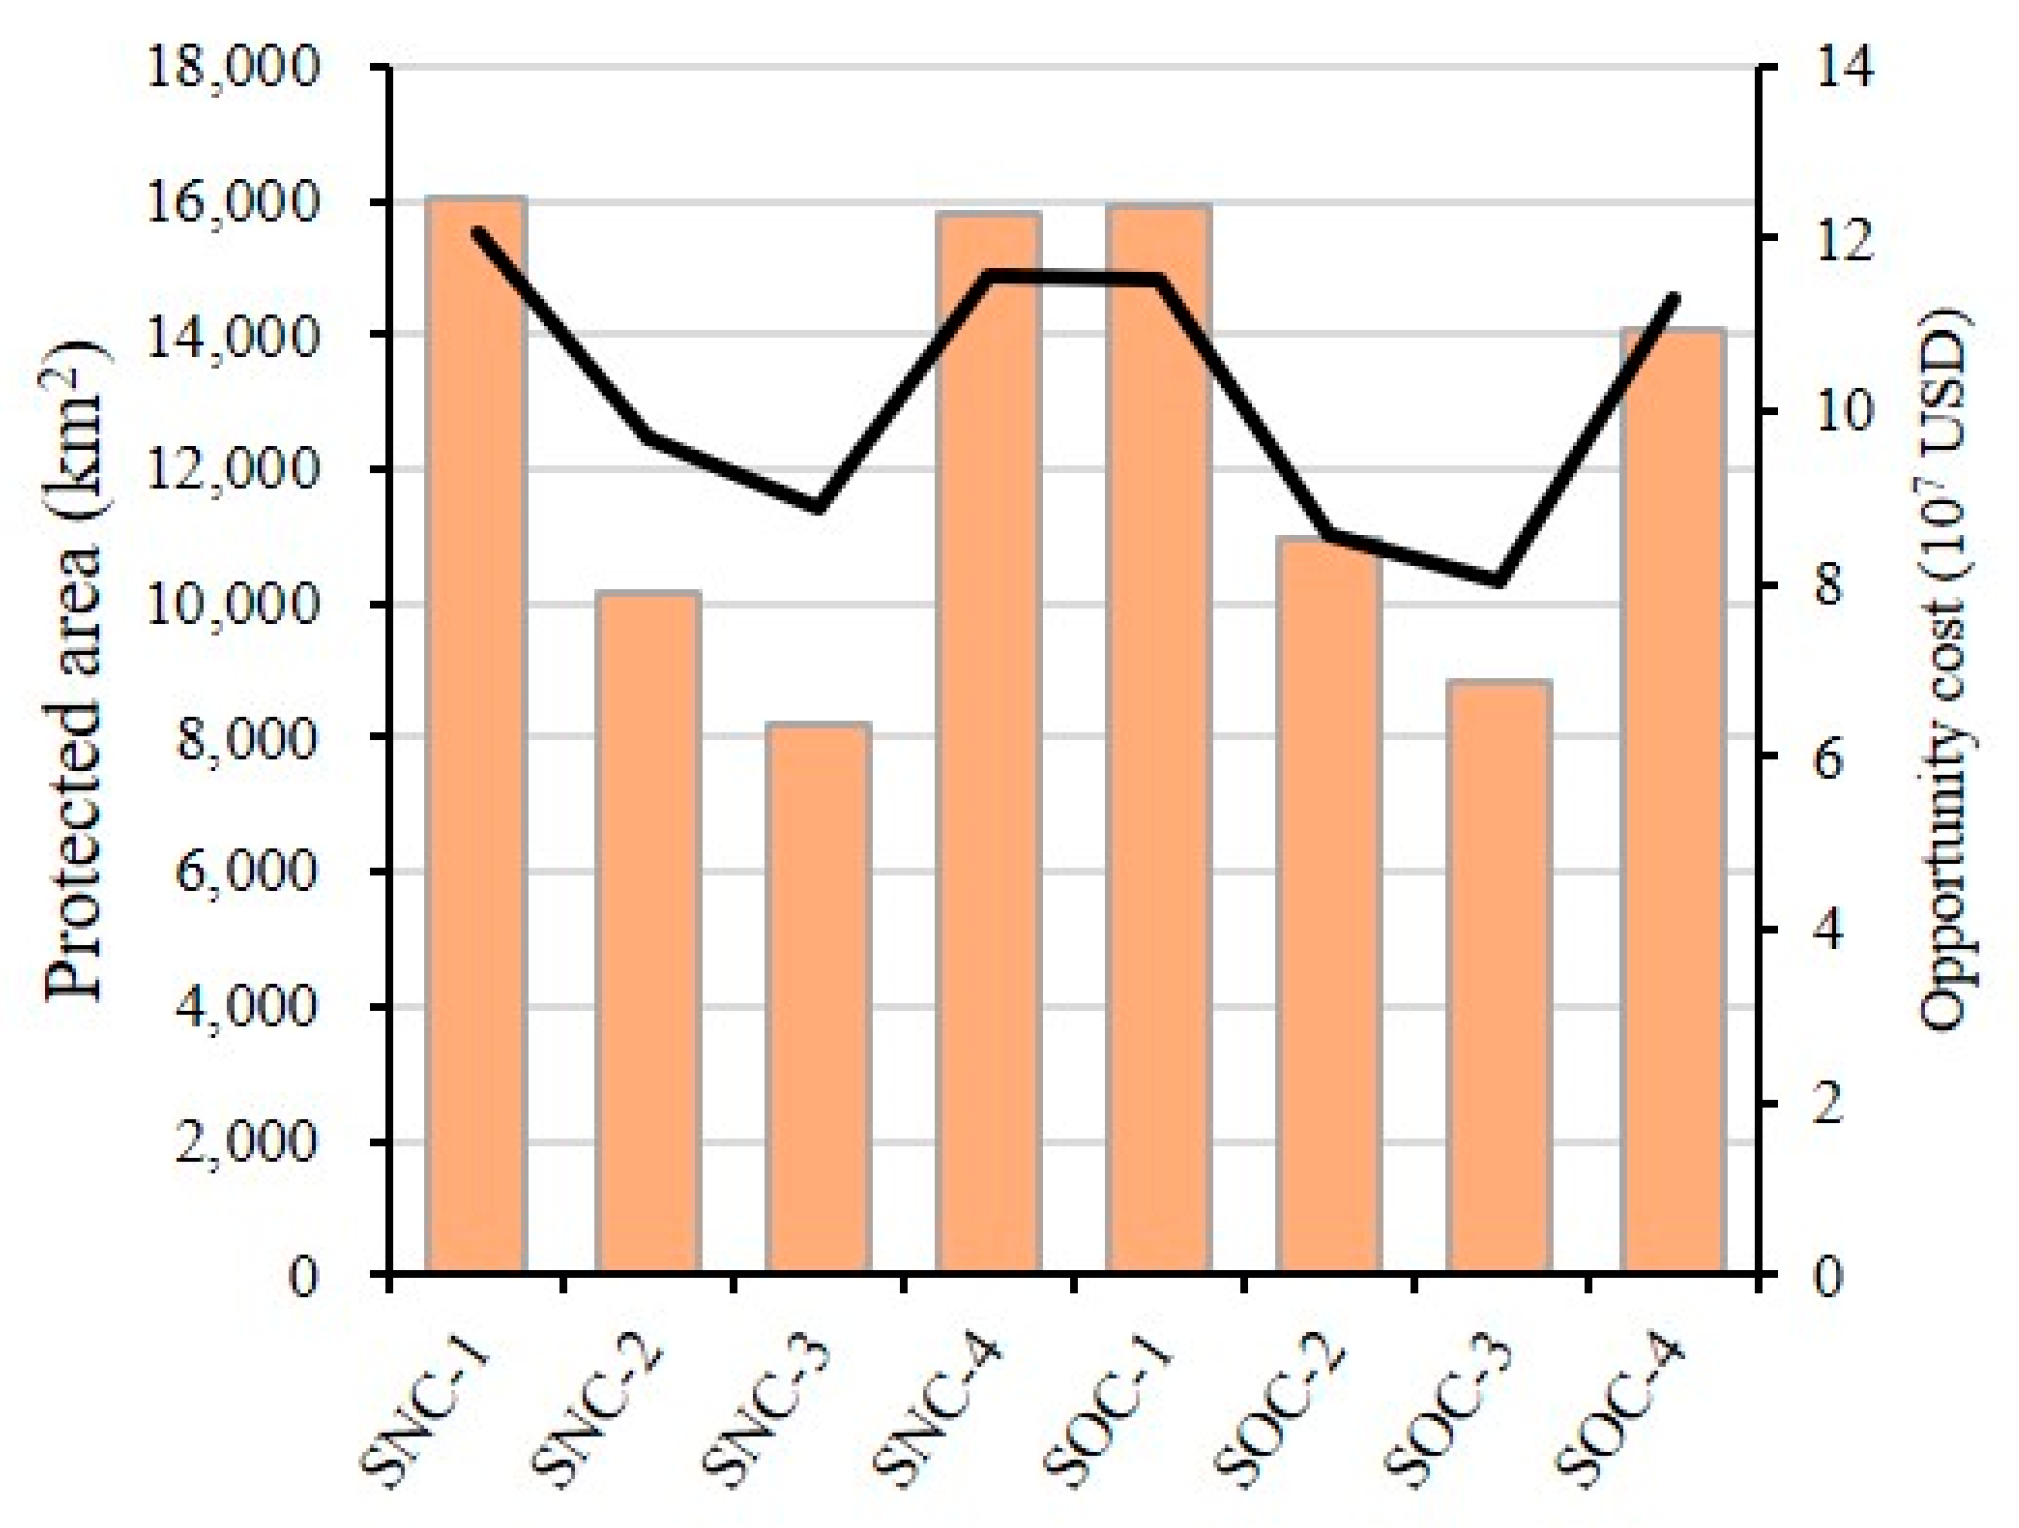
Figure 7.
Proposed boundary for Tarim National Park.

Table 1.
Evaluation index system for Tarim National Park.
| Indicator | Main Evaluation Indicator | Quantitative Indicator | Definition of Indicator |
|---|---|---|---|
| Representativeness | Ecosystem representation | Percentage of Populus euphratica | Ecosystems that represent regional traits, structure, and function. We used the unit’s Populus euphratica community proportion as a sample calculation. |
| Landscape value | Distribution of natural landscapes or geological sites | Regional natural landscape importance, uniqueness, and aesthetic or cultural value. | |
| Ecological significance | Authenticity | Aboveground biomass density | Ecosystem structure, function, health, and disparity with top communities. |
| Suitable habitat for flagship species | Habitat distribution of key protected species | Expression of regional ecological diversity, distribution of habitats of key species. | |
| Importance of ecological location | Ecosystem services | Reflecting ecosystems’ role in ecological equilibrium, human well-being, and sustainable development. | |
| Susceptibility to threats | Trends in fractional vegetation cover | Indicates the extent to which an environment or species faces external or internal pressures and dangers that could cause its demise. | |
| Feasibility | Feasibility of resource conservation | Existing foundations of the protected area | Clear land tenure and natural property rights are needed to protect and develop national parks. |
Table 2.
Protection scenario settings.
| Scenario Number | Protection Rule | Protection Object Selection and Protection Target | |||||
|---|---|---|---|---|---|---|---|
| 11010 | 11004 | 13003 | 21001 | 21003 | 31000 | ||
| SNC-1 | High-priority conservation targets for objects under the same costs | 60% | 50% | 50% | 50% | 50% | 50% |
| SNC-2 | Medium-priority conservation targets for objects under the same costs | 50% | 30% | 30% | 30% | 30% | 30% |
| SNC-3 | Medium-priority conservation targets for important species under the same costs | 40% | 30% | 30% | - | - | - |
| SNC-4 | High-priority conservation target only for Populus euphratica under the same costs | 60% | - | - | - | - | - |
| SOC-1 | High-priority conservation targets for objects under opportunity cost | 60% | 50% | 50% | 50% | 50% | 50% |
| SOC-2 | Medium-priority conservation targets for objects under opportunity cost | 50% | 30% | 30% | 30% | 30% | 30% |
| SOC-3 | Medium-priority conservation targets for important species under opportunity cost | 40% | 30% | 30% | - | - | - |
| SOC-4 | High-priority conservation target only for Populus euphratica under opportunity cost | 60% | - | - | - | - | - |
The presence of a “-” symbol indicates the absence of a designated protection target for the respective object. The code cross-references are defined as follows: Populus euphratica (11010), Cervus yarkandensis (11004), Lepus yarkandensis (13003), fractional vegetation cover (21001), aboveground biomass density (21003), four ecosystem services (31000), scenario not considering opportunity cost (SNC), and scenario considering opportunity cost (SOC).
Table 3.
Priority protection results and proportions of scenarios.
| Scenario Number | Protection Effects (%) | Protected Area (km2) | Protection Cost (104 USD) | |||||
|---|---|---|---|---|---|---|---|---|
| 11010 | 11004 | 13003 | 21001 | 21003 | 31000 | |||
| SNC-1 | 93.8 | 66.0 | 79.5 | 64.3 | 89.3 | 85.7 | 16,048.08 | 12,064.12 |
| SNC-2 | 46.9 | 30.9 | 27.0 | 23.2 | 32.4 | 55.2 | 10,130.31 | 9703.57 |
| SNC-3 | 35.5 | 24.4 | 23.9 | 16.3 | 28.5 | 32.8 | 8189.82 | 8897.62 |
| SNC-4 | 93.7 | 58.6 | 71.4 | 57.2 | 85.2 | 68.3 | 15,800.29 | 11,580.55 |
| SOC-1 | 92.2 | 65.0 | 76.8 | 82.1 | 80.4 | 70.8 | 15,901.20 | 11,514.18 |
| SOC-2 | 77.3 | 17.6 | 26.4 | 45.3 | 38.7 | 32.7 | 10,949.68 | 8570.46 |
| SOC-3 | 31.9 | 11.7 | 16.7 | 32.4 | 25.6 | 23.1 | 8842.86 | 8035.38 |
| SOC-4 | 95.3 | 34.2 | 42.2 | 52.3 | 88.7 | 73.4 | 14,087.62 | 11,320.33 |
The code cross-references are defined as follows: Populus euphratica (11010), Cervus yarkandensis (11004), Lepus yarkandensis (13003), fractional vegetation cover (21001), aboveground biomass density (21003), four ecosystem services (31000), scenario not considering opportunity cost (SNC), and scenario considering opportunity cost (SOC).
Disclaimer/Publisher’s Note: The statements, opinions and data contained in all publications are solely those of the individual author(s) and contributor(s) and not of MDPI and/or the editor(s). MDPI and/or the editor(s) disclaim responsibility for any injury to people or property resulting from any ideas, methods, instructions or products referred to in the content. |
© 2024 by the authors. Licensee MDPI, Basel, Switzerland. This article is an open access article distributed under the terms and conditions of the Creative Commons Attribution (CC BY) license (https://creativecommons.org/licenses/by/4.0/).
Share and Cite
MDPI and ACS Style
Zhang, X.; Zhang, L.; Zhang, Z. Spatial Optimization Based on the Trade-Off between Ecosystem Conservation and Opportunity Cost of Tarim National Park in Xinjiang, China. Land 2024, 13, 121. https://doi.org/10.3390/land13010121
AMA Style
Zhang X, Zhang L, Zhang Z. Spatial Optimization Based on the Trade-Off between Ecosystem Conservation and Opportunity Cost of Tarim National Park in Xinjiang, China. Land. 2024; 13(1):121. https://doi.org/10.3390/land13010121
Chicago/Turabian StyleZhang, Xinyuan, Lu Zhang, and Zhiming Zhang. 2024. "Spatial Optimization Based on the Trade-Off between Ecosystem Conservation and Opportunity Cost of Tarim National Park in Xinjiang, China" Land 13, no. 1: 121. https://doi.org/10.3390/land13010121
Note that from the first issue of 2016, this journal uses article numbers instead of page numbers. See further details here.