Article

An Inquiry into the Characteristics of Carbon Emissions in Inter-Provincial Transportation in China: Aiming to Typological Strategies for Carbon Reduction in Regional Transportation

School of Architecture, Tianjin University, Tianjin 300072, China
*
Author to whom correspondence should be addressed.
Land 2024, 13(1), 15; https://doi.org/10.3390/land13010015
Submission received: 1 December 2023 / Revised: 14 December 2023 / Accepted: 18 December 2023 / Published: 20 December 2023
(This article belongs to the Special Issue Regional Sustainable Management Pathways to Carbon Neutrality)

Abstract

:
The low-carbon development of the transportation sector is crucial for China to achieve its national goals of carbon peaking and carbon neutrality. Since China is a vast country with unbalanced regional development, there are considerable differences in the levels of carbon dioxide emissions from the transportation sector across regions. Therefore, revealing the influencing factors that shape the characteristics of transportation carbon dioxide emissions (TCO2) can inform tailored sub-national carbon reduction strategies based on local conditions, which is an important technical approach for achieving national goals. Based on an extended Kaya identity, we derived indicators of the impacts on provincial TCO2 from factors such as economic development, population density, energy structure, transportation efficiency, technology research and development (R&D), infrastructure construction, transportation operation conditions, and residents’ transportation behavior. Using a multi-indicator joint characterization method, we explored the characteristics of provincial TCO2 in China in 2019. By applying Ward’s method to hierarchical clustering, the thirty provinces of China were classified into six characteristic types (Types I to VI). Based on the total TCO2 (TC), the intensity of TCO2 (TI), and the per capita TCO2 (TP) calculated for each province in 2019, the priority control directions and indicators for carbon reduction in each type were obtained through relative relationships with provincial averages and correlation analysis with the indicators. Specifically, Type I and Type IV can be categorized as TP-controlled, Type II and Type III as TC-controlled, and Type V and Type VI as TI-controlled. Finally, we provided typological strategies and key performance indicators (KPIs) relevant to local governments to better achieve carbon reduction goals in each provincial type. It can promote cooperative development and collaborative governance in carbon reduction across regions and the unified implementation of China’s dual-carbon goals.

1. Introduction

Practicing low-carbon development to mitigate increasingly severe global climate change has become an important international consensus. The transportation sector is a major contributor to global CO2 emissions. In 2021, CO2 emissions from the transportation sector reached 7.7 billion metric tons, which accounted for 25% of the total global CO2 emissions [1]. Therefore, the transportation sector is a key industry for achieving global carbon reduction goals [2,3,4,5]. As the world’s largest greenhouse gas emitting country [5,6,7], China’s transportation carbon dioxide emissions (TCO2) rank third nationally across all sectors [7,8,9,10]. According to International Energy Agency predictions, China’s TCO2 is predicted to account for more than one-third of global transportation emissions by 2035 [11]. Meanwhile, as the largest developing country, China’s TCO2 is expected to continue growing rapidly, making it a key sector for achieving the goals of carbon peaking and carbon neutrality [5,7].
As subordinate units tasked with achieving China’s national low-carbon goals, provincial administrations play an overarching institutional role in planning and coordination. China’s vast geographic expanse has resulted in significant objective differences across provinces in factors like economic development, population distribution, resource endowments, and urbanization levels. This has led to considerable variability in CO2 emission levels across provincial transportation sectors [12]. Therefore, an in-depth analysis of inter-provincial differences in the transportation sector, using scientific and rational methods to reveal characteristics of provincial TCO2, followed by tailored carbon reduction strategies for different characteristic regions, is the basic premise and important guarantee for effectively achieving low-carbon transportation development goals.
The provincial TCO2 characteristics described in this study refer to the combination of multiple influencing factors affecting the direct quantity of TCO2, including influencing factors affecting the total TCO2 (TC), the intensity of TCO2 (TI), the per capita TCO2 (TP), etc., which can effectively reflect the systematic characteristics of inter-provincial transportation sectors in aspects such as economy, energy, efficiency, technology, infrastructure, operation, and so on. Due to the necessity and urgency of understanding inter-provincial TCO2 characteristics, scholars have conducted extensive research on this topic in recent years, which can be summarized into three aspects: direct quantity characteristics, correlated quantity characteristics, and influencing factor characteristics. (1) Direct quantity characteristics refer to revealing spatial distribution characteristics of the direct quantity of TCO2 [13,14,15], spatial correlation characteristics [16], and their evolutionary patterns [17], based on provincial TCO2 accounting. (2) Correlated quantity characteristics refer to characteristics reflecting specific aspects that influence the direct quantity of TCO2, such as transportation CO2 emission efficiency [18,19,20,21], TCO2 reduction potential [7], inter-provincial intelligent transportation characteristics [22], and carbon reduction effects of transportation structure adjustments [23]. (3) Influencing factor characteristics involve a more comprehensive and detailed description of inter-provincial TCO2 characteristics by exploring the factors that influence the direct quantity of TCO2. Existing studies mainly adopt econometric models like multivariate regression, panel data models, and extended models based on factors such as Kaya identity, IPAT, and STIRPAT to reveal the influencing factors of the direct quantity of TCO2. Furthermore, factor decomposition models (e.g., Laspeyres index decomposition, Divisia index decomposition, LMDI, generalized fisher index decomposition) are also applied to study the impacts of influencing factors on the direct quantity of TCO2.
Existing studies have explored the macro-level influencing factors of TCO2 characteristics, including economic development level, population size, transportation energy intensity, transportation energy structure, transportation intensity, and industrial structure [5,24,25,26]. Additionally, studies have examined the impacts of transportation infrastructure development, such as urbanization rate, fixed asset investment in the transportation industry [27,28], length of road network [29,30,31], level of public transportation development [32,33], per capita private car ownership, passenger and freight turnover [34,35], average transportation distance [36], logistics scale, and express delivery industry development [37,38]. Furthermore, the impacts of transportation technology level and new energy industry planning have been investigated, such as R&D investment [39,40], level of digital innovation [41], and new energy vehicle industry [42], etc.
In summary, although existing studies on inter-provincial TCO2 characteristics have gradually become more comprehensive in coverage, more detailed in evaluation indicators, and clearer in understanding the relationships, this study of CO2 emissions in the transportation sector is a complex system with numerous influencing factors. The selection of evaluation indicators needs to balance comprehensiveness and feasibility, and the classification of characteristics needs to assist in coordinating the advantages and disadvantages of provinces in low-carbon transportation development. Otherwise, only broad and general conclusions can be drawn, which is not conducive to the implementation of carbon reduction actions by provinces or regional cooperation and coordinated governance. Moreover, macro-level indicators used in existing research, in order to have a strong mathematical relationship with TCO2, tend to be broader and more general in terms of coverage (i.e., evaluation indicators have macroscopic and comprehensive characteristics), which correspondingly may sacrifice the coverage of indicator content and the directedness of regulatory mechanisms.
Compared to existing research, this study makes the following contributions: (1) A multi-indicator joint characterization method is proposed to reveal provincial TCO2 characteristics comprehensively. (2) The coverage of provincial TCO2 characteristics is expanded by adding indicators for urban and county population density levels (UPL), transportation operation pressure (TOP), and resident living consumption levels (RLC). (3) The hierarchical clustering categorization effectively reveals provincial advantages and disadvantages in TCO2 characteristics, which facilitates cooperation and coordinated governance across Chinese regions. (4) Characteristic indicators have an important integrating function, combining to reflect the inter-provincial TCO2 characteristics, the evaluation criteria for the classification of characteristic types, and directly corresponding to typological carbon reduction measures and key performance indicators (KPIs).

2. Materials and Methods

This study proposes a multi-indicator joint characterization method to construct evaluation indicators and typological categorization of inter-provincial TCO2 characteristics in China, aiming to establish carbon reduction strategies supporting provincial differentiation and regional collaboration. The methods used in this study can be divided into five steps: (1) a multi-indicator joint characterization method; (2) hierarchical cluster analysis following Ward’s method; (3) analysis of provincial type characteristics; (4) TCO2 accounting and their correlation analysis with indicators; (5) carbon reduction strategies and KPIs for provincial types. Figure 1 illustrates the procedures, methods, and contents for achieving the research objectives. The overall research framework adopted this approach to measure sub-national TCO2 characteristics, categorize types, and formulate carbon reduction strategies, which is applicable to studies of other countries and regions with similar needs and data sources for carbon reduction.

2.1. Data Sources

As China was affected by the COVID pandemic, the data from 2020 to 2022 are expected to be less representative, so this study uses the data from 2019 for the calculation of the indicators. Among them, TES, TEE, and RDL are from the China Transport Statistical Yearbook 2019 and China Energy Statistical Yearbook 2020. The other six indicators are from the China Statistical Yearbook 2020. Due to missing energy data or statistical calibration differences, Tibet, Hong Kong, Macau, and Taiwan are excluded from the study sample.
It is worth noting that in China, the transportation, storage, and postal sectors are commonly perceived as a unified industrial entity due to historical continuity, functional interconnections, management efficiency, and industry characteristics. This integration is aimed at enhancing regulatory oversight and operational coordination. Therefore, in this study, when referring to the transportation sector, we specifically denote transportation, storage, and postal services. This approach is adopted to comprehensively consider the impact and role of these sectors in carbon emissions.

2.2. Multi-Indicator Joint Characterization Method for Provincial TCO2 Characteristics

2.2.1. Construction Process of Characteristic Indicators

The Kaya identity establishes mathematical relationships among factors like population, energy, economy, and CO2 emissions [43]. Due to its simple structure and convenient operation, it can fully decompose CO2 emissions structurally and is often used to build relationships between CO2 emissions and influencing factors. The equation can be expressed as follows:
C = C P E × P E G D P × G D P P × P
where C represents total CO2 emissions, P E represents total energy consumption, G D P represents gross domestic product, and P represents total population. In this study, CO2 emissions from transportation sector energy consumption are determined by extending the Kaya equation to identify influencing factors. Then Formula (1) can be expanded as:
C i = k = 1 n C i k E i k × E i k E i × E i G D P i × G D P i T S i × T S i S B i × S B i W i × W i P i × P i
where i represents the thirty provinces in China, k represents the n types of energy consumed in the transportation sector, C i k represents the CO2 emissions of energy type k in province i , E i k represents the consumption of energy type k in province i , C i k / E i k represents the CO2 emission coefficient of energy type k , E i represents the total energy consumption of the transportation sector in province i , E i k / E i represents the energy structure of the transportation sector in province i , G D P i represents the added value of transportation, storage and post in province i , E i / G D P i represents the energy consumption per unit added value of the transportation sector in province i (i.e., transportation energy intensity), T S i represents the area of transportation infrastructure in province i , G D P i / T S i represents the economic returns per unit area of transportation infrastructure (i.e., transportation economic output intensity), S B i represents the built-up area in province i , T S i / S B i is the proportion of transportation infrastructure area to built-up area, representing the level of transportation infrastructure construction in province i , W i represents the total transportation pollutants in province i , S B i / W i is the reciprocal of built-up area per unit transportation pollutants, with the ratio relationship reflecting transportation pollution intensity in province i , and P i represents the year-end population in province i , W i / P i represents per capita transportation pollutants, indicating the pollution intensity of resident transportation behaviors in province i .

2.2.2. Definition of Characteristic Indicators

Based on the identified influencing factors of TCO2 described above and referring to evaluation indicators corresponding to influencing factors in existing studies [5,9,17,24,25,26,27,32,33,39,44,45], this study adopts a multi-indicator joint characterization method and constructs nine characteristic indicators to reveal provincial TCO2 characteristics (Table 1).
To eliminate unfairness caused by inter-provincial differences as well as dimensional and quantitative differences among indicators, indicator values are quantified by the ratio of provincial value to provincial average. Indicator values less than or equal to 1 indicate the provincial characteristic is below or equal to the national average, and vice versa. This method of index construction enables the monitoring of current deficiencies in governmental low-carbon actions and the identification of existing measures with poor implementation effectiveness.
For indicators involving multiple sub-contents, weights are assigned for definition. The two sub-contents of RCL, TOP, and RLC are assigned equal importance weights of 0.5. For the three sub-contents of PTL, weights are assigned based on generality and relative importance (Table 1).

2.3. Hierarchical Cluster Analysis following Ward’s Method

Cluster analysis provides means of data dimensionality reduction and visualization, representative sample screening, and enables scientific classification and grouping of data, thus revealing similarities and differences among provinces and promoting cooperation and coordinated governance across regions. Before cluster analysis, this study standardized the indicators. The value range of the constructed characteristic indicators is [0, ∞]. To eliminate the negative effects of excessive outliers and facilitate effective interpretation of indicator meanings, this study assigned a value of 2 to all indicators greater than 2. Thus, the indicator value range is [0, 2]. An indicator value of 2 indicates the provincial characteristic is far above the provincial average level. Based on validation with our existing study [47], the maximum value control approach has good effects on the stability of type division and eliminates potential unfairness in inter-provincial policy allocation.
Hierarchical clustering is the most widely used clustering method [48]. Each sample starts as its own cluster, and at each iteration of the algorithm, clusters with high similarity are merged. This process repeats until a preset number of clusters is reached or only one cluster remains. Since this method does not require pre-classification, it is suitable for classification decisions combining subjective and objective factors. In hierarchical cluster analysis, Ward’s method [49] uses squared Euclidean distance as the distance between categories, emphasizing smaller internal differences within the same category and greater differences between different categories. Therefore, this study applies Ward’s method to the nine characteristic indicators across thirty Chinese provinces, which can effectively reveal similarities and differences in provincial TCO2 characteristics.

2.4. Transportation CO2 Emissions Calculation Methods

To ensure the convenience and accuracy of calculations, this study is based on the IPCC guidelines [50] and the research of Shan et al. [51] for TCO2 calculations. TC from the transportation sector is the sum of direct CO2 emissions from fossil energy consumption in the transportation sector (not including indirect emissions from electricity consumption) and CO2 emissions from gasoline and diesel consumption related to residential life. TI is the ratio of TC to the value-added of the transportation sector. TP is the ratio of TC to the year-end population of the province.
Total CO2 emissions from the transportation sector are calculated as follows:
C = C F t r + C F l i    
where C represents total CO2 emissions from the transportation sector, C F t r represents CO2 emissions from fossil fuel consumption in the transportation sector, and C F l i represents CO2 emissions from fossil fuel consumption in transportation activities in residential life.
The CO2 emissions from fossil energy consumption in the transportation sector are calculated as follows:
C F = j n E j × N C V j × C C j × O j  
In the C F t r CO2 emission calculations, E j represents the total consumption of fossil fuel type j , involving raw coal, cleaned coal, other washed coal, briquettes, coke oven gas, gasoline, kerosene, diesel oil, fuel oil, lubricants, liquefied petroleum gas, natural gas, and other energy sources. N C V j represents the net calorific value of different energy types, i.e., the heat value generated per physical unit of fuel combusted. C C j (carbon content) is the CO2 emissions per unit of net calorific value generated by fuel j . O j represents the oxidation rate during fuel combustion. For C F l i , only CO2 emissions from transportation-related gasoline and diesel oil consumption are calculated for urban and rural residents.

2.5. Correlation Analysis between Characterization Indicators and the Direct Quantity of TCO2

Correlation analysis is a commonly used method for discovering associations between things. Among them, the Pearson correlation coefficient method [52] can examine the linear correlation between variables, measured on a scale from −1 to +1. It reflects both the directionality of the co-variation between two variables as well as the extent of it. A value of 0 indicates no correlation; positive values denote positive correlation; and negative values mean negative correlation. The larger the absolute value, the stronger the correlation. This method has been widely applied across numerous fields and disciplines. In this study, the Pearson correlation coefficient method was used to analyze the correlations between the direct quantity of TCO2 (TI and TP) in thirty provinces of China and the original values of nine selected feature indicators (i.e., values greater than two were retained). The aim was to determine the degree of correlation between variables and provide more accurate references for implementing carbon reduction measures.

3. Results and Discussion

3.1. Results of Characteristic Indicator Calculation and Cluster Analysis

After calculating the nine characteristic indicators across thirty Chinese provinces in 2019, this study conducted standardization processing on the indicator values (i.e., defining maximum indicator values), so the value range of the characteristic indicators is [0, 2]. See Appendix A, Table A1. This study performed hierarchical cluster analysis with Ward’s method on the characteristic indicators across thirty provinces using SPSS Statistics 25 software to obtain the classification dendrogram of provinces and divided the thirty Chinese provinces into six types by the vertical line segmentation method (Figure 2).

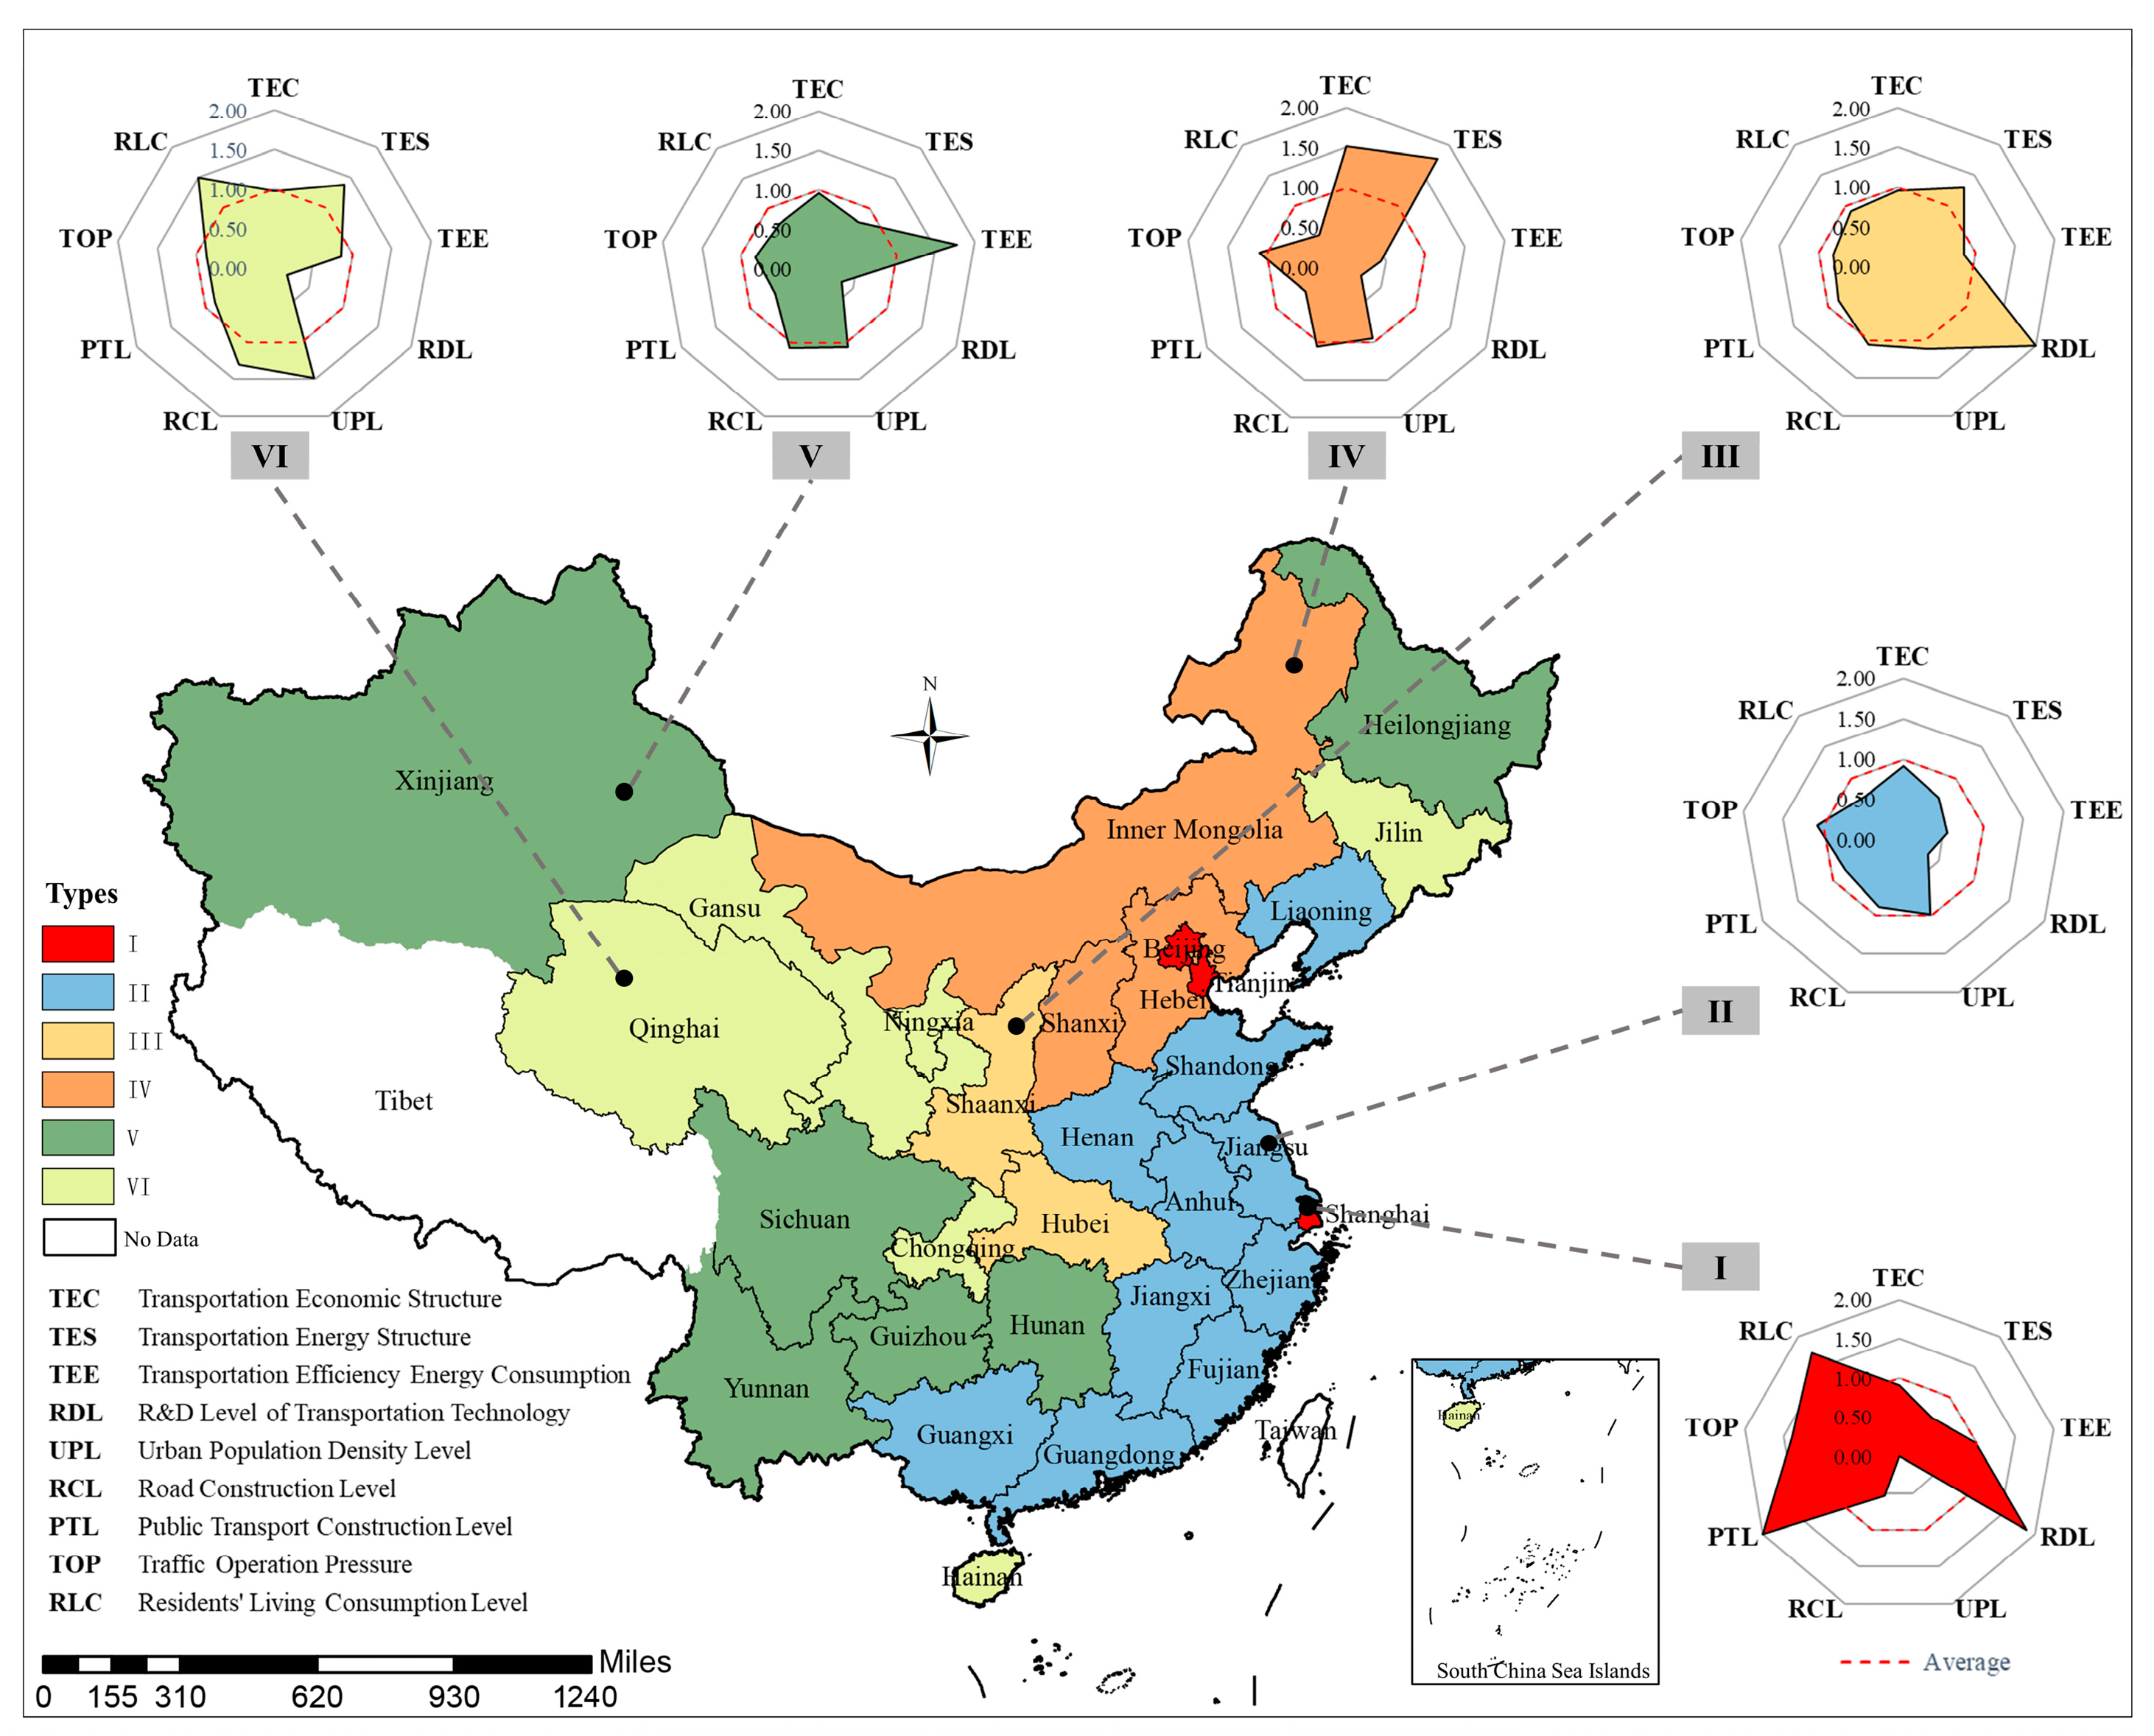
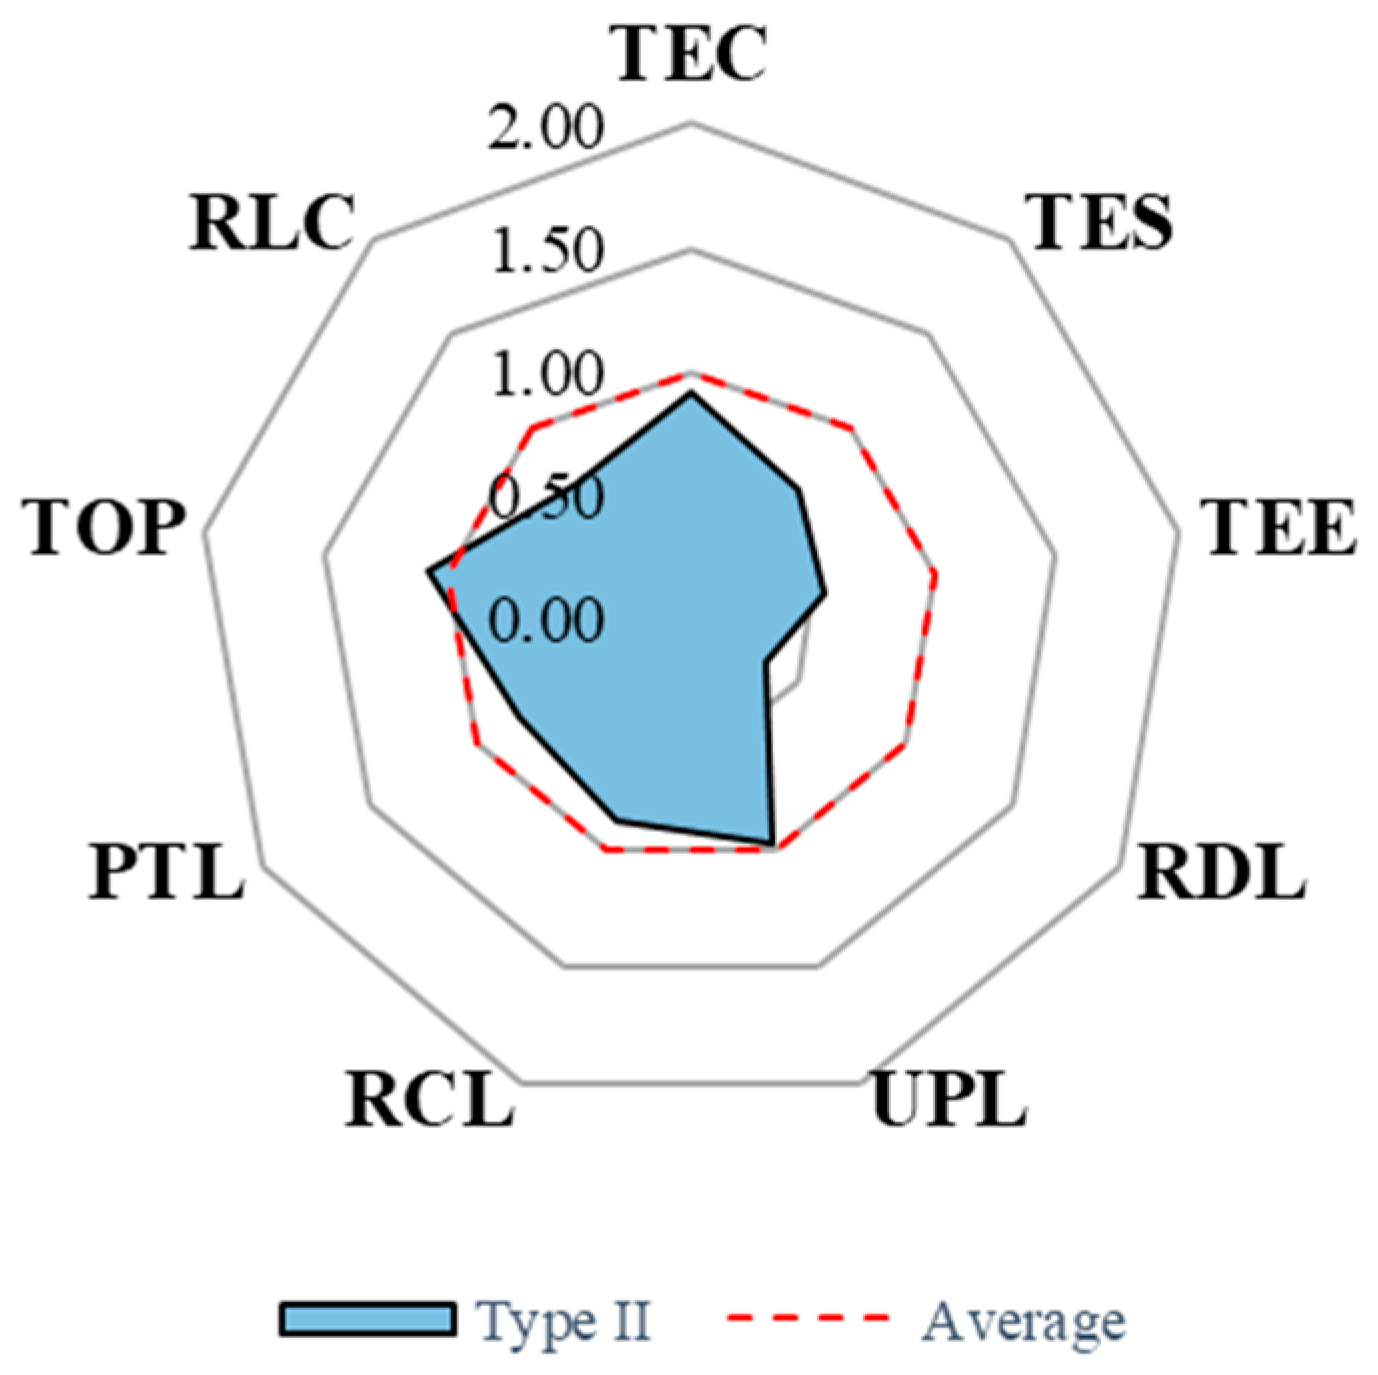
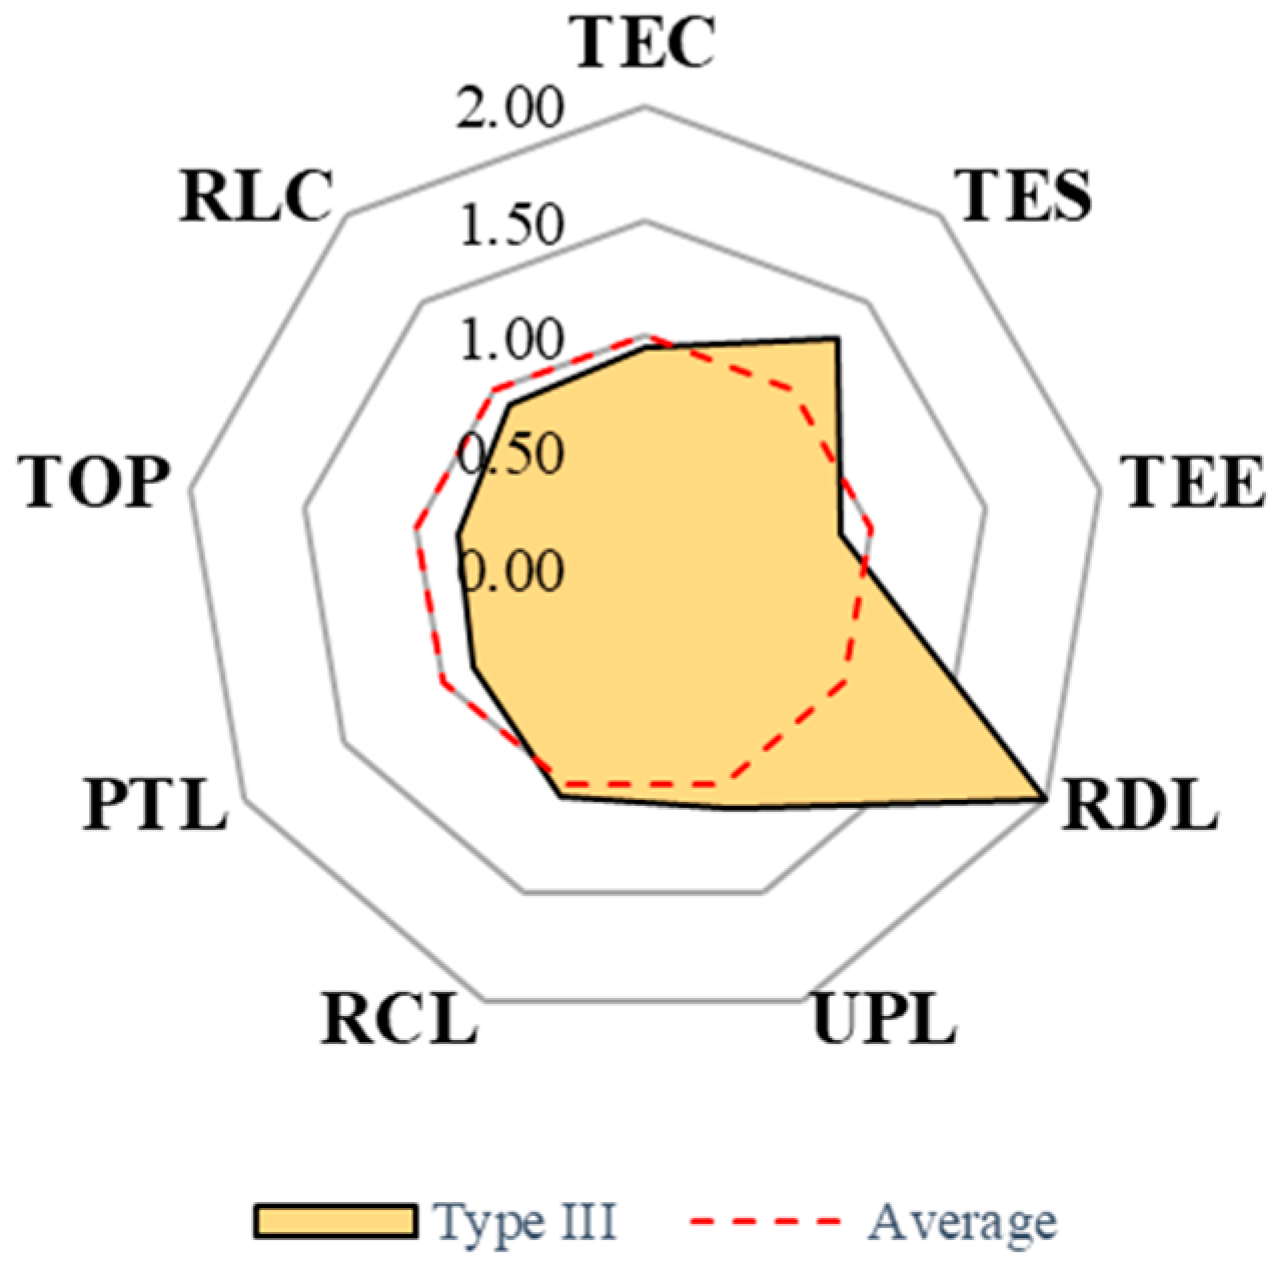
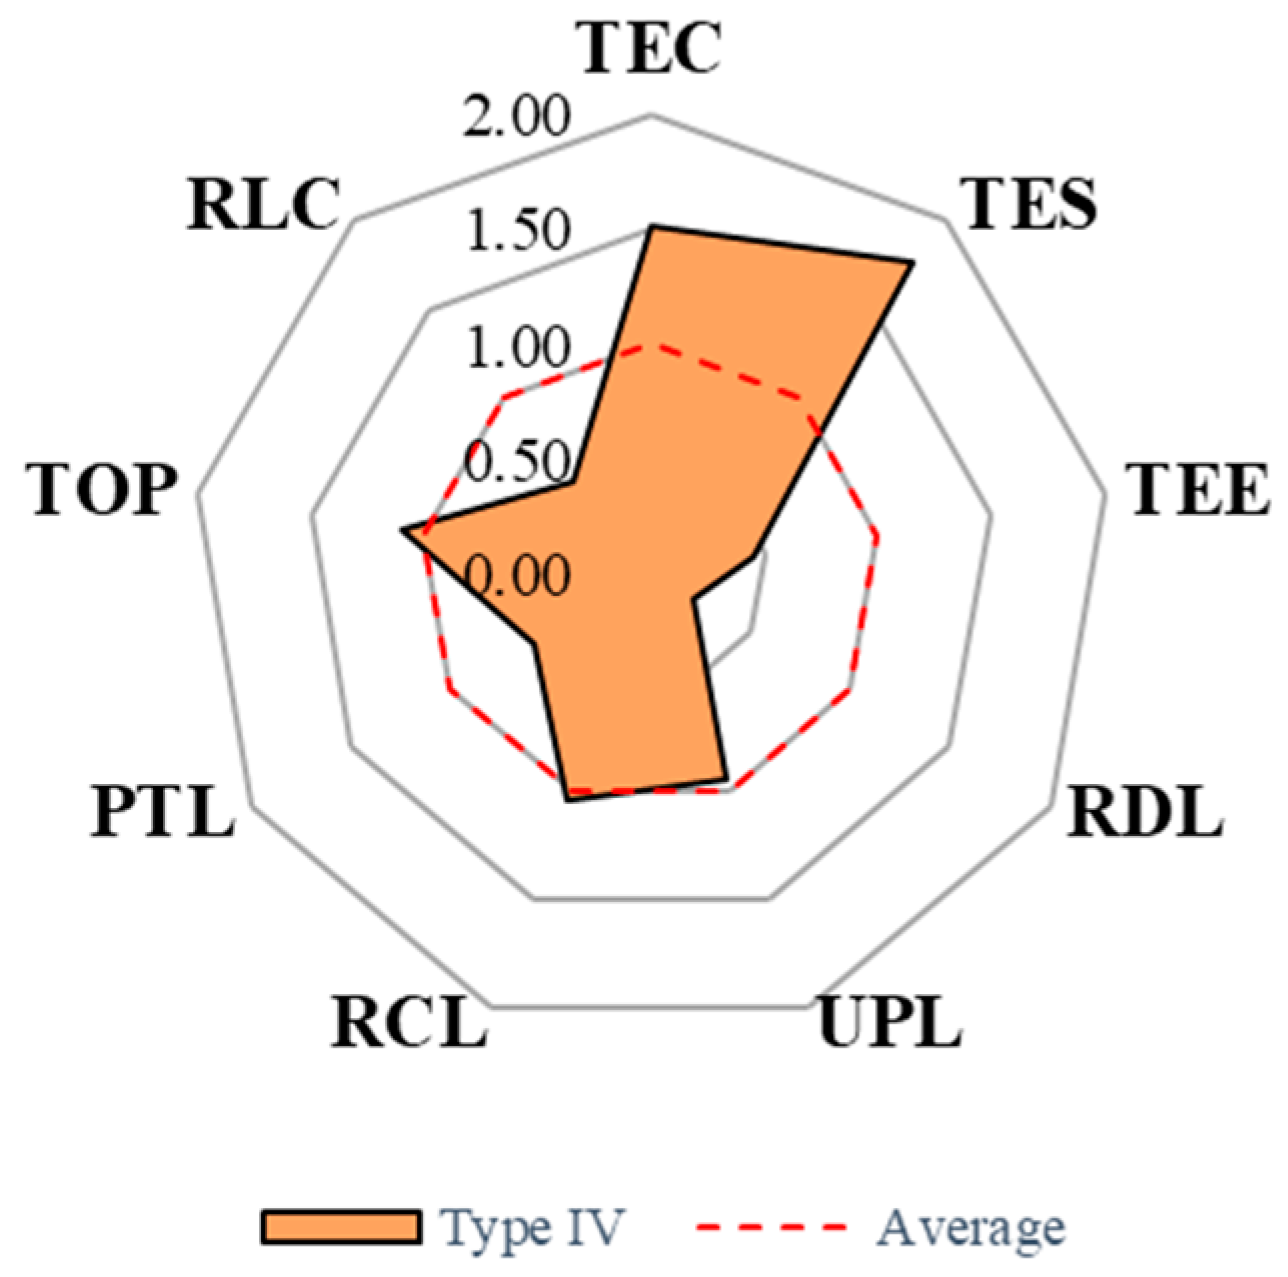
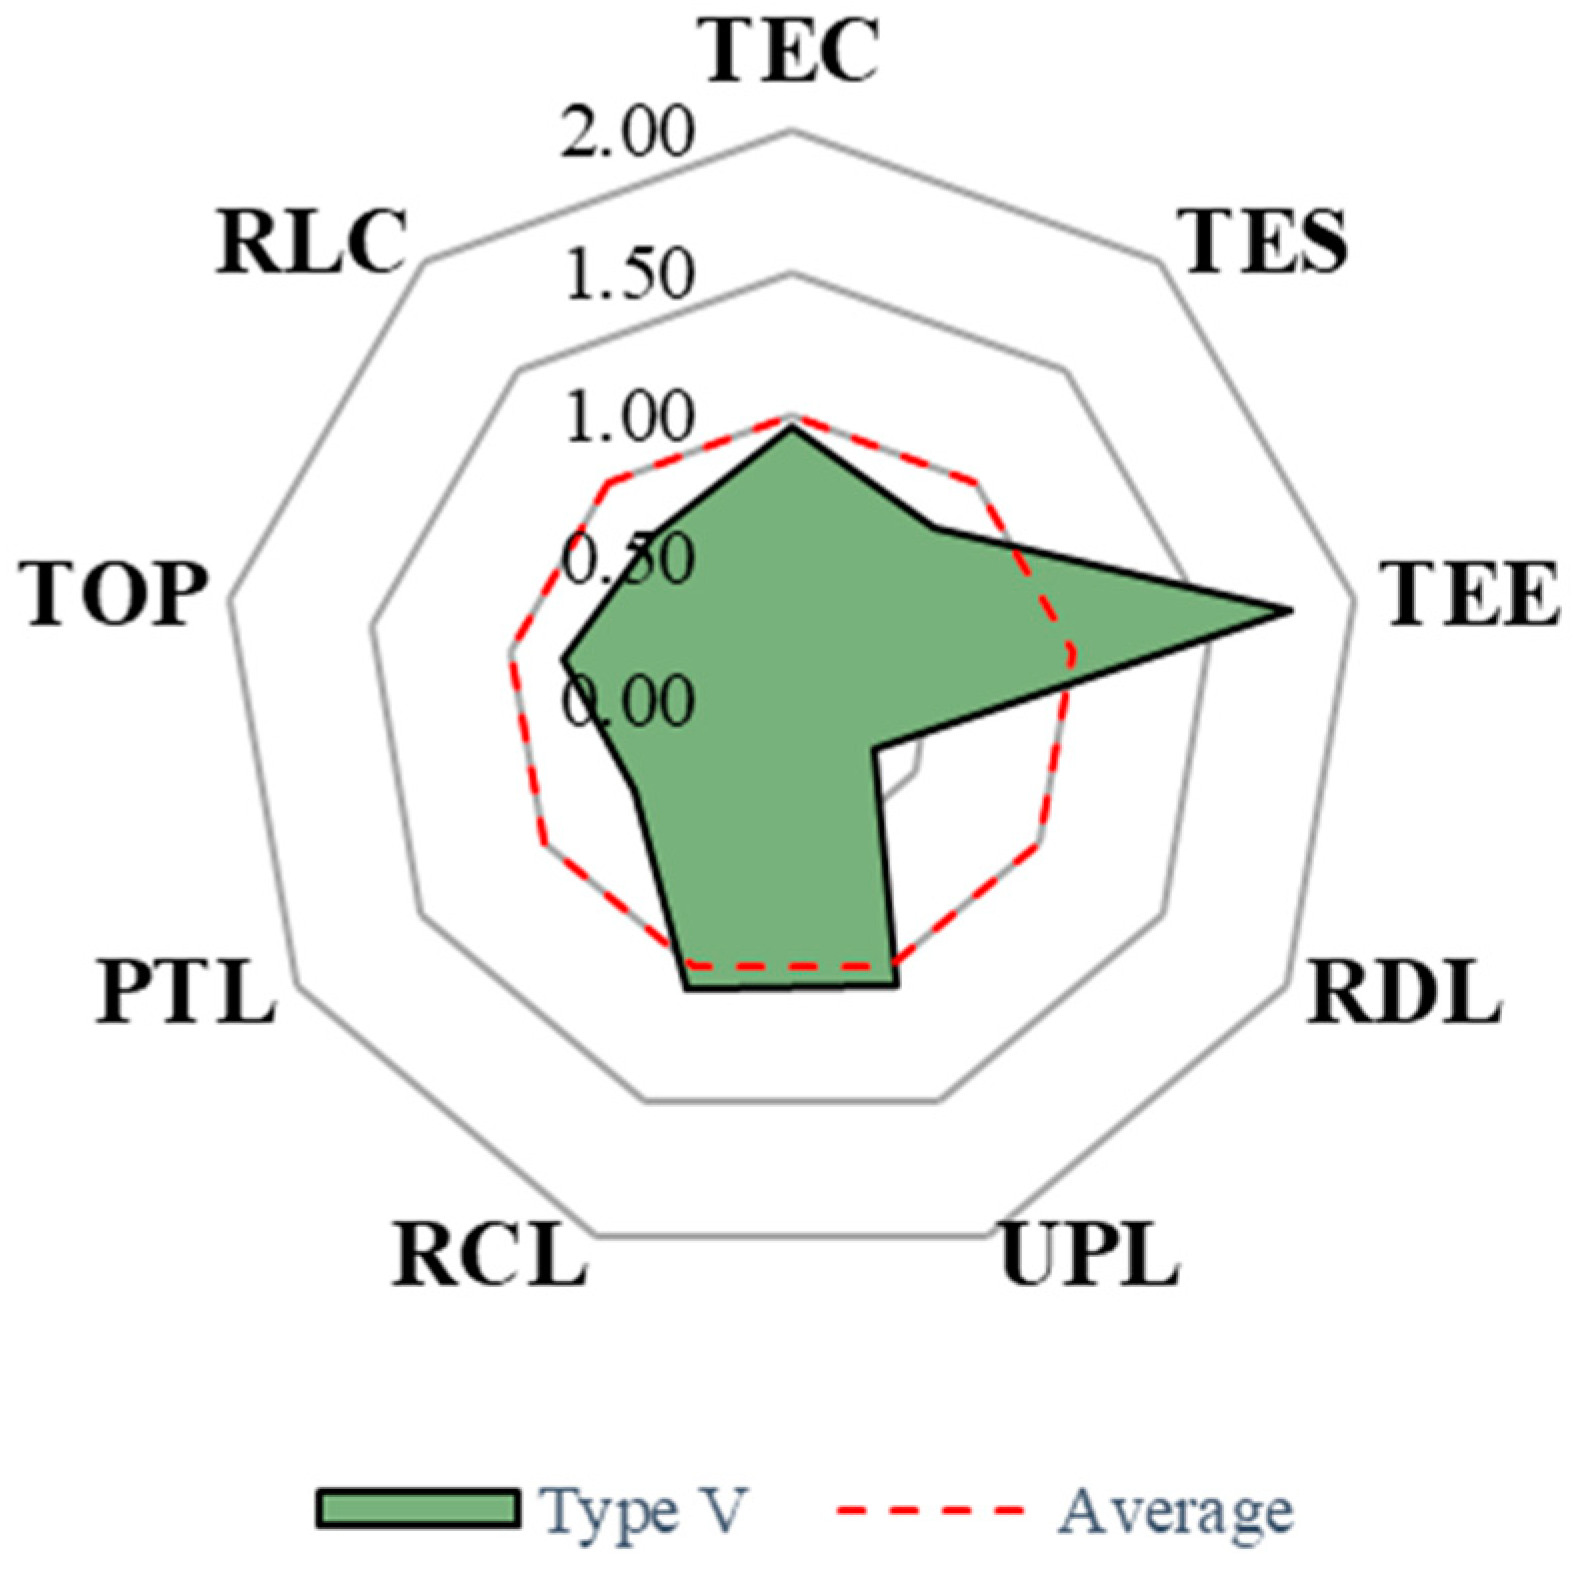
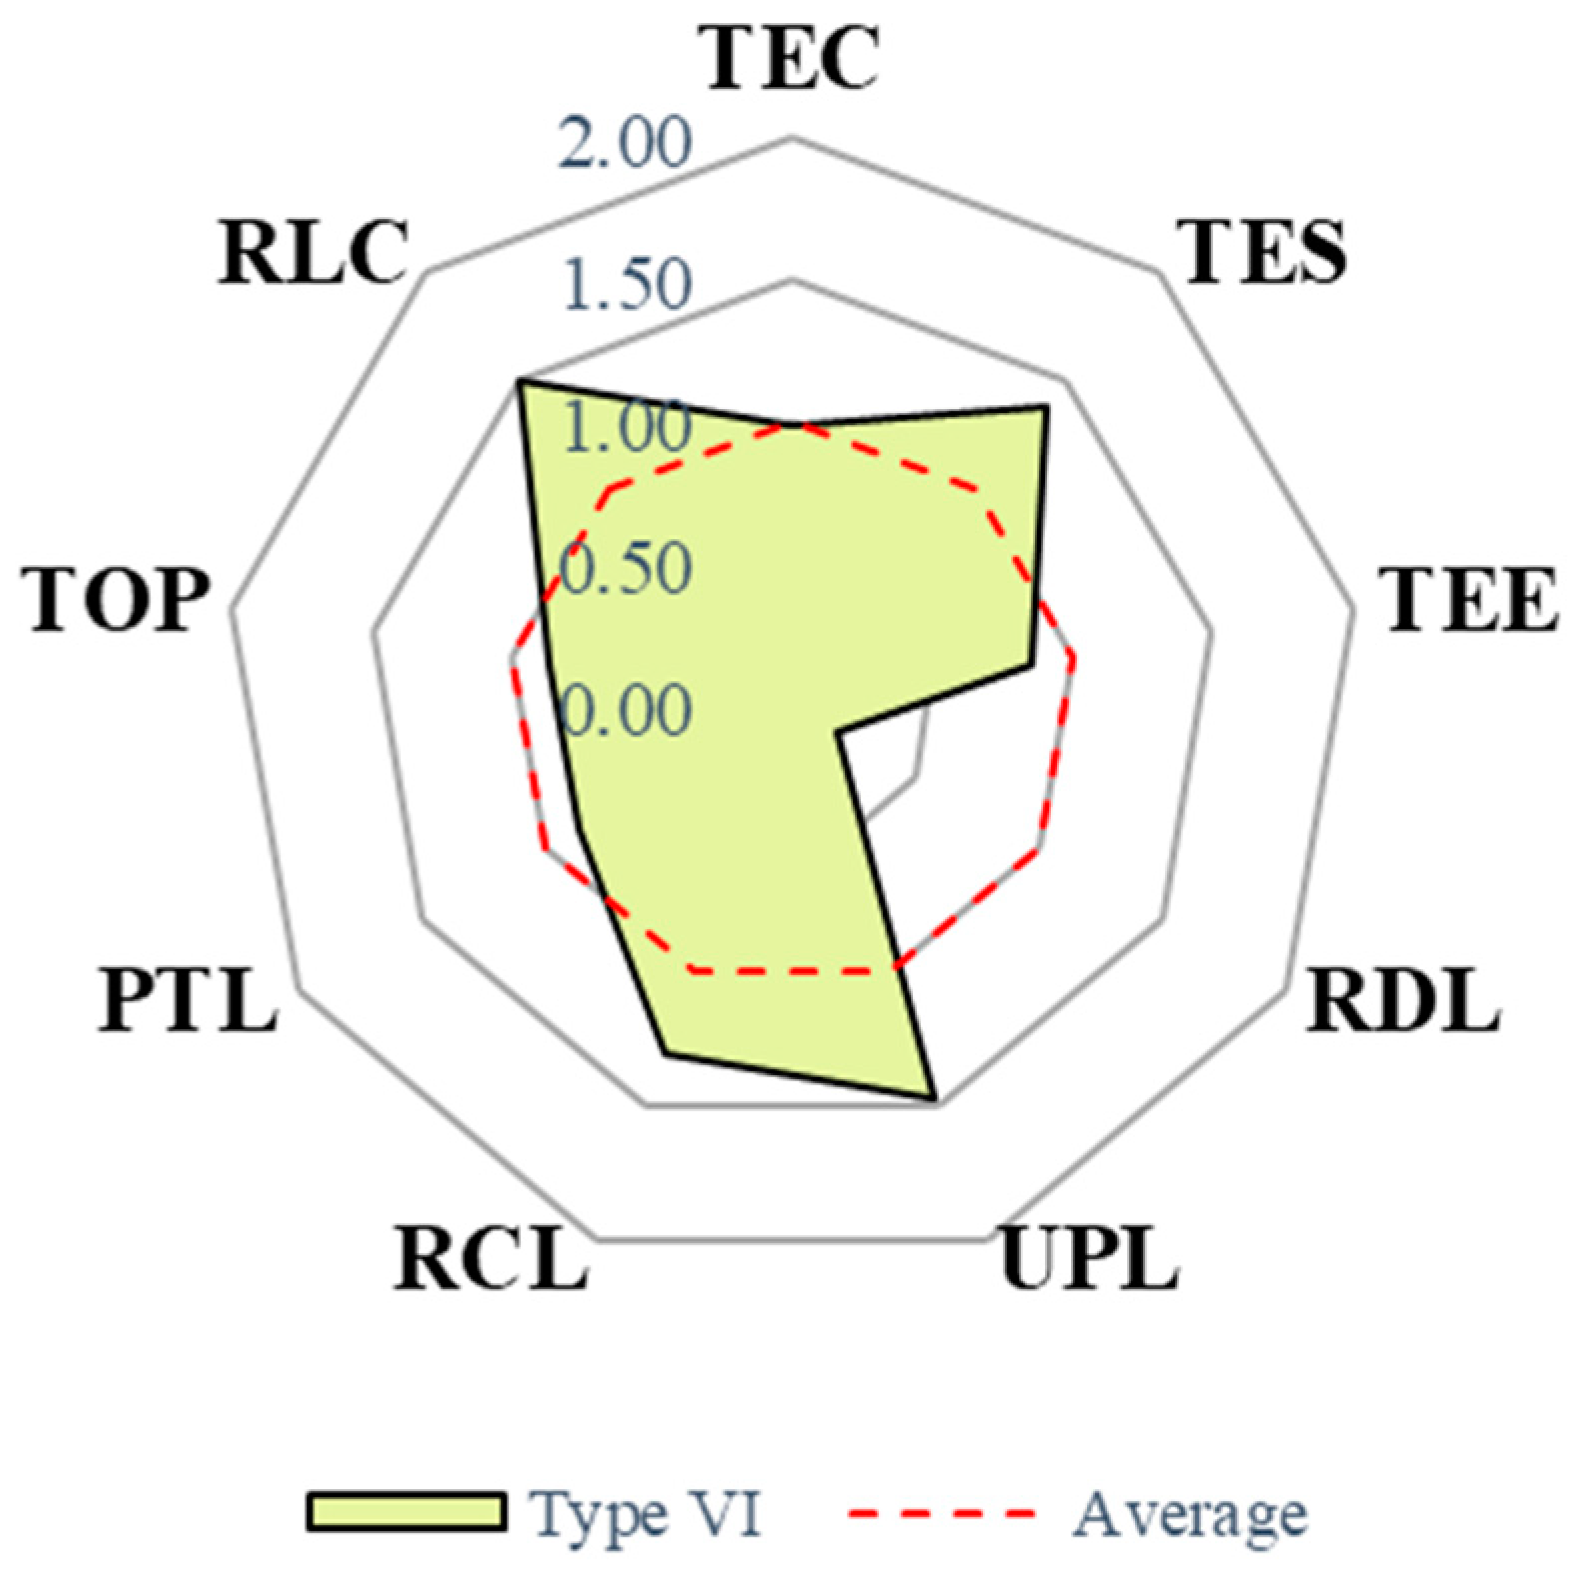
3.2. Analysis of Provincial Type Characteristics

The geographic distribution and TCO2 characteristics of the six types and their member provinces are shown in Figure 3. Except for a few individual provinces, the member provinces of each type generally have distinct geographical adjacencies. The average value of each indicator across the member provinces in each type was used as the characteristic indicator for types I to VI (Table 2). Comparing with the provincial average (i.e., average value of 1) helps identify the advantageous and disadvantageous characteristics of each type for more effective indicator feature analysis.
For indicator value interpretation, this study divided the [0, 2] interval of the indicator range into different levels: [0, 0.5] indicates a low level, (0.5, 0.95) indicates a relatively low level, [0.95, 1.05] indicates reaching the provincial average level, (1.05, 1.5) indicates a relatively high level, [1.5, 2) indicates a high level, and 2 represents far above the provincial average and is the maximum value in the indicators. What is worth noting is that due to the special construction of the UPL, its values exhibit the opposite levels, i.e., lower values indicate higher urban population density. The TES is similar, with higher values indicating lighter energy structures characterized by degrees of light and heavy.
(1) Type I includes Beijing, Tianjin, and Shanghai, which are municipalities directly under the central government in China. They have high levels of economic development and urbanization, comprehensive infrastructure construction, and are the most densely populated areas in China. As shown in Figure 4, the advantageous characteristics of Type I are as follows: a high level of transportation technology R&D (RDL), which ranks the second highest among all types; the highest level of public transportation construction (PTL) among all types; and transportation energy consumption efficiency (TEE) reaching the provincial average. The disadvantageous characteristics are as follows: a relatively heavy transportation energy structure (TES), characterized by a lower share of clean transportation energy (ranked lowest among all types); high urban population density level (UPL), which is the highest among all types; high traffic operation pressure (TOP), which refers to the number of private cars and the degree of road congestion (ranked the highest among the types); high residents’ living consumption level (RLC), which is the highest among the types; relatively low road construction level (RCL), which is the lowest among the types; and low transportation economic structure (TEC), which ranks lowest among the types.
(2) Type II includes Liaoning, Jiangsu, Zhejiang, Anhui, Fujian, Jiangxi, Shandong, Henan, Guangdong, and Guangxi, mostly located in economically vibrant eastern coastal regions and adjacent coastal provinces in central China, with good geographical adjacency, high economic development, high urbanization levels, high population density, and complex and developed transportation networks. As shown in Figure 5, the advantageous characteristics are as follows: relatively low TEE indicator (2nd lowest among the types), UPL indicator reaching provincial average, and relatively low RLC indicator (2nd lowest among the types). The disadvantageous characteristics are as follows: low RDL indicator, relatively heavy TES indicator (2nd highest among the types), relatively low PTL indicator, high TOP indicator, relatively low RCL indicator (2nd lowest among the types), and the lowest TEC indicator among the types.
(3) Type III includes Hubei and Shaanxi, adjacent provinces in central China with medium levels of economic development and urbanization. They are important industrial bases with relatively complete industrial systems and also play important transportation hub roles in their regions. As shown in Figure 6, the advantageous characteristics are as follows: relatively low UPL and TOP indicators (2nd lowest among the types), relatively low TEE and RLC indicators, relatively light TES indicators, and the highest RDL indicators among the types. Additionally, the RCL indicator and TEC indicators reach provincial averages. The disadvantageous characteristic is the relatively low PTL indicator. Type III is the type with the most advantages for low-carbon transportation development among the six types.
(4) Type IV includes Hebei, Shanxi, and Inner Mongolia, all located in northern China with good geographical adjacency. They are focused on heavy industry and energy production, have relatively lower economic development, abundant natural mineral resources, and are important coal production bases in China. As shown in Figure 7, the advantageous characteristics are as follows: the highest TEC indicator, the lightest TES indicator, and the lowest TEE indicator among the types. Additionally, there is a relatively low RLC indicator (ranked 1st among the types), and the RCL indicator reaches the provincial average. The disadvantageous characteristics are as follows: relatively low PTL indicator (ranked the lowest among the types), low RDL indicator (2nd lowest among the types), relatively high TOP and UPL indicators (2nd highest among the types).
(5) Type V includes Heilongjiang, Hunan, Sichuan, Guizhou, Yunnan, and Xinjiang, mainly located in northern and southwestern China. Their economic development levels vary, but they are overall relatively low. They are undergoing rapid urbanization, possess abundant natural resources, and are important energy bases in China, with vast territories and complex terrains. As shown in Figure 8, the advantageous characteristics are as follows: relatively high RCL indicator (2nd highest among the types), relatively low RLC and UPL indicators, relatively light TES indicator, TEC indicator reaching provincial average, and the lowest TOP indicator among the types. The disadvantageous characteristics are as follows: the highest TEE indicator among the types, a low RDL indicator, and a relatively low PTL indicator (2nd lowest among the types).
(6) Type VI includes Jilin, Hainan, Chongqing, Gansu, Qinghai, and Ningxia, primarily located in the western region of China, with the inclusion of provinces situated in specific geographical locations in the northeastern region (e.g., Jilin) and the eastern region (e.g., Hainan). These provinces have a large spatial span and poor geographical adjacency, varying levels of economic development and urbanization, relatively low economic output and growth rate, and are in the stage of actively promoting new urbanization. They possess abundant natural and cultural tourism resources, with Gansu and Qinghai being important new energy bases in China. As shown in Figure 9, the advantageous characteristics are as follows: the highest RCL indicator and the lowest UPL indicators among the types; the TEC indicator reaches the provincial average, ranking as the second highest among the types. Additionally, it exhibits a relatively light TES indicator, which is also the second highest among the types. Moreover, this type shows relatively low TEE and TOP indicators. The disadvantageous characteristics are as follows: the lowest RDL indicator among the types, a relatively low PTL indicator, and a high RLC indicator (2nd highest among the types).

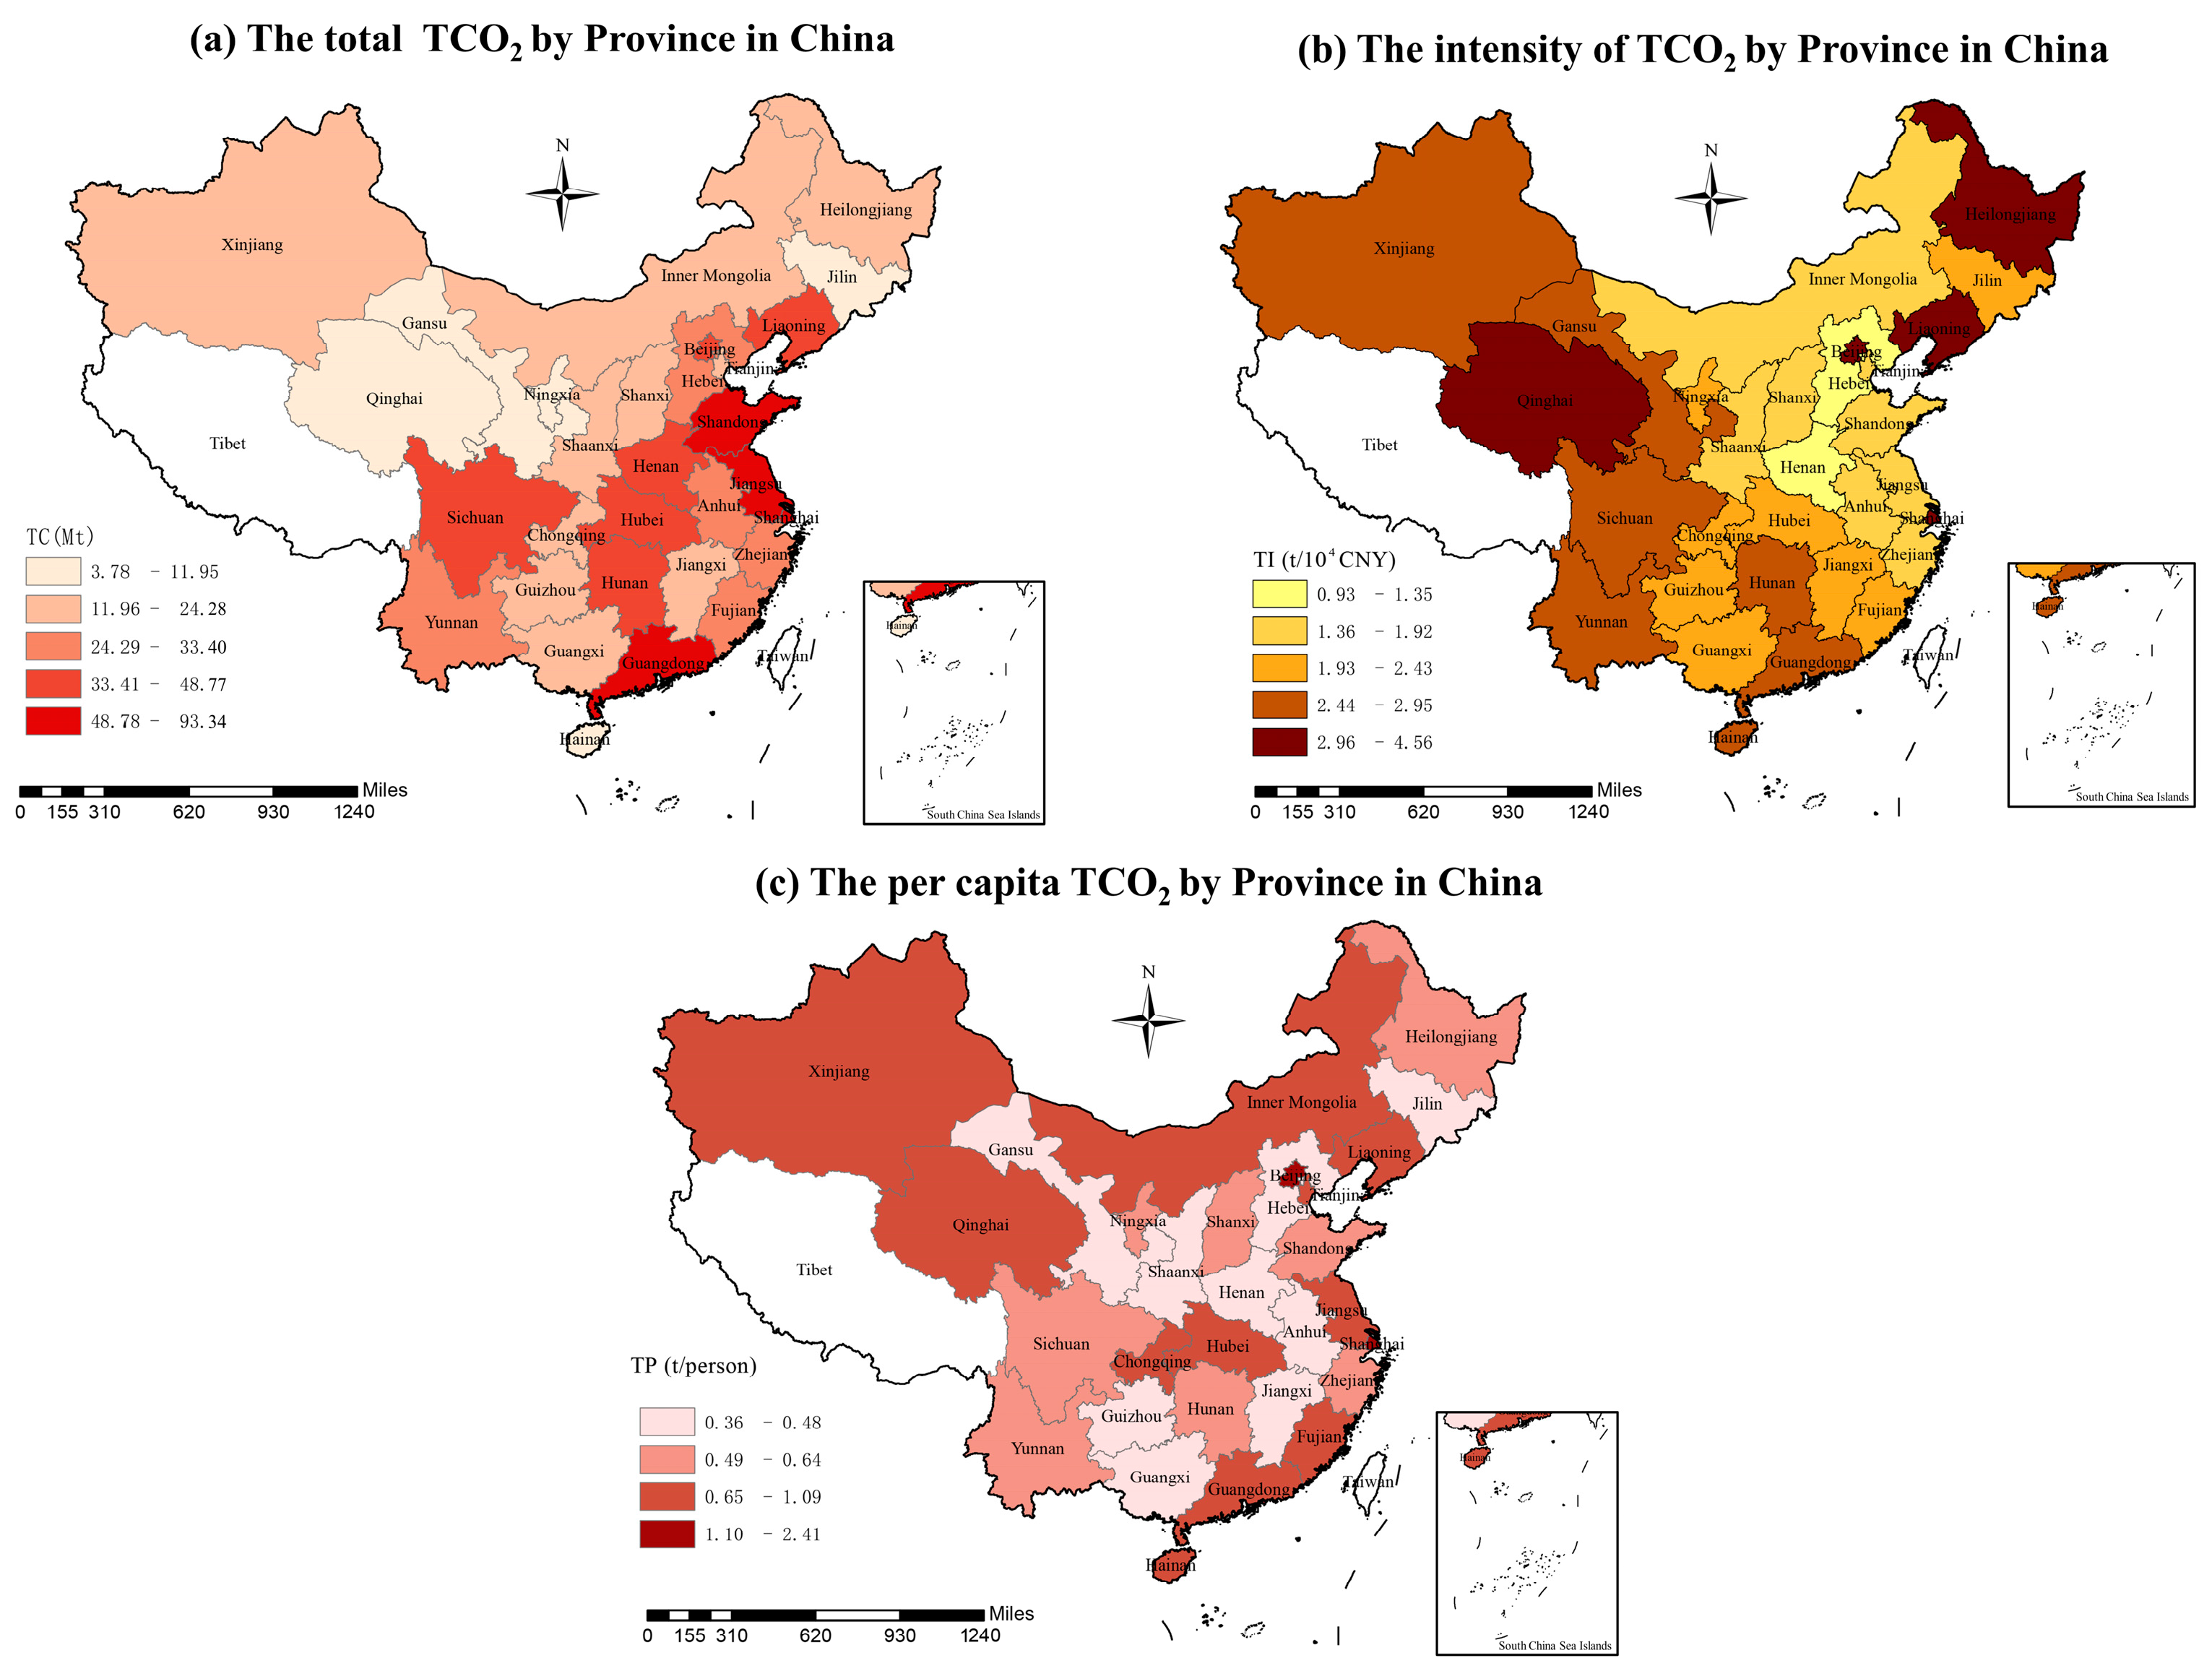
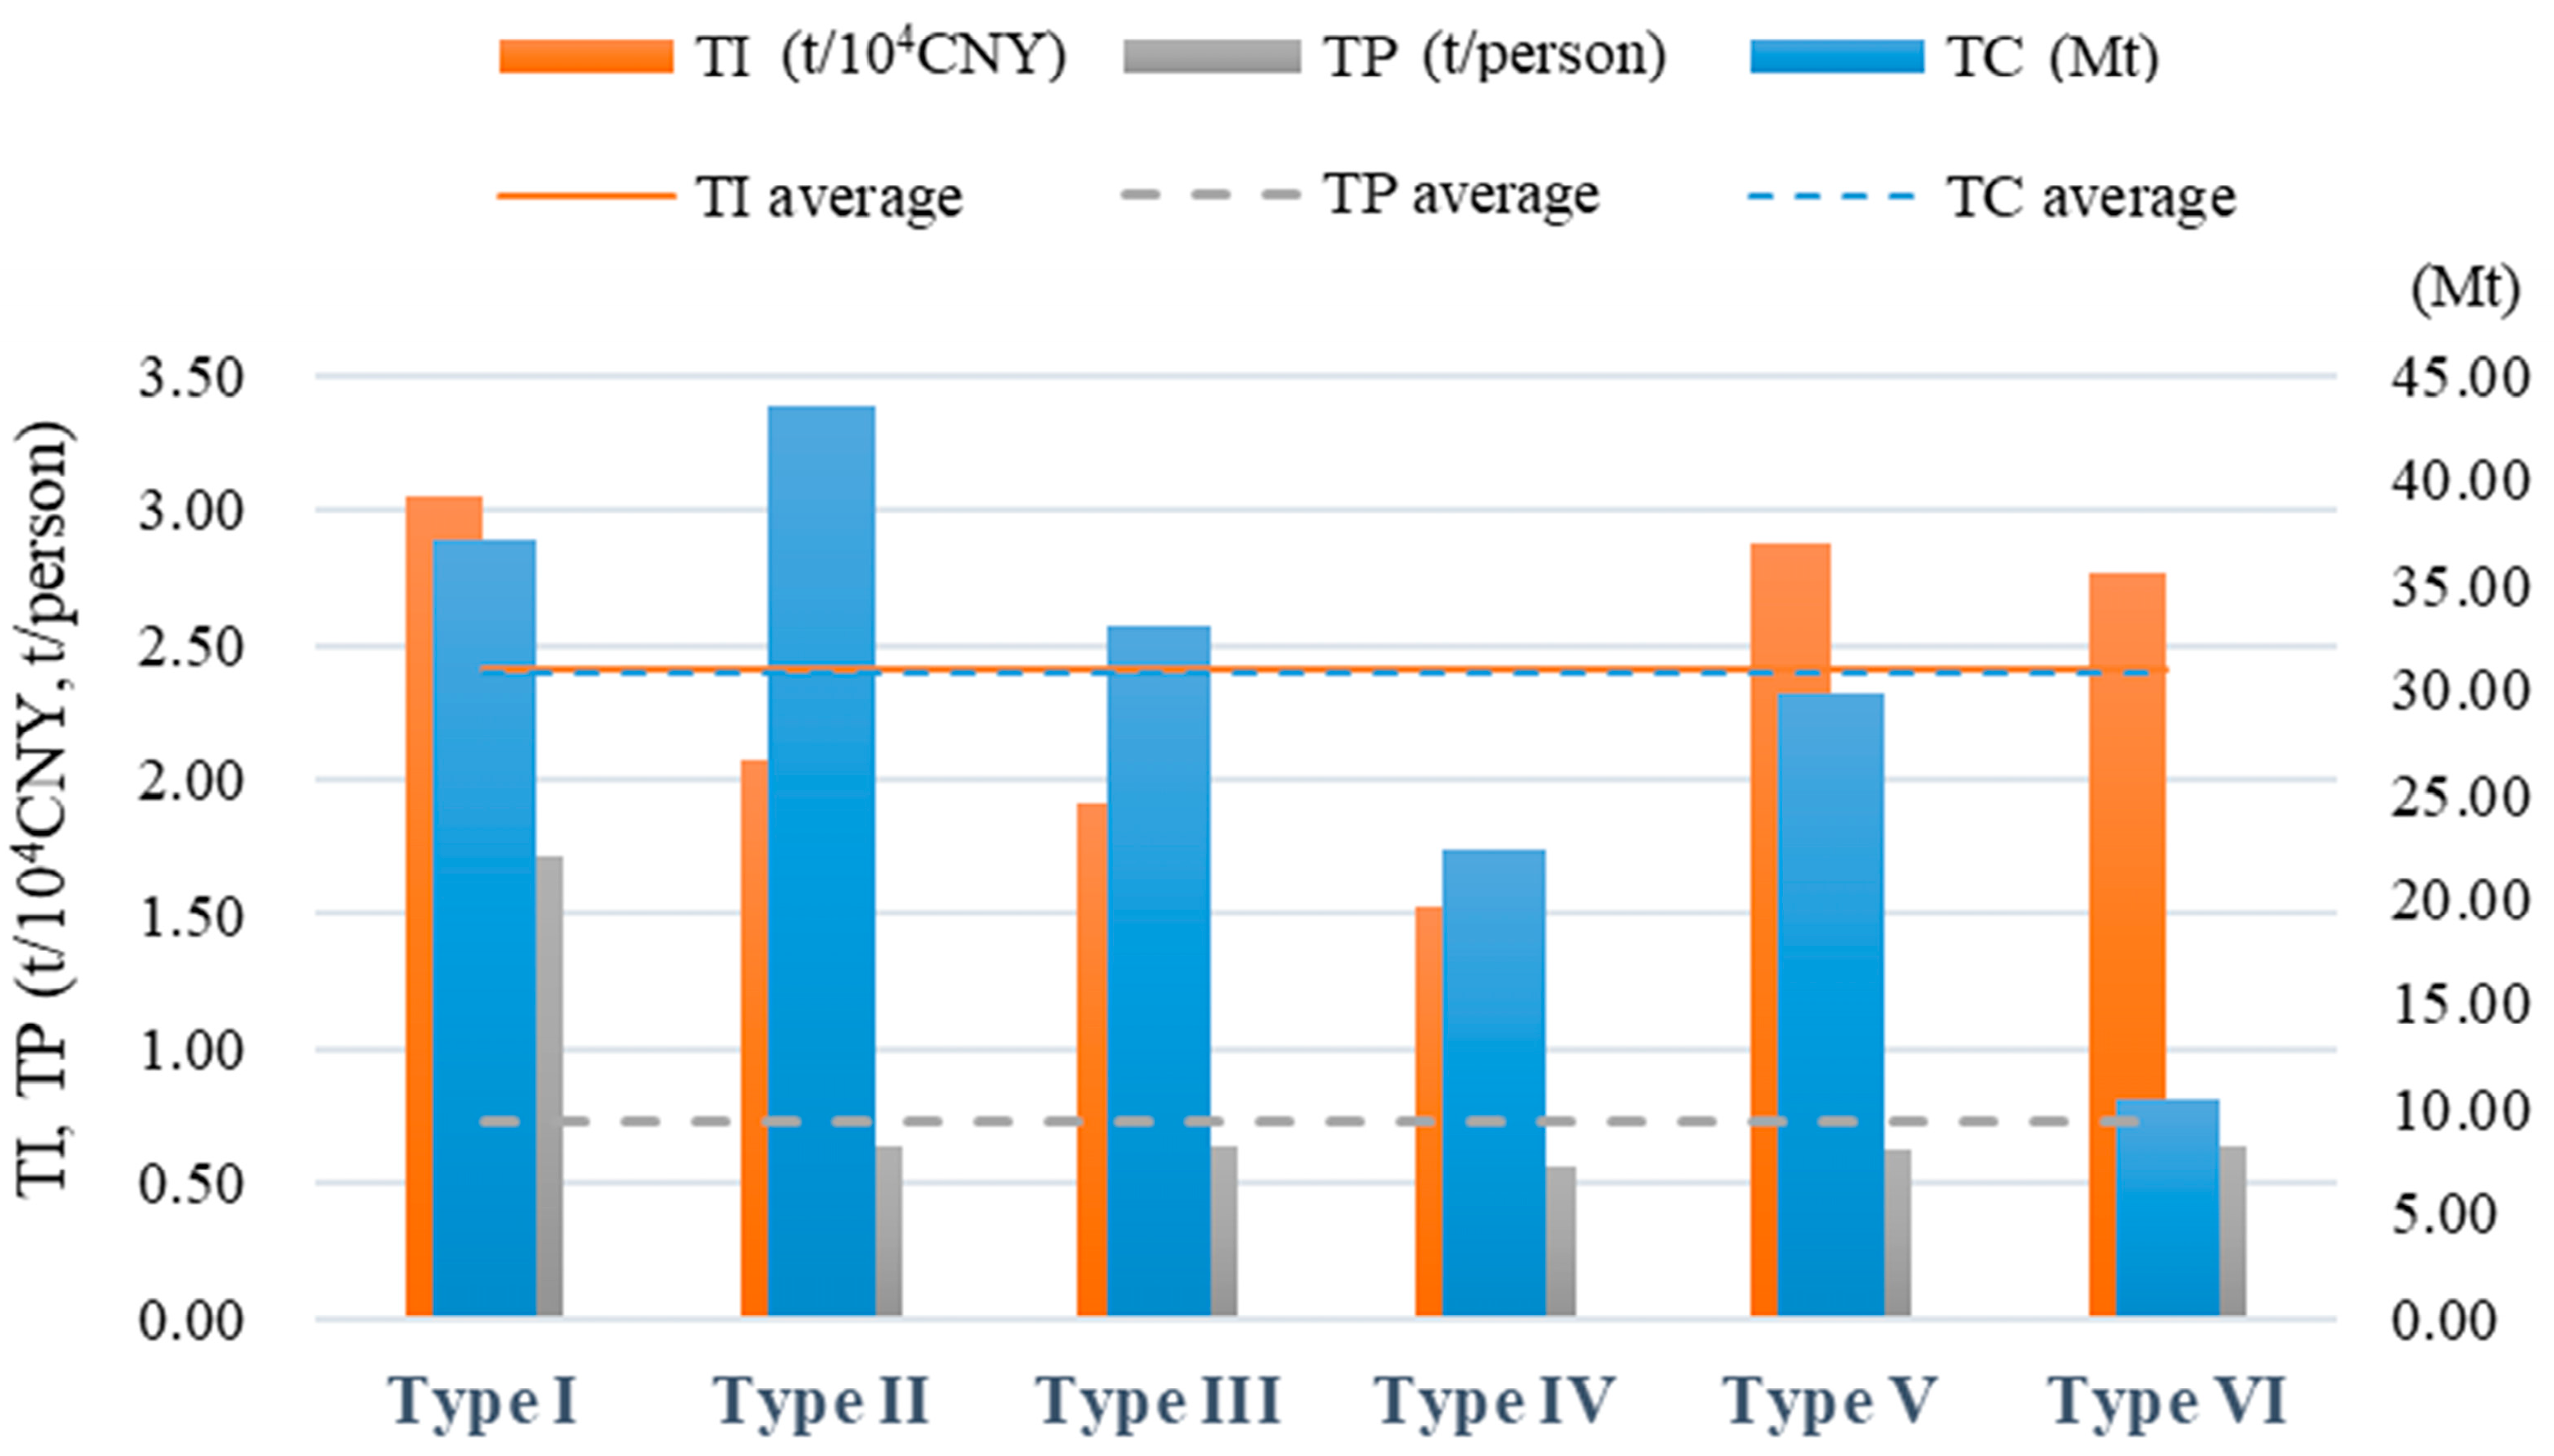
3.3. Calculation Results of Provincial TCO2

By applying Formulas (3) and (4) to calculate the TCO2 for each province, TC, TI, and TP for each province and Types I–VI are obtained, as shown in Appendix A, Table A2. For the TC of provinces in China, regions with relatively high TC (≥24.29 Mt, where Mt represents 106 tons), excepting Jiangxi Province, are mainly eastern coastal provinces and adjacent provinces, while western regions are mainly the two adjacent provinces of Sichuan and Yunnan. The provinces with the highest TC are Guangdong (93.34 Mt), Jiangsu (60.4 Mt), Shanghai (58.56 Mt), and Shandong (56.77 Mt), all located in eastern coastal regions. Furthermore, provinces with relatively low TC (<24.8 Mt) exhibit an approximately “Y-shaped” spatial distribution pattern. For the TI of provinces in China, regions with relatively high TI (≥2.44 t/104 CNY) are mainly clustered in western regions, with sporadic distributions in central, eastern, and northeastern regions. The provinces with the highest TI are Qinghai (4.56 t/104 CNY), Heilongjiang (3.82 t/104 CNY), Beijing (3.69 t/104 CNY), Liaoning (3.62 t/104 CNY), and Shanghai (3.55 t/104 CNY). For the TP of provinces in China, areas with relatively high TP (≥0.65 t/person) mainly exhibit sporadic spatial distributions, with Shanghai (2.41 t/person) and Beijing (1.76 t/person) having the highest values. See Figure 10 and Figure 11, and Table 3 for details.
For TC of the types, Type I accounted for 37.15 Mt, Type II accounted for 43.47 Mt, Type III accounted for 33.06 Mt, Type IV accounted for 22.41 Mt, Type V accounted for 29.89 Mt, and Type VI accounted for 10.49 Mt, with a provincial average of 30.73 Mt. For TI of the types, Type I accounted for 3.05 t/104 CNY, Type II accounted for 2.07 t/104 CNY, Type III accounted for 1.91 t/104 CNY, Type IV accounted for 1.53 t/104 CNY, Type V accounted for 2.88 t/104 CNY, and Type VI accounted for 2.76 t/104 CNY, with a provincial average of 2.41 t/104 CNY. For TP of the types, Type I accounted for 1.71 t/person, Type II accounted for 0.63 t/person, Type III accounted for 0.64 t/person, Type IV accounted for 0.56 t/person, Type V accounted for 0.63 t/person, and Type VI accounted for 0.64 t/person, with a provincial average of 0.73 t/person. See Figure 10 and Figure 11 and Table 3 for details.
We further determined the priority control directions for carbon reduction in each type based on the ratio relationships of TC, TI, and TP with provincial averages (Table 4). Types I and VI were determined as per capita transportation CO2 control (i.e., TP control). Types II and III were determined as total transportation CO2 control (i.e., TC control). Types V and VI were determined as transportation CO2 intensity control (i.e., TI control).

3.4. Correlation Analysis Results of Characterization Indicators with the per Capita TCO2 and the Intensity of TCO2

To identify priority control indicators for carbon reduction in the six types, this study further conducted correlation analysis between TI and TP and the original values of the nine characteristic indicators. Since the nine characteristic indicators are derived from TC through the extended Kaya identity, we believe these indicators can indirectly reflect the impacts on TC. Further correlation analysis with TC may cause redundant information or repeated analysis. Therefore, TC id not included in the correlation analysis.

3.4.1. The Correlation Analysis Results between TP and Characteristic Indicators

The correlation analysis results between TP and characteristic indicators show that TP is extremely strongly correlated with RDL (r = 0.857) and PTL (r = 0.842), moderately negatively correlated with UPL (r = −0.567), and moderately positively correlated with RLC (r = 0.498) and TOP (r = 0.485) at the 1% significant level (Table 5). Among them, the impacts of road congestion in TOP and travel frequency in RLC on generating TC are obvious conclusions. (1) The number of private cars corresponding to TOP and the consumption level of residents (which can also reflect income level to some extent) corresponding to RLC can directly or indirectly generate additional TCO2 through resident behaviors, which is consistent with the research conclusions [24,25,34,35,53]. (2) The extremely strong correlation between PTL and TP indicates that improving public transportation construction can attract more resident trips, thus causing more TCO2. However, Yang et al. (2015, 2019) [30,53] found PTL has significantly negative impacts on TP, suggesting a non-linear relationship between the two. This is consistent with the “inverted U-shaped” relationship between public transportation and CO2 emissions [32,33]. Public transportation can increase TCO2 during initial construction, but complete systems can reduce TCO2 in the long run. Moreover, it should be noted that the carbon reduction effect of public transportation infrastructure reaches a certain threshold level, beyond which its impact gradually decreases [33]. (3) The moderately negative correlation between the UPL (lower values indicate higher urban population density) and TP shows that higher urban population density significantly increases TCO2 [5,24,26,34,54,55]. However, Kenworthy and Laube (1996) [56], Ewing (1997) [57], and Newman (2006) [58] proposed that TCO2 is negatively correlated with population density and that compact, high-density urban forms result in lower TCO2. This again suggests a non-linear relationship between UPL and TCO2. Since urban population density in China is already very high, overly high density may not effectively decrease TCO2 [30,53,59]. Therefore, population scales should be reasonably controlled for different cities based on specific urbanization conditions.
(4) Technological progress can effectively reduce transportation energy consumption efficiency through indigenous innovation and technology spillover, thus reducing TCO2 [27,44,60]. Typically, RDL should show a negative correlation with TP; however, our results show an extremely strong positive correlation, consistent with Shao et al. (2021) [4] and Yang et al. (2021) [39]. This indicates that RDL and TP do not exhibit a simple linear relationship, with RDL having both positive and negative externalities [40]. Shi et al. (2021) [27] pointed out an “inverted U-shaped” relationship between RDL and TCO2, suggesting long-term research investment is needed to overcome the slow initial impact of transportation technology development on TCO2 [61] or introduce advanced energy conservation and carbon reduction technologies [62]. Further analysis in Table 6 shows RDL has an extremely strong positive correlation between PTL (r = 0.880), moderately positive correlation with TOP (r = 0.498), and moderately negative correlation with UPL (r = −0.569) at the 1% significant level, and moderately positive correlation with RLC (r = 0.437) at the 5% significant level. This indicates that the R&D direction of transportation technology may primarily revolve around the planning and construction of transportation infrastructure. There is a certain degree of inadequacy in the development of carbon reduction technologies, as well as shortcomings in practical application and technology transfer in the transformation of scientific achievements in transportation technology. Furthermore, RDL mainly reflects the potential magnitude of technological carbon reduction rather than its practical implementation. Based on the above analysis, RDL, PTL, UPL, RLC, and TOP are important indicators for priority control of TP.

3.4.2. The Correlation Analysis Results between TI and Characteristic Indicators

The correlation analysis results between TI and characteristic indicators reveal that TI has a moderately positive correlation with TEE (r = 0.528) and RLC (r = 0.501) at the 1% significant level, a moderately negative correlation with TEC (r = −0.415), and a slight positive correlation with PTL (r = 0.386) at the 5% significant level (Table 7). Among them, the quantity and efficiency of passenger and freight turnover corresponding to TEE are key factors causing TCO2, consistent with previous studies [24,34,35]. Furthermore, Xie et al. (2017) [54], Yang et al. (2019) [30], and Wang (2021) [29] also found RLC promotes both TC and TI. The moderately negative correlation between TEC and TI indicates that increasing transportation economic share in provincial GDP facilitates accelerated commodity and population flow, improving transportation efficiency, and thus reducing TI. With regard to the slight positive correlation between PTL and TI, as mentioned previously, PTL exhibits a non-linear relationship with TCO2 and TP. Further correlation analysis reveals that PTL has a moderately negative correlation between UPL (r = −0.625) and positive correlations with TOP (r = 0.607) and RLC (r = 0.573) at the 1% significant level. Additionally, PTL exhibits a moderately positive correlation with TEE (r = 0.439) and a slight negative correlation with RCL (r = −0.384) at the 5% significant level (Table 8). These findings highlight the existence of certain negative impacts associated with public transportation construction, including increased energy consumption in transportation efficiency, exacerbated road congestion, and an increased frequency of resident travel. Moreover, these results validate the threshold effect and negative consequences of PTL and TCO2 [33]. This suggests that in densely populated areas, excessive allocation of public transportation resources can, to some extent, increase residents’ frequency of consumption and travel, exacerbate traffic congestion pressure, and lead to an unreasonable growth in TI. Based on the above analysis, TEE, RLC, TEC, and PTL can be identified as important indicators for prioritizing TI control.

3.5. Carbon Reduction Strategies and KPIs for Provincial Types

3.5.1. Carbon Reduction Strategies for Provincial Types

(1) Types I and IV are the TP control and the direction for carbon reduction. Based on the above analysis, the strategies for Type I should focus on: strengthening R&D investment and application of technological achievements in carbon reductions; strictly controlling urban population scales and effectively guiding spatial layout adjustments for over-concentrated urban areas; paying attention to the problem of excessive configuration of urban public transportation; effectively alleviating road congestion and strictly controlling the number of fuel-powered private vehicles; significantly promoting effective guidance of low-carbon residents’ behaviors, including consumption and travel. Secondary focus should be placed on: rationally increasing the share of transportation economy and promoting low-carbon transformation of transportation economic structure; significantly increasing the utilization of renewable energy in transportation energy structure, such as strictly requiring motor vehicle emission standards, promoting new energy transportation tools, and rationally deploying new energy transportation infrastructure; further reducing transportation energy consumption efficiency by promoting combined transportation modes and intelligent transportation to improve efficiency; significantly improving road construction by promoting sustainable urban-rural planning to optimize existing road networks and expanding high-quality highways and rapid urban road systems.
Strategies for Type IV should be focused on: strengthening R&D investment in carbon reductions and introducing advanced energy conservation and carbon reduction technologies; promoting urban-rural integrated development to prevent excessive urban concentration; significantly improving public transportation service level and quality; effectively alleviating road congestion; and strictly controlling the number of fuel-powered private vehicles. A secondary focus should be placed on maintaining the level of renewable energy utilization in the transportation sector.
(2) Type II and Type III use TC control as the direction for carbon reduction. Based on the above analysis, strategies for Type II should focus on: leveraging locational and industrial advantages to drive economic development in surrounding provinces, thus promoting low-carbon transformation of the transportation economic structure; significantly increasing renewable energy utilization in the transportation energy structure (same measures as Type I); maintaining transportation energy consumption efficiency; strengthening R&D investment in carbon reductions and introducing advanced energy conservation and carbon reduction technologies; promoting urban-rural integrated development and reasonably controlling urban population scales; effectively improving road construction (same measures as Type I); reasonably improving the level and quality of public transportation services; effectively alleviating road congestion and reasonably controlling the number of fuel-powered private vehicles.
Strategies for Type III should be focused on: maintaining the utilization of renewable energy; effectively reducing transportation energy consumption efficiency; strengthening R&D investment and application of technological achievements in carbon reduction; reasonably improving the level and quality of public transportation services; effectively guiding low-carbon residents’ behaviors, including consumption and travel.
(3) Type V and Type VI are TI-controlled in the direction of carbon reduction. Based on the above analysis, strategies for Type V should focus on: maintaining the transportation economic structure and further promoting its low-carbon transformation; significantly reducing transportation energy consumption efficiency; further improving road construction effectively; and significantly improving public transportation service level and quality. Secondary focus should be placed on: significantly increasing renewable energy utilization in the transportation energy structure (same measures as Type I); strengthening R&D investment in carbon reductions; and introducing advanced energy conservation and carbon reduction technologies.
Strategies for Type VI should be focused on: maintaining the transportation economic structure and further promoting its low-carbon transformation; reasonably improving the level and quality of public transportation services. Secondary focus should be placed on: maintaining the utilization of renewable energy; strengthening R&D investment in carbon reductions and introducing advanced energy conservation and carbon reduction technologies; and significantly promoting effective guidance of low-carbon residents’ behaviors, including consumption and travel.

3.5.2. Carbon Reduction KPIs for Provincial Types

Based on the above-proposed carbon reduction measures for each type, this study further developed different KPIs related to local government for better achieving carbon reduction goals in each of the six types, aiming to promote effective implementation and supervision of the carbon reduction measures.
Figure 12 provides the corresponding KPIs for each type, respectively. Specifically, (1) For Type I, the primary focus should be on: increasing the TEC indicator, greatly increasing the TES indicator, decreasing the TEE indicator, maintaining the UPL indicator, and greatly decreasing both the TOP and RLC indicators. (2) For Type II, particular attention needs to be paid to: increasing the TEC, RCL, and PTL indicators, greatly increasing the TES and RDL indicators, maintaining the TEE and UPL indicators, and decreasing the TOP indicator. (3) For Type III, the primary focus should be on maintaining the TES indicator, decreasing the TEE and RLC indicators, and increasing the PTL indicator. (4) For Type IV, particular attention needs to be paid to: maintaining the TES and UPL indicators, greatly increasing the RDL and PTL indicators, greatly decreasing the TOP indicator, and decreasing the RLC indicator. (5) In the context of Type V, emphasis should be placed on increasing the TEC and RCL indicators, greatly increasing the TES, RDL, and PTL indicators, and greatly decreasing the TEE indicator. (6) Lastly, for Type VI, the primary focus should be on increasing the TEC and PTL indicators, maintaining the TES indicator, greatly increasing the RDL indicator, and greatly decreasing the RLC indicator.

4. Conclusions and Policy Implications

The exploration of similarities and differences in provincial TCO2 characteristics in China using the multi-indicator joint characterization method and type categorization through clustering analysis is novel in our research. Firstly, influencing factors such as economic development, population density, energy structure, transportation efficiency, R&D, infrastructure construction, transportation operation conditions, and residents’ transportation behavior were derived by effectively extending the Kaya identity, based on which a joint characterization method using nine evaluation indicators (TEC, TES, TEE, RDL, UPL, RCL, PTL, TOP, and RLC) was constructed. Secondly, Ward’s method was used in the hierarchical clustering of the characteristic indicators to categorize thirty Chinese provinces in 2019 into six types (types I to VI). Thirdly, based on the calculation of TC, TI, and TP for each province, the priority control directions and indicators for carbon reduction were obtained through relative relationships with provincial averages and correlation analysis with the indicators, i.e., Type I and Type IV can be categorized as TP-controlled, Type II and Type III as TC-controlled, and Type V and Type VI as TI-controlled. The priority control indicators were RDL, PTL, UPL, RLC, and TOP for TP, and TEE, RCL, TEC, and PTL for TI. Furthermore, UPL, RDL, and PTL have non-linear effects and threshold effects on TP, and PTL exhibits threshold effects and a certain degree of negative impacts on TCO2. Finally, typological carbon reduction strategies and KPIs related to carbon reduction efforts by local governments were provided for each provincial type. When it comes to carbon emission reduction measures, special attention should be given to the importance of R&D in transportation technologies, transitioning from the planning and construction of transportation infrastructure to the development of carbon reduction technologies. Additionally, in densely populated cities, it is crucial to address issues related to excessive population density and overallocation of public transportation resources in order to curb the unreasonable increase in transportation carbon emissions.
Policy makers should pay special attention to:
(1)
Optimizing traffic congestion, controlling the number of fuel-powered private vehicles, and advocating low-carbon residents’ behaviors are important measures to effectively control the direct quantity of TCO2 (TC, TI, and TP). Provinces categorized as Type I, Type II, and Type IV should primarily optimize urban vehicle restriction policies and conduct reasonable adjustments in urban spatial planning (such as industrial layout, development of industrial parks, establishment of employment centers, educational layout, and planning multifunctional community areas) to fundamentally address urban traffic congestion issues. Provinces identified as Type IV and Type V should enhance the coverage and service efficiency of public transportation systems (such as bus rapid transit and dedicated bus lanes). Provinces classified as Type I and Type II, benefiting from comprehensive road monitoring facilities, need to reinforce the sharing of information on road traffic operations to alleviate traffic congestion. Provinces in China should continue to strengthen promotion efforts and policy support for new energy vehicles, expanding the deployment of new energy transportation infrastructure (e.g., charging stations, wireless charging, etc.). They should encourage low-carbon lifestyles, advocate for energy conservation and emissions reduction through various channels, and incentivize the use of public transportation and shared mobility practices (particularly among Type I, Type III, and Type IV provinces).
(2)
Improving transportation energy efficiency and reducing passenger and freight turnover energy consumption through technology are necessary to reduce TC, TI, and TP. The government should fully recognize the initial slow impacts of carbon reduction technologies and persist in long-term support for domestic industry-academia-research cooperation in R&D and promotion of technologies related to carbon reduction in transportation, as well as introducing advanced international technologies. Provinces categorized as Type I and Type III should shift transportation R&D focus from infrastructure construction to carbon reduction technologies. The other types of provinces should increase investments in carbon reduction technologies for transportation or introduce advanced carbon reduction technologies. Provinces in China should promote transportation electrification and combined transportation modes to improve efficiency and achieve the goal of low-carbon development in transportation.
(3)
For provinces with high levels of urbanization (such as Type I and Type II), attention should be given to the issues of excessive population density and over-configuration of public transportation in urban areas to curb the unreasonable increase in TCO2. In contrast, for provinces with lower levels of urbanization (such as Types III to VI), the population aggregation effect should be fully utilized. It is important to focus on constructing intensive and efficient urban spatial patterns, improving the utilization and sharing rates of public transportation, and scientifically expanding urban road infrastructure to achieve long-term carbon reduction.
(4)
Since provinces have different advantages and disadvantages in their TCO2 characteristics for low-carbon development, the Chinese government should promote cooperative development and collaborative governance mechanisms across regions to achieve win-win carbon reduction and economic growth in provincial transportation sectors. Regarding regional energy-economy cooperation, resource-rich provinces (such as Type V and Type VI) can provide clean energy like natural gas and electricity to provinces with energy-intensification structures through national projects like “West-to-East Gas Transmission” and “West-to-East Power Transmission”, transforming regional resource advantages into economic benefits while also promoting low-carbon transitions in these energy-intensification provinces (such as Type I and Type II). For collaborative development of advanced technologies across regions, developed provinces (like eastern coastal type I and type II) should give full play to their advantages in transportation technology R&D funding, talent pool, and exemplary leadership, strengthening interactive exchanges of technological and economic ties across regions through spillover and learning effects, to achieve collaborative regional carbon reductions through technology. For collaborative governance across regions, differentiated carbon reduction policies and measures should be implemented with a collaborative assessment system incorporating rewards and punishments established to reinforce the responsibilities and consciousness of all parties, thus achieving collaborative governance on carbon reduction in provincial transportation sectors.

Author Contributions

Y.Y. conceived and designed the study, conducted data processing and analysis, and drafted the manuscript. Y.Y. and F.Y. performed software analysis and mapping. F.Y. revised the paper and performed project management and funding acquisition. All authors have read and agreed to the published version of the manuscript.

Funding

This research was funded by the “Special project of National Natural Science Foundation of China”, grant numbers “42341207”.

Data Availability Statement

Data is contained within the article.

Acknowledgments

The authors would like to thank the anonymous reviewers for their comments and suggestions.

Conflicts of Interest

The authors declare no conflict of interest.

Appendix A

Table A1. Characteristic indicator values of provinces in each type.
TypeProvinceTECTESTEERDLUPLRCLPTLTOPRLC
IBeijing0.620.632.002.000.000.552.001.472.00
Tianjin1.191.070.731.620.000.772.001.251.74
Shanghai0.920.240.232.000.000.312.001.451.45
Type average0.910.650.991.870.000.542.001.391.73
IILiaoning1.130.620.650.391.110.971.200.980.97
Jiangsu0.681.030.750.491.151.051.141.270.80
Zhejiang0.670.490.340.540.540.841.091.521.04
Anhui1.140.750.360.080.800.850.530.950.56
Fujian0.750.450.440.140.940.830.780.800.86
Jiangxi0.930.470.700.201.490.960.380.690.74
Shandong1.090.720.690.391.001.070.821.360.40
Henan1.170.890.570.240.680.630.501.000.56
Guangdong0.690.360.410.740.510.801.161.310.65
Guangxi0.911.030.620.281.530.790.390.900.59
Type average0.910.680.550.350.970.880.801.080.72
IIIHubei1.040.590.952.001.311.160.870.860.82
Shaanxi0.882.000.762.000.910.940.830.791.01
Type average0.961.290.862.001.111.050.850.820.92
IVHebei1.771.730.270.111.110.700.511.250.39
Shanxi1.261.770.480.251.100.860.521.070.51
Inner Mongolia1.491.810.590.260.611.580.750.980.71
Type average1.511.770.450.210.941.050.591.100.53
VHeilongjiang0.840.761.570.270.631.100.900.670.62
Hunan0.840.461.940.351.300.730.550.820.77
Sichuan0.670.992.000.780.450.920.760.980.58
Guizhou0.900.921.600.381.280.970.430.821.29
Yunnan1.020.282.000.181.630.970.450.740.52
Xinjiang1.501.281.520.061.081.790.730.850.76
Type average0.960.781.770.341.061.080.640.810.76
VIJilin1.051.520.860.071.751.051.160.810.89
Hainan0.990.520.510.001.511.260.640.911.90
Chongqing0.881.040.780.491.691.131.190.871.19
Gansu1.071.690.610.081.831.100.550.781.01
Qinghai0.891.531.680.210.792.000.740.872.00
Ningxia1.022.000.730.231.271.240.870.971.99
Type average0.981.380.860.181.471.300.860.871.50
Table A2. The total TCO2 (TC), the intensity of TCO2 (TI) and the per capita TCO2 (TP) of the provinces in each type.
TypeProvinceTC
(Mt)
TI
(t/104 CNY)
TP
(t/person)
IBeijing37.843.691.76
Tianjin15.061.910.96
Shanghai58.563.552.41
Type average37.153.051.71
IILiaoning47.573.621.09
Jiangsu60.401.910.75
Zhejiang33.401.700.57
Anhui30.681.550.48
Fujian29.852.010.75
Jiangxi22.492.080.48
Shandong56.771.560.56
Henan40.151.350.42
Guangdong93.342.690.81
Guangxi20.072.220.40
Type average43.472.070.63
IIIHubei48.772.180.82
Shaanxi17.361.640.45
Type average33.061.910.64
IVHebei27.200.930.36
Shanxi19.371.920.52
Inner Mongolia20.661.720.81
Type average22.411.530.56
VHeilongjiang20.383.820.54
Hunan43.062.770.62
Sichuan43.272.950.52
Guizhou17.242.430.48
Yunnan31.122.800.64
Xinjiang24.282.550.96
Type average29.892.880.63
VIJilin11.952.080.44
Hainan6.972.820.74
Chongqing23.112.370.74
Gansu11.502.620.43
Qinghai5.624.560.92
Ningxia3.782.120.54
Type average10.492.760.64
Provincial average30.732.400.73

References

  1. IEA. World Energy Outlook 2022; International Energy Agency: Paris, France, 2022; Available online: https://www.iea.org/reports/world-energy-outlook-2022 (accessed on 11 November 2023).
  2. Cohan, D.S.; Sengupta, S. Net Greenhouse Gas Emissions Savings from Natural Gas Substitutions in Vehicles, Furnaces, and Power Plants. Int. J. Glob. Warm. 2016, 9, 254–273. [Google Scholar] [CrossRef]
  3. IEA. CO2 Emissions from Fuel Combustion 2018; International Energy Agency: Paris, France, 2018. [Google Scholar] [CrossRef]
  4. Shao, H.; Wang, Z. Spatial Network Structure of Transportation Carbon Emission Efficiency in China and Its Influencing Factors. Chin. J. Popul. Resour. Environ. 2021, 19, 295–303. [Google Scholar] [CrossRef]
  5. Cai, J.; Ma, S.; Ji, H.; Jiang, W.; Bai, Z. Spatial–Temporal Characteristics and Decoupling Effects of China’s Transportation CO2 Emissions. Environ. Sci. Pollut. Res. 2023, 30, 32614–32627. [Google Scholar] [CrossRef]
  6. Ortega-Ruiz, G.; Mena-Nieto, A.; Golpe, A.A.; García-Ramos, J.E. CO2 Emissions and Causal Relationships in the Six Largest World Emitters. Renew. Sustain. Energy Rev. 2022, 162, 112435. [Google Scholar] [CrossRef]
  7. Bai, C.; Chen, Z.; Wang, D. Transportation Carbon Emission Reduction Potential and Mitigation Strategy in China. Sci. Total Environ. 2023, 873, 162074. [Google Scholar] [CrossRef]
  8. IEA. CO2 Emissions from Fuel Combustion 2019; International Energy Agency: Paris, France, 2019. [Google Scholar] [CrossRef]
  9. Lin, D.; Zhang, L.; Chen, C.; Lin, Y.; Wang, J.; Qiu, R.; Hu, X. Understanding Driving Patterns of Carbon Emissions from the Transport Sector in China: Evidence from an Analysis of Panel Models. Clean. Technpl. Environ. Policy 2019, 21, 1307–1322. [Google Scholar] [CrossRef]
  10. Xu, H.; Li, Y.; Zheng, Y.; Xu, X. Analysis of Spatial Associations in the Energy–Carbon Emission Efficiency of the Transportation Industry and Its Influencing Factors: Evidence from China. Environ. Impact Assess. Rev. 2022, 97, 106905. [Google Scholar] [CrossRef]
  11. IEA. Energy and Climate Change: World Energy Outlook Special Report 2015; International Energy Agency: Paris, France, 2015; Available online: https://www.iea.org/reports/energy-and-climate-change (accessed on 11 November 2023).
  12. Zeng, X.; Qiu, R.; Lin, D.; Hou, X.; Zhang, L.; Hu, X. Spatio-temporal heterogeneity of transportation carbon emissions and its influencing factors in China. China Environ. Sci. 2020, 40, 4304–4313. (In Chinese) [Google Scholar] [CrossRef]
  13. Ma, F.; Wang, Y.; Yuen, K.F.; Wang, W.; Li, X.; Liang, Y. The Evolution of the Spatial Association Effect of Carbon Emissions in Transportation: A Social Network Perspective. Int. J. Environ. Res. Public Health 2019, 16, 2154. [Google Scholar] [CrossRef]
  14. Bai, C.; Mao, Y.; Gong, Y.; Feng, C. Club Convergence and Factors of Per Capita Transportation Carbon Emissions in China. Sustainability 2019, 11, 539. [Google Scholar] [CrossRef]
  15. Wang, L.; Fan, J.; Wang, J.; Zhao, Y.; Li, Z.; Guo, R. Spatio-Temporal Characteristics of the Relationship between Carbon Emissions and Economic Growth in China’s Transportation Industry. Environ. Sci. Pollut. Res. 2020, 27, 32962–32979. [Google Scholar] [CrossRef]
  16. Bai, C.; Zhou, L.; Xia, M.; Feng, C. Analysis of the Spatial Association Network Structure of China’s Transportation Carbon Emissions and Its Driving Factors. J. Environ. Manag. 2020, 253, 109765. [Google Scholar] [CrossRef]
  17. Liu, J.; Li, S.; Ji, Q. Regional Differences and Driving Factors Analysis of Carbon Emission Intensity from Transport Sector in China. Energy 2021, 224, 120178. [Google Scholar] [CrossRef]
  18. Peng, Z.; Wu, Q.; Wang, D.; Li, M. Temporal-Spatial Pattern and Influencing Factors of China’s Province-Level Transport Sector Carbon Emissions Efficiency. Pol. J. Environ. Stud. 2019, 29, 233–247. [Google Scholar] [CrossRef]
  19. Jiang, M.; Li, J. Study on the Change in the Total Factor Carbon Emission Efficiency of China’s Transportation Industry and Its Influencing Factors. Energies 2022, 15, 8502. [Google Scholar] [CrossRef]
  20. Xu, G.; Zhao, T.; Wang, R. Research on Carbon Emission Efficiency Measurement and Regional Difference Evaluation of China’s Regional Transportation Industry. Energies 2022, 15, 6502. [Google Scholar] [CrossRef]
  21. Zhao, P.; Zeng, L.; Li, P.; Lu, H.; Hu, H.; Li, C.; Zheng, M.; Li, H.; Yu, Z.; Yuan, D.; et al. China’s Transportation Sector Carbon Dioxide Emissions Efficiency and Its Influencing Factors Based on the EBM DEA Model with Undesirable Outputs and Spatial Durbin Model. Energy 2022, 238, 121934. [Google Scholar] [CrossRef]
  22. Zhao, C.; Wang, K.; Dong, X.; Dong, K. Is Smart Transportation Associated with Reduced Carbon Emissions? The Case of China. Energy Econ. 2022, 105, 105715. [Google Scholar] [CrossRef]
  23. Lin, S.; Wang, J. Carbon Emission Reduction Effect of Transportation Structure Adjustment in China: An Approach on Mul-ti-Objective Optimization Model. Environ. Sci. Pollut. Res. 2022, 29, 6166–6183. [Google Scholar] [CrossRef]
  24. Liang, Y.; Niu, D.; Wang, H.; Li, Y. Factors Affecting Transportation Sector CO2 Emissions Growth in China: An LMDI De-composition Analysis. Sustainability 2017, 9, 1730. [Google Scholar] [CrossRef]
  25. Bai, C.; Chen, Y.; Yi, X.; Feng, C. Decoupling and Decomposition Analysis of Transportation Carbon Emissions at the Pro-vincial Level in China: Perspective from the 11th and 12th Five-Year Plan Periods. Environ. Sci. Pollut. Res. 2019, 26, 15039–15056. [Google Scholar] [CrossRef]
  26. Zhu, C.; Wang, M.; Yang, Y. Analysis of the Influencing Factors of Regional Carbon Emissions in the Chinese Transportation Industry. Energies 2020, 13, 1100. [Google Scholar] [CrossRef]
  27. Shi, T.; Si, S.; Chan, J.; Zhou, L. The Carbon Emission Reduction Effect of Technological Innovation on the Transportation Industry and Its Spatial Heterogeneity: Evidence from China. Atmosphere 2021, 12, 1169. [Google Scholar] [CrossRef]
  28. Chen, Q.; Wang, Q.; Zhou, D.; Wang, H. Drivers and Evolution of Low-Carbon Development in China’s Transportation In-dustry: An Integrated Analytical Approach. Energy 2023, 262, 125614. [Google Scholar] [CrossRef]
  29. Wang, J.; Ma, X. Influencing Factors of Carbon Emissions from Transportation in China: Empirical Analysis Based on Two-level Econometrics Method. Acta Sci. Nat. Univ. Pekin. 2021, 57, 1133–1142. (In Chinese) [Google Scholar] [CrossRef]
  30. Yang, W.; Wang, W.; Ouyang, S. The Influencing Factors and Spatial Spillover Effects of CO2 Emissions from Transportation in China. Sci. Total Environ. 2019, 696, 133900. [Google Scholar] [CrossRef]
  31. Chen, Z.; Antunes, J.; Wanke, P.; Zhou, M. Sustainability Drivers in Road Transportation System: Evidence from China. Sci. Total Environ. 2021, 798, 149259. [Google Scholar] [CrossRef]
  32. Jiang, Y.; Zhou, Z.; Liu, C. The Impact of Public Transportation on Carbon Emissions: A Panel Quantile Analysis Based on Chinese Provincial Data. Environ. Sci. Pollut. Res. 2019, 26, 4000–4012. [Google Scholar] [CrossRef]
  33. Jing, Q.-L.; Liu, H.-Z.; Yu, W.-Q.; He, X. The Impact of Public Transportation on Carbon Emissions—From the Perspective of Energy Consumption. Sustainability 2022, 14, 6248. [Google Scholar] [CrossRef]
  34. Sun, H.; Hu, L.; Geng, Y.; Yang, G. Uncovering Impact Factors of Carbon Emissions from Transportation Sector: Evidence from China’s Yangtze River Delta Area. Mitig. Adapt. Strateg. Glob. Change 2020, 25, 1423–1437. [Google Scholar] [CrossRef]
  35. Li, R.; Li, L.; Wang, Q. The Impact of Energy Efficiency on Carbon Emissions: Evidence from the Transportation Sector in Chinese 30 Provinces. Sustain. Cities Soc. 2022, 82, 103880. [Google Scholar] [CrossRef]
  36. Meng, M.; Li, M. Decomposition Analysis and Trend Prediction of CO2 Emissions in China’s Transportation Industry. Sus-tainability 2020, 12, 2596. [Google Scholar] [CrossRef]
  37. Zhao, C.; Zhou, B. Impact of Express Delivery Industry’s Development on Transportation Sector’s Carbon Emissions: An Empirical Analysis from China. Sustainability 2021, 13, 8908. [Google Scholar] [CrossRef]
  38. Sun, Y.; Liu, S.; Li, L. Grey Correlation Analysis of Transportation Carbon Emissions under the Background of Carbon Peak and Carbon Neutrality. Energies 2022, 15, 3064. [Google Scholar] [CrossRef]
  39. Yang, X.; Jia, Z.; Yang, Z.; Yuan, X. The Effects of Technological Factors on Carbon Emissions from Various Sectors in China—A Spatial Perspective. J. Clean. Prod. 2021, 301, 126949. [Google Scholar] [CrossRef]
  40. Liu, Y.; Chen, L.; Huang, C. Study on the Carbon Emission Spillover Effects of Transportation under Technological Ad-vancements. Sustainability 2022, 14, 10608. [Google Scholar] [CrossRef]
  41. Chen, X.; Mao, S.; Lv, S.; Fang, Z. A Study on the Non-Linear Impact of Digital Technology Innovation on Carbon Emissions in the Transportation Industry. Int. J. Environ. Res. Public. Health 2022, 19, 12432. [Google Scholar] [CrossRef]
  42. Zhao, M.; Sun, T. Dynamic Spatial Spillover Effect of New Energy Vehicle Industry Policies on Carbon Emission of Trans-portation Sector in China. Energy Policy 2022, 165, 112991. [Google Scholar] [CrossRef]
  43. Kaya, Y. Impact of Carbon Dioxide Emission Control on GNP Growth: Interpretation of Proposed Scenarios; IPCC Energy and Industry Subgroup, Response Strategies Working Group: Paris, France, 1990. [Google Scholar]
  44. Liu, M.; Zhang, X.; Zhang, M.; Feng, Y.; Liu, Y.; Wen, J.; Liu, L. Influencing Factors of Carbon Emissions in Transportation Industry Based on CD Function and LMDI Decomposition Model: China as an Example. Environ. Impact Assess. Rev. 2021, 90, 106623. [Google Scholar] [CrossRef]
  45. Yu, Y.; Li, S.; Sun, H.; Taghizadeh-Hesary, F. Energy Carbon Emission Reduction of China’s Transportation Sector: An Input–Output Approach. Econ. Anal. Policy 2021, 69, 378–393. [Google Scholar] [CrossRef]
  46. Wang, J.; Wang, Z.; Zhao, Y. Determination of the Conversion Factor of Highway Passenger Turnover in the Perspective of Energy. J. Transp. Eng. 2016, 16, 31–34. (In Chinese) [Google Scholar] [CrossRef]
  47. Yang, Y.; Yan, F.; Yang, Y.; Chen, Y. Evaluating Provincial Carbon Emission Characteristics under China’s Carbon Peaking and Carbon Neutrality Goals. Ecol. Indic. 2023, 156, 111146. [Google Scholar] [CrossRef]
  48. Bai, H.; Qiao, S.; Liu, T.; Zhang, Y.; Xu, H. An Inquiry into Inter-Provincial Carbon Emission Difference in China: Aiming to Differentiated KPIs for Provincial Low Carbon Development. Ecol. Indic. 2016, 60, 754–765. [Google Scholar] [CrossRef]
  49. Ward, J.H. Hierarchical Grouping to Optimize an Objective Function. J. Am. Stat. Assoc. 1963, 58, 236–244. [Google Scholar] [CrossRef]
  50. Eggleston, H.S.; Buendia, L.; Miwa, K.; Ngara, T.; Tanabe, K. 2006 IPCC Guidelines for National Greenhouse Gas Inventories. Japan. 2006. Available online: https://www.ipcc-nggip.iges.or.jp/public/2006gl/index.html (accessed on 12 November 2023).
  51. Shan, Y.; Huang, Q.; Guan, D.; Hubacek, K. China CO2 Emission Accounts 2016–2017. Sci. Data 2020, 7, 54. [Google Scholar] [CrossRef]
  52. Benesty, J.; Chen, J.; Huang, Y. On the Importance of the Pearson Correlation Coefficient in Noise Reduction. IEEE Trans. Audio Speech Lang. Process. 2008, 16, 757–765. [Google Scholar] [CrossRef]
  53. Yang, W.; Li, T.; Cao, X. Examining the Impacts of Socio-Economic Factors, Urban Form and Transportation Development on CO2 Emissions from Transportation in China: A Panel Data Analysis of China’s Provinces. Habitat. Int. 2015, 49, 212–220. [Google Scholar] [CrossRef]
  54. Xie, R.; Fang, J.; Liu, C. The Effects of Transportation Infrastructure on Urban Carbon Emissions. Appl. Energy 2017, 196, 199–207. [Google Scholar] [CrossRef]
  55. Wang, B.; Sun, Y.; Chen, Q.; Wang, Z. Determinants Analysis of Carbon Dioxide Emissions in Passenger and Freight Trans-portation Sectors in China. Struct. Chang. Econ. Dyn. 2018, 47, 127–132. [Google Scholar] [CrossRef]
  56. Kenworthy, J.R.; Laube, F.B. Automobile Dependence in Cities: An International Comparison of Urban Transport and Land Use Patterns with Implications for Sustainability. Environ. Impact Assess. Rev. 1996, 16, 279–308. [Google Scholar] [CrossRef]
  57. Ewing, R. Is Los Angeles-Style Sprawl Desirable? J. Am. Plan. Assoc. 1997, 63, 107–126. [Google Scholar] [CrossRef]
  58. Newman, P. The Environmental Impact of Cities. Environ. Urban. 2006, 18, 275–295. [Google Scholar] [CrossRef]
  59. Reichert, A.; Holz-Rau, C.; Scheiner, J. GHG Emissions in Daily Travel and Long-Distance Travel in Germany—Social and Spatial Correlates. Transp. Res. Part D Transp. Environ. 2016, 49, 25–43. [Google Scholar] [CrossRef]
  60. Zhang, Y.-J.; Jiang, L.; Shi, W. Exploring the Growth-Adjusted Energy-Emission Efficiency of Transportation Industry in China. Energy Econ. 2020, 90, 104873. [Google Scholar] [CrossRef]
  61. Li, W.; Elheddad, M.; Doytch, N. The Impact of Innovation on Environmental Quality: Evidence for the Non-Linear Relationship of Patents and CO2 Emissions in China. J. Environ. Manag. 2021, 292, 112781. [Google Scholar] [CrossRef]
  62. Godil, D.I.; Yu, Z.; Sharif, A.; Usman, R.; Khan, S.A.R. Investigate the Role of Technology Innovation and Renewable Energy in Reducing Transport Sector CO2 Emission in China: A Path toward Sustainable Development. Sustain. Dev. 2021, 29, 694–707. [Google Scholar] [CrossRef]
Figure 1. Framework of the research process workflow.
Land 13 00015 g001
Figure 2. Type division based on hierarchical cluster analysis with Ward’s method.
Land 13 00015 g002
Figure 3. The geographic distribution and TCO2 characteristics of types I–VI.
Land 13 00015 g003
Figure 4. Radar chart of characteristic indicators for Type I.
Land 13 00015 g004
Figure 5. Radar chart of characteristic indicators for Type II.
Land 13 00015 g005
Figure 6. Radar chart of characteristic indicators for Type III.
Land 13 00015 g006
Figure 7. Radar chart of characteristic indicators for Type IV.
Land 13 00015 g007
Figure 8. Radar chart of characteristic indicators for Type V.
Land 13 00015 g008
Figure 9. Radar chart of characteristic indicators for Type VI.
Land 13 00015 g009
Figure 10. The geographic distribution of TC, TI, and TP across Chinese provinces.
Land 13 00015 g010
Figure 11. Comparison of the numerical values of TC, TI, and TP among the six feature types.
Land 13 00015 g011
Figure 12. KPIs related to the local government’s efforts to reduce TCO2 in six types of China.
Land 13 00015 g012
Table 1. Expressions and parameter definitions of characteristic indicators.
Influence FactorsIndicator Name and AbbreviationIndicator DescriptionIndicator Expression and Parameter Definition
Transportation economic output intensityTransportation economic structure (TEC) Reflects   the   level   of   economic   structure   share   of   the   transportation   sec tor   in   province   i compared to the provincial average. T E C = E C i / G D P i T E C ¯
E C i is the added value of the transportation sector in province i , G D P i is the gross domestic product of province i , T E C ¯ is the provincial average value of the numerator.
Transportation energy structureTransportation energy structure (TES) Reflects   the   level   of   clean   energy   structure   share   in   the   transportation   energy   consumption   of   province   i compared to the provincial average. T E S = R E i / T E i + H E i T E S ¯
R E i is the consumption of clean energies such as electricity and natural gas in the transportation sector of province i , T E i is the total energy consumption of transportation in province i , H E i is the consumption of “gasoline” and “diesel oil” in “residential life” of province i , T E S ¯ is the provincial average value of the numerator.
transportation energy intensityTransportation energy consumption efficiency (TEE) Reflects   the   level   of   energy   consumption   per   unit   of   transportation   turnover   in   province   i compared to the provincial average. T E F = ( T E i + H E i ) / T T i T E F ¯
T T i is the total transportation turnover ( including   passenger   and   freight   turnover ) ,   T E F ¯ is the provincial average value of the numerator.
R&D level of transportation technology (RDL) Reflects   the   level   of   technological   R & D   capability   in   the   transportation   sec tor   of   province   i compared to the provincial average. R D L = R D i / P O i R D L ¯
R D i is the internal expenditure on R&D funds for the transportation sector in province i , P O i is the year-end population of province i , R D L ¯ is the provincial average value of the numerator.
Population factorUrban population density level (UPL)Reflects the level of the gap between the population density of urban and county in province i compared to the provincial average (lower values indicate higher urban population density). U P L = C P i / U P i U P L ¯
C P i is the county population density of province i , U P i is the urban population density of province i , U P L ¯ is the provincial average value of the numerator.
Transportation infrastructure constructionRoad construction level (RCL) Reflects   the   level   of   intensity   of   urban   road   and   highway   construction   in   province   i compared to the provincial average. R C L = 0.5 × U R i / U P i R 1 ¯ + 0.5 × H M i / P O i R 2 ¯
U R i is the actual urban road length by year-end of province i , U P i is the urban population by year-end of province i , H M i is the highway mileage of province i , R 1 ¯ and R 2 ¯ are the provincial average values of each numerator.
Public transportation construction level (PTL) Reflects   the   level   of   intensity   of   urban   public   transportation   construction   in   province   i compared to the provincial average. P T L = 0.5 × B T i / U P i P 1 ¯ + 0.3 × R T i / U P i P 2 ¯ + 0.2 × T X i / U P i P 3 ¯
B T i is the number of operating buses and trolley buses in cities of province i , R T i is the number of rail transit vehicles assigned in province i , T X i is the number of taxis in province i , P 1 ¯ , P 2 ¯ , and P 3 ¯ are the provincial average values of each numerator.
Transportation pollution intensityTraffic operation pressure (TOP) Reflects   the   level   of   potential   and   current   pressure   from   road   traffic   operation   in   province   i compared to the provincial average. T O P = 0.5 × P C i / P O i T 1 ¯ + 0.5 × T C i T 2 ¯
P C i is the private car ownership in province i , T C i is the sum of road traffic congestion in province i . T 1 ¯ , and T 2 ¯ are the provincial average values of each numerator.
Pollution intensity of resident transportation behaviorsResidents’ living consumption level (RLC) Reflects   the   level   of   consumption   and   travel   frequency   of   residents   in   province   i compared to the provincial average. R L C = 0.5 × T R i / P O i C 1 ¯ + 0.5 × T P i / P O i C 2 ¯
T R i is the total resident consumption expenditure of province i , T P i is the passenger volume of province i . C 1 ¯ , and C 2 ¯ are the provincial average values of each numerator.
Note: (1) The indicators are dimensionless, and no unit description is provided. (2) The total transportation turnover in the TEE indicator includes both passenger turnover and freight turnover. Following existing research [46], passenger turnover was converted to freight turnover using a conversion coefficient of 1 t·km = 7.1 person·km, and then summed up. (3) For UPL, since Beijing, Shanghai, and Tianjin are cities in the later stages of urbanization, county population statistics are not available (values are 0) in the China Statistical Yearbook 2020. Therefore, county population was used as the numerator for calculation.
Table 2. Numerical values of characteristic indicators for Types I–VI.
TypeTECTESTEERDLUPLRCLPTLTOPRLC
Type I0.910.650.991.870.000.542.001.391.73
Type II0.910.680.550.350.970.880.801.080.72
Type III0.961.290.862.001.111.050.850.820.92
Type IV1.511.770.450.210.941.050.591.100.53
Type V0.960.781.770.341.061.080.640.810.76
Type VI0.981.380.860.181.471.300.860.871.50
Table 3. Numerical values of TC, TI, and TP for Types I–VI.
TypeTC (Mt)TI (t/104 CNY)TP (t/Person)
Type I37.153.051.71
Type II43.472.070.63
Type III33.061.910.64
Type IV22.411.530.56
Type V29.892.880.63
Type VI10.492.760.64
Provincial average30.732.400.73
Table 4. The ratios of TC, TI, and TP values to their averages and directions of priority control for carbon reduction for Types I–VI.
ProvinceTC/TC AverageTI/TI AverageTP/TP AveragePriority Control Directions for Carbon Reduction
Type I1.211.272.33TP control
Type II1.410.860.86TC control
Type III1.080.790.87TC control
Type IV0.730.630.77TP control
Type V0.971.200.85TI control
Type VI0.341.150.87TI control
Table 5. Correlation analysis results of TP with RDL, UPL, PTL, TOP, and RLC.
RDLUPLPTLTOPRLC
TPPearson correlation0.857 **−0.567 **0.842 **0.485 **0.498 **
Sig. (2-tailed)0.0000.0010.0000.0070.005
N3030303030
Note: ** indicates a significant level of correlation of 1%.
Table 6. Correlation analysis results of RDL with UPL, PTL, TOP, and RLC.
UPLPTLTOPRLC
RDLPearson correlation−0.569 **0.880 **0.498 **0.437 *
Sig. (2-tailed)0.0010.0000.0050.016
N30303030
Note: ** indicates a significant level of correlation of 1%, and * indicates a significant level of correlation of 5%.
Table 7. Correlation analysis results of TI with TEC, TEE, PTL, and RLC.
TECTEEPTLRLC
TIPearson correlation−0.415 *0.528 **0.386 *0.501 **
Sig. (2-tailed)0.0230.0030.0350.005
N30303030
Note: ** indicates a significant level of correlation of 1%, and * indicates a significant level of correlation of 5%.
Table 8. Correlation analysis results of PTL with TEE, UPL, RCL, TOP, and RLC.
TEEUPLRCLTOPRLC
PTLPearson correlation0.439 *−0.625 **−0.384 *0.607 **0.573 **
Sig. (2-tailed)0.0150.0000.0360.0000.001
N3030303030
Note: ** indicates a significant level of correlation of 1%, and * indicates a significant level of correlation of 5%.
Disclaimer/Publisher’s Note: The statements, opinions and data contained in all publications are solely those of the individual author(s) and contributor(s) and not of MDPI and/or the editor(s). MDPI and/or the editor(s) disclaim responsibility for any injury to people or property resulting from any ideas, methods, instructions or products referred to in the content.

