Article

Where Are the Trade-Offs in Multiple Ecosystem Services in the Process of Ecological Restoration? A Case Study on the Vegetation Restoration Area in the Loess Plateau, Northern Shaanxi

1
The Research Center of Soil and Water Conservation and Ecological Environment, Chinese Academy of Sciences and Ministry of Education, Yangling, Xianyang 712100, China
2
Institute of Soil and Water Conservation, Chinese Academy of Sciences and Ministry of Water Resources, Yangling, Xianyang 712100, China
3
University of Chinese Academy of Sciences, Beijing 100049, China
4
Institute of Soil and Water Conservation, Northwest A&F University, Yangling, Xianyang 712100, China
5
Research Center for Eco-Environmental Sciences, Chinese Academy of Sciences, Beijing 100085, China
*
Authors to whom correspondence should be addressed.
Land 2024, 13(1), 70; https://doi.org/10.3390/land13010070
Submission received: 4 December 2023 / Revised: 3 January 2024 / Accepted: 4 January 2024 / Published: 7 January 2024

Abstract

:
Revealing trade-off and synergistic relationships among ecosystem services plays a key role in ensuring a stable ecosystem for long-term development. It is the crucial precondition for realizing watershed protection and high-quality development. The variations in land use during 1990–2020 are investigated by taking the typical areas for returning farmland to forests as an example. The spatiotemporal distributions of six key ecosystem services, namely carbon storage, water yield, net primary productivity (NPP), soil conservation, habitat quality, and forest recreation are quantified by the InVEST model and statistical data. We also uncover the spatial difference in the ecosystem in Loess Plateau, located in northern Shaanxi, with hot spot analysis and probe the trade-off and synergistic correlations among the investigated ecosystem services. The results show that: (1) the farmland decreased dramatically. On the contrary, the forests and orchards increased significantly. (2) During the same period, carbon storage and habitat quality increased, and water yield, NPP, soil conservation, and forest recreation initially declined, but subsequently rose to higher values than that in 1990. All these services in the southeastern part of the research area surpass those found in the northwest. (3) The ecosystem services relationships in northern Shaanxi are mainly characterized by synergistic correlations, which became stronger from 1990 to 2020. The trade-off effects mainly occur among the water yield and other ecosystem services and are distributed in the west and north of the investigated area. Based on these findings, this work provides scientific principles for improving the ecological environment and enhancing the resource sustainability of the study area.

1. Introduction

The products and conservation functionalities furnished by an ecosystem, such as climate adjustment, soil and water conservation, carbon capture, and other functions that are difficult to commercialize, are denoted as ecosystem services [1,2]. However, ecosystem services are decreasing because of global climate change and human intervention [3,4]. Meanwhile, the situation leads to complex trade-off and synergistic effects among competing economic and environmental targets [5,6,7]. For many years, humans have been involved in natural ecosystems to maximize the economic benefits by sacrificing ecosystem services [8]. Such trade-offs have negative effects on the environment and human society [9,10]. Therefore, revealing the spatiotemporal evolution characteristics of trade-offs and synergies between different types of ecosystem services is the precondition for ensuring long-term ecosystem services. More importantly, the revealed mechanisms provide a valuable foundation for sustainable decision making.
Recently, the trade-off and synergistic relationships among ecosystem services on a global scale have attracted extensive attention [11,12,13]. Prior studies have indicated that environments pose complex effects on ecosystem services and trade-offs [14]. Such influences have a scale effect. Therefore, it is crucial to simulate and quantify the spatiotemporal features of the trade-off and synergistic effects among ecosystem services [15]. Previous works have revealed some ecosystem services’ spatial and temporal patterns on global, continental, country, regional, and watershed scales. For example, Wang et al. [16] investigated the trade-offs among different ecosystems in the Shiyang River basin on whole basin and subbasin scales from 2005 to 2015. Pan and Li [17] also estimated the trade-off and synergistic effects of arid inland river basins during 2000–2010. However, most previous works have only focused on the trade-offs and synergies among ecosystem services for two time points during 2000–2015 [16,18]. Therefore, a thorough and systematic understanding of the matter based on long timescales is highly desired. Such investigations are of vital importance to improve the reliability of trade-off results and to avoid misjudgments caused by unforeseeable factors and time lags during the evolution of ecosystems [19]. Currently, popular models to evaluate ecosystem services are SWAT [20], ARIES [21], RUSLE [22], SolVES [23], and InVEST [24], among which the InVEST (Integrated Valuation of Ecosystem Services and Trade-offs) model includes multiple ecosystems and is more flexible, stable, and user friendly than the alternatives [25,26]. Because of these merits, this model provides essential technical support to the management of ecosystems and attracts extensive applications for the assessment of the ecological environment [27]. Also, trade-off and synergy analysis are widely employed to probe the interactions among different ecosystem services [28,29,30,31].
At the end of the last century, China initiated a massive ecological restoration project, also denoted as the Grain for Green Project (GGP), in the Loess Plateau, aiming to increase the vegetation coverage and alleviate soil erosion by transforming farmlands on steep slopes to forests and grasslands [32]. Over the past 20 years, massive changes have appeared in land cover, and such changes have captured researchers’ attention, who aim to uncover the effects introduced by the GGP on ecosystem services [33]. Previous studies have indicated that the GGP has improved the ecosystem conditions and increased the vegetation coverage, carbon sequestration, and the organic carbon in the soil [34,35]. However, earlier researchers normally placed their focus on carbon storage, soil conservation, and water yield [36]. An in-depth understanding of the interactions among more types of ecosystem services for longer timescales is still lacking. The underlying mechanisms for alleviating the trade-offs and strengthening the synergies are of paramount importance for the sustainable development of the ecosystem in northern Shaanxi. The north of Shaanxi province is distributed with eco-sensitive Loess hilly–gully areas. Additionally, this region is representative and typical, being one of the initiation areas of the GGP. After the GGP’s initiation, northern Shaanxi experienced many changes in land use and ecosystem services. Thus, this study chooses the Loess Plateau in northern Shaanxi as the representative region to investigate the evolution of land use and six key ecosystem services by combining multivariate data, such as weather and soil, from 1990 to 2020. The researched ecosystem services in this work include carbon storage, water yield, net primary productivity (NPP), soil conservation, habitat quality, and forest recreation. We further analyze the distribution features of the temporal and spatial variations, as well as the hot and cold spots in the ecosystem services. Finally, the interactions among the ecosystem services are probed. This work provides scientific evidence for policymaking to enhance the sustainable and efficient utilization of natural resources in northern Shaanxi.

2. Materials and Methods
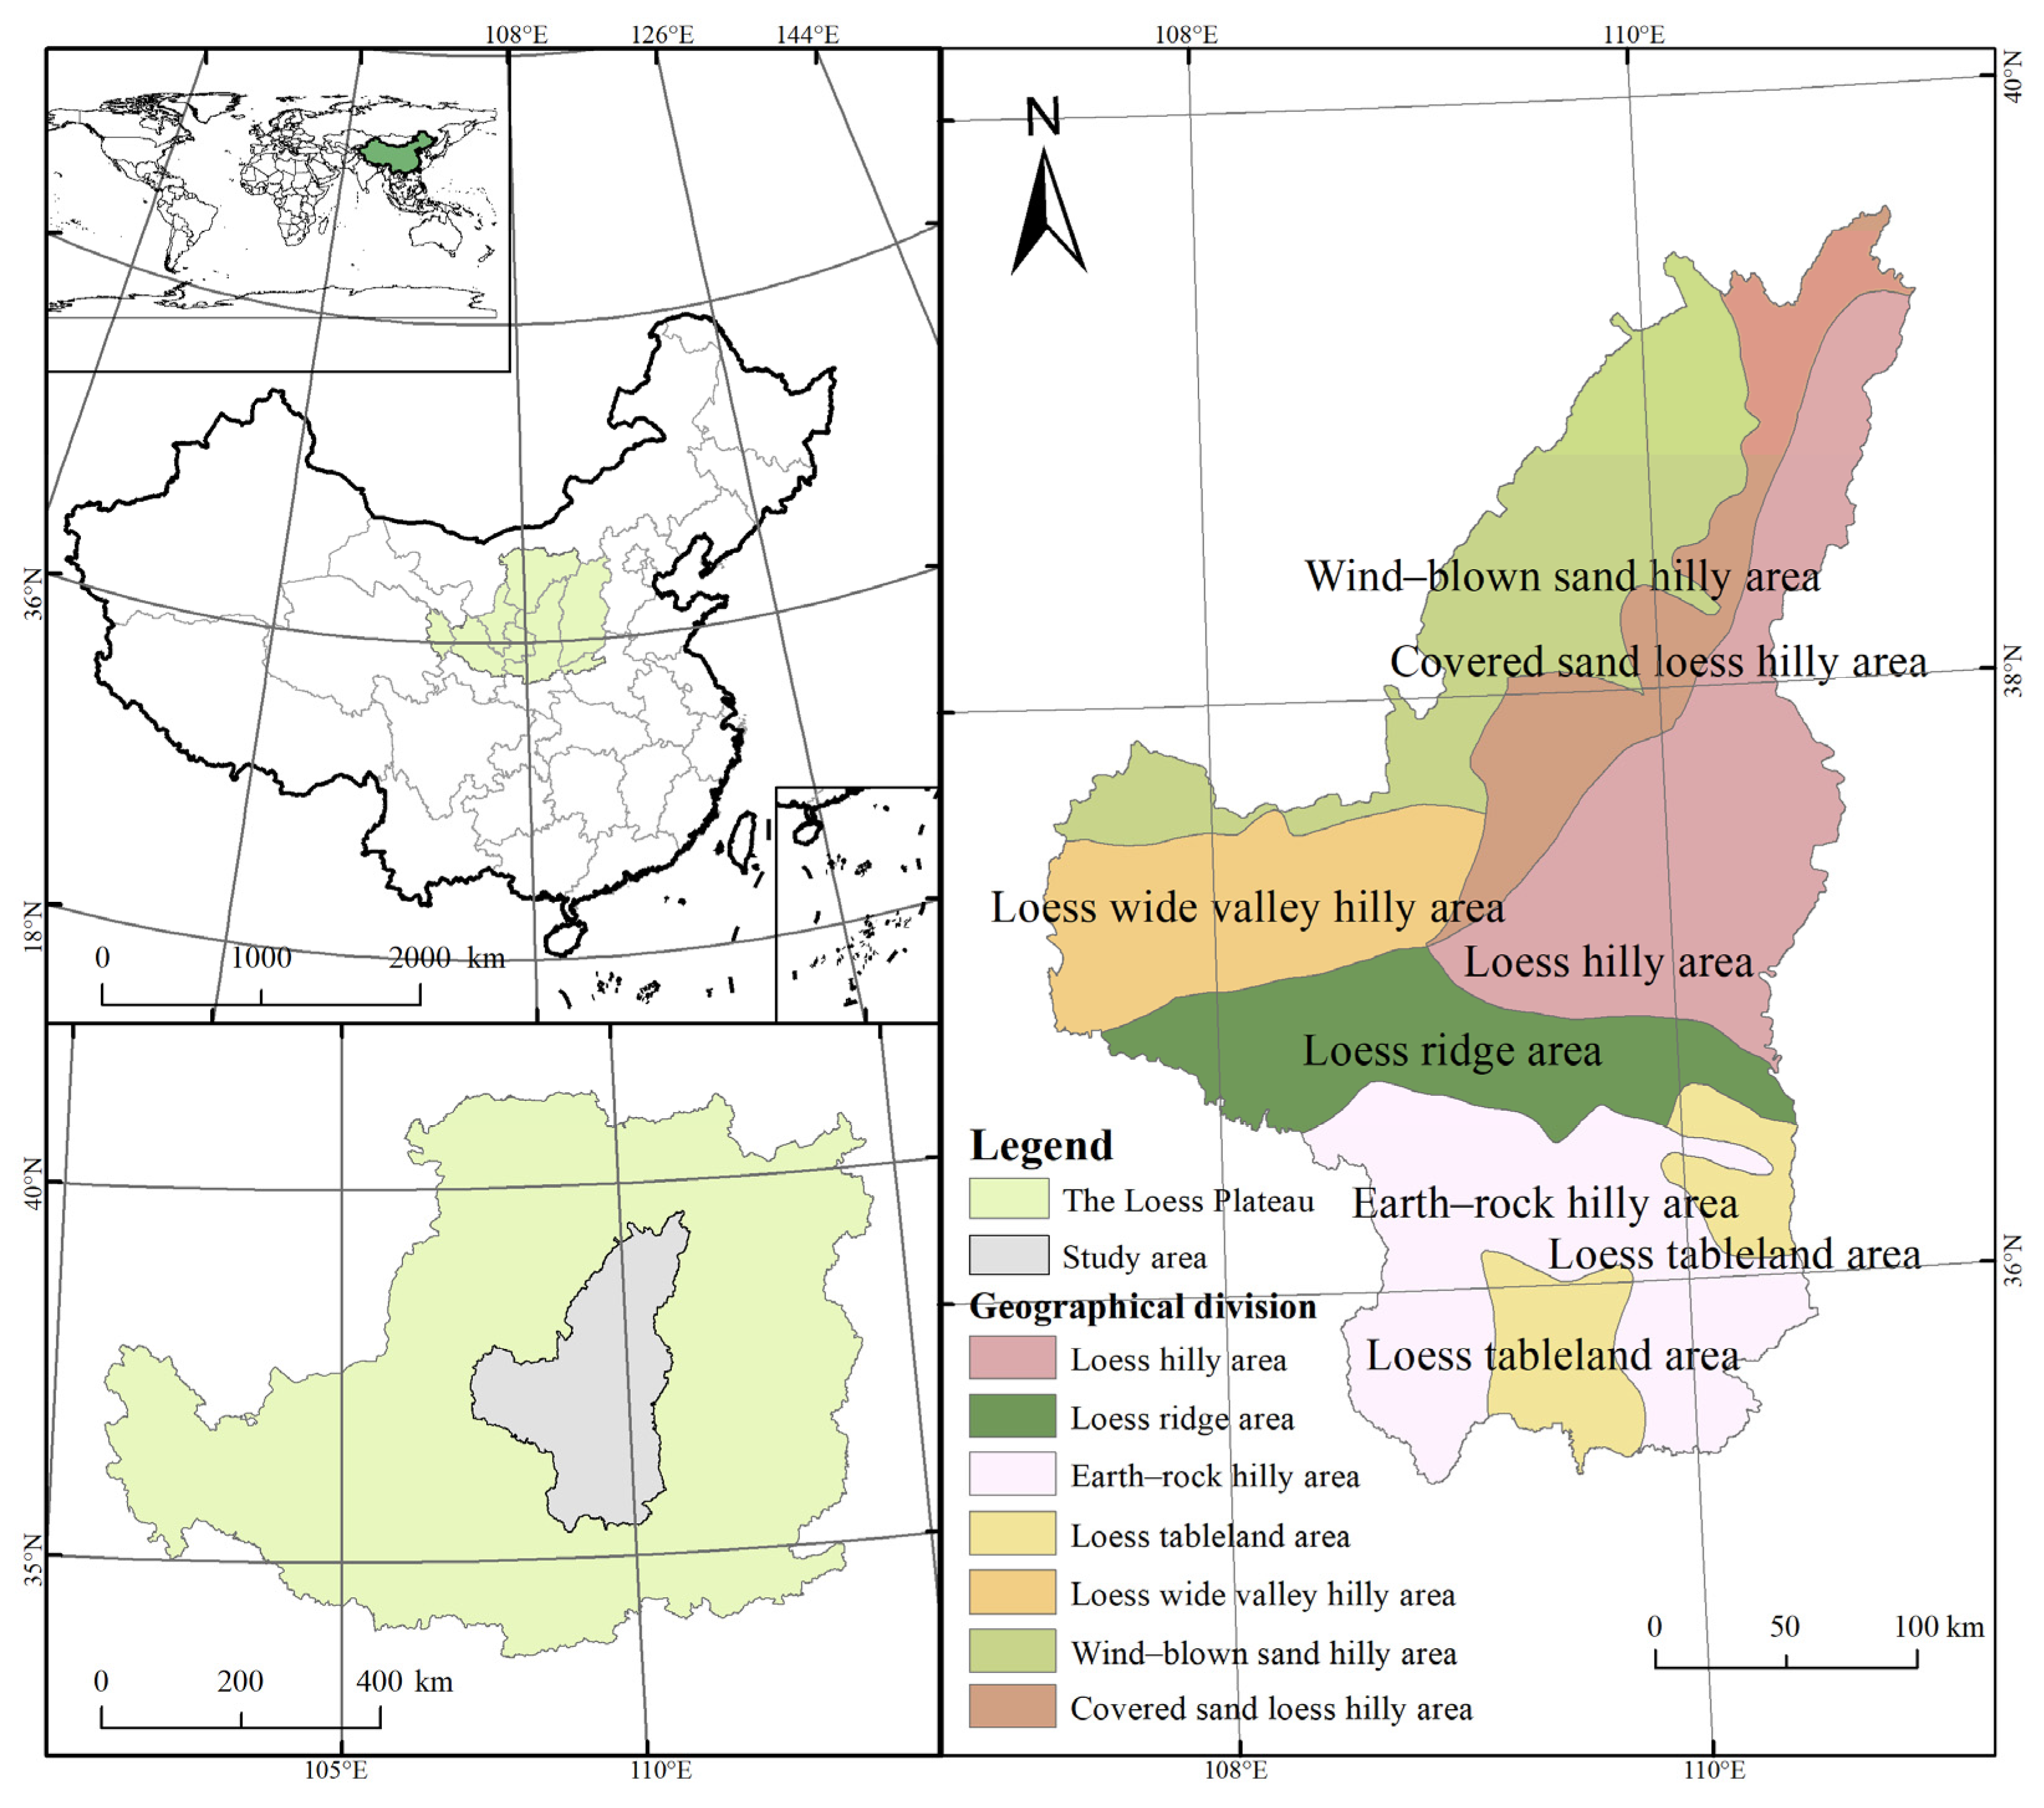
2.1. Study Area

The northern Shaanxi Loess Plateau (35°21′–39°35′ N and 107°28′–111°15′ E) is situated in the northwest of China (Figure 1). The study area includes two prefecture-level cities, Yulin and Yan’an, and a total of 25 districts and counties. Multiple land types can be found in this terrain as the elevation spans from nearly 400 m in the northeast to 1990 m in the southwest. In the northwestern part, one can find wind-blown sand, hilly and wide valley, hilly loess areas. Extensive loess hilly areas are located in the east region. The loess ridge dominates the central area, while the south area is occupied by earth–rock hilly and loess tableland areas. The regional climate is in the interzone between the continental monsoon semi-humid climate in the warm humid zone to a temperate semi-arid climate. Precipitation occurs mainly from July to September, which exhibits seasonal characteristics [37]. The land area of the study area is 79,951.5 km2, which is 38.88% of Shaanxi province and 12.59% of the entire Loess Plateau [38]. In 2020, the permanent population in northern Shaanxi was 5.91 million, with an urbanization rate of 61.51%, and the total regional gross domestic product (GDP) amounted to CNY 569.55 billion. The natural resource endowments of the counties and urban areas in the investigated region are quite different, and economic growth among the regions is unbalanced. Northern Shaanxi is a critical area for national ecological functions. After over 20 years of GGP projects, the spatial pattern of land utilization in this region has been noticeably improved [39,40], manifesting decreased farming and unused land, and increased areas of forests and orchards.

2.2. Data Collection and Processing

We used the data on the land-use coverage, DEM, NPP, meteorology, soil, and other geographical data at different time points before and after the GGP. Specifically, (1) the dataset on the land use incorporates classification maps for 1990, 1995, 2000, 2005, 2010, 2015, and 2020. Then, land use was reclassified by the “Chinese Land Use/Cover Remote Sensing Monitoring Data Classification System”. Based on this system, the land utilization in the Loess Plateau located in northern Shaanxi was classified into seven types, namely farmland, forest, grassland, orchard, water, construction land, and unused land. Based on Google imagery and field-collected land-use data from the study area in 2020, 1645 training samples with seven land-use types were retrieved. Landsat images were selected as the data source on the Google Earth Engine (GEE) platform, and samples were used as input data for land-use classification. The spectral, texture, terrain, and canopy features were extracted as indicators for random forest-based land-use classification. Such categories for the northern Loess Plateau in 2020 were obtained, achieving an overall classification accuracy of 89.62% or higher. The collected data were classified according to the established classification rules. The classified data were then compared with the 30 m land-use data downloaded from the Data Center for Resources and Environmental Sciences, Chinese Academy of Sciences. Obvious misclassifications were identified and corrected. (2) The statistical data on the monthly rainfall, temperature, and evapotranspiration were used from the Loess Plateau Data Center. (3) The soil data were collected from the Harmonized World Soil Database version 1.1 (HWSD), supported by the FAO and IIASA. (4) The DEM data at a 30 m resolution from the Geospatial Data Cloud was used, with GDEM v3. (5) The NPP data were generated by the CASE model, based on the Global Resources Data Cloud during 1990–2020. (6) Other data types, including regarding the administrative districts, residential points, traffic, water systems, population density, and topographic maps, were available from the Loess Plateau Data Center and prior works.

2.3. Methods for Evaluating the Ecosystem Service

According to the Millennium Ecosystem Assessment, ecosystem services are classified into supply, regulation, support, and cultural services [41]. Considering the comprehensiveness, availability of data, and feasibility of the study, this paper selected water yield in the supply service, carbon storage, and NPP in the regulation service, soil conservation, and habitat quality in the support service, forest recreation in cultural services, respectively, and conducted quantification and an evaluation based on the InVEST model, the CASE model, and ArcGIS 10.6.

2.3.1. Carbon Storage

This type of ecosystem service describes the ability of ecosystems to fix and store CO2. Moreover, carbon storage was evaluated by calculating the summation of four carbon sources with different land-use types [42]. The specific equation is:
C t o t , i   = C a b o v e , i   + C b e l o w , i   + C s o i l , i   + C d e a d , i
where C t o t , i is the total sequestration amount of CO2 in the i-th pixel, with the unit of t/hm2. Moreover, C a b o v e , i , C b e l o w , i , C s o i l , i , and C d e a d , i is the carbon storage above the land surface, below the land surface, in the soil, and in dead organic matter. The data on the carbon density were collected from previous works on carbon storage in China and the Loess Plateau [43,44,45].

2.3.2. Water Yield

The water yield is commonly used to describe the difference between precipitation and evaporation, which is one of the parameters for evaluating the water supply capability of ecosystems. The water yield obtained from the InVEST model was computed with the water–energy coupling proposed by Budyko [46]:
Y x j = 1 - A E T x j P x ×   P x  
where Y x j , P x , and A E T x j are the annual water yield, average precipitation, and actual annual mean evapotranspiration, respectively. The subscripts x and j denote the grid unit and land-use type, respectively. The biophysical coefficients and other parameters were acquired from previous research. The crop reference values were acquired from the Food and Agriculture Organization and were recommended by other models [42,47,48].

2.3.3. Net Primary Productivity (NPP)

The Carnegie–Ames–Stanford Approach (CASA) [49] model was used to calculate the NPP value:
N P P x ,   t = A P A R x ,   t   ×   ε x ,   t
A P A R x ,   t = S O L x ,   t   ×   0.5   ×   F P A R x ,   t
ε x ,   t =   T ε 1 x ,   t   ×   T ε 2 x ,   t   ×   W ε x ,   t   ×   ε m a x
where NPP(x, t) is the NPP value (gC/(m2yr)), and x and t are the location and time, respectively; APAR(x, t) is the photosynthetically active radiation (MJ/m2); ε x ,   t is the actual light use efficiency (gC/MJ); SOL(x, t) is the total solar radiation (MJ/m2); the coefficient of 0.5 is the ratio of the effective solar radiation against the total solar radiation; FPAR(x, t) is the fraction of photosynthetically active radiation absorbed by the vegetation canopy; T ε 1 x ,   t and T ε 2 x ,   t are temperature stress coefficients, and W ε x ,   t is the water stress coefficient. Moreover, ε m a x is the maximal light use efficiency of the specific biome under ideal conditions.

2.3.4. Soil Conservation

We used the Sediment Delivery Ratio in InVEST to assess the soil conservation of the Loess Plateau in northern Shaanxi. This module thoroughly includes the sediment from the surface interception, and the vegetation reduces soil erosion and traps the sediment in soil conservation. By using equations for soil erosion, the loss value in all the square grids was calculated. The calculation process is as follows [42]:
S E D R E T = P K L S x   -   U S L E x + S E D R x
P K L S x =   R x   ×   K x   ×   L S x
U S L E x =   R x   ×   K x   ×   L S x   ×   C x   ×   P x
S E D R x = S E x y = 1 x - 1 U S L E y z = y + 1 x - 1 S E x  
where SEDRET is the conservation value of the soil; S E D R x and S E x are the conservation and the retention efficiency of the sediment in the x-th grid, respectively.

2.3.5. Habitat Quality

In a certain period, habitat quality is highly correlated with the regional structure and ecological function, and the level of habitat quality is dictated by the resources for the survival, reproduction, and development of living creatures, which is used to quantify biodiversity. Generally, a higher habitat quality leads to higher biodiversity. This work incorporated the land-use data. In addition, the suitability, influence distance, and the weight of threatening factors were adopted to quantify the habitat quality. Specifically, the habitat quality was obtained by the following calculation:
Q i =   H i   ×   1   -   D i z D i z + k z  
where Q i is the habitat quality of the i-th pixel from 0 to 1. Generally, a higher Q i denotes better habitat quality. Moreover, H i denotes the habitat adaptability; D i is the habitat degradation degree, which is correlated with threatening factors, the threat intensity, and the sensitivity of land uses to threats. In addition, k is the half-saturation constant, denoting half of the habitat deterioration degree. Also, z is used to represent the normalization constant in the model.

2.3.6. Forest Recreation

Forest recreation is an ecosystem service provided by the forest for tourism and recreation. The forest recreation ability can be quantified by the forest recreation indicator, which was calculated by estimating the recreational opportunities, forest habitat, population density, and road accessibility. The calculation is as follows:
F R I i =   A i o p p i + p o p i + r o a d i
where FRI is the forest recreation indicator; A, opp, pop, and road are the pixel areas, recreational opportunities, population density, and road accessibility, respectively.

2.4. Hot-Spot Analysis

This analysis was used to probe the intensity of various service values. The hot spots should have intensified high values. While the cold spots have gathered low values. In the spatial statistics, the Gi* coefficient was adopted to investigate the clustering location of the high and low spots in all the ecosystem services. Such coefficient is an effective factor in the local spatial autocorrelation index based on the total distance matrix, which was calculated by:
G i *   = j n w i j x j j n x j
The statistical importance of G* can be examined by a normalized Z ( G i * ) , and the normalization of G* was proceeded with:
Z G i * = G j E ( G i * ) V A R ( G i * ) = j w i j x j x ¯ j n w i j z n j n w i j z j n w i j z n 1
X - = j n x j n
S = j n x j z n   -   X - 2
where w i j is the spatial weight matrix of plaque i and j. Moreover, xj is the value of plaque j, and X represents the mean value of all the attributes, while n denotes the quantity of the plaques. This investigation employed ArcGIS 10.6 to assign the raw ecosystem services data to the grid. The resolution of such a grid is 0.5 km × 0.5 km. Further analysis was performed using the Getis-Ord Gi* tools.

2.5. Evaluation Method for the Trade-Off and Synergistic Relationships

To reveal correlations between the ecosystem services in the study area and further uncover the detailed trade-offs and synergies, we randomly created 3000 points with the random points generation tool in ArcGIS 10.6. We also analyzed the correlations of every extracted point. If the correlation coefficient is positive, the relationship is defined as a synergistic correlation. In contrast, the trade-off relationship can be found with negative coefficients [50], and the correlations were analyzed in SPSS version 19. Specifically, the correlation and significance among different spatial ecosystem services during 1990–2020 were quantified using the Python code at the pixel scale. According to the calculated R and p values, the relationships are classified in Table 1.

3. Results

3.1. Evolution of Land Use and Land Cover from 1990 to 2020

As shown in Table 2, before 2000, grassland, farmland, and forest dominated the land use in northern Shaanxi, at around 90.02% of the total area. In contrast, the areas for orchards, water, construction land, and unused land were relatively small. After 2000, the area of orchards continued to increase, and now northern Shaanxi largely consists of grassland, farmland, orchards, and forests, accounting for 93.20% of the total area. After the initiation of the GGP in 2000, the size of farmland in northern Shaanxi decreased from 28,100 km² in 1990 to 19,700 km² in 2020, a decrease of 10.50%. Additionally, the city expansion increased the construction land area from 264.43 km² in 1990 to 1085.05 km² in 2020, an increase from 0.33% to 1.35% of the total area. At the same time, the size of unused land also had a corresponding decrease, from 5946.96 km² in 1990 to 3678.23 km² in 2020, a decrease of 2267.73 km². The area of water remained unchanged.

3.2. The Spatiotemporal Variation Characteristics of Ecosystem Services

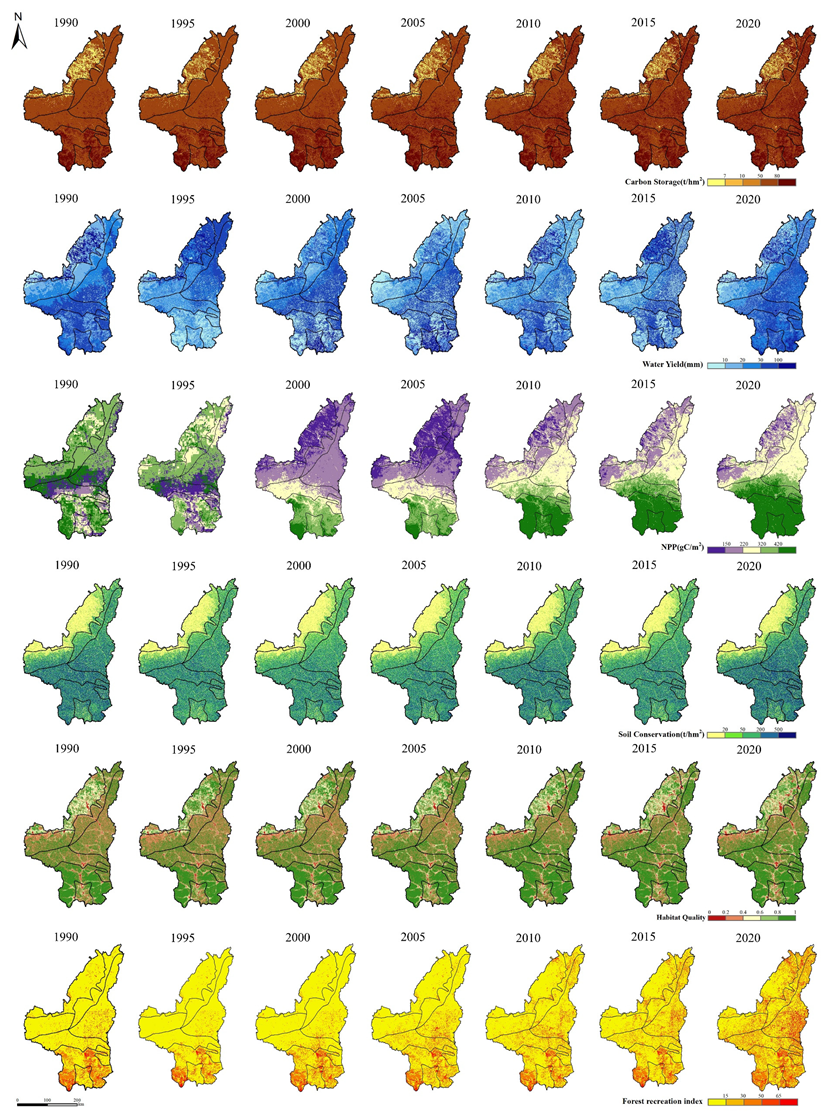
3.2.1. Spatiotemporal Changes in Ecosystem Services

The spatiotemporal distributions and differences in six ecosystem services among the different land types are illustrated in Figure 2 and Figure 3, respectively. The results show that carbon storage increased from 0.51 to 0.55 billion tons during 1990–2020. Regarding the spatial distribution, the ecosystem services in the southeast are higher than those in the northwest. The forests, grasslands, and orchards in the south and east regions display the highest carbon storage, followed by farmland, construction areas, and water. In contrast, the water yield decreased and then increased, resulting in a higher value in 2020. Specifically, the water yield depth decreased to 33.04 mm in 2000 from 42.81 mm in 1990. After that, the depth of the water yield increased to 46.96 mm in 2020. Moreover, the increase in the southern region was more significant than in other areas. The NPP fluctuated during the study period. Specifically, the NPP decreased from 27.00 million tons (1990) to 18.20 million tons (1995). Then, the NPP expanded constantly to 27.95 million tons in 2020. Significant increases in NPP are observed in the south of the study area, and the northern part also showed an increase in NPP after 2000. The soil conservation ability reached the lowest value in 2000, which was around 1.27 billion tons, then increased to 1.97 billion tons in 2020, similar to the trend in the water yield depth. For the spatial distribution, the soil conservation in the center and south of the study area increased more prominently than in other areas. The habitat quality presented a monotonic increase from 0.64 in 1990 to 0.69 in 2020, indicating that the general conservation service of biodiversity was at an elevated level and shows a positive trend in the future. Additionally, a more significant growth in the habitat quality happened in the center of the study area. The forest recreation index shrank from 7.69 in 1990 to the bottom of 4.99 in 1995. After that, it was enhanced to 17.98 in 2020. In general, forest recreation increased notably in the north and east.
This work illustrates the functionalities of the different ecosystem services among the various land-use types with rose charts, as shown in Figure 3, to benefit the analyses and visualization. For the carbon storage, soil conservation, and NPP services, grassland, farmland, and forests dominated the service contributions. The service value of carbon storage and soil conservation increased with the increase in orchards. The water yield service was mainly provided by grassland, unused land, and farmland. The unused land provided less water yield during 2000–2005. The habitat qualities of orchards, forests, and grasslands showed relatively higher values. Such values in water areas, unused land, and farmland were lower. Moreover, the construction land barely provided the habitat quality service. The main contribution of forests and orchards lies in the forest recreation service.
Compared with previous research results, the results from this paper are reliable. For example, Li reported that the average water yield depth in northern Shaanxi during 2000–2020 was 41.39 mm, and the total yield was 3.33 billion m3. In our work, the value of the water yield depth and total water yield in the same period was 36.94 mm and 2.86 billion m3, respectively. Such deviations are understandable as the water yield depth and total water yield are calculated by averaging the values for 2000, 2005, 2010, 2015, and 2020, which is different from Li’s report [51]. The carbon storage and soil conservation in the middle reaches of the Yellow River basin in 2000, calculated by Ren [52], was 47.70 t/hm2 and 194.78 t/hm2, respectively. Our results in a similar region show that these values are 65.31 t/hm and 157.63 t/hm2, respectively. The difference between this work and Ren’s could be caused by the method for calculating carbon storage, as well as different data on the spatial heterogeneity and land use. The habitat quality and NPP of the Loess Plateau in 2018, as reported by Yang [53], were 0.684 and 336.99 gC/m2, very close to our results (habitat quality: 0.69; NPP: 344.76 gC/m2). Additionally, the results reported by Chen et al. [54] indicated that the outdoor recreation ability in Yan’an City decreased during 1990–2000 and increased after that, also consistent with our results. Though the ecosystem service values calculated in this work deviate from prior reports, they are still in the same order of magnitude, indicating good robustness in this work.

3.2.2. Hot and Cold Spots Analyses

The hot and cold spot patterns for the ecosystem services in northern Shaanxi are further analyzed. Similar spatial distributions are observed for the hot and cold area distributions among different types of ecosystem services from 1990–2020. Therefore, we analyze the spatial pattern of ecosystem services cold and hot spots in northern Shaanxi in 2020, as shown in Figure 4. The spots of carbon storage and habitat quality share a similar pattern. More specifically, the hot spots are distributed among the earth–rock hilly areas with abundant resources from forests, grasslands, and orchards. In contrast, most cold spots can be found in the wind−blown sand, hilly area, where the unused land is concentrated and is normally found with low service values. Different from the distribution of carbon storage, the cold spots of habitat quality can be found in the loess tableland area of the south region, the loess ridge area of the central part, and is concentrated in areas with threatening sources (farmland and construction land) in Yulin City. For the water yield service, the hot spots are located in the wind−blown sand, hilly area and in the towns of central Yan’an City. Such a phenomenon may be caused by the fast growth of local cities and the increase in impermeable ground caused by ground hardening. The cold spots are extensively distributed in the center of the investigated region. In the fields with lower city development, precipitation can be conserved by plants. The distribution of soil conservation is similar to that of the NPP. Specifically, the cold spots can be found in the flat areas where the wind−blown sand, hilly and wide valley, loess hilly areas dominate the terrain. The hot spots in the soil conservation service are found in the southeast of the study area, with serious soil loss and higher sediment output. In contrast, hot spots in the NPP are extensively distributed in earth–rock hilly regions in the south. The cold spots in forest recreation are relatively sparse, and the hot spots are mainly found in the center of the loess hilly area.

3.3. Synergy and Trade-Off Analysis

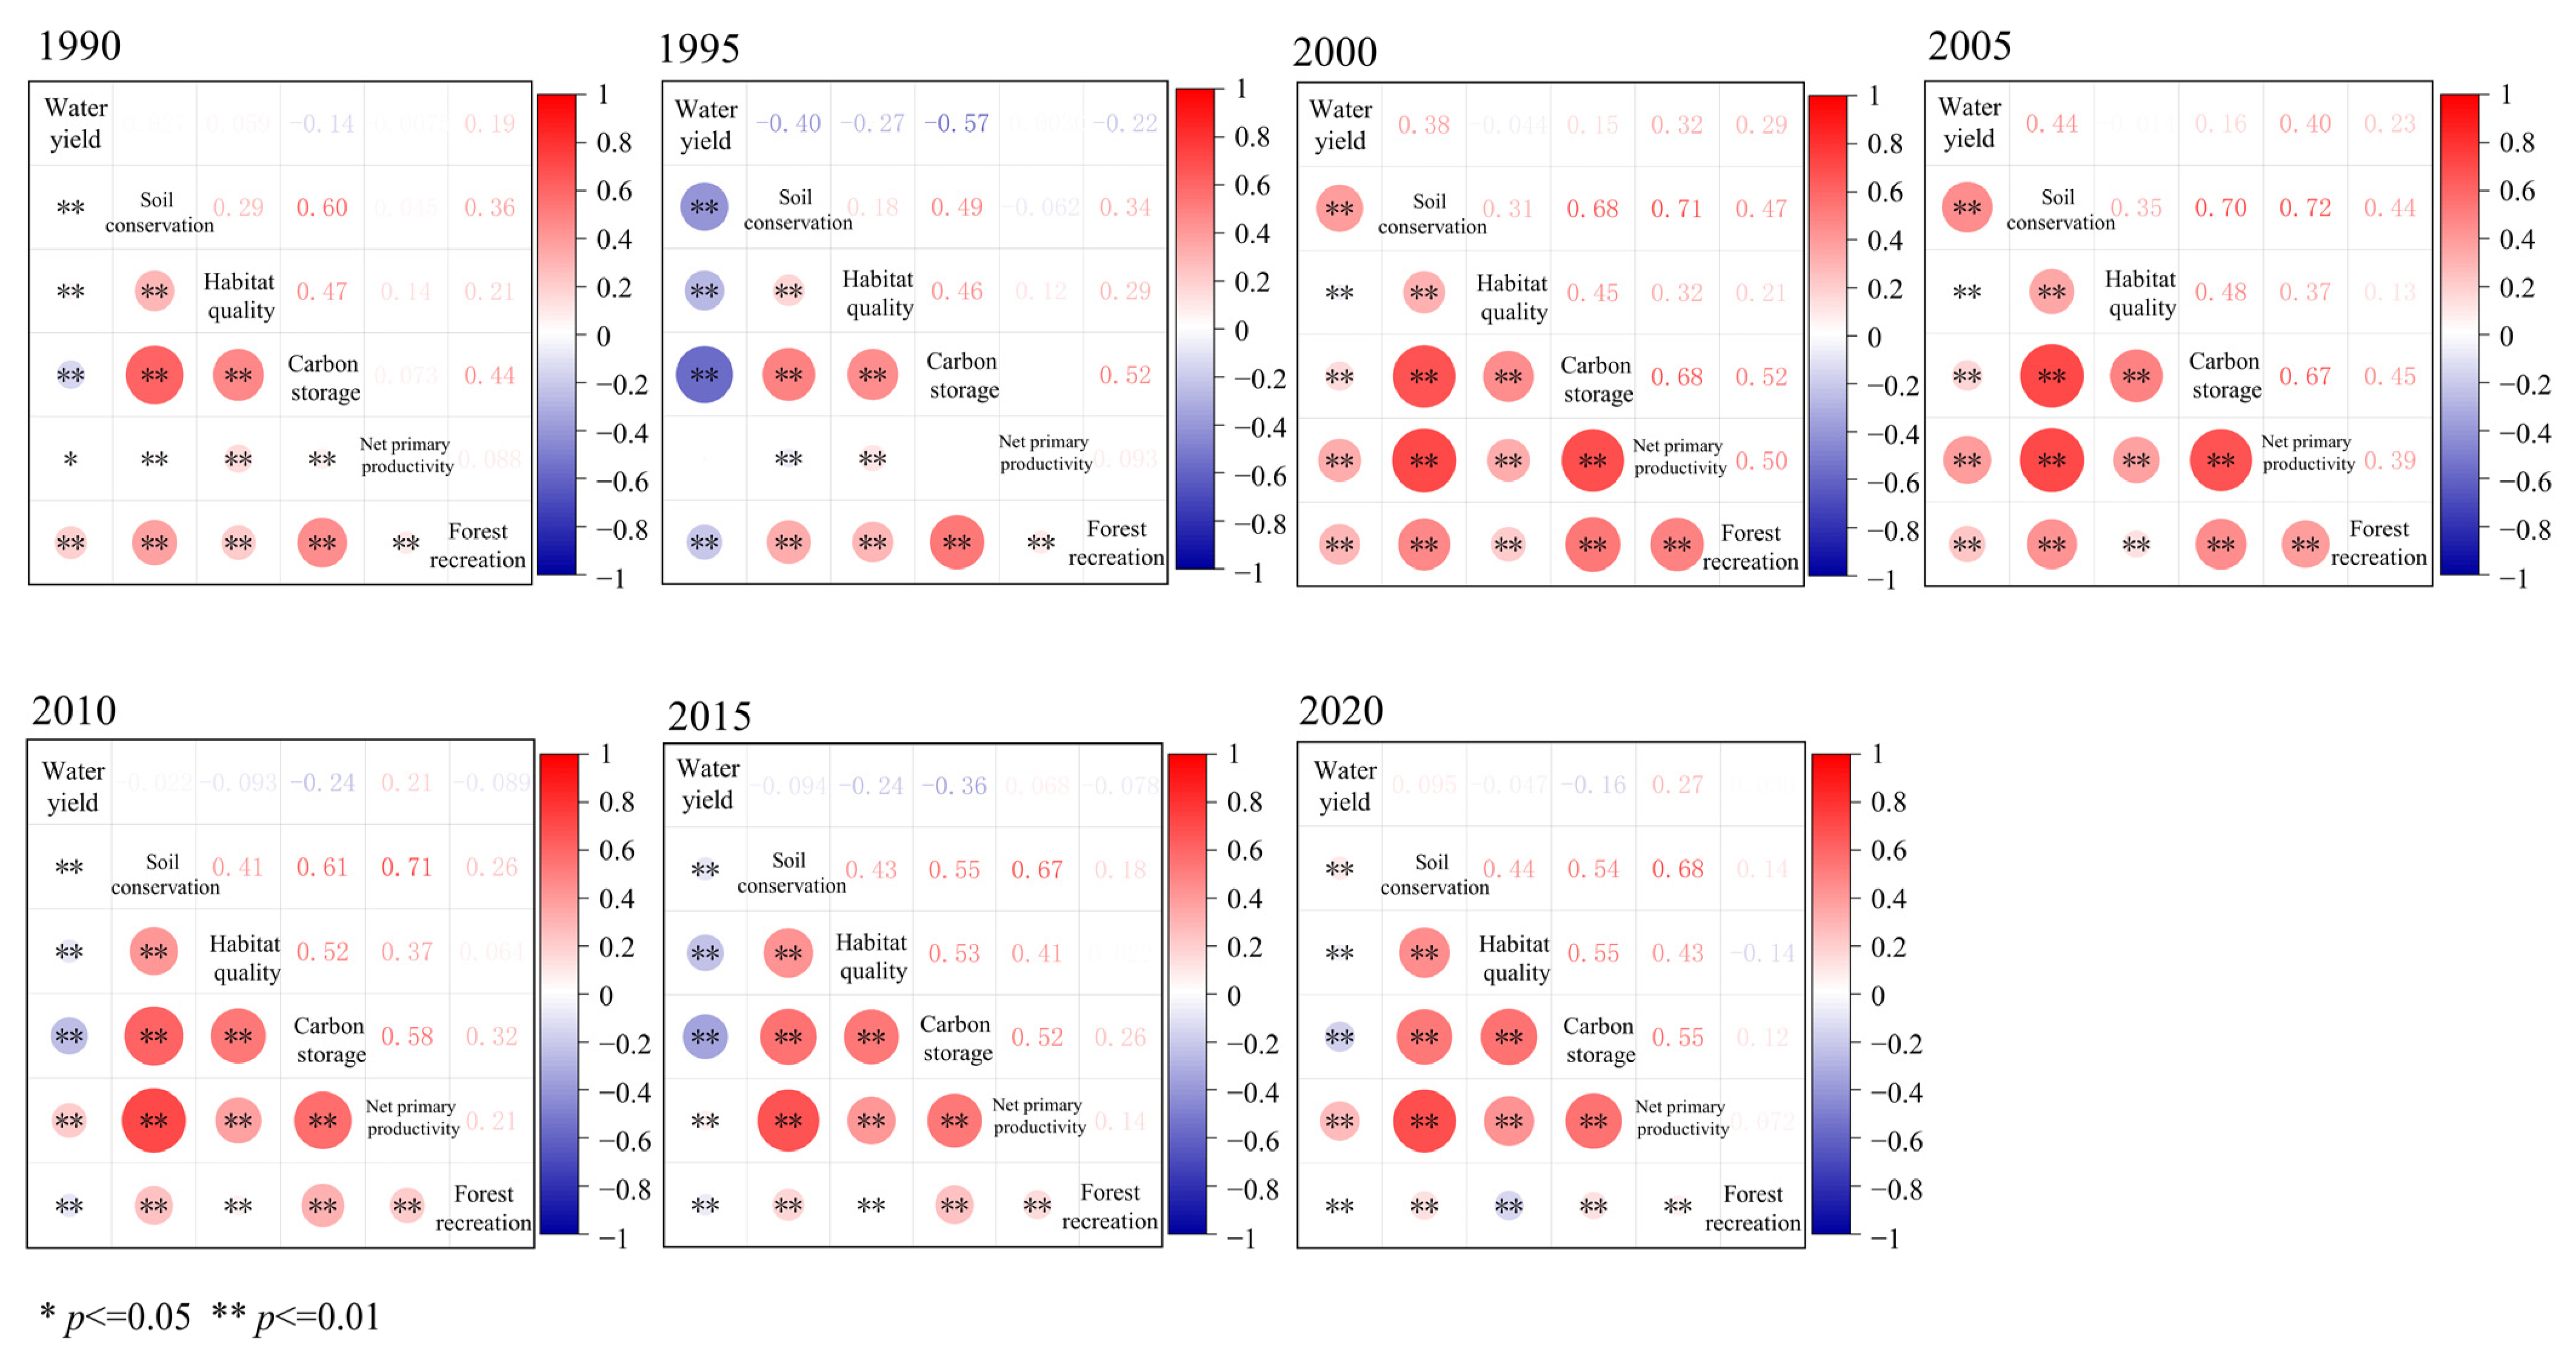
3.3.1. Temporal Changes in Trade-Off and Synergistic Correlations in the Ecosystem Service

The Spearman coefficients of 3000 randomly selected samples are calculated to reveal the correlation and strength of the six ecosystem services (see details in Figure 5). The six services in the study area are mainly synergistic with mutual gain. During 1990–2020, significantly positive correlations can be seen between carbon storage, soil conservation, habitat quality, and the NPP, in which the synergistic relationship among soil conservation and the NPP were more significant than the others in 2005. The correlation coefficient between soil conservation and the NPP reached the highest value in 2005 (0.72) and was above 0.67 after 2000. The synergistic relationship between carbon storage and habitat quality and between habitat quality and the NPP increased from 1990 to 2020, achieving 0.554 in 2020. The trade-off effects are mainly found between the water yield and other ecosystem services. Noticeably, a strong correlation between the water yield and soil conservation services was detected in 1995, and the trade-off between the water yield and carbon storage services was the strongest, with a correlation coefficient of −0.57. The relationships between forest recreation and other services were mainly synergistic, with weak correlations.

3.3.2. Spatial Distribution of the Trade-Offs and Synergies

We additionally calculated the correlation and significance level of the ecosystem services at the pixel scale, which were evaluated using the Spearman correlation coefficient. As depicted in Figure 6, during 1990–2020, significant synergies were found between soil conservation and the NPP, and between carbon storage and habitat quality. The areas with synergies between soil conservation and the NPP account for 94.37% of the total areas, and 20.08% of these areas in the central survey region are calculated with strong synergy relationships. Almost no areas are found with trade-off relationships between soil conservation and the NPP. In comparison, the trade-offs between carbon storage and habitat quality are sparsely distributed in earth–rock hilly and wind-blown sand, hilly areas, which are located in the southern and northeastern regions, respectively. Moreover, synergistic correlations can be found between soil conservation–water yield, carbon storage–habitat quality, NPP–water yield, forest recreation–carbon storage, and soil conservation–habitat quality. These areas account for around 60% of the total areas. More than 15.58% represent a strong synergy between forest recreation–carbon storage, as well as forest recreation–habitat quality, which can be found in the center and northwest of the study area. The rest of the areas are mainly found with weak synergies. Additionally, the trade-offs between water yield–carbon storage, water yield–habitat quality, and NPP–carbon storage are the main factors. The correlations between water yield and habitat quality/carbon storage show similar spatial patterns. The weak trade-off effect is more significant in these regions. The strong trade-offs are mainly found in the west of the loess hilly wide valley, loess ridge areas, the covered sand, loess hilly areas in the northeast, and the north of the loess hilly areas. In the center and south of the survey region, no significant correlations can be found. Moreover, weak trade-offs dominate the correlation between the NPP and carbon storage. The strong trade-offs are mainly found in the south (earth–rock hilly area). In comparison, strong synergies are distributed among the central (loess ridge) and northeast (loess hilly) areas.

4. Discussion

4.1. Evolution and Interrelationships of Ecosystem Services

The ecosystem environment is an interplay between the natural environment and social–economic activities [55]. Quantifying its temporal and spatial distribution is beneficial to boost the developing potential of local regions. This study shows that the ecosystem services shared similarities in regard to spatial distributions in the last 30 years (Figure 2), indicating strong correlations between ecosystem structure/functionalities and land-use patterns. From 1990 to 2020, with the implementation of the GGP, the area of farmland was largely reduced, the area of forests and orchards was increased largely (Table 1), and the values of ecosystem services also increased significantly (Figure 2). The high-value regions of soil conservation, carbon storage, NPP, habitat quality, and forest recreation are mainly in earth–rock hilly, loess ridge, and loess hilly areas, where forests and orchards are concentratedly distributed (Figure 3 and Figure 4). Forests can effectively alleviate soil erosion [56], increase carbon storage [57], maintain biological diversity, and provide recreation [58], and are a valuable land type for higher value ecosystem services [59,60]. The GGP enhances vegetation, such as planting trees, orchards, and grasslands. These land types incorporate well-developed root systems, manifesting strong absorbent capacity. Planting trees and new grass increase carbon storage and soil conservation capacity, which is conducive to the management of the natural climate, weakens erosion of loess by rainfall, and enhances the soil conservation capacity [61,62,63,64]. The service of soil conservation maintains the stability of biodiversity, promotes the development of habitat quality [65], and creates a better natural recreation environment [66]. As a threatening factor, the decrease in farmland boosts the improvement of habitat quality. Also, the ecological restoration measures in the GGP, and the decline of human interference in the ecosystem have similar effects. In comparison, the high-value region of water yield can be found in the wind-blown sand, hilly area in the northwest and towns in the middle of the study area. Moreover, construction land, farmland, and unused land are concentrated in these regions, where the increased hardened ground areas promote water yield (Figure 2 and Figure 3).
Ecosystem services are generally interdependent at the spatiotemporal scale, and the complicated relationships among ecosystem services lead to trade-off and synergistic effects. Nonetheless, the correlations between ecosystem services are distinct because of the heterogeneity of the landscape and differences in the usage and management of ecosystem services [67,68,69,70]. Our work quantitatively evaluates the main ecosystem services in the Loess Plateau in the north of Shaanxi, and the findings indicate that most correlations among the ecosystem services are synergistic (Figure 5). In particular, correlations among carbon storage, habitat quality, and soil conservation are noticeably synergistic, which agrees elegantly with previous studies [71,72,73]. The synergy degree among these ecosystem services increased after 2000 (Figure 5), indicating that the GGP displays positive effects on the Loess Plateau in northern Shaanxi. Besides, a synergy between water yield and soil conservation is found in this work (Figure 6), which shows excellent agreements with prior results [53]. Synergistic effects are achieved through the combined effects of rainfall and terrain. The trade-off correlations mainly exist between water yield and carbon storage/habitat quality (Figure 6), and the fundamental reason lies in the increase in the water requirements of the vegetation induced by the enhanced coverage of vegetation. Moreover, the main reason for the trade-off correlation between water yield and carbon storage/habitat quality is that the high root intensity of the planted forest after the implementation of GGP intensifies the soil dry layer. The main manifestations are: (1) the growth in vegetation coverage enhances the ecosystem water requirements, (2) the decrease in the water capacity of the soil, and (3) the formation of a dry soil layer. Typically, the trade-offs are more significant in the arid and semi-arid areas, which are located in the northern and western study region. Such phenomena show good consistency with previous reports [33,50,74]. Besides, Zhang’s and Yang’s results [75,76] show that, though carbon storage and NPP are both used to evaluate the carbon in an ecosystem, the former delivers the quantity, and the latter focuses on the rate of carbon fixation. The correlation between carbon storage and NPP is synergistic, which agrees well with our results.

4.2. Implications for Modeling Use and Policymaking

This work dives into the trade-off and synergistic effects of the Loess Plateau in northern Shaanxi from 1990 to 2020, based on multi-source data and models. Compared to other analytical methods, this article has the following advantages: (1) The adopted long-term dataset effectively increases the reliability of the trade-off correlations, avoiding the misjudgments caused by unpredictability and time lag effects during the long-term variation of the ecosystem services [19]. (2) At the pixel scale, we determine the spatial features of trade-offs and synergies of ecosystem services, effectively solving the challenges of quantifying spatial trade-offs. (3) We consider multiple ecosystem services and analyze them from the perspectives of different geographical regions, which guides the development direction for resources in different regions. The InVEST model is widely applied to evaluate individual and multiple ecosystem services at the global, intercontinental, national, and basin scales. For example, this model was used to investigate the karst area in southwest China [77], a typical ecologically fragile and sensitive area, similar to the Loess Plateau dissected in this work. These reports [68,78] show that the GGP positively affects the karst area’s ecosystem services and land use. In addition, Wang et al. [68] adopted the InVEST model to probe the water yield, NPP, and soil conservation, and their results show that the NPP displays a trade-off relationship with respect to water yield, agreeing with our discoveries from the loess ridge, loess hilly, and covered sand, loess hilly areas (Figure 6). Moreover, other regions, such as arid watersheds in northwestern China [79], the Qinghai-Tibet Plateau [80], North America [81], Europe [82], and Africa [83], were also investigated using the InVEST model. Challenges still exist in this work and can be solved in our future work. First, the InVEST model has its limitations. For instance, the required biophysical parameters are a generalization of the actual land surface. The water yield module adopts a simple Budyko water–energy equilibrium equation, but the complex equilibrium introduced by the underlying geology and complex land-use patterns is not included [42]. Additionally, the influence of climatic factors on the survival of species are not considered in the habitat module. Furthermore, though the range of ecosystem services investigated in this work is thorough and representative enough, more ecosystem services can be included in the future. Specifically, ecosystem services such as grain production, wind prevention, sand fixation, and water purification can be discussed in our subsequent studies. In addition, ecosystem services are highly correlated with variations in artificial and natural factors, including land use, climate, topography, etc. Thus, the driving mechanisms of ecosystem services can be determined. In short, researchers should focus on the perfection of model principles and parameter verifications, assess future trends with multiple scenarios, and simulate the driving mechanisms of the ecological environment [84,85], so that a reasonable scientific basis for ecosystem services and sustainable high-quality development of the Loess Plateau in northern Shaanxi can be provided.
Based on the results of this work, we propose the following suggestions by combining the status quo of land use and the distribution of ecosystem services in northern Shaanxi. These suggestions can further promote the sustainable utilization of the land resources and provide a reference for land usage and ecosystem protection. (1) Farmland management skills should be systematically improved, and uncontrolled reclamation should be especially depressed, preventing significant land degradation (which leads to soil erosion) in the farmland areas. (2) Our results indicate that trade-off relationships exist between annual water yield and other services, such as carbon storage, habitat quality, and forest recreation (Figure 5 and Figure 6). Such trade-offs can be attributed to the consumption of water resources by afforestation. Moreover, unsuitable types of plants could drain the water and induce dry soil [86]. Therefore, local governments should prioritize those plants with less water consumption when they launch vegetation restoration-related projects. Additionally, water retaining agents, conservation tillage, and agroforestry systems should be considered to reduce water consumption and improve ecosystem quality. (3) An effective, scientific, systematic, and standardized mechanism should be built to monitor, encourage, and punish the change in ecosystem services [87]. Moreover, a flexible ecological compensation method can be established according to the characteristics of land-use type and the importance of ecosystem services. (4) During our investigation, the construction of land has increased rapidly (Table 2), having negative effects on the habitat quality and many other ecosystem services. Therefore, environmental protection should be placed in a more important position when decisionmakers plan and design the construction land and economic goals. For example, construction land, homestead, and unused land should be classified, and detailed guidance on how to use these lands should be provided.

5. Conclusions

This work probes the features of land-use evolution by taking the typical area for the GGP in the Loess Plateau in northern Shaanxi as a sample. The spatial distribution of six key ecosystem services, namely carbon storage, water yield, NPP, soil conservation, habitat quality, and forest recreation, are calculated and analyzed using the InVEST model and statistical data. We also reveal the spatial difference in the ecosystem in the investigated region. The trade-off and synergistic relationships among the ecosystem services are discussed using correlation analysis. For the period 1990–2020, the carbon storage and habitat quality increased, and the water yield, NPP, soil conservation, and forest recreation decreased first and then increased to a higher value in 2020 than in 1990. These services in the southeast are higher than in the northwest of the research area. Meanwhile, the farmland decreased significantly and, consequently, the forests and orchards increased remarkably. The ecosystem services provided by the investigated region displayed synergistic correlations, and such correlations became stronger from 1990 to 2020. This trend further indicates that the GGP has multiple positive effects on local ecosystem services. The trade-off effect mainly occurred among the water yield and other ecosystem services and was distributed in the west and northeast of the investigated area. These regions with strong synergistic effects were generally located in the central and east of the study area.

Author Contributions

X.W.: Writing—original draft, Data curation, Visualization. X.H.: Writing—review and editing. J.W.: Supervision, Writing—review and editing. L.M.: Supervision, Writing—review. All authors have read and agreed to the published version of the manuscript.

Funding

This research was supported by the National Natural Science Foundation of China (42130717), the National Key R&D Program of China (2021YFD190070402), the China Postdoctoral Science Foundation (2022M720157), and the Science and Technology Innovation Fund project of Northwest A&F University: Research on the coupled process of agro-eco-economic system.

Data Availability Statement

Data is contained within the article.

Conflicts of Interest

The authors declare that they have no known competing financial interests or personal relationships that could have appeared to influence the work reported in this paper.

References

  1. Costanza, R.; de Groot, R.; Sutton, P.; van der Ploeg, S.; Anderson, S.J.; Kubiszewski, I.; Farber, S.; Turner, R.K. Changes in the global value of ecosystem services. Global Environ. Chang. 2014, 26, 152–158. [Google Scholar] [CrossRef]
  2. Xie, G.; Zhang, C.; Zhen, L.; Zhang, L. Dynamic changes in the value of China’s ecosystem services. Ecosyst. Serv. 2017, 26, 146–154. [Google Scholar] [CrossRef]
  3. Mace, G.M.; Norris, K.; Fitter, A.H. Biodiversity and ecosystem services: A multilayered relationship. Trends Ecol. Evol. 2012, 27, 19–26. [Google Scholar] [CrossRef] [PubMed]
  4. Nagendra, H.; Mairota, P.; Marangi, C.; Lucas, R.; Dimopoulos, P.; Honrado, J.P.; Niphadkar, M.; Mücher, C.A.; Tomaselli, V.; Panitsa, M.; et al. Satellite Earth observation data to identify anthropogenic pressures in selected protected areas. Int. J. Appl. Earth Obs. Geoinf. 2015, 37, 124–132. [Google Scholar] [CrossRef]
  5. Power, A.G. Ecosystem services and agriculture: Tradeoffs and synergies. Philos. Trans. R. Soc. Lond. B Biol. Sci. 2010, 365, 2959–2971. [Google Scholar] [CrossRef] [PubMed]
  6. Sanon, S.; Hein, T.; Douven, W.; Winkler, P. Quantifying ecosystem service trade-offs: The case of an urban floodplain in Vienna, Austria. J. Environ. Manag. 2012, 111, 159–172. [Google Scholar] [CrossRef]
  7. Jin, G.; Chen, K.; Wang, P.; Guo, B.; Dong, Y.; Yang, J. Trade-offs in land-use competition and sustainable land development in the North China Plain. Technol. Forecast. Soc. Chang. 2019, 141, 36–46. [Google Scholar] [CrossRef]
  8. Butler, J.R.A.; Wong, G.Y.; Metcalfe, D.J.; Honzák, M.; Pert, P.L.; Rao, N.; van Grieken, M.E.; Lawson, T.; Bruce, C.; Kroon, F.J.; et al. An analysis of trade-offs between multiple ecosystem services and stakeholders linked to land use and water quality management in the Great Barrier Reef, Australia. Agric. Ecosyst. Environ. 2013, 180, 176–191. [Google Scholar] [CrossRef]
  9. Rodriguez, J.P.; Beard, T.D., Jr.; Bennett, E.M.; Cumming, G.S.; Cork, S.J.; Agard, J.; Dobson, A.P.; Peterson, G.D. Trade-offs across space, time, and ecosystem services. Ecol. Soc. 2006, 11, 28. [Google Scholar] [CrossRef]
  10. Zheng, Z.; Fu, B.; Feng, X. GIS-based analysis for hotspot identification of tradeoff between ecosystem services: A case study in Yanhe Basin, China. Chin. Geogr. Sci. 2016, 26, 466–477. [Google Scholar] [CrossRef]
  11. Li, B.; Wang, W. Trade-offs and synergies in ecosystem services for the Yinchuan Basin in China. Ecol. Indic. 2018, 84, 837–846. [Google Scholar] [CrossRef]
  12. Boithias, L.; Acuna, V.; Vergonos, L.; Ziv, G.; Marce, R.; Sabater, S. Assessment of the water supply:demand ratios in a Mediterranean basin under different global change scenarios and mitigation alternatives. Sci. Total Environ. 2014, 470, 567–577. [Google Scholar] [CrossRef] [PubMed]
  13. Qiu, J.; Turner, M.G. Spatial interactions among ecosystem services in an urbanizing agricultural watershed. Proc. Natl. Acad. Sci. USA 2013, 110, 12149–12154. [Google Scholar] [CrossRef] [PubMed]
  14. Feng, Q.; Zhao, W.; Fu, B.; Ding, J.; Wang, S. Ecosystem service trade-offs and their influencing factors: A case study in the Loess Plateau of China. Sci. Total Environ. 2017, 607–608, 1250–1263. [Google Scholar] [CrossRef] [PubMed]
  15. Dai, E.; Wang, X.; Zhu, J.; Zhao, D. Methods, tools and research framework of ecosystem service trade-offs. Geogr. Res. 2016, 35, 1005–1016. (In Chinese) [Google Scholar]
  16. Wang, P.; Zhang, L.; Li, Y.; Jiao, L.; Wang, H.; Yan, J.; Lv, Y.; Fu, B. Spatio-temporal characteristics of the trade- off and synergy relationships among multiple ecosystem services in the Upper Reaches of Hanjiang River Basin. Acta Geogr. Sin. 2017, 72, 2064–2078. (In Chinese) [Google Scholar]
  17. Pan, J.; Li, Z. Analysis on trade-offs and synergies of ecosystem services in arid inland river basin. Trans. Chin. Soc. Agric. Eng. 2017, 33, 280–289. (In Chinese) [Google Scholar]
  18. Tomscha, S.A.; Gergel, S.E. Ecosystem service trade-offs and synergies misunderstood without landscape history. Ecol. Soc. 2016, 21, 43. [Google Scholar] [CrossRef]
  19. Dallimer, M.; Davies, Z.G.; Diaz-Porras, D.F.; Irvine, K.N.; Maltby, L.; Warren, P.H.; Armsworth, P.R.; Gaston, K.J. Historical influences on the current provision of multiple ecosystem services. Global Environ. Chang. 2015, 31, 307–317. [Google Scholar] [CrossRef]
  20. Shao, S.; Yang, Y. Effects of precipitation and land use/cover changes on the spatio-temporal distribution of the water yield in the Huang-Huai-Hai basin, China. Environ. Earth Sci. 2021, 80, 812. [Google Scholar] [CrossRef]
  21. Capriolo, A.; Boschetto, R.G.; Mascolo, R.A.; Balbi, S.; Villa, F. Biophysical and economic assessment of four ecosystem services for natural capital accounting in Italy. Ecosyst. Serv. 2020, 46, 101207. [Google Scholar] [CrossRef]
  22. Cunha, E.R.d.; Santos, C.A.G.; Silva, R.M.d.; Panachuki, E.; Oliveira, P.T.S.d.; Oliveira, N.d.S.; Falcão, K.d.S. Assessment of current and future land use/cover changes in soil erosion in the Rio da Prata basin (Brazil). Sci. Total Environ. 2022, 818, 151811. [Google Scholar] [CrossRef] [PubMed]
  23. Zhang, K.; Tang, X.; Zhao, Y.; Huang, B.; Huang, L.; Liu, M.; Luo, E.; Li, Y.; Jiang, T.; Zhang, L.; et al. Differing perceptions of the youth and the elderly regarding cultural ecosystem services in urban parks: An exploration of the tour experience. Sci. Total Environ. 2022, 821, 153388. [Google Scholar] [CrossRef] [PubMed]
  24. Yang, Y.; Tian, Y.; Zhang, Q.; Tao, J.; Huang, Y.; Gao, C.; Lin, J.; Wang, D. Impact of current and future land use change on biodiversity in Nanliu River Basin, Beibu Gulf of South China. Ecol. Indic. 2022, 141, 109093. [Google Scholar] [CrossRef]
  25. Chen, X.; Yu, L.; Du, Z.; Xu, Y.; Zhao, J.; Zhao, H.; Zhang, G.; Peng, D.; Gong, P. Distribution of ecological restoration projects associated with land use and land cover change in China and their ecological impacts. Sci. Total Environ. 2022, 825, 153938. [Google Scholar] [CrossRef] [PubMed]
  26. Wu, Y.; Zhang, X.; Li, C.; Xu, Y.; Hao, F.; Yin, G. Ecosystem service trade-offs and synergies under influence of climate and land cover change in an afforested semiarid basin, China. Ecol. Eng. 2021, 159, 106083. [Google Scholar] [CrossRef]
  27. Wang, B.; Cheng, W. Effects of Land Use/Cover on Regional Habitat Quality under Different Geomorphic Types Based on InVEST Model. Remote Sens. 2022, 14, 1279. [Google Scholar] [CrossRef]
  28. Maes, J.; Paracchini, M.L.; Zulian, G.; Dunbar, M.B.; Alkemade, R. Synergies and trade-offs between ecosystem service supply, biodiversity, and habitat conservation status in Europe. Biol. Conserv. 2012, 155, 1–12. [Google Scholar] [CrossRef]
  29. Turner, K.G.; Odgaard, M.V.; Bøcher, P.K.; Dalgaard, T.; Svenning, J.-C. Bundling ecosystem services in Denmark: Trade-offs and synergies in a cultural landscape. Landsc. Urban Plan. 2014, 125, 89–104. [Google Scholar] [CrossRef]
  30. Zhao, M.; Peng, J.; Liu, Y.; Li, T.; Wang, Y. Mapping Watershed-Level Ecosystem Service Bundles in the Pearl River Delta, China. Ecol. Econ. 2018, 152, 106–117. [Google Scholar] [CrossRef]
  31. Maskell, L.C.; Crowe, A.; Dunbar, M.J.; Emmett, B.; Henrys, P.; Keith, A.M.; Norton, L.R.; Scholefield, P.; Clark, D.B.; Simpson, I.C.; et al. Exploring the ecological constraints to multiple ecosystem service delivery and biodiversity. J. Appl. Ecol. 2013, 50, 561–571. [Google Scholar] [CrossRef]
  32. Liu, J.; Li, S.; Ouyang, Z.; Tam, C.; Chen, X. Ecological and socioeconomic effects of China’s policies for ecosystem services. Proc. Natl. Acad. Sci. USA 2008, 105, 9477–9482. [Google Scholar] [CrossRef] [PubMed]
  33. Wu, X.; Wang, S.; Fu, B.; Feng, X.; Chen, Y. Socio-ecological changes on the Loess Plateau of China after Grain to Green Program. Sci. Total Environ. 2019, 678, 565–573. [Google Scholar] [CrossRef] [PubMed]
  34. Bryan, B.A.; Gao, L.; Ye, Y.; Sun, X.; Connor, J.D.; Crossman, N.D.; Stafford-Smith, M.; Wu, J.; He, C.; Yu, D.; et al. China’s response to a national land-system sustainability emergency. Nature 2018, 559, 193–204. [Google Scholar] [CrossRef] [PubMed]
  35. Ouyang, Z.; Zheng, H.; Xiao, Y.; Polasky, S.; Liu, J.; Xu, W.; Wang, Q.; Zhang, L.; Xiao, Y.; Rao, E.; et al. Improvements in ecosystem services from investments in natural capital. Science 2016, 352, 1455–1459. [Google Scholar] [CrossRef] [PubMed]
  36. Wang, X.; Wu, J.; Wu, P.; Shangguan, Z.; Deng, L. Spatial and Temporal Distribution and Trade-off of Water Conservation, Soil Conservation and NPP Services in the Ecosystems of the Loess Plateau from 2000 to 2015. J. Soil Water Conserv. 2021, 35, 114–121+128. (In Chinese) [Google Scholar] [CrossRef]
  37. Fu, B.J.; Ma, K.M.; Zhou, H.F.; Chen, L.D. The effect of land use structure on the distribution of soil nutrients in the hilly area of the Loess Plateau, China. Chin. Sci. Bull. 1999, 44, 732–736. [Google Scholar] [CrossRef]
  38. Liu, X.; Huang, M.; Lei, W. Spatiotemporal Evolution of Land Use in Ecologically Fragile Areas of the Loess Plateau in Northern Shaanxi. Chin. J. Agric. Resour. Reg. Plan. 2023, 44, 47–57. (In Chinese) [Google Scholar]
  39. Fu, Y.J.; Shi, X.Y.; He, J.; Yuan, Y.; Qu, L.L. Identification and optimization strategy of county ecological security pattern: A case study in the Loess Plateau, China. Ecol. Indic. 2020, 112, 106030. [Google Scholar] [CrossRef]
  40. He, Z.Q.; Shang, X.; Zhang, T.H.; Yun, J.Y. Coupled regulatory mechanisms and synergy/trade-off strategies of human activity and climate change on ecosystem service value in the loess hilly fragile region of northern Shaanxi, China. Ecol. Indic. 2022, 143, 109325. [Google Scholar] [CrossRef]
  41. Assessment, M.E. Ecosystems and Human Well-Being: Synthesis; Island Press: Washington, DC, USA, 2005. [Google Scholar]
  42. Sharp, R.; Douglass, J.; Wolny, S.; Arkema, K.; Bernhardt, J.; Bierbower, W.; Chaumont, N.; Denu, D.; Fisher, D.; Glowinski, K.; et al. InVEST 3.9.2. User’s Guide; The Natural Capital Project: Stanford, CA, USA, 2014. [Google Scholar]
  43. Yang, J.; Xie, B.; Zhang, D. Spatio-temporal evolution of carbon stocks in the Yellow River Basin based on InVEST and CA-Markov models. Chin. J. Eco-Agric. 2021, 29, 1018–1029. (In Chinese) [Google Scholar] [CrossRef]
  44. Chuai, X.; Huang, X.; Lai, L.; Wang, W.; Peng, J.; Zhao, R. Land use structure optimization based on carbon storage in several regional terrestrial ecosystems across China. Environ. Sci. Policy 2013, 25, 50–61. [Google Scholar] [CrossRef]
  45. Li, K.R.; Wang, S.Q.; Cao, M.K. Vegetation and soil carbon storage in China. Sci. China Ser. D Earth Sci. 2004, 47, 49–57. [Google Scholar] [CrossRef]
  46. MI, B. Climate and Life; Academic Press: San Diego, CA, USA, 1974. [Google Scholar]
  47. Yang, J.; Xie, B.; Zhang, D. Spatio-temporal variation of water yield and its response to precipitation and land use change in the Yellow River Basin based on InVEST model. Chin. J. Appl. Ecol. 2020, 31, 2731–2739. (In Chinese) [Google Scholar] [CrossRef]
  48. Allen, R.G. FAO Irrigation and drainage paper. Irrig. Drain. 1998, 300, 64–65. [Google Scholar]
  49. Potter, C.S.; Randerson, J.T.; Field, C.B.; Matson, P.A.; Vitousek, P.M.; Mooney, H.A.; Klooster, S.A. Terrestrial ecosystem production: A process model based on global satellite and surface data. Glob. Biogeochem. Cycles 1993, 7, 811–841. [Google Scholar] [CrossRef]
  50. Zheng, Z.; Fu, B.; Hu, H.; Sun, G. A method to identify the variable ecosystem services relationship across time: A case study on Yanhe Basin, China. Landsc. Ecol. 2014, 29, 1689–1696. [Google Scholar] [CrossRef]
  51. Li, Y.L.; He, Y.; Liu, W.Q.; Jia, L.P.; Zhang, Y.R. Evaluation and Prediction of Water Yield Services in Shaanxi Province, China. Forests 2023, 14, 229. [Google Scholar] [CrossRef]
  52. Ren, J.; Zhao, X.; Xu, S.; Ma, P.; Du, Y. Spatial-temporal evolution, tradeoffs and synergies of ecosystem services in the middle Yellow River. JEES 2022, 13, 477–490. (In Chinese) [Google Scholar]
  53. Yang, J.; Xie, B.P.; Tao, W.Q.; Zhang, D.G. Ecosystem Services Assessment, Trade-Off, and Bundles in the Yellow River Basin, China. Diversity 2021, 13, 308. [Google Scholar] [CrossRef]
  54. Chen, H.; Fleskens, L.; Schild, J.; Moolenaar, S.; Wang, F.; Ritsema, C. Impacts of large-scale landscape restoration on spatio-temporal dynamics of ecosystem services in the Chinese Loess Plateau. Landsc. Ecol. 2022, 37, 329–346. [Google Scholar] [CrossRef]
  55. Fu, B.; Wei, Y. Editorial overview: Keeping fit in the dynamics of coupled natural and human systems. Curr. Opin. Environ. Sustain. 2018, 33, A1–A4. [Google Scholar] [CrossRef]
  56. Zhang, B.; He, C.; Burnham, M.; Zhang, L. Evaluating the coupling effects of climate aridity and vegetation restoration on soil erosion over the Loess Plateau in China. Sci. Total Environ. 2016, 539, 436–449. [Google Scholar] [CrossRef]
  57. Tian, L.; Tao, Y.; Fu, W.; Li, T.; Ren, F.; Li, M. Dynamic Simulation of Land Use/Cover Change and Assessment of Forest Ecosystem Carbon Storage under Climate Change Scenarios in Guangdong Province, China. Remote Sens. 2022, 14, 2330. [Google Scholar] [CrossRef]
  58. Rounsevell, M.D.A.; Annetts, J.E.; Audsley, E.; Mayr, T.; Reginster, I. Modelling the spatial distribution of agricultural land use at the regional scale. Agric. Ecosyst. Environ. 2003, 95, 465–479. [Google Scholar] [CrossRef]
  59. Liu, W.; Zhan, J.; Zhao, F.; Yan, H.; Zhang, F.; Wei, X. Impacts of urbanization-induced land-use changes on ecosystem services: A case study of the Pearl River Delta Metropolitan Region, China. Ecol. Indic. 2019, 98, 228–238. [Google Scholar] [CrossRef]
  60. West, P.C.; Narisma, G.T.; Barford, C.C.; Kucharik, C.J.; Foley, J.A. An alternative approach for quantifying climate regulation by ecosystems. Front. Ecol. Environ. 2011, 9, 126–133. [Google Scholar] [CrossRef]
  61. He, J.; Shi, X.; Fu, Y.; Yuan, Y. Spatiotemporal pattern of the trade-offs and synergies of ecosystem services after Grain for Green Program: A case study of the Loess Plateau, China. Environ. Sci. Pollut. Res. 2020, 27, 30020–30033. [Google Scholar] [CrossRef]
  62. Jia, X.; Fu, B.; Feng, X.; Hou, G.; Liu, Y.; Wang, X. The tradeoff and synergy between ecosystem services in the Grain-for-Green areas in Northern Shaanxi, China. Ecol. Indic. 2014, 43, 103–113. [Google Scholar] [CrossRef]
  63. Wang, S.; Fu, B.; Liang, W.; Liu, Y.; Wang, Y. Driving forces of changes in the water and sediment relationship in the Yellow River. Sci. Total Environ. 2017, 576, 453–461. [Google Scholar] [CrossRef]
  64. Cortés-Calderón, S.; Mora, F.; Arreola-Villa, F.; Balvanera, P. Ecosystem services supply and interactions along secondary tropical dry forests succession. For. Ecol. Manag. 2021, 482, 118858. [Google Scholar] [CrossRef]
  65. Zhang, K.; Lv, Y.; Fu, B. Vegetation Restoration and Its Influences on Ecosystem Services in Areas Typical of the Loess Plateau. J. Ecol. Rural Environ. 2017, 33, 23–31. (In Chinese) [Google Scholar]
  66. Qiao, X.; Gu, Y.; Zou, C.; Wang, L.; Luo, J.; Huang, X. Trade-offs and Synergies of Ecosystem Services in the Taihu Lake Basin of China. Chin. Geogr. Sci. 2018, 28, 86–99. [Google Scholar] [CrossRef]
  67. Wu, W.; Peng, J.; Liu, Y.; Hu, Y. Tradeoffs and synergies between ecosystem services in Ordos City. Prog. Geogr. 2017, 36, 1571–1581. (In Chinese) [Google Scholar]
  68. Wang, X.; Zhang, X.; Feng, X.; Liu, S.; Yin, L.; Chen, Y. Trade-offs and Synergies of Ecosystem Services in Karst Area of China Driven by Grain-for-Green Program. Chin. Geogr. Sci. 2020, 30, 101–114. [Google Scholar] [CrossRef]
  69. Wang, J.T.; Peng, J.; Zhao, M.Y.; Liu, Y.X.; Chen, Y.Q. Significant trade-off for the impact of Grain-for-Green Programme on ecosystem services in North-western Yunnan, China. Sci. Total Environ. 2017, 574, 57–64. [Google Scholar] [CrossRef]
  70. Qian, C.; Gong, J.; Zhang, J.; Liu, D.; Ma, X. Change and tradeoffs-synergies analysis on watershed ecosystem services: A case study of Bailongjiang Watershed, Gansu. Acta Geogr. Sin. 2018, 73, 868–879. (In Chinese) [Google Scholar]
  71. Sun, Y.; Ren, Z.; Zhao, S.; Zhang, J. Spatial and temporal changing analysis of synergy and trade-off between ecosystem services in valley basins of Shaanxi Province. Acta Geogr. Sin. 2017, 72, 521–532. (In Chinese) [Google Scholar]
  72. Fang, Z.; Bai, Y.; Jiang, B.; Alatalo, J.M.; Liu, G.; Wang, H. Quantifying variations in ecosystem services in altitude-associated vegetation types in a tropical region of China. Sci. Total Environ. 2020, 726, 138565. [Google Scholar] [CrossRef]
  73. Niu, H.; Liu, M.; Xiao, D.; Zhao, X.; An, R.; Fan, L. Spatio-Temporal Characteristics of Trade-Offs and Synergies in Ecosystem Services at Watershed and Landscape Scales: A Case Analysis of the Yellow River Basin (Henan Section). Int. J. Environ. Res. Public Health 2022, 19, 15772. [Google Scholar] [CrossRef]
  74. Raudsepp-Hearne, C.; Peterson, G.D.; Bennett, E.M. Ecosystem service bundles for analyzing tradeoffs in diverse landscapes. Proc. Natl. Acad. Sci. USA 2010, 107, 5242–5247. [Google Scholar] [CrossRef] [PubMed]
  75. Zhang, Y.; Yang, G.; Zheng, Z.; Liu, Y.; Tan, Z. Carbon storage and sequestration of tree layer in subtropical evergreen broadleaf forests in Ailao Mountain of Yunnan. Ecol. Restor 2010, 29, 1047–1053. (In Chinese) [Google Scholar]
  76. Song, Q.-H.; Fei, X.-H.; Zhang, Y.-P.; Sha, L.-Q.; Wu, C.-S.; Lu, Z.-Y.; Luo, K.; Zhou, W.-J.; Liu, Y.-T.; Gao, J.-B. Snow damage strongly reduces the strength of the carbon sink in a primary subtropical evergreen broadleaved forest. Environ. Res. Lett. 2017, 12, 104014. [Google Scholar] [CrossRef]
  77. Tian, Y.; Wang, S.; Bai, X.; Luo, G.; Xu, Y. Trade-offs among ecosystem services in a typical Karst watershed, SW China. Sci. Total Environ. 2016, 566–567, 1297–1308. [Google Scholar] [CrossRef] [PubMed]
  78. Cheng, Y.; Hui-Hua, X.; Si-Min, C.; Tang, Y.; Zhan-Shan, L.; Guo-Long, H.; Zhi-Yun, J. Ecosystem Services Response to the Grain-for-Green Program and Urban Development in a Typical Karstland of Southwest China over a 20-Year Period. Forests 2023, 14, 1637. [Google Scholar] [CrossRef]
  79. Wang, Y.; Zhao, J.; Fu, J.; Wei, W. Effects of the Grain for Green Program on the water ecosystem services in an arid area of China—Using the Shiyang River Basin as an example. Ecol. Indic. 2019, 104, 659–668. [Google Scholar] [CrossRef]
  80. Zuo, Y.; Gao, J.; He, K. Interactions among ecosystem service key factors in vulnerable areas and their response to landscape patterns under the National Grain to Green Program. Land Degrad. Dev. 2023, 1–18. [Google Scholar] [CrossRef]
  81. Natalia, P.; Silvia, F.; Silvina, S.; Miguel, P. Climate change in northern Patagonia: Critical decrease in water resources. Theor. Appl. Climatol. 2020, 140, 807–822. [Google Scholar] [CrossRef]
  82. Marquès, M.; Bangash, R.F.; Kumar, V.; Sharp, R.; Schuhmacher, M. The impact of climate change on water provision under a low flow regime: A case study of the ecosystems services in the Francoli river basin. J. Hazard. Mater. 2013, 263, 224–232. [Google Scholar] [CrossRef]
  83. Duguma, D.W.; Schultner, J.; Abson, D.J.; Fischer, J. From stories to maps: Translating participatory scenario narratives into spatially explicit information. Ecol. Soc. 2022, 27, 13. [Google Scholar] [CrossRef]
  84. Kubiszewski, I.; Costanza, R.; Anderson, S.; Sutton, P. The future value of ecosystem services: Global scenarios and national implications. Ecosyst. Serv. 2017, 26, 289–301. [Google Scholar] [CrossRef]
  85. Cervelli, E.; Pindozzi, S.; Sacchi, M.; Capolupo, A.; Cialdea, D.; Rigillo, M.; Boccia, L. Supporting land use change assessment through Ecosystem Services and Wildlife Indexes. Land Use Policy 2017, 65, 249–265. [Google Scholar] [CrossRef]
  86. Wang, Y.; Shao, M.a.; Liu, Z. Large-scale spatial variability of dried soil layers and related factors across the entire Loess Plateau of China. Geoderma 2010, 159, 99–108. [Google Scholar] [CrossRef]
  87. Bai, Y.; Jiang, B.; Wang, M.; Li, H.; Alatalo, J.M.; Huang, S. New ecological redline policy (ERP) to secure ecosystem services in China. Land Use Policy 2016, 55, 348–351. [Google Scholar] [CrossRef]
Figure 1. The location of the Loess Plateau in northern Shaanxi.
Land 13 00070 g001
Figure 2. Spatiotemporal distribution of ecosystem services.
Land 13 00070 g002
Figure 3. Changes in ecosystem services of different land types.
Land 13 00070 g003
Figure 4. Spatial distribution of hot and cold spots in ecosystem services.
Land 13 00070 g004
Figure 5. Correlation among ecosystem services in the Loess Plateau in northern Shaanxi during 1990–2020.
Land 13 00070 g005
Figure 6. Spatial trade-off and synergistic correlations in ecosystem services.
Land 13 00070 g006
Table 1. Classification of the correlations between ecosystem services.
RelationStrong Trade-OffMedium Trade-OffWeak Trade-OffWeak SynergyMedium SynergyStrong SynergyIrrelevant
R<0<0<0>0>0>00
p<0.050.05–0.1>0.1>0.10.05–0.1<0.05
Table 2. Area and ratio of different land-use types in northern Shaanxi during 1990–2020 (unit: area 10,000 km2, proportion %).
Year1990199520002005201020152020
FarmlandArea2.812.882.702.432.132.051.97
Proportion34.9835.8233.6530.2426.4725.5524.48
GrasslandArea3.373.523.223.012.902.792.72
Proportion41.9143.7740.1437.5036.0734.7233.91
ForestArea1.050.990.951.071.060.941.07
Proportion13.1312.2711.8913.3813.1811.7513.36
OrchardArea0.110.150.580.951.401.681.72
Proportion1.321.837.2211.8017.4120.9621.45
WaterArea0.070.080.070.070.070.070.07
Proportion0.930.950.910.880.820.830.87
Construction landArea0.030.030.030.030.060.100.11
Proportion0.330.380.350.420.721.251.35
Unused landArea0.590.400.470.460.430.400.37
Proportion7.404.985.845.795.344.934.58
Disclaimer/Publisher’s Note: The statements, opinions and data contained in all publications are solely those of the individual author(s) and contributor(s) and not of MDPI and/or the editor(s). MDPI and/or the editor(s) disclaim responsibility for any injury to people or property resulting from any ideas, methods, instructions or products referred to in the content.

