Article

Analysis of Regional Medical Supply and Demand Network Characteristics Based on “Patient Flow Phenomenon”: A Case Study of the Core Area of the Wuhan Metropolitan Area

1
School of Urban Design, Wuhan University, Wuhan 430072, China
2
China Institute of Development Strategy and Planning, Wuhan University, Wuhan 430072, China
*
Author to whom correspondence should be addressed.
Land 2024, 13(2), 142; https://doi.org/10.3390/land13020142
Submission received: 22 November 2023 / Revised: 8 January 2024 / Accepted: 23 January 2024 / Published: 26 January 2024

Abstract

:
Examining medical supply–demand imbalances, as revealed through patients’ cross-boundary treatment behaviors, is vital for reducing a metropolitan area’s medical supply–demand gap and furthering sustainable development goals. This study, leveraging medical supply–demand and commuting data, scrutinizes medical imbalances in the Wuhan metropolitan area core. It includes a ‘People-centered’ theory for elucidating patients’ treatment behaviors, proposes a method for constructing a regional medical supply–demand network, and explores the problem of supply–demand imbalance. The key findings include: (1) Wuhan’s central area, despite its abundance of quality medical resources, fails to adequately cover the entire metropolitan area, indicating a need for broader resource distribution. (2) The Ezhou–Huangshi–Huanggang junction shows a stark contrast to Wuhan with its limited medical services and extensive hinterland connections. Future initiatives should aim to integrate resources dispersed from Wuhan, reducing regional disparities. (3) The city’s periphery, influenced by resource distribution models and geographic distance, exhibits significant variance from central urban areas in medical supply–demand connectivity, particularly around Wuhan’s eastern administrative boundaries. Future urban planning is needed to reinforce this area’s role as a vital medical services conduit. (4) The distinguishing differences among the nine medical service communities in terms of resource recognition, service sharing, and patient mobility provide policy guidance for the allocation of medical resources.

1. Introduction

High-quality medical resources significantly influence human movement. Inter-regional interactions and uneven medical resource allocation lead patients to cross administrative borders for superior facilities, reflecting global medical supply and demand shifts.
The United Nations Sustainable Development Goal (SDG3) promotes equitable medical access and health fulfillment for diverse groups. It aims to ensure healthy living and well-being for all ages, with a particular focus on medical advancements in slower-developing and underdeveloped regions.
In China, the uneven distribution of medical resources prompts a study of patient mobility across administrative regions [1,2]. As the world’s second-most populous country and third-largest in land area, China’s rapid urbanization leads to unique social phenomena driven by population mobility and regional disparities. A significant mismatch between medical resource supply and population demand [3,4] is evident in patient migration across administrative areas [5,6]. China’s metropolitan area, influenced by regional integration policies, diverges from Western perspectives. Metropolitan areas in Western nations serve as statistical entities specifically developed for statistical analysis. They are founded upon the concept of “Core-Based Statistical Areas” (CBSAs), which are centered around the core urban area. The primary emphasis is placed on examining the “proximate commuting connections” between the central and peripheral regions, with a particular emphasis on “commuting” as the fundamental metric for delineating the true functional spatial extent [7]. In contrast, China’s metropolitan areas are heavily policy-driven, crucial for fostering regional integration. The aim is to reduce medical disparities and integrate public services, including the redistribution of medical resources for regional equality.
In China, secondary and tertiary hospitals are medical centers delivering high-quality healthcare resources across administrative regions. These hospitals adhere to China’s “Hospital Classification Standards,” which categorize medical facilities into three levels, ranging from primary to tertiary. Primary medical facilities provide fundamental services to local residential communities. Secondary medical facilities, spanning several grassroots administrative units, serve as regional hubs. Tertiary medical facilities extend their services beyond provincial and municipal administrative boundaries, even on a national scale. Furthermore, pertinent research has substantiated the pivotal role played by secondary and tertiary hospitals in the provision of high-quality regional healthcare services [3]. Their importance in enabling cross-regional patient mobility makes them this study’s focal point.
Extensive research has focused on patient mobility across administrative regions, impacting regional medical resource distribution, spatial patterns, and supply–demand dynamics. This research synthesizes insights from three key perspectives: the theoretical framework underlying patient mobility, the development of patient care networks at critical scales, and the analysis of regional medical supply and demand. Firstly, while existing studies on patient healthcare behavior emphasize spatial characteristics, forming the basis for further investigation [5,6,8], they often lack scientific explanations for patterns in healthcare-seeking behavior, especially when crossing borders. A theory or method that commences from patients’ rational needs and elucidates the logic behind these spatial phenomena is, therefore, imperative. Secondly, empirical research on urban medical networks predominantly focuses on spatial networking [5,8,9], roles within urban healthcare [5], and medical service zoning [10,11,12,13]. In China, research typically spans the national or provincial scale, drawing on real patient healthcare data [5,8,14], and aims to uncover patterns and spatial influences within national medical networks. However, studies targeting China’s ‘key scale’ metropolitan area often grapple with challenges in data collection and precision. Thirdly, the analysis of supply and demand for balanced resource distribution and related research methods can provide methodological references for this study. Contemporary research in this domain frequently utilizes methodologies such as gravity models [8] and the enhanced E3SFCA approach [15,16] to assess both accessibility and supply–demand dynamics. These approaches, through the establishment of supply–demand linkages, intricately probe the accessibility of medical resources within delineated spatial boundaries and between different administrative units, offering a precise and pragmatic analytical framework for the examination of supply–demand relationships. As a result, recommendations for spatial optimization are formulated.
In urban and regional planning, the emphasis is often on spatial patterns from patient mobility, with less attention given to rationalizing patient behavior and motivations. There is a noticeable research gap in supply–demand relations of medical facilities within the critical context of a metropolitan area. However, existing studies contribute significantly to theoretical development and methodology in this domain. On the one hand, models like the gravity model, which calculates potential spatial connections and their strengths, offer a somewhat realistic depiction of spatial relationships, particularly with optimized parameters [10,17]. On the other hand, urban network analysis, emphasizing the spatial interplay of resource elements [18], effectively delineates the relationships between different administrative units. These methods are extensively used in regional urban studies, constructing various element flow networks such as tourism [19], information [20,21], and transportation [22,23], to represent resource supply and demand traits from a regional perspective comprehensively.
In this paper, after a deep dive into the motivations and choices behind patient movement across administrative regions, we develop a metropolitan-scale medical supply and demand network. This framework enables a series of analyses into regional premium medical supply and demand relationships, offering innovative contributions to theoretical constructs, scale supplementation, and supply–demand analysis. This paper also emphasizes the critical role and significance of these findings in promoting the sharing of superior medical services in a China metropolitan area, reducing interurban disparities and ensuring the health and well-being of residents across all ages, and thereby contributing to the objective of building a healthier, sustainable China metropolitan area. The research unfolded in three segments: initially, we explored patient rationality in seeking medical care based on the ‘People-centered’ theory, proposing pertinent principles for healthcare behavior to elucidate cross-regional patient mobility. This formed the theoretical foundation for our network construction. Subsequently, we established a regional medical supply and demand network through various analytical methods. Lastly, we delved into the intricacies of regional high-quality medical service supply and demand, examining overarching patterns, node-specific characteristics, and zonal attributes with the objective of providing targeted strategies for the spatial optimization of metropolitan medical facilities and the standardization of medical services (Figure 1).

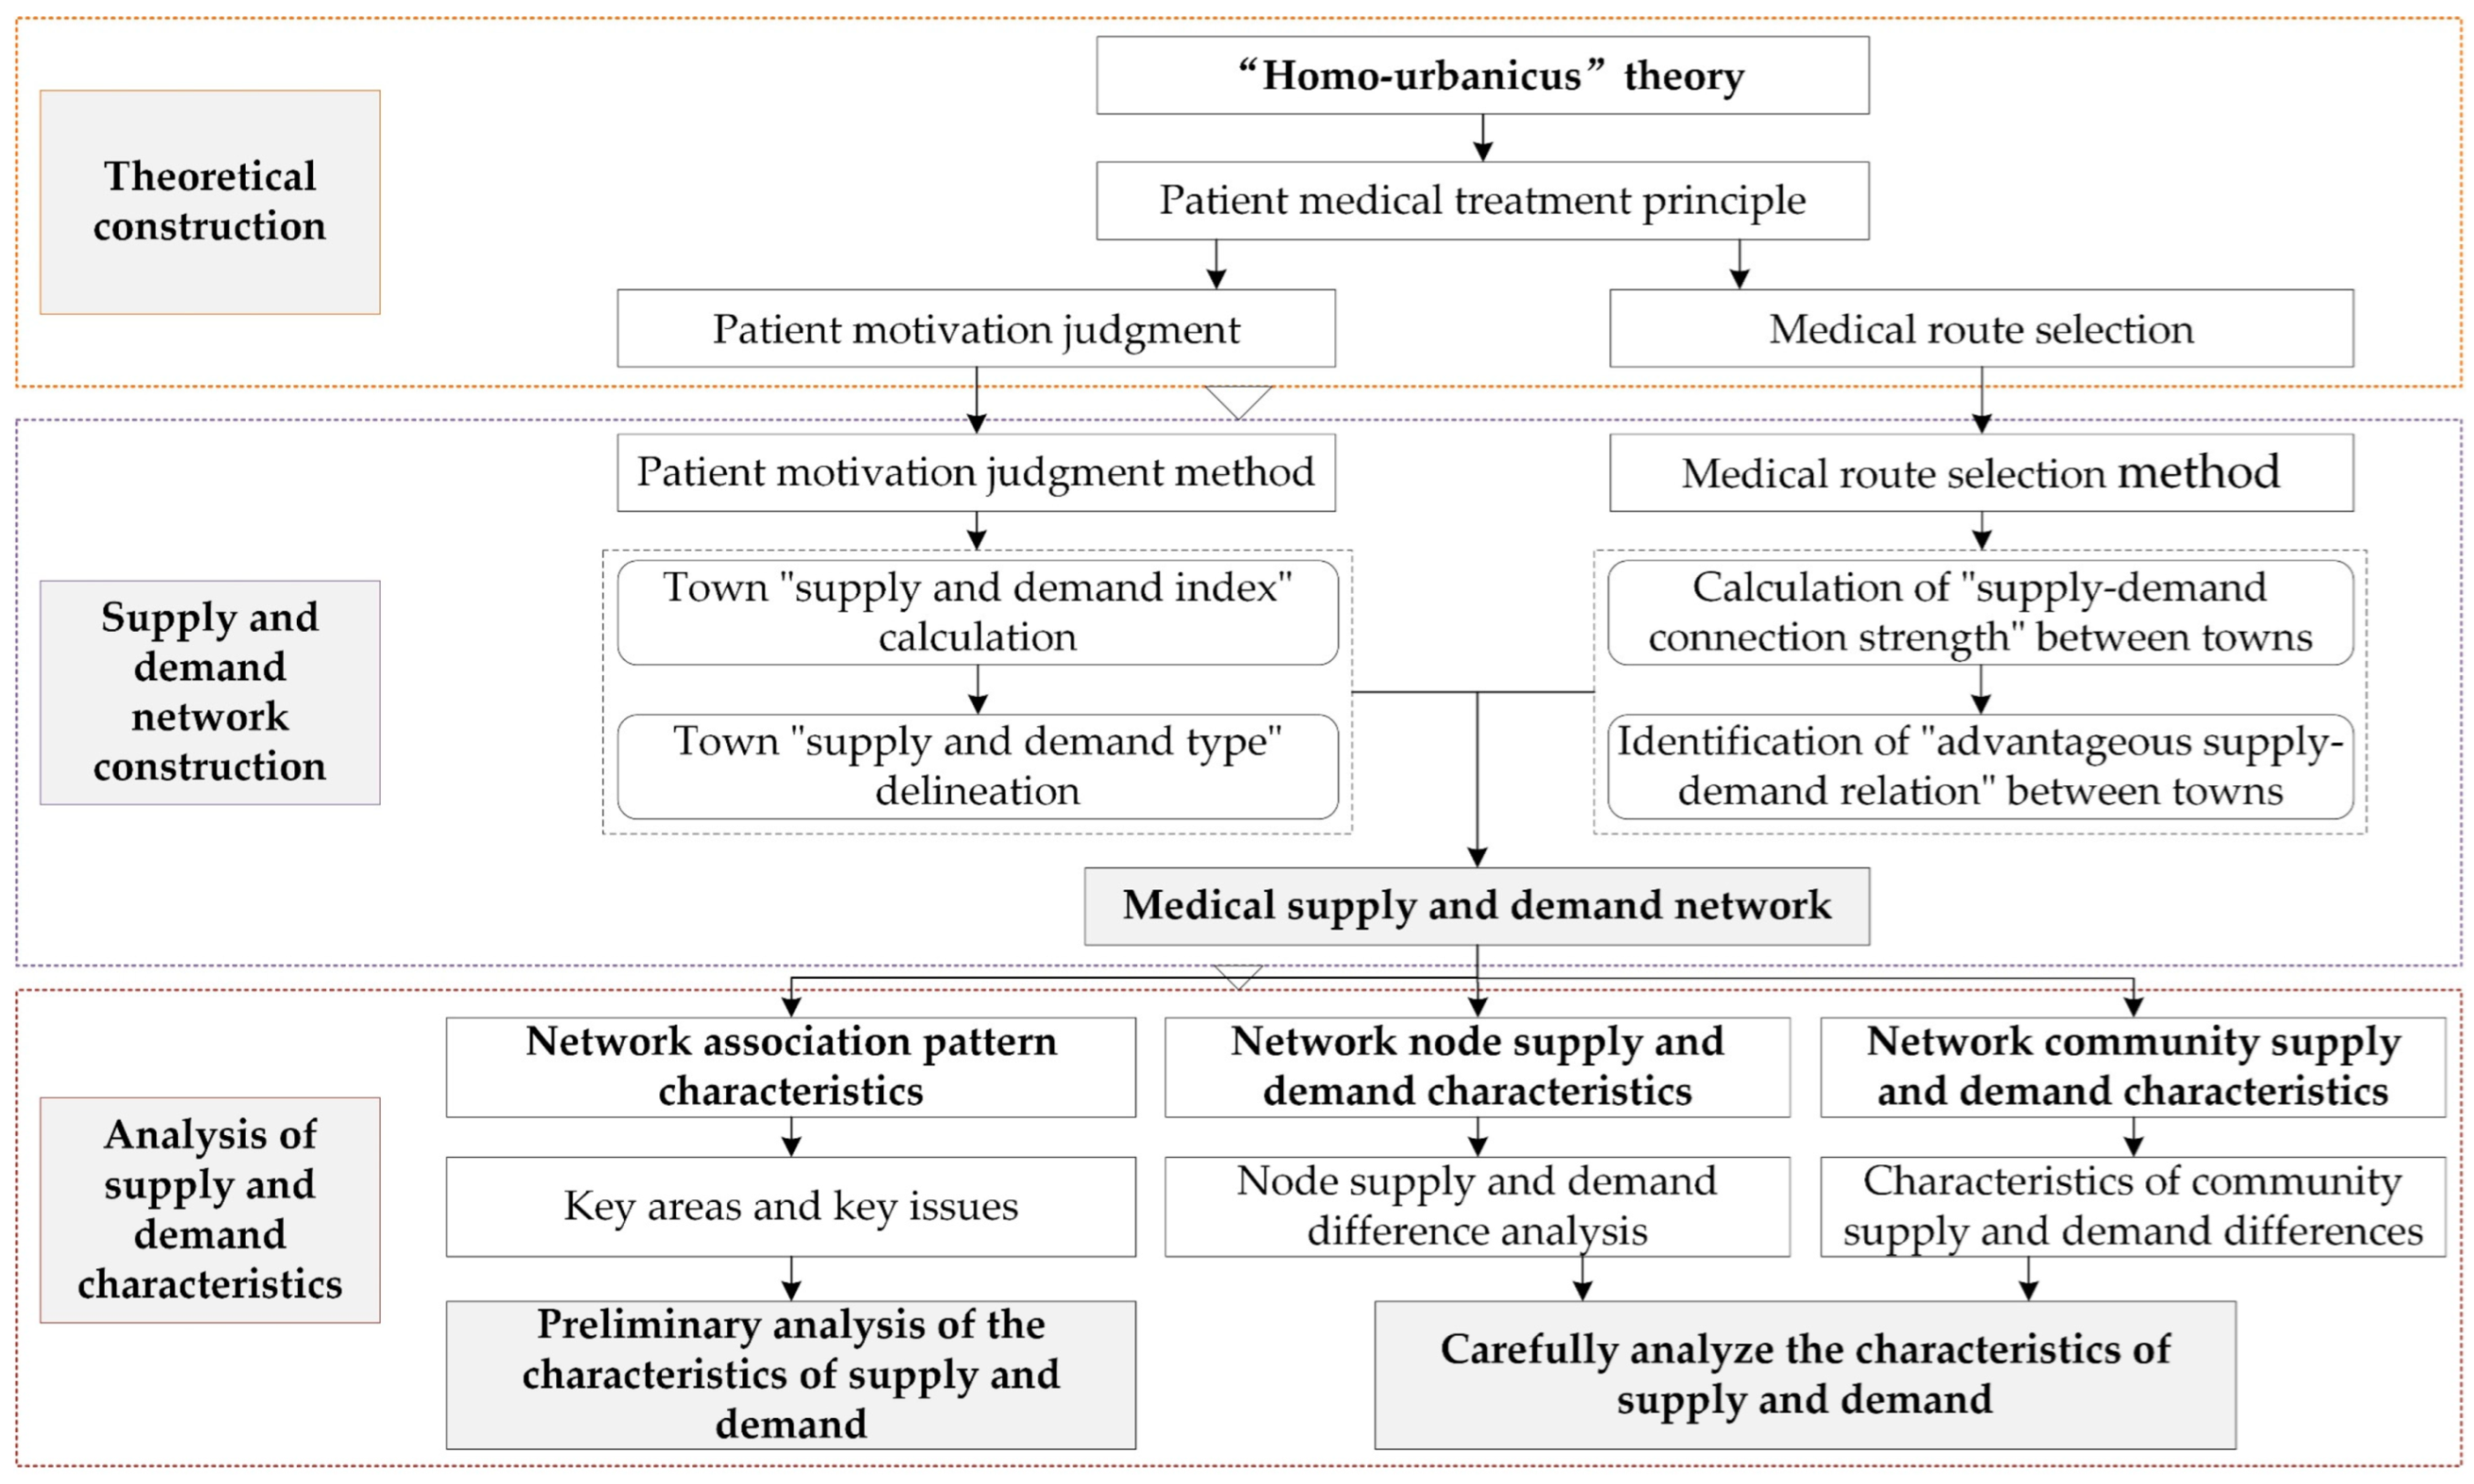
2. Theoretical Construction

2.1. Theoretical Basis

The “people-oriented” planning concept prioritizes equal and equitable spatial utilization by individuals, focusing primarily on the relationship between people as users of space and the space itself [24]. Grounded in this framework, the study hypothesizes that individuals, acting on rational judgment and universal physical principles, follow the principle of “maximizing spatial interactions with minimal effort”. This leads to rational decision making and the establishment of connections for accessing superior public services in healthcare, elderly care, culture, and sports [24].
Utilizing the ‘People-centered’ theory, scholars have conducted extensive planning studies on city-based public service facilities, leading to a wealth of research findings [25,26]. Each study deeply investigates the construction and analysis of supply and demand linkages between users and facilities, providing crucial theoretical insights for this research.
Building on related research, this study seeks to decode the intrinsic logic behind patients’ movements across administrative boundaries within a region. Its objective is to elucidate a specific aspect of human settlement: patients’ cross-boundary pursuit of medical treatment. It posits that such mobility represents a logical pursuit of spatially distributed quality medical resources. Adhering to the principle of ‘maximizing spatial contact with minimal effort’, patients strive for a balance between ‘self-existence’ and mutual ‘coexistence’, aligning with their understanding of regional medical resources [23]. This theory establishes a theoretical framework for elucidating the behavioral patterns of patients seeking medical care across jurisdictional boundaries.

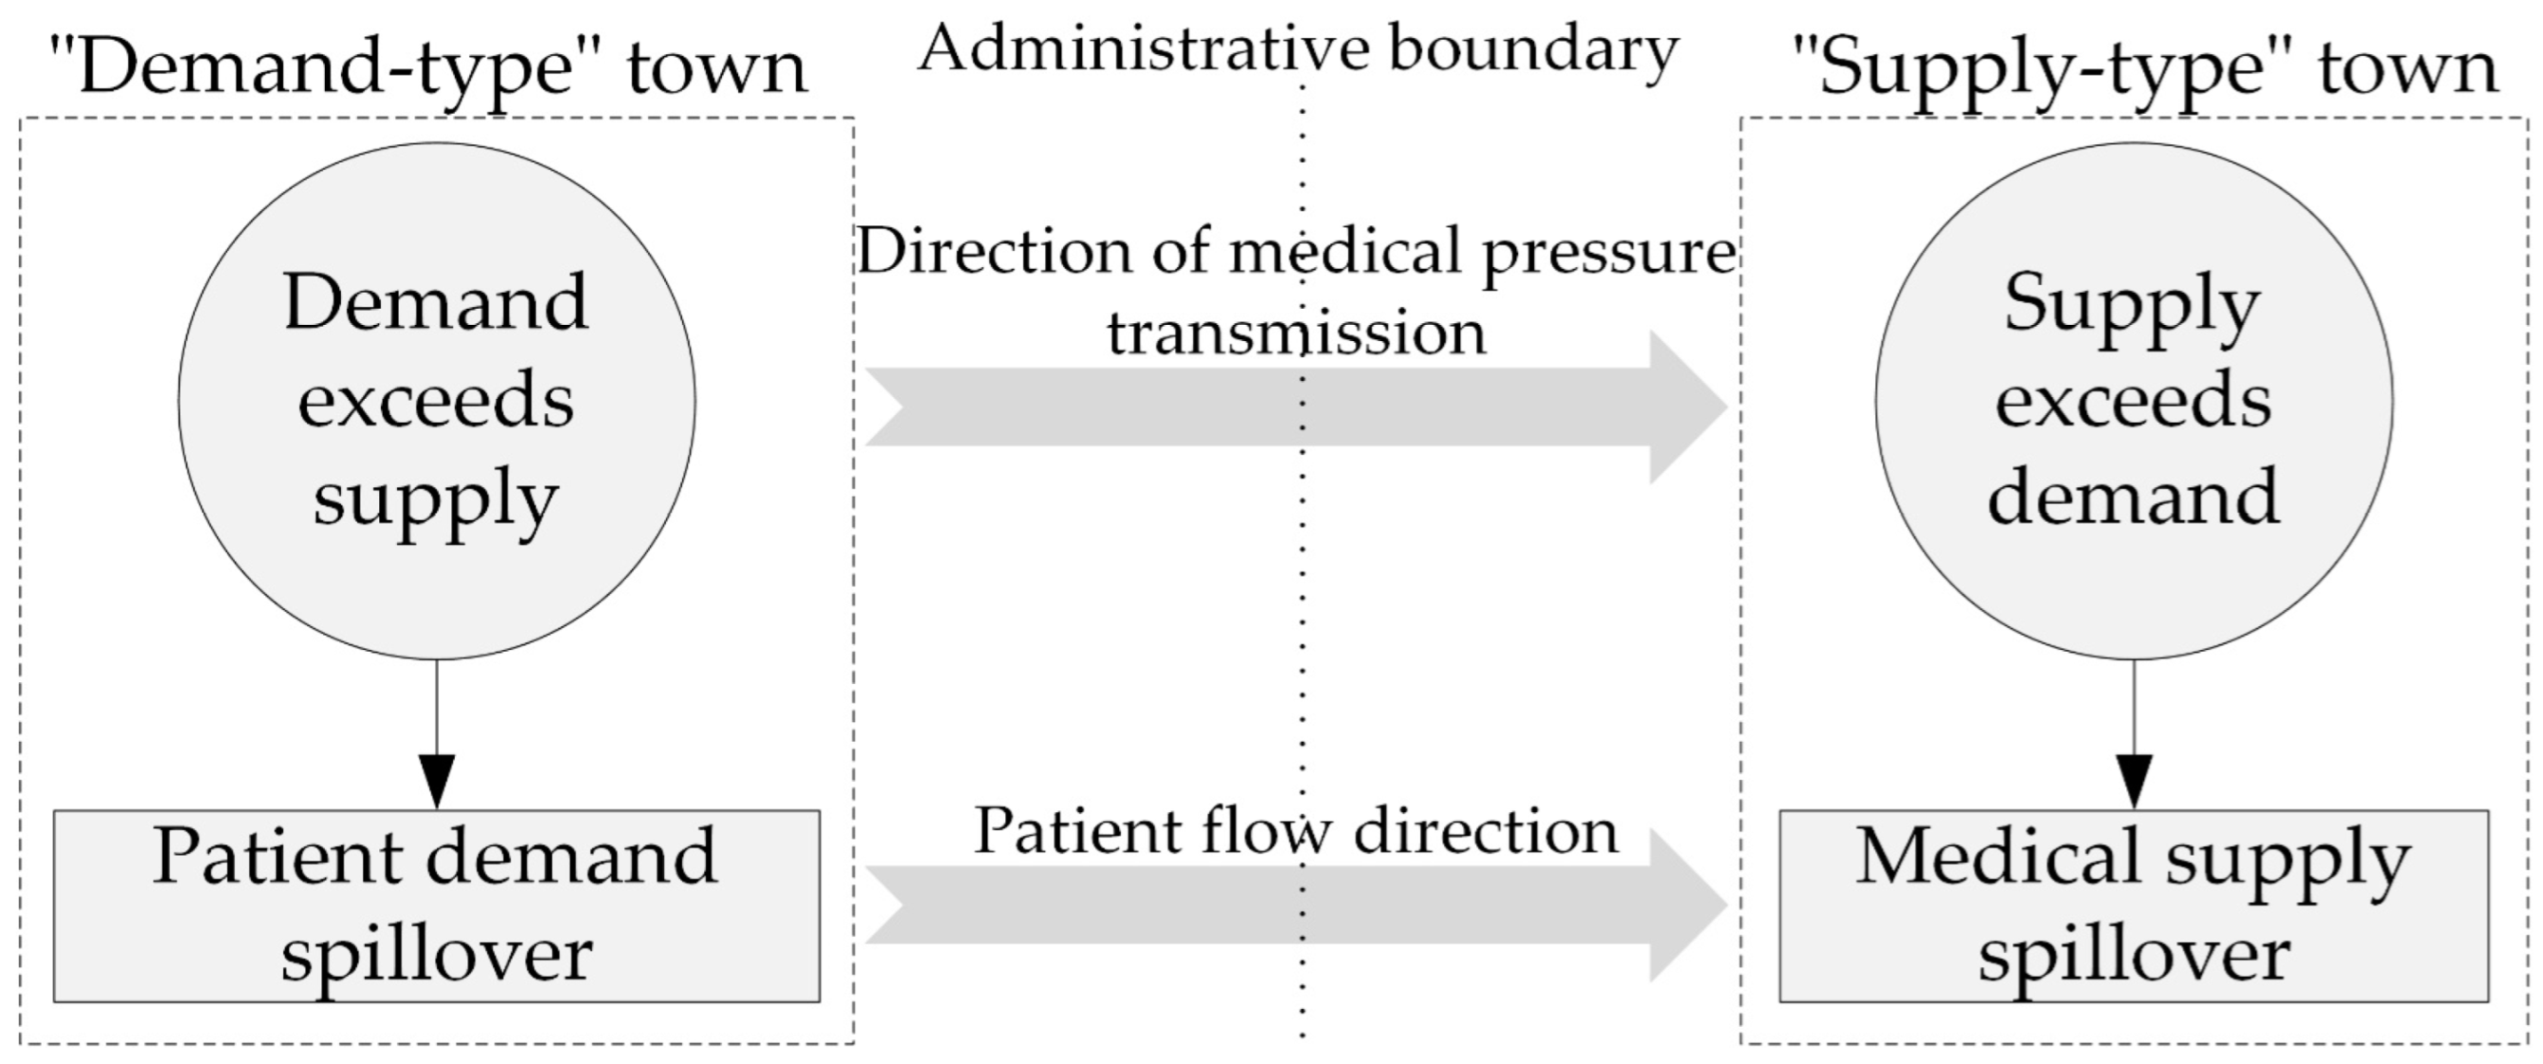
2.2. Patient Medical Treatment Principle

This paper introduces two fundamental principles that aim to provide a comprehensive understanding of the behavioral rationale observed in the majority of patients seeking healthcare. These principles encompass the ‘Patient Motivation Judgment’ principle, which elucidates the factors influencing patient mobility, and the ‘Medical Route Selection’ principle, which evaluates the intensity of associations and the choices made by patients.

2.2.1. Patient Motivation Judgment

This study asserts that variations exist in the quality of available medical resources among different regions. Areas experiencing a shortfall in medical services, where demand outstrips supply, transmit their demand pressure to regions with a surplus of medical resources. This dynamic manifests spatially as patient movements corresponding with the direction of demand transmission. As a result, the study classifies regions with an excess of medical resources as ‘supply-type’ towns and regions witnessing patient outflow due to insufficient resources as ‘demand-type’ towns (Figure 2).

2.2.2. Medical Route Selection

Initially, this study examines healthcare-seeking patterns among patients residing in different towns within the metropolitan area. The relatively modest dimensions of administrative units at the town level present a negligible impact when attempting to influence researchers’ evaluations of patient behaviors on the metropolitan scale. Moreover, patients originating from the same town often encounter comparable levels of healthcare accessibility and medical service quality within the metropolitan area. Consequently, our study does not delve into an extensive investigation of variations in healthcare demands among individuals residing within distinct town administrative boundaries. We operate under the assumption that patients from the same town hold similar value judgments.
(1)
Forming Potential Healthcare Connections:
Grounded in the principle of ‘maximizing spatial contact with minimal effort’, the pertinent literature consistently underscores that the strength of connections between the supply and demand of public services, including healthcare, is influenced by several key factors. These include the willingness of service providers, the expectations of the demand side, and the level of commuting impedance between these stakeholders [25,26]. In the context of this research, the extent of healthcare-seeking activity among distinct neighborhood types is shaped by three pivotal determinants: the surplus of medical services in ‘supply-type’ towns, the exodus of patients from ‘demand-type’ towns, and the accessibility between these towns. Different types of towns, under these varying factors, form healthcare connections with distinct levels of intensity.
(2)
Rationalizing Healthcare Connection Choices:
Consistent with the patient healthcare value orientation towards balancing ‘self-existence’ and ‘coexistence’, the study contends that patients realistically do not form healthcare connections with every region experiencing an overflow of medical services. Patients from diverse areas exercise value judgments in selecting healthcare destinations. Thus, a methodology to discern the healthcare destinations preferred by patients from various ‘demand-type’ towns is essential. The study proposes that patients’ selection of healthcare destinations is guided by two subsidiary criteria:
(1)
The demand ratio advantage criterion is focused on ‘self-existence’, where patients are inclined to opt for destinations within their existing healthcare connections that have a higher intensity. This reflects patients’ expectations of maximizing access to healthcare resources.
(2)
The supply ratio advantage criterion is centered on ‘coexistence,’ wherein patients prefer to avoid destinations that establish stronger connections with other ‘demand-type’ towns in the region, thus circumventing medical congestion. This reflects patients’ judgment of the overall competitive relationship in the region and their hope to maintain a reasonable competitive relationship with other patients.

3. Materials and Methods

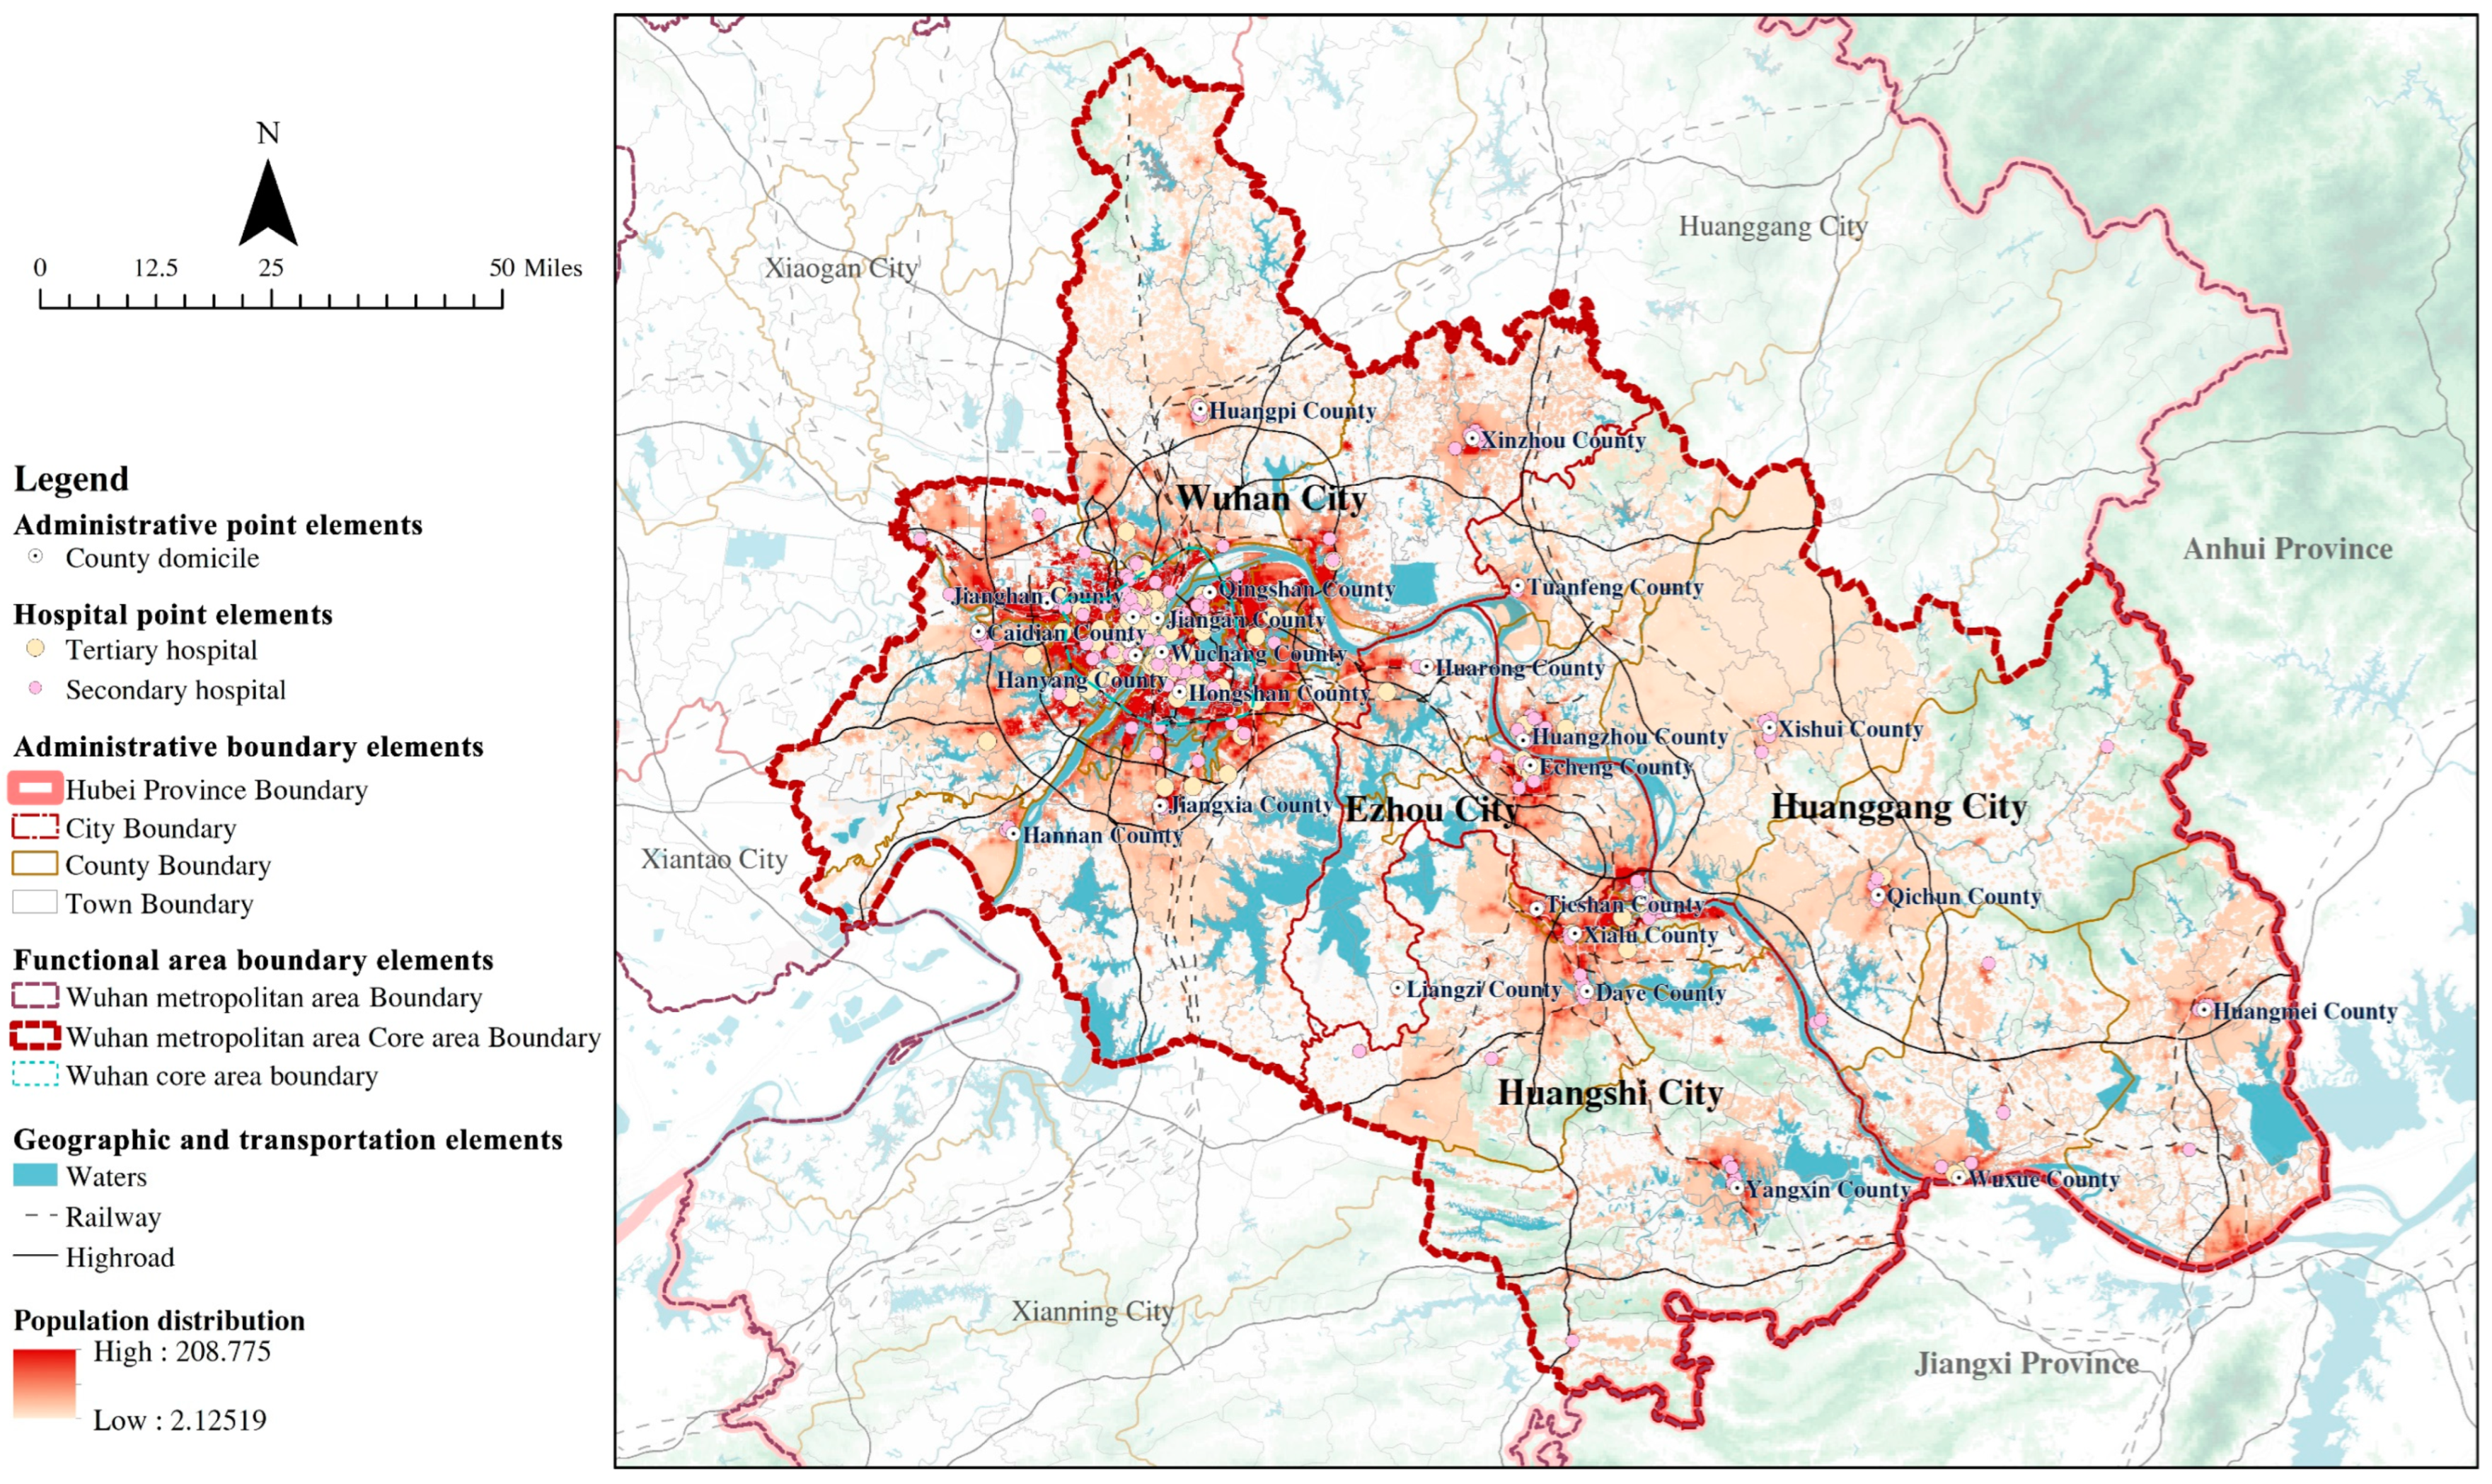
3.1. Study Area and Base Units

3.1.1. Study Area

Figure 3 illustrates the geographical location and distribution of relevant elements in the study area. The spatial boundaries of the core area of the Wuhan Metropolitan Area are delineated according to the ‘Outline of Planning and Construction for Wuhan, Hubei, and Huanggang’. This core area extends from Wuhan, serving as the central city, and encompasses the cities of Ezhou, Huanggang, and Huangshi. It functions as both a demonstration and a core region for the integration of public services within the Wuhan Metropolitan Area, with a primary emphasis on facilitating the equitable sharing of high-quality public service resources among diverse administrative regions. The study area comprises 48 counties and other administrative units of similar hierarchy, as well as 366 towns and comparable administrative units. In 2021, this region had a permanent population of 20.81 million and included 270 hospitals in the study. Wuhan, as the central city, had a population of 13.65 million and 186 hospitals, representing 65.59% and 68.89% of the core area of the Wuhan Metropolitan Area, respectively.
The selection of this region for studying medical supply and demand relationships is based on three key factors. Firstly, China’s “14th Five-Year Plan” explicitly underscores the Wuhan metropolitan area’s pivotal role in fostering regional integration and urban development. Secondly, the uniqueness of this research area is characterized by significant disparities between core cities and peripheral cities within the region. According to the 2022 Chinese Hospital Rankings released by Fudan University’s Institute of Medical Management, Wuhan boasts 5 hospitals ranking within the top 100, with 2 of them securing positions in the top 10. This places Wuhan among the nation’s premier cities, signifying its status as a core city for delivering high-quality medical services on a national scale. Nonetheless, scholars have identified an imbalance in medical development within the broader region, encompassing the Wuhan metropolitan area [3]. Lastly, as the seventh national-level metropolitan area in China, the Wuhan metropolitan area garners substantial attention from the central government. The Wuhan–Ezhou–Huanggang core area, serving as the epicenter of urbanization within this metropolitan region, assumes a pivotal role in showcasing and leading the provision of quality public services, including medical services.

3.1.2. Base Unit Determination

This study undertakes empirical research employing towns as the foundational unit, encompassing all grassroots administrative regions of equivalent status, such as towns, townships, and subdistricts, all of which fall under the jurisdiction of the county-level administrative hierarchy. To begin, the “Metropolitan Area National Land Spatial Planning Compilation Regulations”, issued by the Chinese government, explicitly designate the town level as the foundational tier within the three-tier administrative framework of “city-county-township/subdistrict” and underscore the pivotal role of the town administrative level in facilitating the sharing of medical services and the coordination across city and county boundaries. Secondly, this research centers on the healthcare-seeking behaviors of patients transcending municipal and county boundaries. The utilization of towns as the fundamental unit enhances research precision and enables an accurate analysis of supply–demand dynamics. As a result, this paper conducts its investigation utilizing all administrative units comprising towns, townships, and subdistricts within the study area as its fundamental units, collectively referred to as “town” in subsequent sections, amounting to a total of 366.

3.2. Data Source

(1)
Demand data:
According to the ‘People-centered’ theory, healthcare needs vary among different age groups [24], and the age structure diversity in various regions significantly impacts regional medical demand. Consequently, data on healthcare needs are derived from Worldpop’s age structure grid data (https://www.worldpop.org/datacatalog/ accessed date 1 August 2023), the seventh census bulletins for the Wuhan Metropolitan Area’s core area counties and districts, and the ‘China Health and Wellness Statistical Yearbook 2021’.
(2)
Supply data:
The medical supply data thus include bed counts and staffing levels of these hospitals, obtained from the Hubei Provincial Health Commission’s official website (http://wjw.hubei.gov.cn/bsfw/bmcxfw/snyljgcx/ accessed date 1 August 2023) and individual hospital websites.
(3)
Commuting data:
The commuting data utilize the administrative centers of residential units as nodes. The shortest driving and public transport commute times between these nodes are acquired from Amap, with calculations based on the fastest commuting method.

3.3. Methods

3.3.1. Supply and Demand Network Construction

Medical supply and demand network build process and the method based on Patient Medical Treatment Principle as shown in Figure 4.
(1)
Patient motivation judgment
  • Fundamental analysis: Town “supply and demand index” calculation
The supply ( D n ) and demand ( O n ) levels at the town level are quantified through the infrastructure and staff capacity of secondary and tertiary hospitals and the healthcare utilization rates across age groups. Specifically, the infrastructure and staff capacity are determined by the number of hospital beds ( N i c ) and staff members ( N i p ). This study employed the Entropy Weight Method to ascertain the weighting factors for two specific indicators: the bed capacity weight ( W i c ) and the employee count weight ( W i p ). This methodology derived the weights by conducting an analysis of data disparities and structural characteristics, avoiding dependency on subjective human judgments or personal experiences. It inherently embodied a high degree of objectivity and applicability. Population data, segmented by age and reflective of patient demand, were derived from the China 2020 Worldpop age structure grid, corrected with the seventh national census data. The healthcare utilization rates by age group were calculated based on the biweekly morbidity rates ( S i ) from the ‘China Health and Wellness Statistical Yearbook 2021’. This data accurately reflected the proportion of the population in various towns within the study area and across different age groups who were in need of medical care.
The formulas for these calculations are as follows:
D n = i = 0 N i c W i c + N i p W i p
O n = i = 0 P i S i
In the formulas: O n represents the demand index for town n ; P i is the total population of age i in town n ; and S i is the biweekly morbidity rate for age i in Central China. D n is the supply index for residential unit n ; N i c and N i p are the numbers of beds and staff in the i th hospital within town n ; and W i c and W i p are the respective weights for bed and staff data.
  • Motivation judgment: Town “supply and demand type” delineation
To ensure comparability, both supply and demand indexes for each town are normalized to a 0–1 scale. The study then calculated a standardized supply–demand ratio ( R n ) and selected towns within a 0.9–1.1 ratio range. This step is followed by computing a harmonization match ratio ( N ) for the supply ( D n ) and demand ( O n ) levels of these towns to analyze the overall regional supply–demand harmony. Each town’s supply level, multiplied by this ratio, was compared with its demand level to classify the town as either ‘supply-type’ or ‘demand-type’ and to calculate the supply–demand overflow ( S n ).
The corresponding formulas are:
R n = O n O M I N O M A X O M I N × D n D M I N D M A X D M I N 1
N = R n                         R n 0.9 , 1.1
S D n = log D n N O n
S O n = log N O n D n
Here, D M A X , D M I N , O M A X , and O M I N denote the maximum and minimum values of supply and demand levels across all towns; R n is the supply–demand ratio for residential unit n; and N is the regional supply–demand match ratio.
A town is categorized as ‘supply-type’ if N D n exceeds O n ; otherwise, it is classified as ‘demand-type’.
S O n and S D n represent the processed outcomes of log-standardizing the spillover values related to supply and demand for towns categorized as ‘demand-type’ and ‘supply-type,’ respectively. These variables denote the extent of demand spillover for ‘demand-type’ towns and supply spillover for ‘supply-type’ towns, with the primary objective of enhancing numerical analysis.
(2)
Medical route selection method
  • Forming Potential Healthcare Connections: Calculation of “supply-demand connection strength” between towns
Utilizing the gravity model, a predominant method in urban network research for analyzing connection patterns across multiple administrative regions [17,27], could effectively reflect three key elements in the theoretical construction section, which pertained to the establishment of potential healthcare connections. This study quantified the strength of medical treatment connections between ‘demand-type’ towns ( O i ) and ‘supply-type’ towns ( D j ).
The formula used is as follows:
T O i D j = k S O i S D j R O i D j γ
The formula represents T O i D j as the strength of the cross-border medical treatment connection from ‘demand-type’ town i to ‘supply-type’ town j . The terms S O i and S D j indicate the demand and supply spillover for towns i and j , respectively; R O i D j denotes the commuting duration; k and γ are constants set at 1 and 2, respectively.
  • Rationalizing Healthcare Connection Choices: Identification of “advantageous supply-demand relation” between towns
The study employed location entropy to determine preferred cross-administrative medical connections for each ‘demand-type’ town. This method is typically used to evaluate competitive or selection advantages of products at larger scales [28]. Incorporating the elucidation of patients’ rational choices in healthcare connect selection from the theoretical framework presented in this article, the formula of this method comprised two components: the numerator and the denominator. Each part reflects the patient principles of ‘self-existence’ for the demand proportion and ‘coexistence’ for the supply proportion.
The calculation formula is:
R C A O 1 D 1 = T O 1 D 1 × T O 1 D n 1 T O n D 1 × T O n D n 1
Here, R C A O 1 D 1 signifies the location entropy level; T O n D n totals the connection strength across the entire network; T O 1 D n and T O n D 1 represent the sums of connection strengths between ‘demand-type’ town O 1 and all ‘supply-type’ towns, and between all ‘demand-type’ towns and ‘supply-type’ town D 1 , respectively; and T O 1 D 1 is the cross-border medical treatment connection strength from town O 1 to town D 1 .
If R C A O 1 D 1 exceeds 1, this suggests that the cross-border medical connection from town O 1 to town D 1 is dominant among all potential connections of town O 1 .

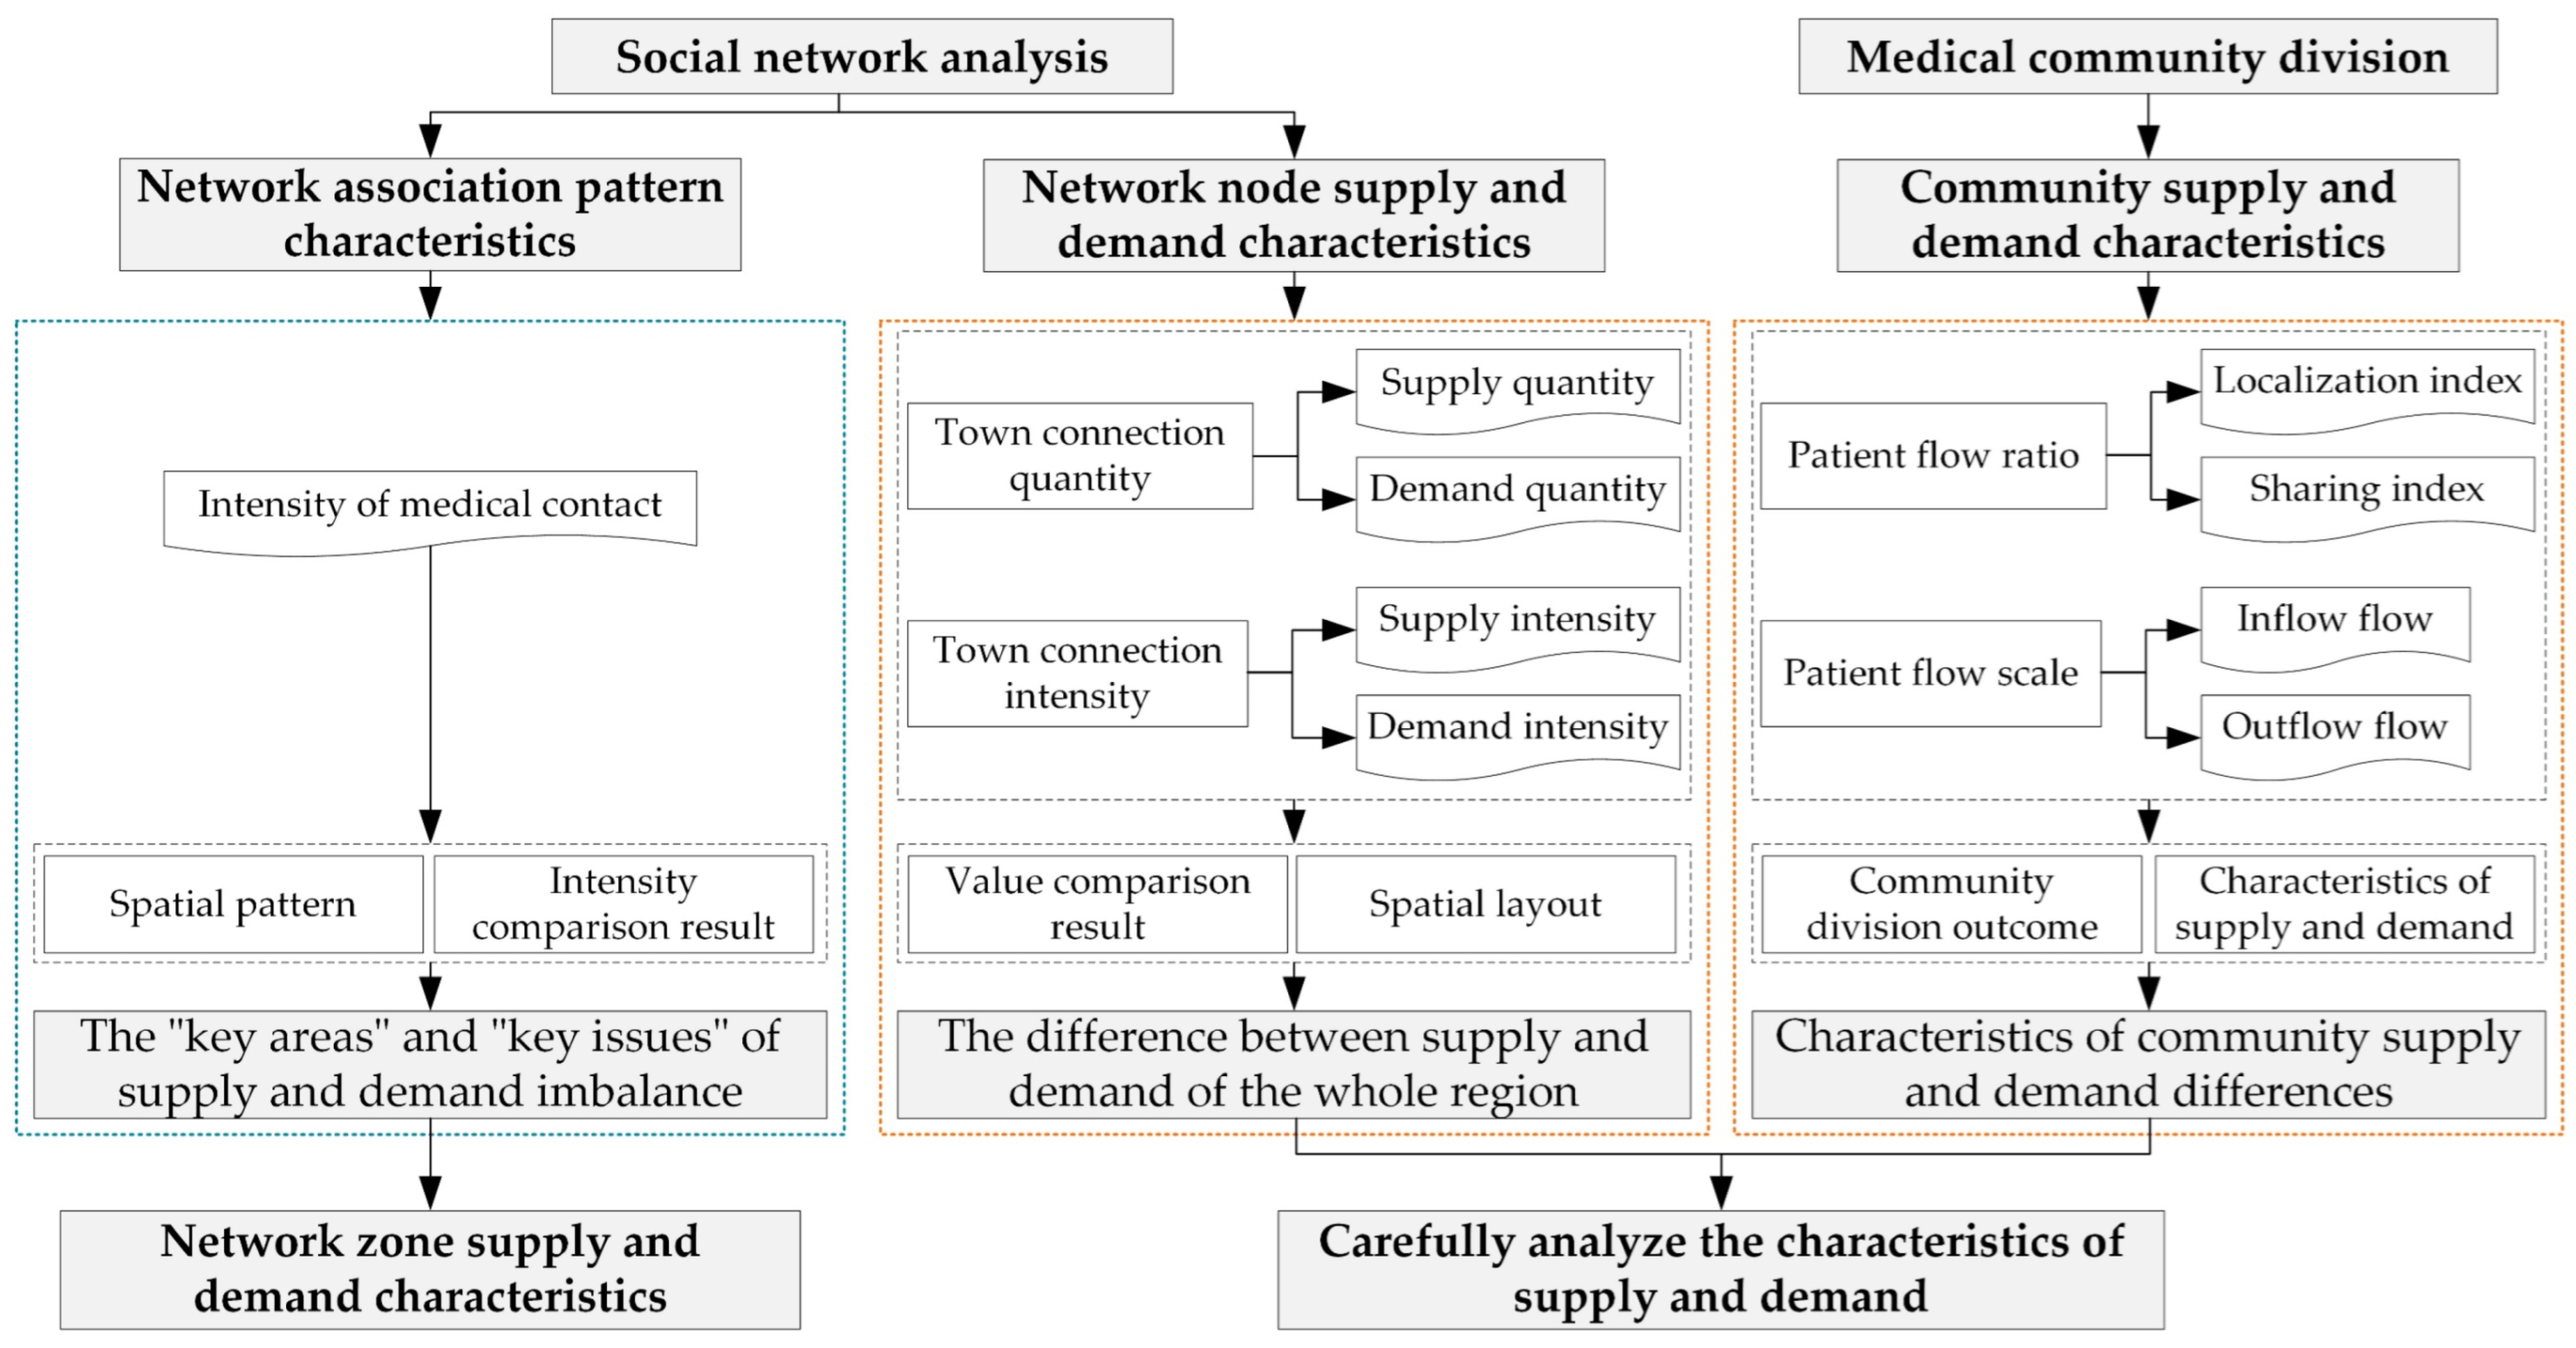
3.3.2. Analysis of Supply and Demand Characteristics

The path of regional healthcare supply and demand characterization based on the results of supply and demand network construction is shown in Figure 5.
(1)
Social network analysis
Using social network analysis, the study assessed the supply–demand connection attributes, including strength and node attributes, of all towns within the regional cross-border medical treatment network (Table 1). This approach effectively deciphered urban network spatial structures and characteristics [8,29].
(2)
Medical community division
In China, a well-established model of resource allocation and management based on hierarchical administrative divisions prevails. The administrative tiers of cities and counties play a pivotal role in the allocation and management of medical resources. However, in the context of the growing trend of patients seeking healthcare services across city and county boundaries, the question of how to transcend the limitations imposed by urban and county administrative boundaries and accurately depict the actual scope of medical services has introduced a fresh perspective. This new perspective involves using towns as fundamental units for delineating medical service communities.
This paper integrated the community detection method from prior research for evaluating geographic disparities in medical services and adopts the Leiden algorithm [11,13], apt for demarcating medical service regions. The community division, executed via Gephi0.9.7 software’s modularization tool, comprised zones each anchored by one or more ‘supply-type’ towns that formed a medically cohesive hinterland. Prior studies frequently utilized the modularity Q value to gauge the appropriateness of community divisions, deeming a Q value between 0.3 and 0.7 as reasonable [30]. Given that resolution critically influences the Q value, with lower values correlating with higher Q values and more distinct zoning characteristics, it facilitated the elucidation of internal modular connections [30].
To guarantee the clarity of the zoning division outcomes, revisions are often made in line with two key principles: (1) maintaining spatial continuity and geographical adjacency among zones; and (2) balancing regional zoning scales to avoid merging isolated nodes or nodes of insufficient scale, adhering to the principle of minimum regional size [12,13,31]. Building on this, differences in medical supply and demand across zones are assessed using the Localization Index ( L I ), Sharing Index ( S I ), Inflow Volume ( I F ), and Outflow Volume ( O F ), as detailed in Table 2.

4. Results

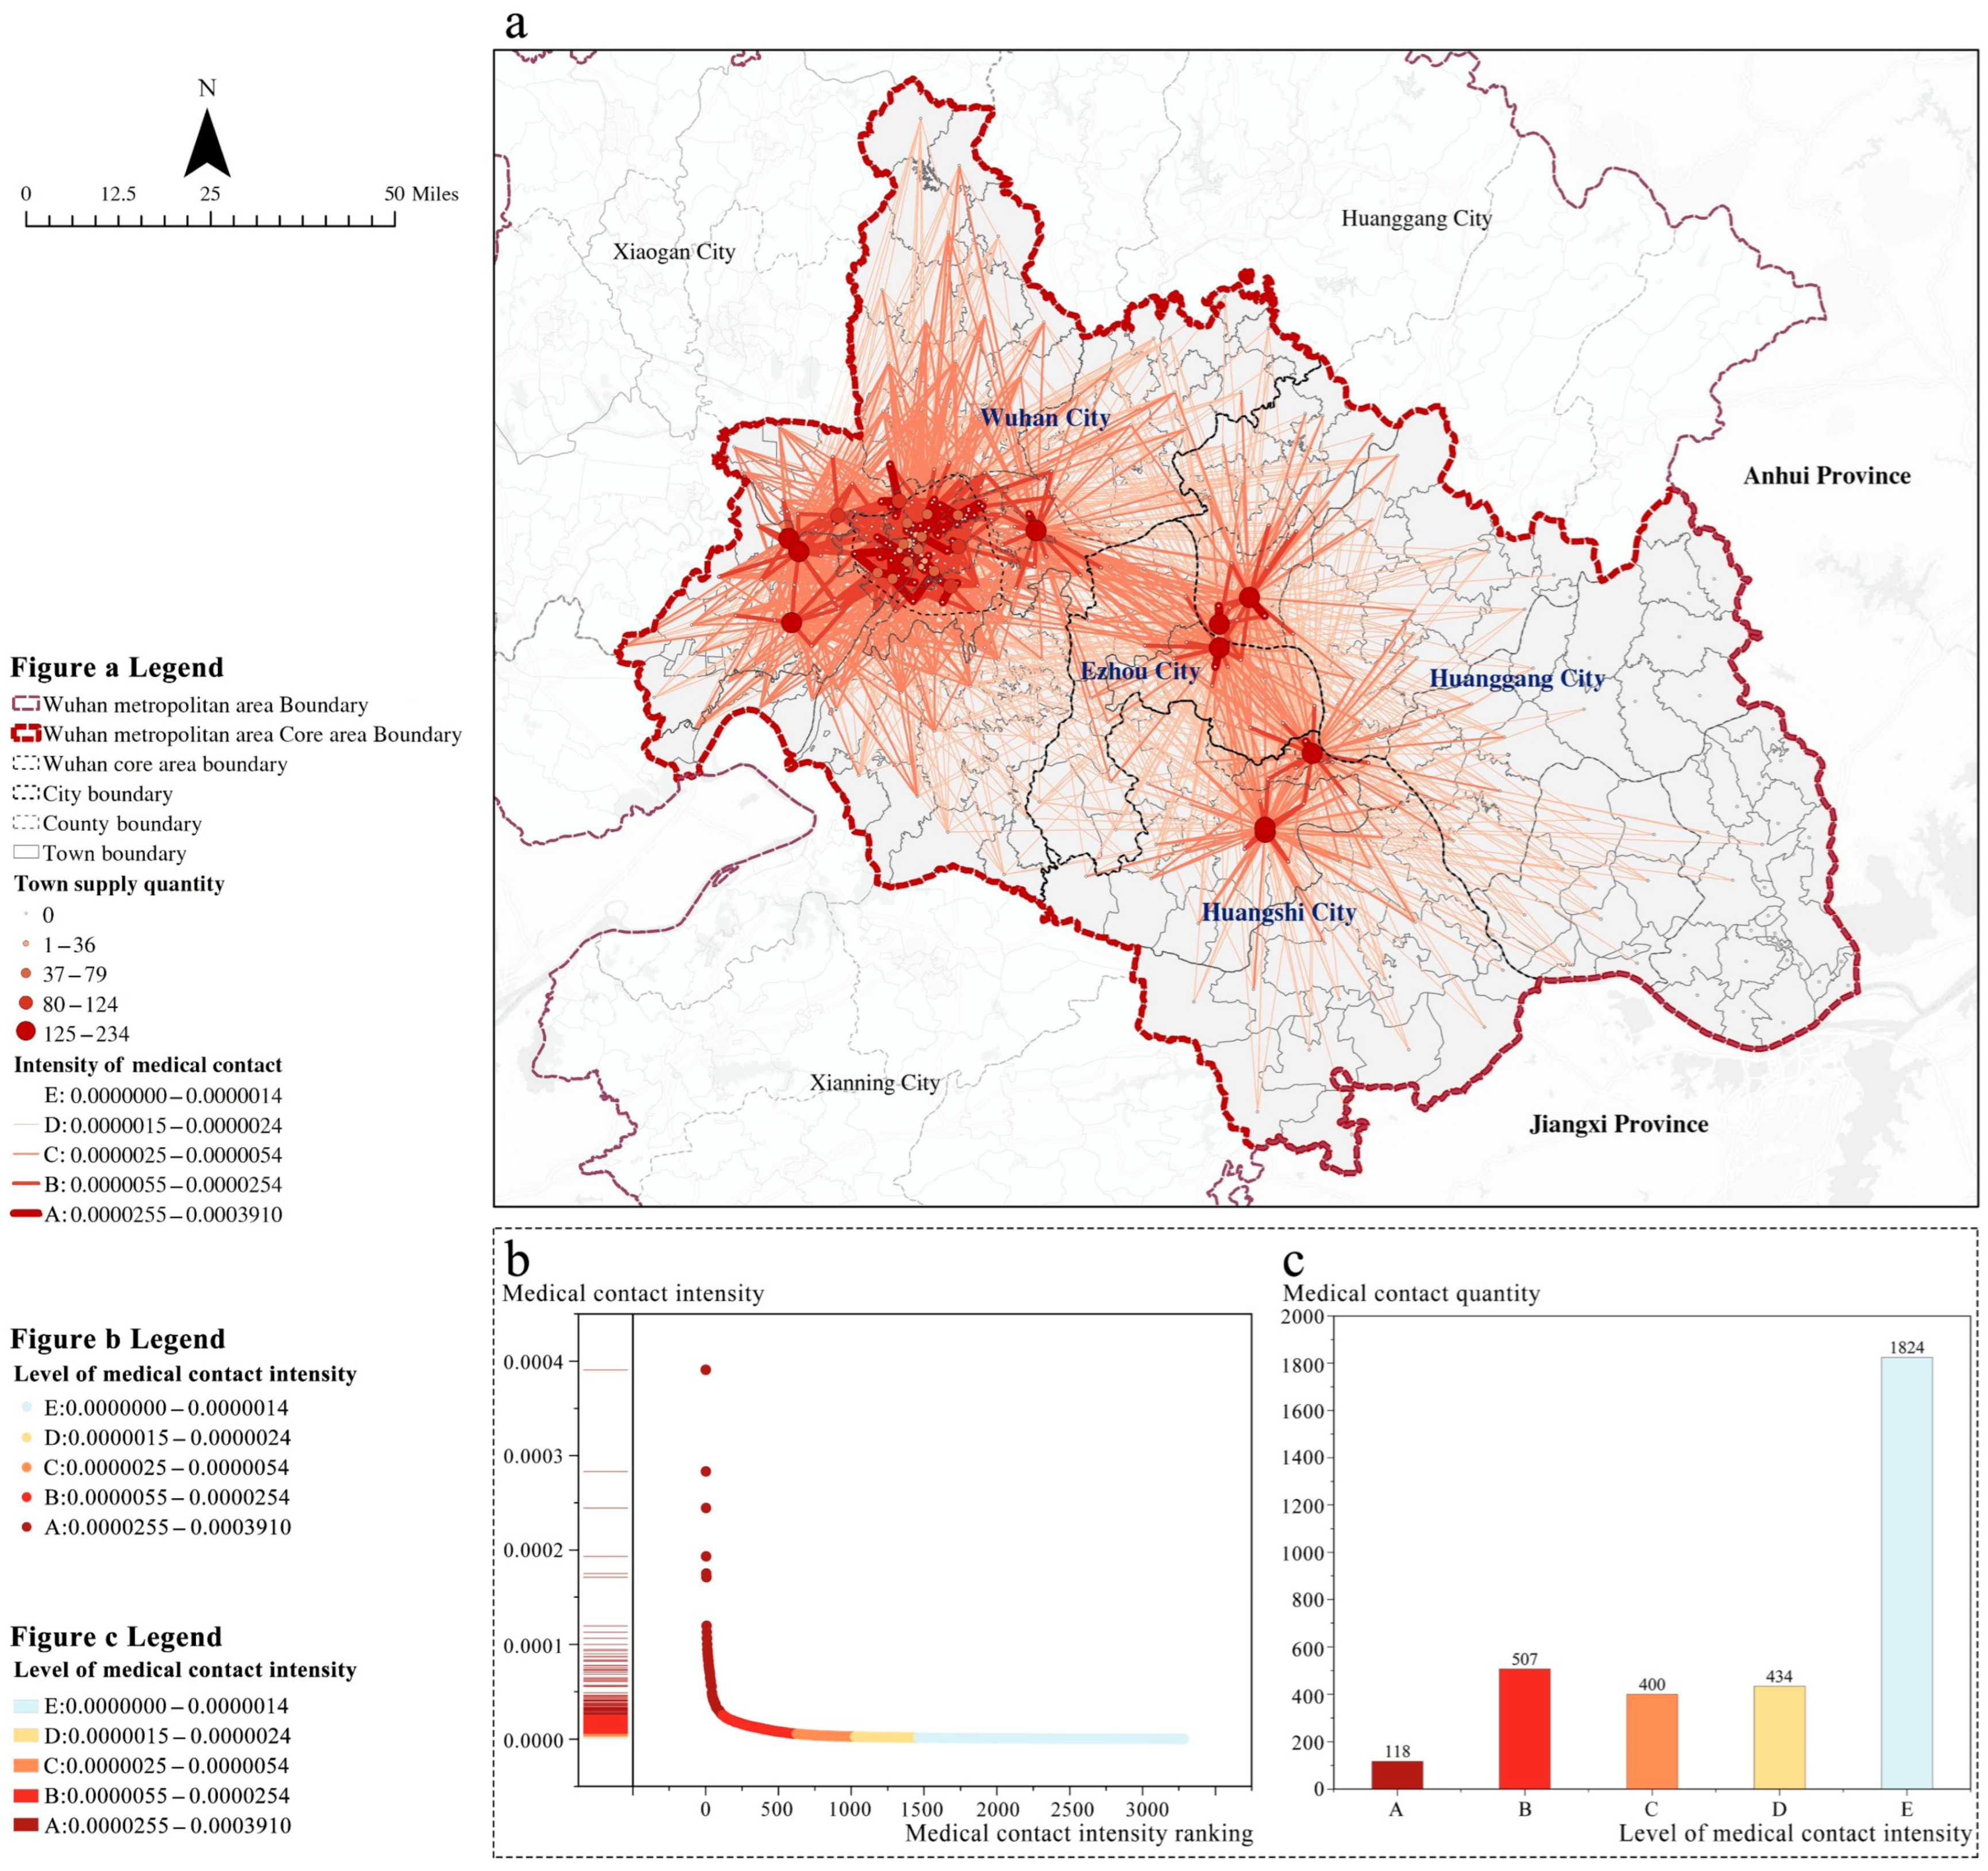
4.1. Network Association Pattern Characteristics

This research establishes a cross-border medical supply and demand network, encompassing 3283 supply and demand connections across 366 towns, as depicted in Figure 6a. It investigates the network’s correlation patterns and medical contact intensity, laying a foundation for a comprehensive analysis of regional medical supply and demand dynamics.
Employing a natural break method, the study categorizes supply and demand contact intensities into five levels (A–E), from strongest to weakest. Figure 6a illustrates the network’s spatial correlation within Wuhan’s Metropolitan Area’s core area, showcasing the distribution of these five levels. The network’s spatial configuration reveals a distinct ‘core-periphery’ structure, with two high-density areas of intense supply and demand: Wuhan’s main urban zone and its vicinity, rich in A and B level contacts, and a zone at the junction of Ezhou, Huangshi, and Huanggang, with fewer A and B level contacts. High-intensity medical interactions are scarce outside these focal areas due to the spatial proximity of towns experiencing both supply and demand overflow.
Further, the study ranks the 3283 medical contacts by intensity (Figure 6b), uncovering a power-law distribution in contact intensity, with A-level intensity substantially surpassing other categories. This pattern, along with the regional network’s layout, confirms the concentration of A-level contacts in Wuhan’s main urban area, supporting the hypothesis of Wuhan as a prime medical destination. This finding underscores regional disparities and imbalances in medical supply and demand. A small number of A-level contacts also exist in the Ezhou, Huangshi, and Huanggang junction, but with marked differences from Wuhan’s urban area. Subsequent analysis (Figure 6c) shows that A-level contacts, totaling 118, are significantly less frequent than lower-level contacts, with E-level contacts reaching 1824. This disparity indicates prevalent weak medical supply and demand links in the study area, with strong connections limited to a few towns in Wuhan’s urban core.
These findings lead to a preliminary recognition of a supply and demand imbalance in quality medical services, characterized by two main issues: (1) Concentrated sharing of high-quality medical resources in a small segment of Wuhan’s urban core; (2) Limited radiative impact of quality medical services from Ezhou, Huangshi, and Huanggang due to inadequate supply overflow, failing to extend to the broader hinterland. This involves two critical regions: (1) the largely self-reliant urban core of Wuhan; and (2) the junction of Ezhou, Huanggang, and Huangshi with restricted radiative capacity.

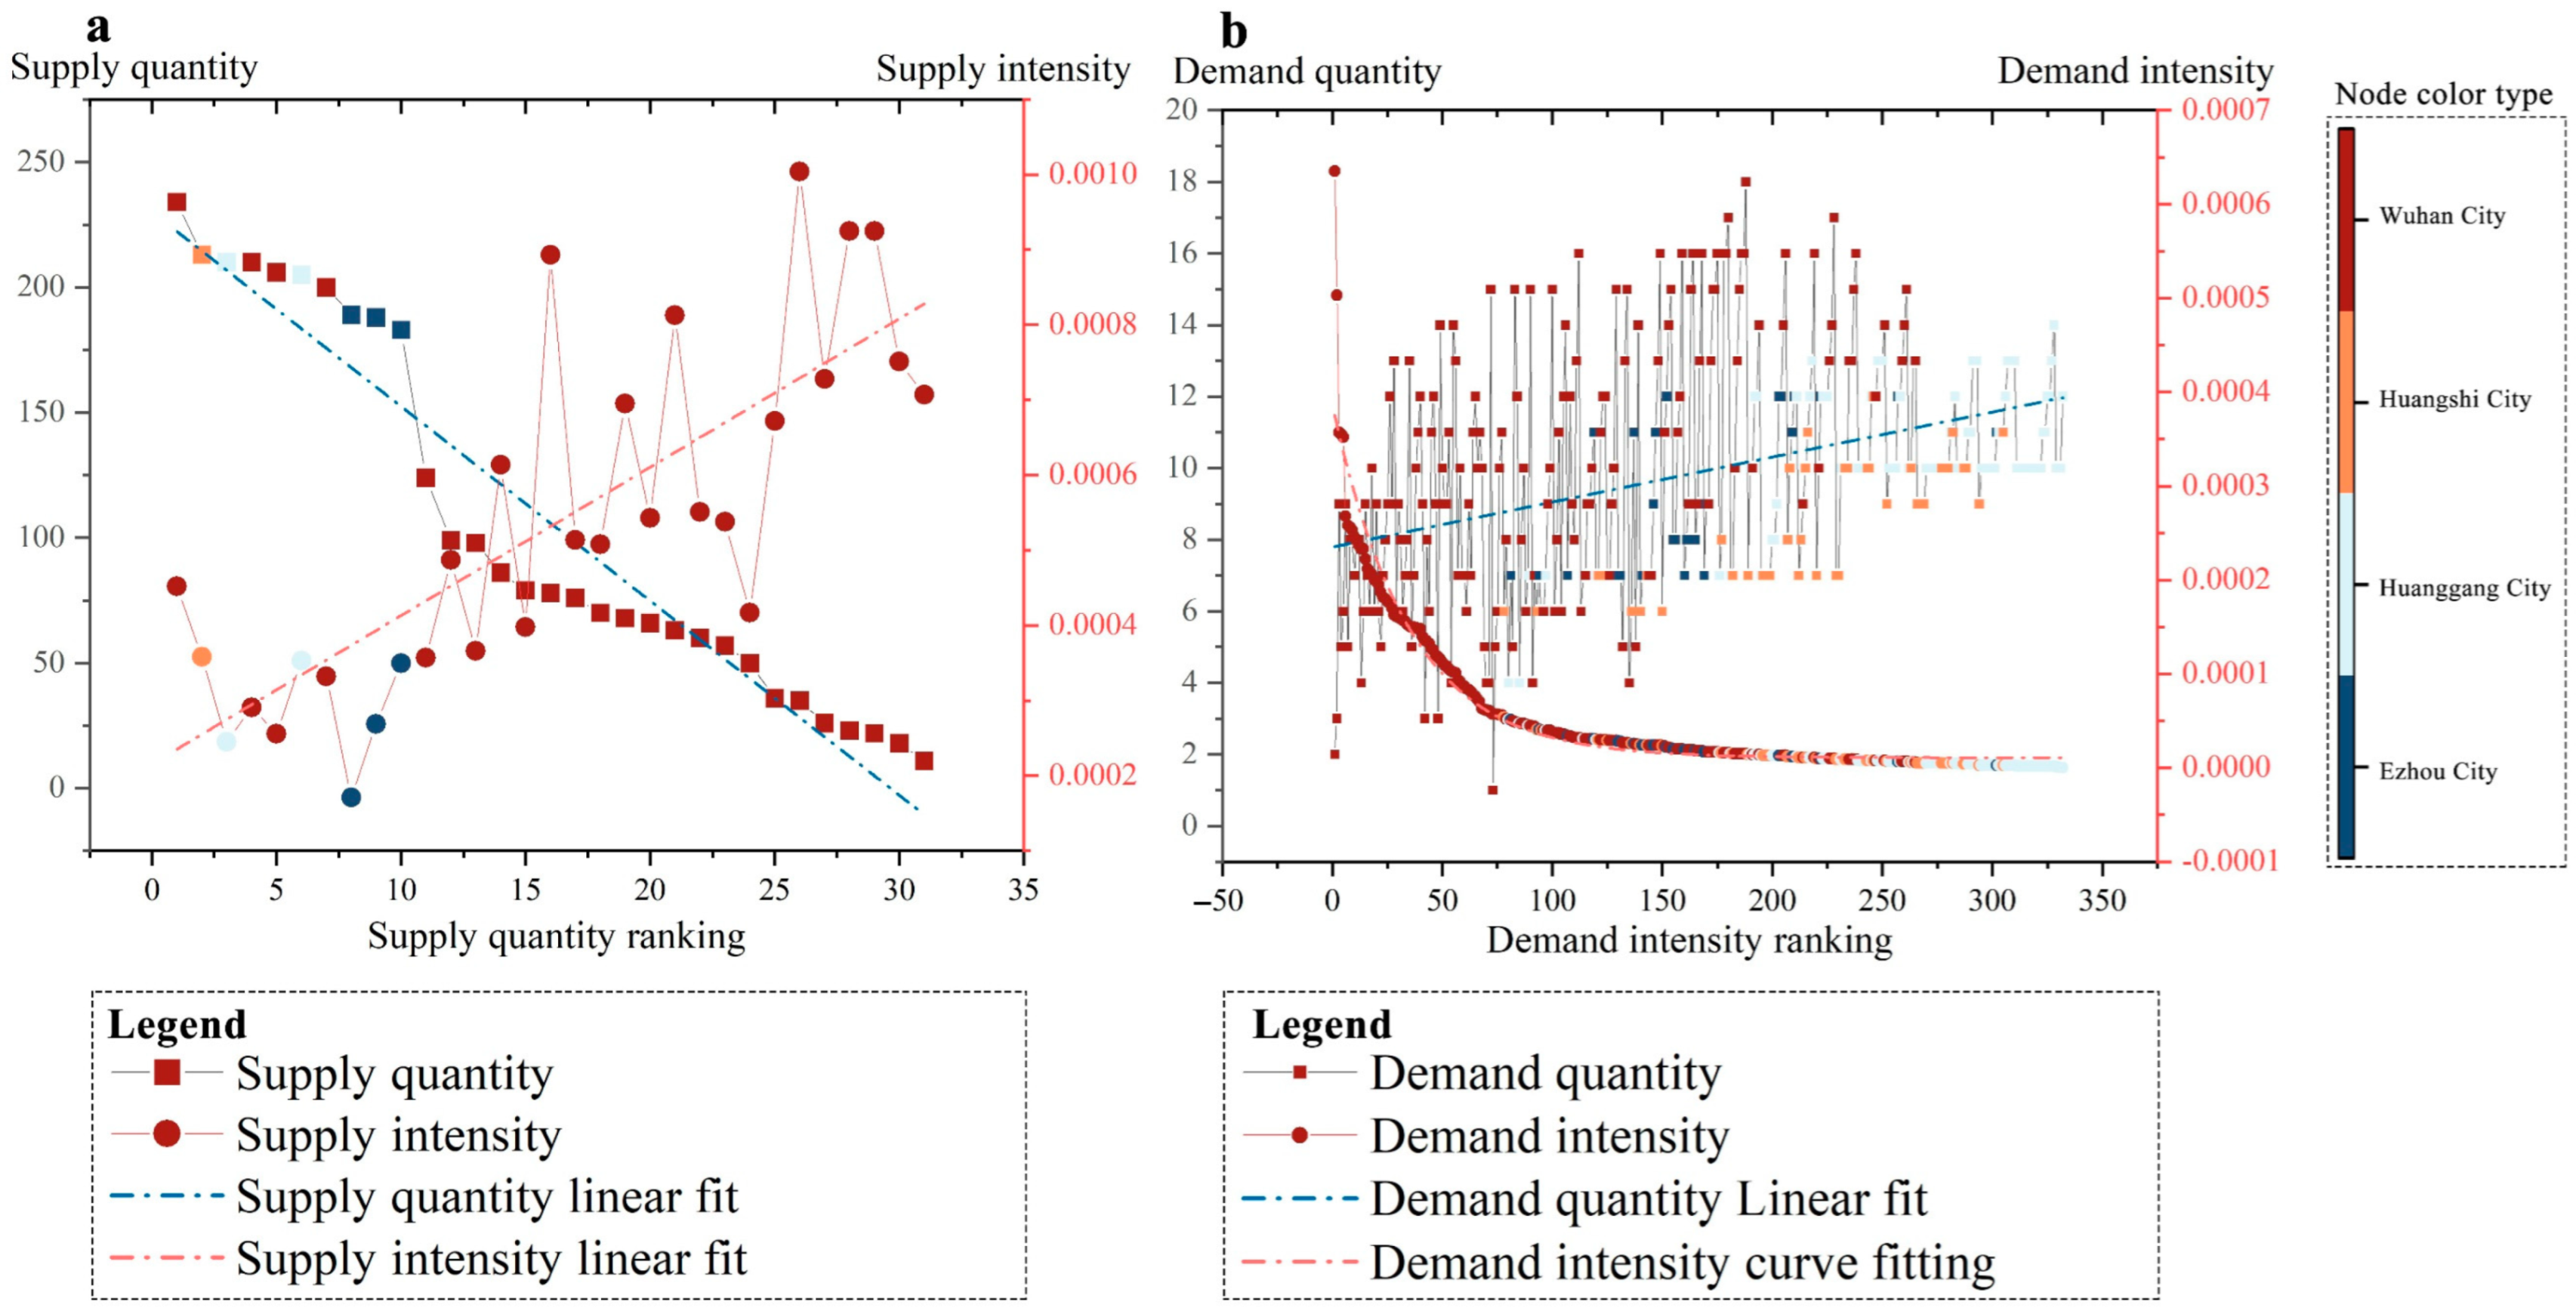
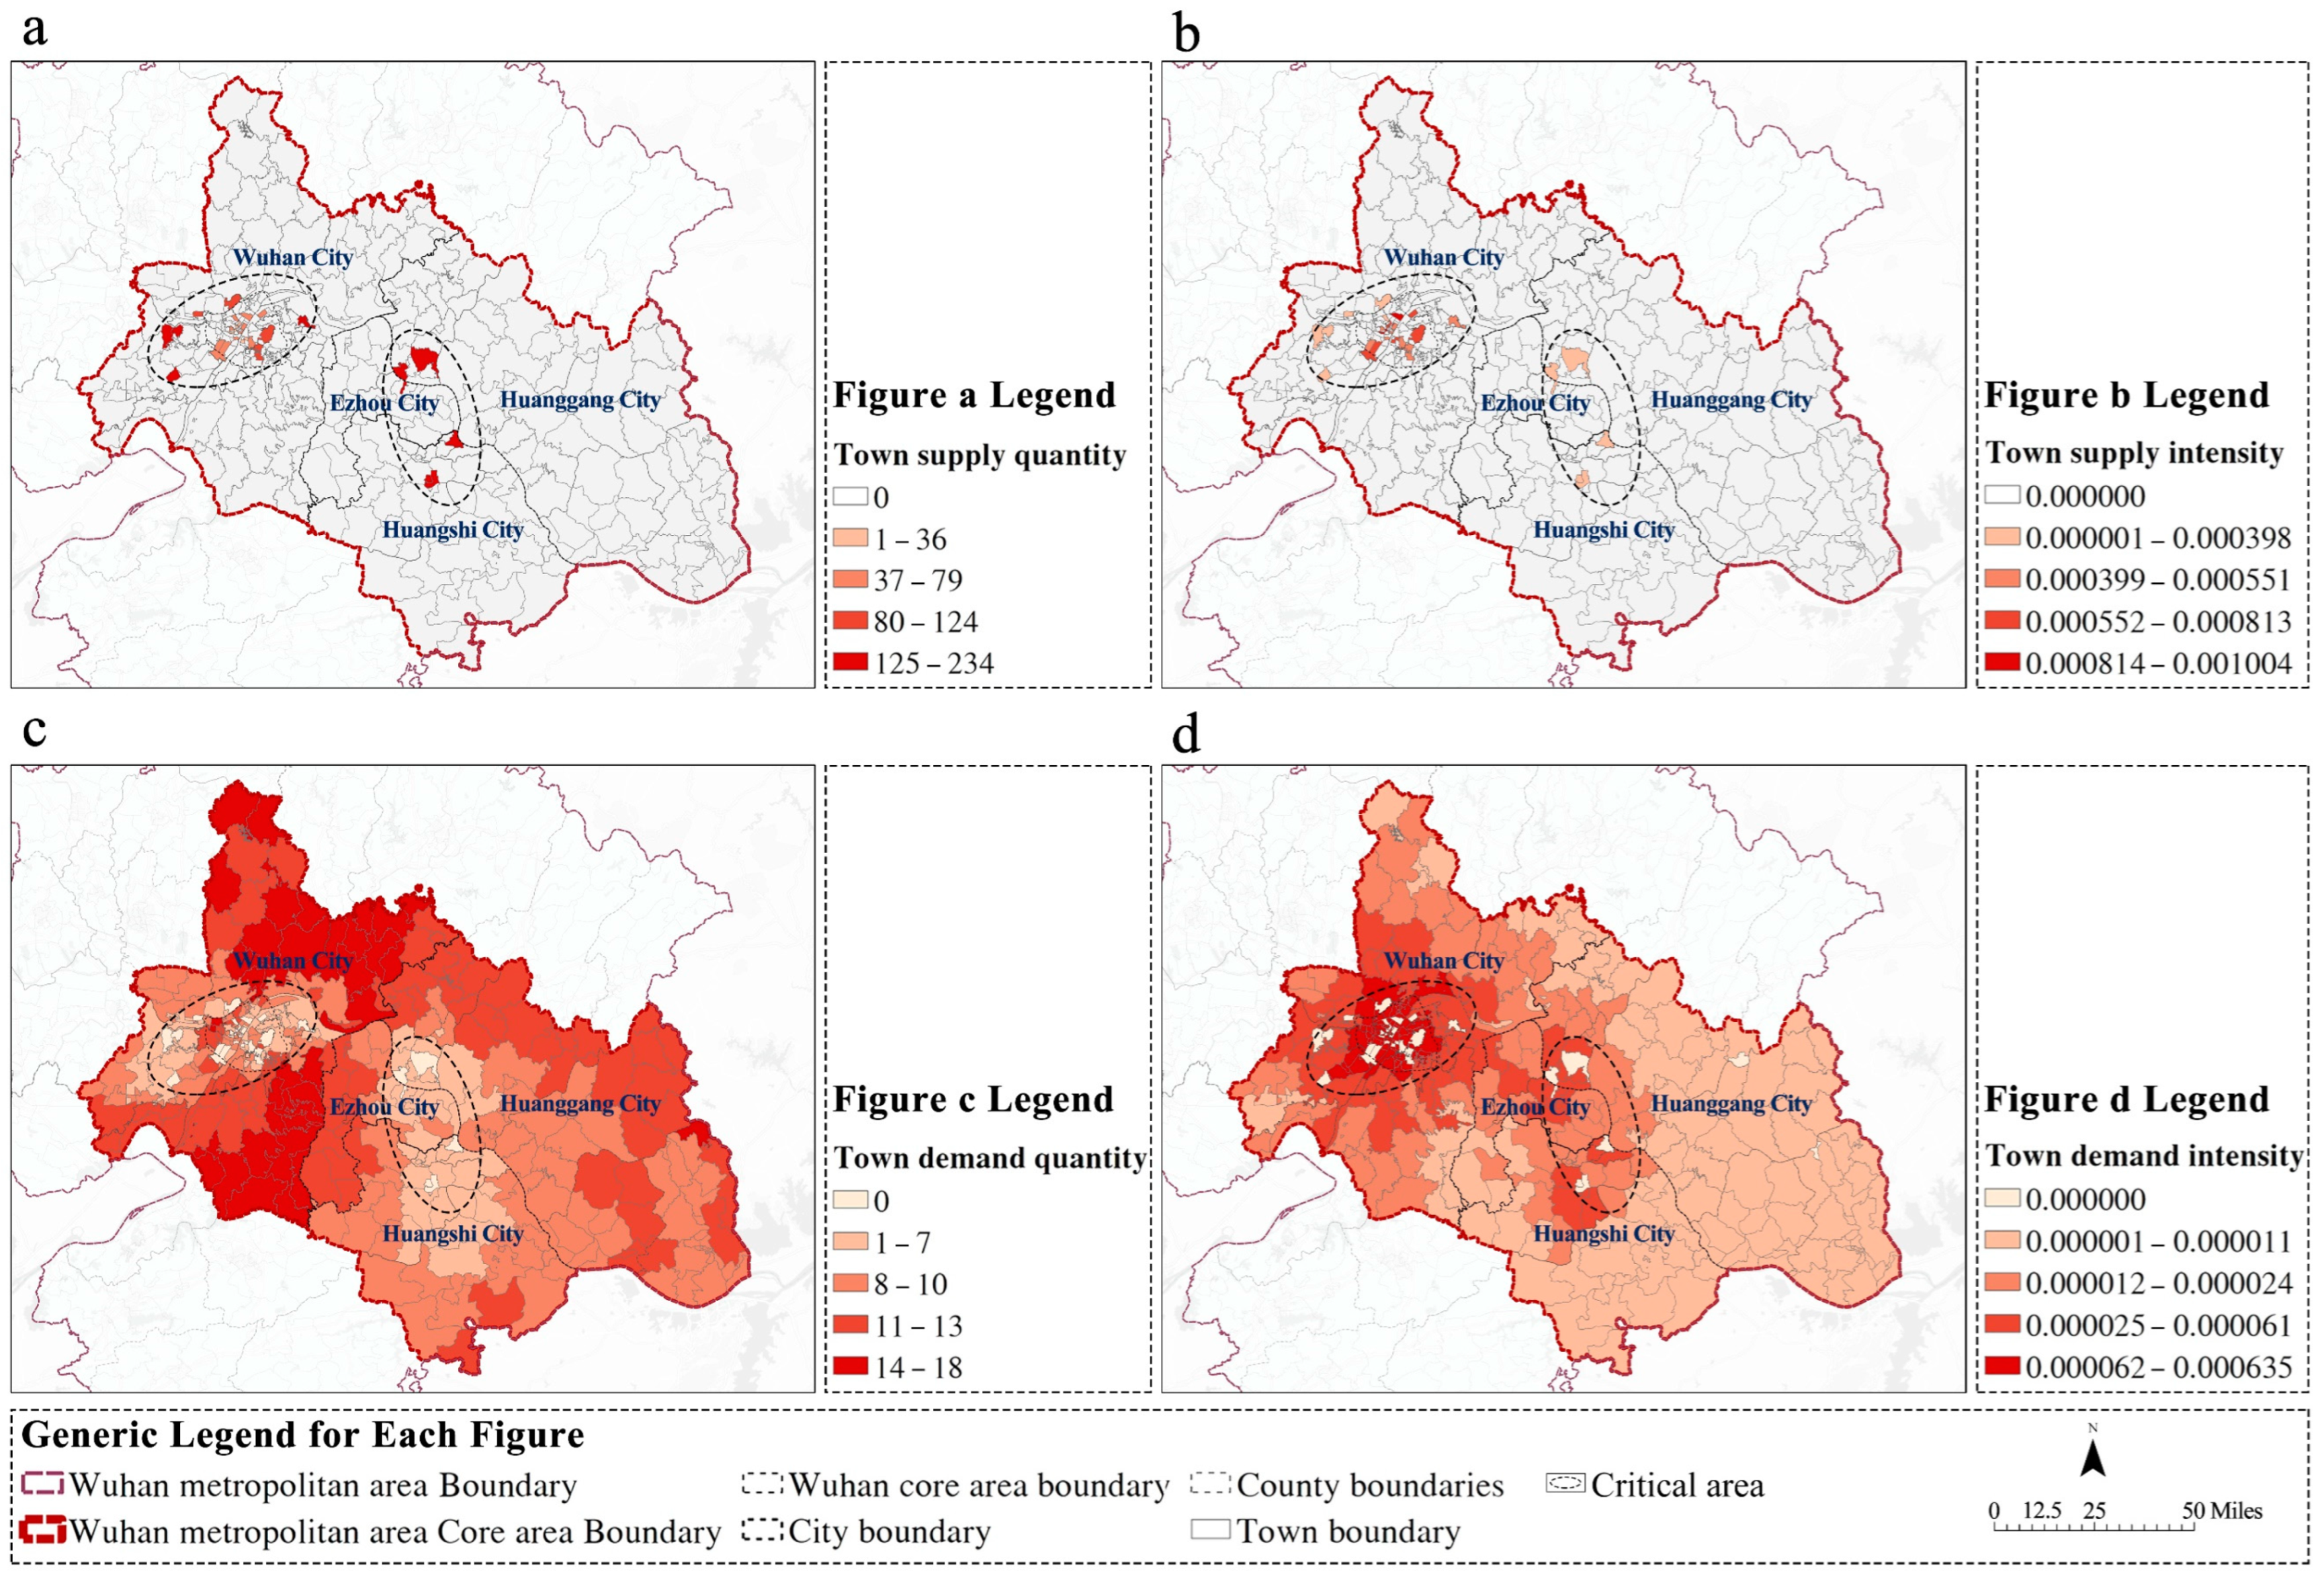
4.2. Network Node Supply and Demand Characteristics

This research delves into the node characteristics of towns within Wuhan’s Metropolitan Area’s supply and demand network, focusing on the ‘supply-type’ and ‘demand-type’ towns’ supply and demand scales and intensities, thereby elucidating the distinct features of regional medical supply and demand variations.
Mathematically, the supply and demand scales and intensities of ‘supply-type’ and ‘demand-type’ towns, as depicted in Figure 7a,b, exhibit a negative correlation. A lesser number of external supply and demand contacts correlates with greater intensity, affirming the concentration of high-intensity contacts in select areas and highlighting a regional imbalance in medical supply and demand. Notably, the correlation differs between the two town types. ‘Supply-type’ towns demonstrate a straightforward negative correlation between supply scale and intensity, whereas ‘demand-type’ towns show a more pronounced negative correlation. As the demand scale incrementally rises, the intensity index diminishes, indicating that high-quality medical resources in the region are predominantly accessed by a limited number of ‘demand-type’ towns. Additionally, towns with high supply intensity but low scale and those with low demand scale but high intensity predominantly belong to Wuhan, substantiating the self-sufficiency of Wuhan’s medical services.
Figure 8a,b detail the spatial distribution of supply scale and intensity for ‘supply-type’ towns located primarily in two key areas. In Wuhan, towns closer to the city center exhibit higher supply intensity but a smaller scale, signifying that Wuhan’s central area holds numerous high-quality medical resources that do not effectively radiate outward. Conversely, peripheral areas of Wuhan’s central district offer wider medical service radiation but with weaker connections. In the junction area of Ezhou, Huangshi, and Huanggang, ‘supply-type’ towns display a high supply scale, denoting their role in extending medical services to these cities’ vast hinterlands, albeit with minimal supply intensity, suggesting limited access to high-quality medical resources in these regions.
The spatial distribution of demand scale and intensity for ‘demand-type’ towns, as illustrated in Figure 8c,d, reveals a pattern where proximity to the two key areas correlates with lower demand scales but higher intensities. High-demand-intensity towns are predominantly situated within these key areas. This observation, coupled with earlier mathematical analyses, indicates that such towns not only cluster spatially but also exhibit significantly higher demand intensities than others. They benefit from their geographical proximity to ‘supply-type’ towns, tapping into abundant overflow medical services. Towns with higher demand scales but lower intensities are mainly situated around the extensive municipal administrative boundaries beyond these key areas, indicating that municipal peripheries tend to be underserved in medical services despite the centralization of resources in urban cores.

4.3. Community Supply and Demand Characteristics

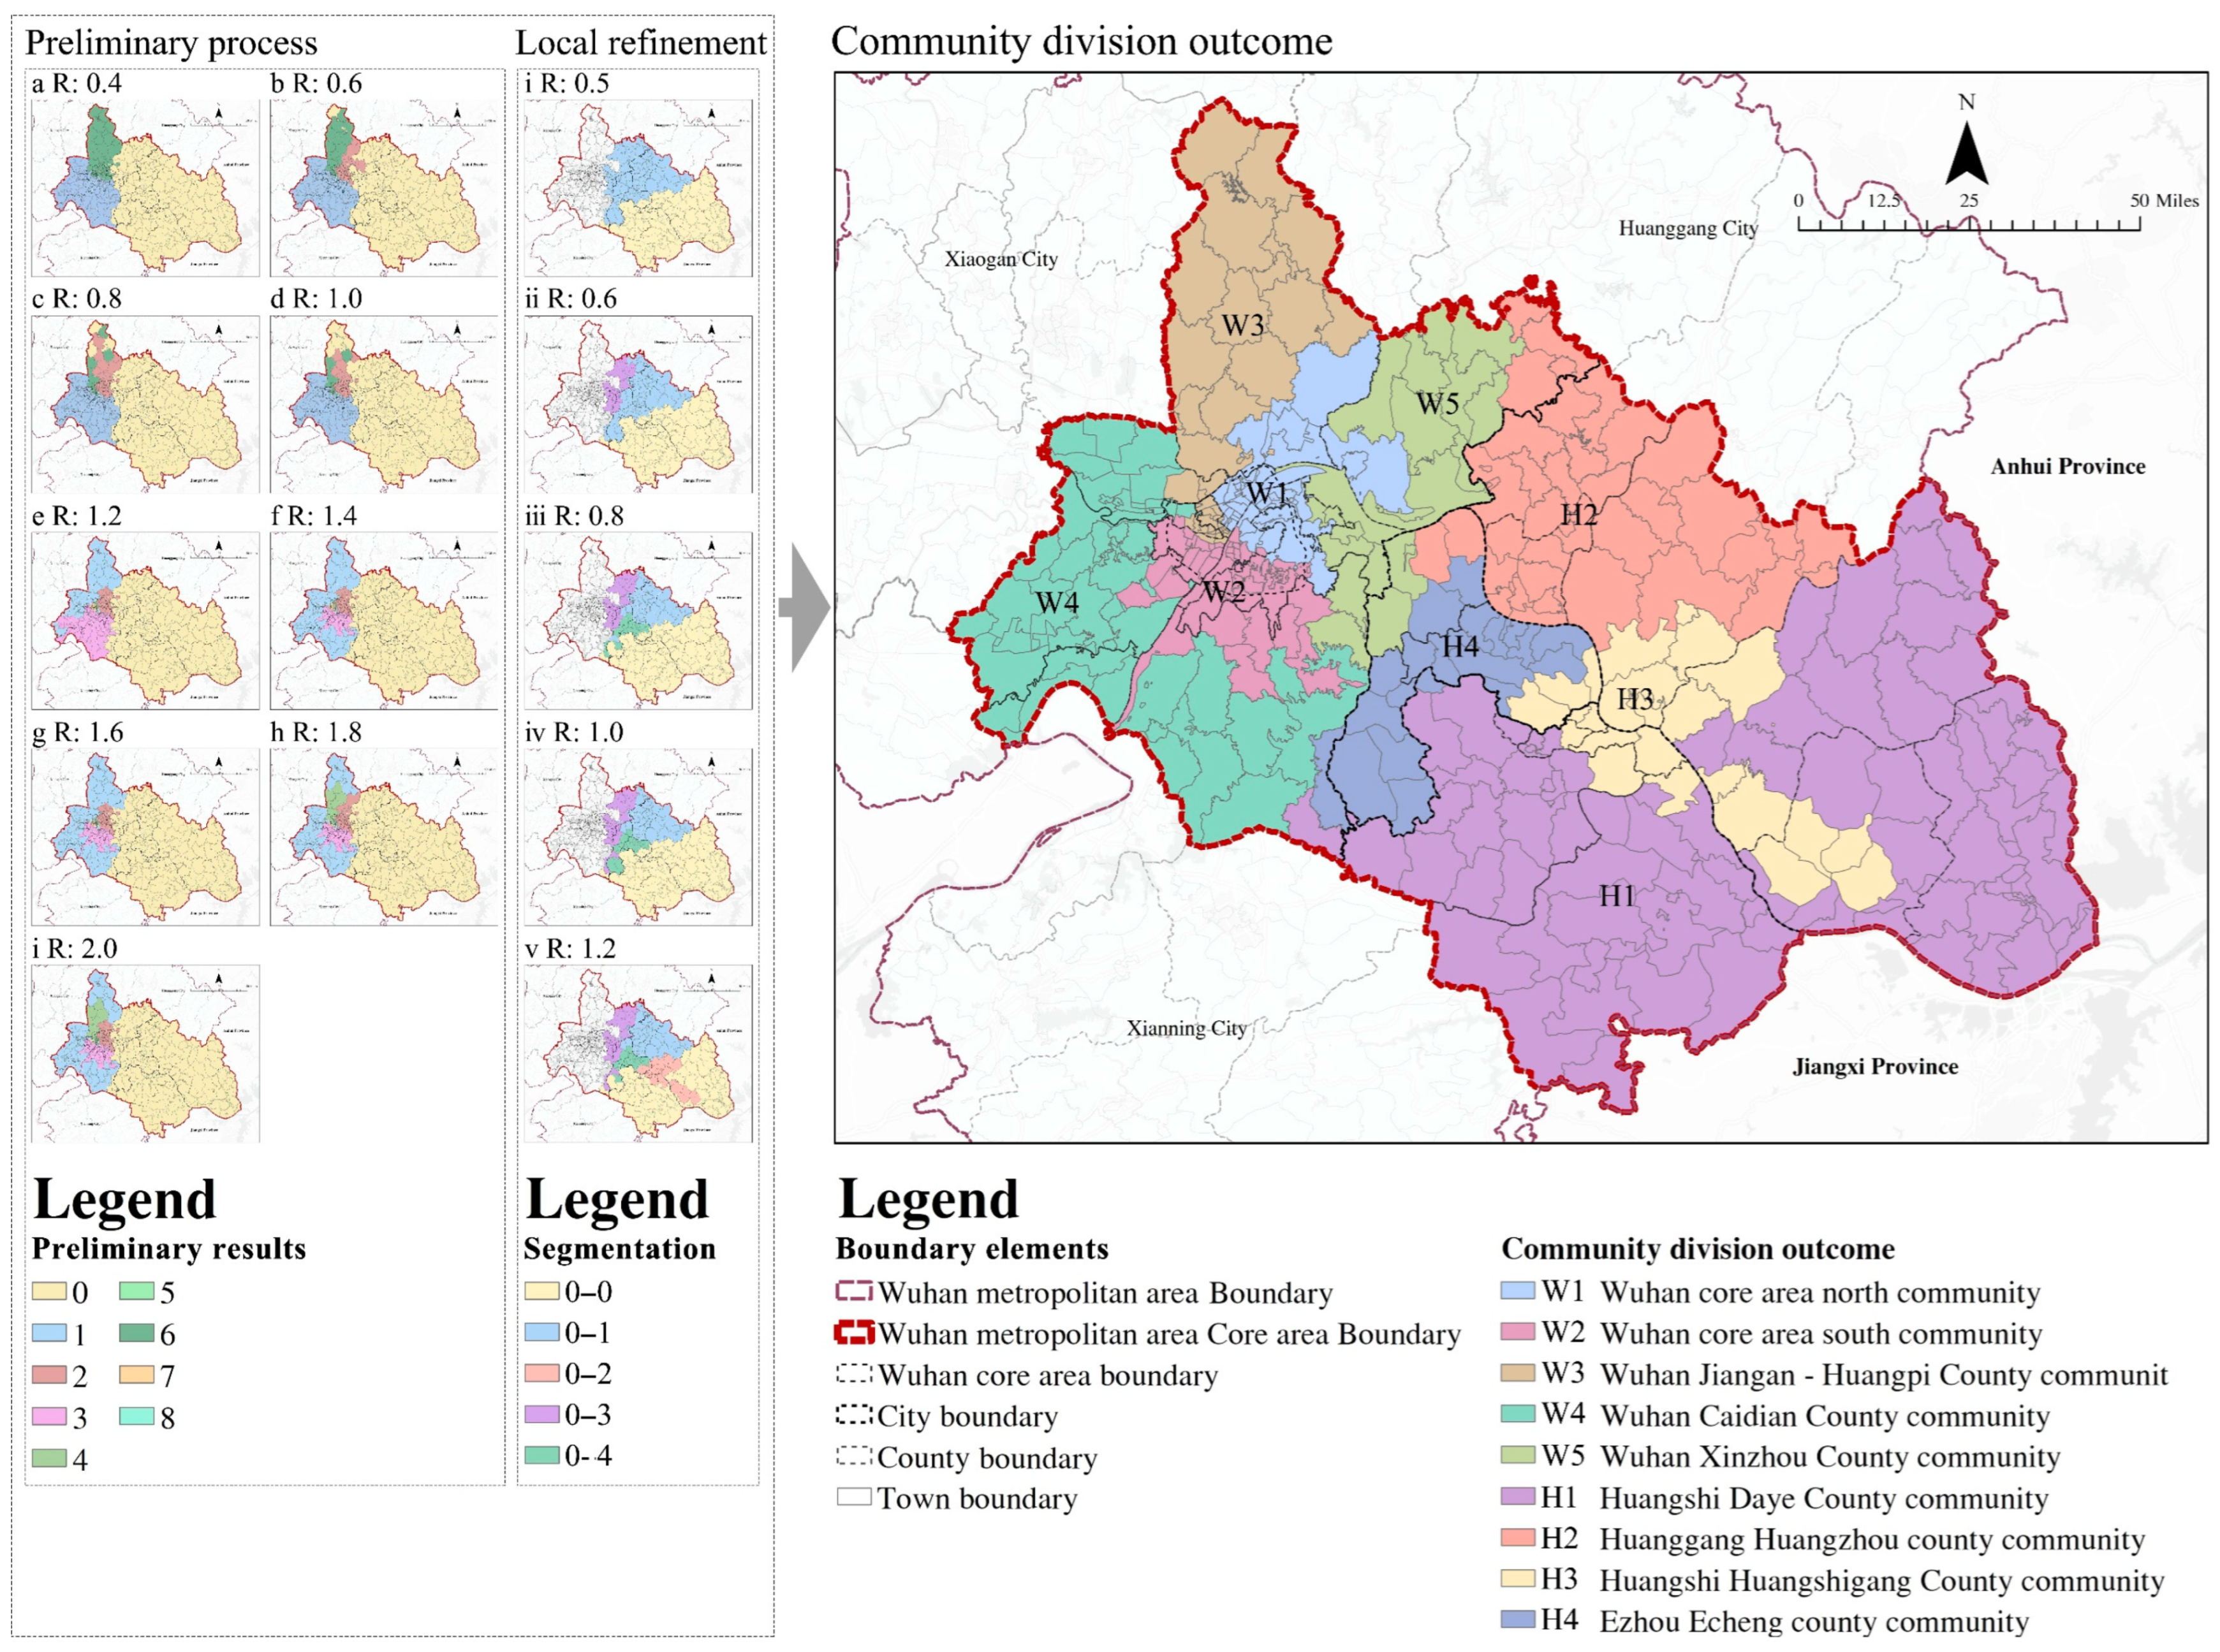
4.3.1. Division of Medical Service Communities

Figure 9 illustrates the process of delineating medical service communities, highlighting that the divisions demonstrate minimal restriction by municipal administrative boundaries and significant breakthroughs beyond district and county boundaries. Specifically, Wuhan City’s eastern municipal boundary aligns well with these divisions, yet notable discrepancies exist between various division boundaries and district or county lines. This suggests that administrative boundaries between cities present challenges, while intra-city districts and counties exhibit more cohesive medical service flows, effectively transcending their respective administrative confines.
This study delineates nine division outcomes within a resolution range of 0.4 to 2.0. The investigation revealed that the overall medical service zoning at various resolutions did not significantly differ, except for the continual zone refinement within Wuhan city. In every scenario, a ‘large area’ encompassing eastern Wuhan—Ezhou, Huanggang, and Huangshi—was uniformly designated as a single medical service zone. This classification underscores two primary insights: (1) The dense and intricate network of towns within Wuhan’s central urban area precludes the establishment of fixed communities, leading to fluctuating division outcomes, predominantly within this central area; (2) the interconnectivity among Ezhou, Huanggang, and Huangshi is more pronounced than their links with Wuhan. Their central areas have forged significant medical connections with their hinterlands, thereby amalgamating these cities into a single community, with divisions less influenced by Wuhan and exhibiting marked variations.
Considering the extensive spatial extent of the ‘large area’ zone, which amalgamates three cities outside Wuhan and is substantially larger than other zones, additional spatial division of this zone was undertaken to more thoroughly investigate the supply and demand disparities across zones. Employing a resolution range of 0.5 to 1.2, the study delineates five distinct division outcomes, each maintaining a Q value between 0.3 and 0.7, indicating the validity of these divisions.
Consequently, in line with the principle of community integration, these varied resolution-based divisions are amalgamated to establish nine coherent medical service communities.

4.3.2. Supply and Demand Characteristics of Communities

Table 3 demonstrates that, upon zoning, this study proceeds to compute various supply and demand indices, thereby highlighting discrepancies in medical service provision and utilization across the nine delineated communities. Significant disparities are observed in the index values among these communities. Both localization and sharing indices—indicative of patient flow ratios within communities—alongside inflow and outflow volumes, reflective of patient flow magnitude, effectively gauge patient reliance on medical services within and beyond these communities. Communities W1, W2, and W3 notably surpass others in index values, signifying their leadership in medical service recognition within the region. This is further evidenced by the substantial interzonal patient movement, underscoring the attractiveness of medical resources in these communities and the robust medical connections established among them.
Furthermore, the study employs ArcGIS10.6 software to spatially represent each community’s index outcomes, delving into the spatial patterns of supply and demand attributes, as depicted in Figure 10.
Both localization and sharing indices reveal analogous spatial gradients (Figure 10a,c). Communities W1, W2, and W3, encompassing segments of Wuhan’s central urban area, command high patient recognition, affirming the superior quality of medical resources in this region. The index outcomes across other communities exhibit minimal variation in localization and sharing indices yet display a gradual decrease in values radiating outward from the Ezhou, Huangshi, and Huanggang junction. Notably, communities W5 and H4, characterized by the lowest index values, form an elongated north–south corridor of diminished medical service recognition along the boundaries between Wuhan and the three cities. This demarcates the study area into distinct eastern and western sections, with the western part—anchored by Wuhan’s central urban area— receiving high medical service recognition, in contrast to the eastern segment, centered around the tri-city junction, which garners lower recognition.
Regarding inflow and outflow volumes, a pronounced west-high-east-low spatial trend emerges (Figure 10b,d). The western communities, especially W1, W2, and W3, exhibit significantly high patient circulation, attributable to the intense and frequent medical supply and demand interactions among towns in Wuhan’s vicinity. Conversely, the eastern communities display an inverse correlation, with low outflow but high inflow in the junction area and vice versa in adjacent areas. This pattern illustrates that the intersection area of Ezhou, Huangshi, and Huanggang—three cities—exerts a notable medical service appeal to adjacent districts. Nevertheless, the infrequency of patient exchanges among each city’s ‘key areas’ suggests that these areas, established due to the geographical closeness of the cities’ central urban regions, exhibit a marked segmentation in medical service sharing.

5. Discussion

5.1. Advanced Construction of Medical Supply and Demand Network

“Grounded in ‘People-centered’ theory, this paper develops a regional medical supply and demand network guided by the principle of ‘equal opportunity’. It aims to establish a fair planning framework, ensuring equal access to medical services for all, thereby providing theoretical underpinnings for the development of equitable public service policies. Conversely, studies that construct medical networks based on actual patient flows, driven by the aim of ‘equality of outcomes’, concentrate on addressing social inequalities to achieve fair outcomes. These studies, however, often encounter issues such as difficulty in data collection, data timeliness, and compromised study precision [5,6,8,9]. By comparison, the approach used in this study for building a regional medical supply and demand network and analyzing its characteristics demonstrates greater sophistication and advancement”.
Furthermore, this study meticulously considers the varying medical needs of different age groups within the same administrative region. Unlike previous research predominantly focused on specific age or gender groups, our approach provides a more holistic assessment of the correlation between regional medical resource allocation and the healthcare needs of the populace. This is instrumental in enhancing the overall regional health evaluation and the welfare of various age demographics.
Thirdly, this study uses towns as nodes to construct the network, enhancing research precision and facilitating an in-depth examination of patient supply and demand characteristics across administrative boundaries. While existing studies in China typically utilize counties as statistical units, leading to issues with data timeliness, our approach allows for a more nuanced analysis of medical supply and demand characteristics at the metropolitan level. The unique structure of metropolitan areas in China, linked by rapid transit networks and structured as ‘central city-county-town’, positions towns as crucial in measuring patient mobility.
Finally, this study conducts a comprehensive analysis encompassing both the perspective of the overarching metropolitan area network pattern and the nuanced characteristics of node supply and demand. The findings yield compelling insights. Notably, within the analysis of node supply and demand characteristics, the disparities in supply–demand intensity and coverage between the core city and other urban centers, as depicted in Figure 7, vividly illustrate the overarching regional supply–demand contradiction. This contradiction stems from the significant local residents’ concentration of a substantial quantity of high-quality medical resources in Wuhan, the central city of the metropolitan area. These conclusions, which are grounded in the analysis of supply and demand using towns as nodes, offer precise supplements to the examination of the broader metropolitan area pattern. They enable a more intricate assessment of substantial supply–demand variations among distinct regions, particularly on the demand side, thus addressing the considerable imbalance in resource accessibility for patients. These findings establish a dependable foundation for the refined management of medical resources within the metropolitan area.

5.2. Advanced Analysis of Community Supply and Demand Characteristics

This paper enhances the construction of a medical supply and demand network by conducting an in-depth analysis of regional medical supply and demand relationships through strategic medical zoning. The zoning outcomes, benefiting from the network’s advanced precision, represent a significant improvement over existing studies in the same field, both in the delineation of communities and in the detailed analysis of their characteristics.
The progress in communities’ division outcomes is most notable in the spatial morphology of the communities. While prevailing research on medical service zoning in Hubei Province primarily conforms to city or county administrative boundaries [9], this study, through improved research accuracy, captures the intricate zoning morphology shaped by transportation and geographical factors at a metropolitan level. This deviation from traditional methods, which often rely on county-level data, facilitates a more precise assessment of regional supply and demand variations, especially those influenced by commuting patterns.
Moreover, this study marks a significant progression in the analysis of zoning characteristics. Traditional zoning research typically adopts a goal-oriented approach, focusing on refining zoning models and parameters and using indices to validate zoning rationality [12,13,14,32]. In contrast, this study introduces a problem-oriented method in medical service zoning, concentrating on the unchanged state of medical interactions and delving into the inherent supply and demand imbalances as revealed by zoning indicators.
Furthermore, there is a convergence in research findings across various countries. Studies conducted in the United States and Europe often rely on more precise actual patient flow data and are oriented towards achieving ‘equitable outcomes’. They have undertaken a series of investigations that diverge from the ‘equitable opportunities’ focus of this paper. Nevertheless, their methods and metrics, including spatial pattern analysis and zone characteristic examination, share similarities with this study. All of these studies assert the crucial role of healthcare service zoning in shaping medical policies, surpassing the importance of administrative divisions. In the United States, pertinent research places heightened emphasis on the functional role of healthcare service zoning in policy development and optimization. They engage in comprehensive analyses of how various parameters and models influence zoning outcomes and underscore the necessity for rational medical service zoning [13]. Research in Turkey, with a European focus, aims to dissect the evolving traits of nationwide patient flow imbalances by identifying medical service communities. It reveals notable conflicts between demand-driven patient flow regions and government-established medical supply zoning. Consequently, demand-oriented zoning serves as a more logical foundation for policy making [33]. These findings collectively underscore the superiority of this paper’s analysis of supply–demand disparities based on the medical service community for the formulation of regional healthcare policies.

5.3. Discussion Summary

This paper introduces several key innovations: (1) Theoretical Innovation: It applies the ‘People-centered’ theory to provide a comprehensive explanation of patient medical-seeking behavior, offering a robust foundation for related research. The patient networks, spanning administrative regions and developed herein, are compelling and set the stage for future comparative studies with actual patient medical networks. (2) Scale Innovation: The research utilizes towns as fundamental units, facilitating precise measurement of patient supply and demand across municipal and county borders in metropolitan areas. (3) Methodological Advancement: The paper integrates the gravity model and location entropy method to construct medical supply and demand networks grounded in a thorough understanding of patient behavior patterns. It employs social network analysis and community detection methods to accurately evaluate supply and demand characteristics across nodes and communities, deeply exploring regional imbalances.
The United Nations Sustainable Development Goal (SDG3) underscores the aspiration to ensure healthy living and promote well-being universally by 2030, specifically addressing healthcare inequalities globally with an emphasis on developing countries and lagging regions. In China, particularly where medical supply and demand are at odds, it is vital to fully consider the rationale behind the medical behaviors of all residents. Focusing on metropolitan areas as key zones for optimizing healthcare equity and constructing a regional medical network guided by the principle of ‘equal opportunity’ to analyze the distinct characteristics of regional medical supply and demand discrepancies is of paramount importance for realizing sustainable health development goals.
In summary, the incorporation of the ‘Urban Man’ theory, along with enhanced research precision and a more sophisticated analytical framework, facilitates a comprehensive understanding of regional patient spatial mobility. It also aids in the intricate development of urban medical networks and a thorough examination of regional medical supply and demand dynamics. This approach significantly contributes to the enrichment of practical applications, real-world relevance, and theoretical understanding. The rational pursuit of high-quality medical resources, a principal factor influencing patient spatial movement, forms the cornerstone of reshaping the regional medical supply and demand landscape. Gaining an in-depth insight into patient medical treatment patterns and, based on this, analyzing regional medical service supply and demand relationships holds considerable practical importance. This approach is particularly relevant in contexts like China, where significant regional variances in medical resource allocation exist, and patient mobility across administrative regions reflects underlying supply and demand imbalances. The focus on metropolitan areas, crucial for urban integration in China, sheds light on the spatial dynamics of patient mobility at this scale, carrying significant practical implications. Additionally, the ‘People-centered’ theory enriches the theoretical basis for studying patient mobility networks and supply–demand patterns regionally. By leveraging extensive existing research in network construction and urban network analysis, this paper quantifies regional medical supply, demand, and spatial characteristics, providing a comprehensive dissection of regional supply–demand connections at the metropolitan level, and ultimately guiding the urbanization and equitable distribution of regional medical services, contributing to China’s progress towards sustainable development goals and addressing the health and well-being needs of all age groups within the region.
Nevertheless, this paper falls short in conducting thorough investigations into elucidating patient healthcare-seeking behavior, dissecting supply–demand mechanisms, and scrutinizing the configuration of medical service communities.
Regarding the explanation of patient healthcare-seeking behavior, this paper does not fully explore alternative healthcare-seeking patterns exhibited by certain patients, such as secondary destination shifts during cross-border healthcare-seeking, hospital waiting, negotiation processes, or other choices. Subsequent research endeavors should aim to refine the explanatory framework for patient healthcare-seeking behavior, thus providing more comprehensive support for related studies.
The exploration of supply and demand mechanisms primarily addresses medical service relationships within metropolitan areas. However, it does not extend to the impact of factors like medical insurance policies, hospital referral conditions, residents’ income levels, economic development, and spatial setting on regional medical supply and demand patterns. This is due to the theoretical and gravity model-based nature of the medical network constructed in this study, which produces results distinct from existing studies [9] utilizing actual patient networks. For instance, our findings highlight Wuhan’s significant role in regional medical supply and demand connections, reflecting its perceived status as a central resource hub. In contrast, actual patient flow networks show that Wuhan’s patient flow, in terms of volume, only marginally exceeds that of the Ezhou, Huangshi, and Huanggang tri-city junction, with minor differences in intensity. This suggests practical barriers to patient movement across municipal boundaries, particularly concerning the distribution of medical services from resource-intensive areas like Wuhan. Identifying these barriers is crucial for future research aimed at optimizing the spatial layout of regional medical facilities.
In terms of the morphology of medical service communities, this paper primarily concentrates on analyzing the supply–demand relationship characteristics among different communities without delving into the spatial morphology features of each individual zone. For instance, it does not explore the spatial inclusion relationship between the H3 community and the H1 community within the context of this paper. Nevertheless, the spatial distinctions among various zones can also serve as indicators of disparities in healthcare resource service models across different regions. This necessitates further research, incorporating factors like geographical spatial environment and commuting patterns in subsequent studies.

6. Conclusions

This study applies the ‘People-centered’ theory to examine the diverse healthcare needs of residents across different age groups within a single administrative region. By comprehensively understanding patients’ rational behavior in seeking healthcare, the study elucidates the trends of patient mobility across administrative borders. This insight aids in establishing a regional medical supply and demand network with a focus on metropolitan areas. It further identifies the relationship between the supply and demand of premium medical resources in the region. The objective is to facilitate the regional distribution of superior medical services, reduce disparities across areas, ensure residents’ health and well-being, and contribute to the welfare of people of all ages, ultimately supporting sustainable development goals.
The study’s key findings are: (1) Utilizing ‘People-centered’ theory, this research analyzes patients’ behavioral logic as urban residents. The resultant patient network across administrative regions, grounded in this theory, forms a basis for exploring the supply–demand relationship of high-quality medical resources regionally. (2) The central urban area of Wuhan, identified as the ‘key region’, predominantly impacts the western section of the study area. This region is notable for its exceptional medical resource allocation and significant self-sufficiency. While the medical influence of this area is considerable, it remains largely within Wuhan’s municipal limits. Furthermore, the medical services here are highly regarded by both local and non-local patients, leading to frequent exchanges of visits among patients in the region. (3) The tri-city junction of Ezhou, Huangshi, and Huanggang, another ‘key area’, influences the eastern part of the region. This area, in contrast with Wuhan, exhibits a notable shortfall in medical resource allocation, limiting its capacity to provide high-quality services to its vast hinterland. (4) Along Wuhan’s eastern municipal boundary lies a supply–demand valley in medical services, reflecting a lack of effective connections between the two major ‘key areas’ and impeding the efficient dissemination of Wuhan’s superior medical resources to the southeast. (5) The nine medical service communities defined in this article, which accurately represent the extent of medical services, display significant disparities between the southeast and northwest regions. These disparities are characterized by limited recognition of resources, restricted sharing of services, and constrained patient mobility. Urban planning should incorporate such functional zoning, which reflects the actual patient service areas, to facilitate the implementation of healthcare policies. This approach can effectively enhance equitable resource allocation among various communities and alleviate inter-regional disparities.
Following the conclusion analysis, this paper presents the following policy guidance and recommendations to optimize the healthcare service supply–demand relationship in the Wuhan metropolitan area: Local authorities are encouraged, as the first step, to facilitate the transfer of high-quality medical resources from Wuhan City to the emerging eastern cities of Wuhan. Subsequently, promoting collaborative healthcare efforts among various cities is advisable. This approach will expedite the dissemination of top-tier medical assets from Wuhan City to Ezhou, Huangshi, and Huanggang. By harnessing the potential of these three cities, a healthcare service corridor extending eastward from Wuhan City can be established. Priority should be given to bolstering the allocation of high-quality medical resources within Ezhou, Huangshi, and Huanggang. Simultaneously, reinforcing the medical outreach capabilities of these three cities to remote regions is essential. The significance of medical service communities in the allocation and management of medical resources should be underscored. Administrative boundaries need to be made more flexible, encouraging local authorities to engage in healthcare collaboration. Special emphasis should be placed on optimizing resource allocation within the healthcare service communities in the southeastern segment of the study area to promote equitable resource distribution.

Author Contributions

Conceptualization, F.G. and W.W.; Methodology, F.G. and W.W.; Software, F.G. and W.W.; Validation, M.H. and B.X.; Formal Analysis, F.G. and W.W.; Investigation, F.G., W.W., B.X. and M.H.; Resources, W.W.; Data Curation, F.G.; Writing—Original Draft Preparation, F.G.; Writing—Review and Editing, F.G. and W.W.; Visualization, F.G., B.X. and M.H.; Supervision, W.W.; Project Administration, W.W.; Funding Acquisition, W.W. All authors have read and agreed to the published version of the manuscript.

Funding

This research received no external funding.

Data Availability Statement

Publicly available datasets were analyzed in this study. The Worldpop population age structure grid data can be found here: [https://www.worldpop.org/datacatalog/ accessed on 1 August 2023]. Hospital attribute data can be located at: [http://wjw.hubei.gov.cn/bsfw/bmcxfw/snyljgcx/ accessed on 1 August 2023].

Conflicts of Interest

The authors declare no conflicts of interest.

References

  1. Yu, M.; He, S.; Wu, D.; Zhu, H.; Webster, C. Examining the Multi-Scalar Unevenness of High-Quality Healthcare Resources Distribution in China. Int. J. Environ. Res. Public Health 2019, 16, 2813. [Google Scholar] [CrossRef] [PubMed]
  2. Yip, W.; Fu, H.; Chen, A.T.; Zhai, T.; Jian, W.; Xu, R.; Pan, J.; Hu, M.; Zhou, Z.; Chen, Q.; et al. 10 Years of Health-Care Reform in China: Progress and Gaps in Universal Health Coverage. Lancet 2019, 394, 1192–1204. [Google Scholar] [CrossRef] [PubMed]
  3. Chen, Y.; Wu, J. The Effect of the Referral System on the Accessibility of Healthcare Services: A Case Study of the Wuhan Metropolitan Development Zone. Int. J. Environ. Res. Public Health 2022, 19, 10441. [Google Scholar] [CrossRef] [PubMed]
  4. Li, X.; Lu, J.; Hu, S.; Cheng, K.; De Maeseneer, J.; Meng, Q.; Mossialos, E.; Xu, D.R.; Yip, W.; Zhang, H.; et al. The Primary Health-Care System in China. Lancet 2017, 390, 2584–2594. [Google Scholar] [CrossRef] [PubMed]
  5. Ding, J.; Yang, C.; Wang, Y.; Li, P.; Wang, F.; Kang, Y.; Wang, H.; Liang, Z.; Zhang, J.; Han, P.; et al. Influential Factors of Intercity Patient Mobility and Its Network Structure in China. Cities 2023, 132, 103975. [Google Scholar] [CrossRef]
  6. Yan, X.; Shan, L.; He, S.; Zhang, J. Cross-City Patient Mobility and Healthcare Equity and Efficiency: Evidence from Hefei, China. Travel Behav. Soc. 2022, 28, 1–12. [Google Scholar] [CrossRef]
  7. Zhang, Y.; Zhao, M. Spatial Delineation, Characteristics Analysis, and Classification of China’s Metropolitan Regions. Urban Plan. Forum 2023, 67, 67–76. [Google Scholar] [CrossRef]
  8. Fu, L.; Xu, K.; Liu, F.; Liang, L.; Wang, Z. Regional Disparity and Patients Mobility: Benefits and Spillover Effects of the Spatial Network Structure of the Health Services in China. Int. J. Environ. Res. Public Health 2021, 18, 1096. [Google Scholar] [CrossRef]
  9. Tao, Z.; Cheng, Y.; Bai, L.; Feng, L.; Wang, S. Planning Hierarchical Hospital Service Areas for Maternal Care Using a Network Optimization Approach: A Case Study in Hubei, China. J. Geogr. Sci. 2022, 32, 2577–2598. [Google Scholar] [CrossRef]
  10. Jia, P.; Xierali, I.M.; Fahui, W. Evaluating and Re-Demarcating the Hospital Service Areas in Florida. Appl. Geogr. 2015, 60, 248–253. [Google Scholar] [CrossRef]
  11. Hu, Y.; Wang, F.; Xierali, I.M. Automated Delineation of Hospital Service Areas and Hospital Referral Regions by Modularity Optimization. Health Serv. Res. 2018, 53, 236–255. [Google Scholar] [CrossRef]
  12. Wang, F.; Wang, C.; Hu, Y.; Weiss, J.; Alford-Teaster, J.; Onega, T. Automated Delineation of Cancer Service Areas in Northeast Region of the United States: A Network Optimization Approach. Spat. Spatio-Temporal Epidemiol. 2020, 33, 100338. [Google Scholar] [CrossRef]
  13. Wang, C.; Wang, F.; Onega, T. Network Optimization Approach to Delineating Health Care Service Areas: Spatially Constrained Louvain and Leiden Algorithms. Trans. GIS 2021, 25, 1065–1081. [Google Scholar] [CrossRef] [PubMed]
  14. Haynes, A.G.; Wertli, M.M.; Aujesky, D. Automated Delineation of Hospital Service Areas as a New Tool for Health Care Planning. Health Serv. Res. 2020, 55, 469–475. [Google Scholar] [CrossRef] [PubMed]
  15. Xing, J.; Ng, S.T. Analyzing Spatiotemporal Accessibility Patterns to Tertiary Healthcare Services by Integrating Total Travel Cost into an Improved E3SFCA Method in Changsha, China. Cities 2022, 122, 103541. [Google Scholar] [CrossRef]
  16. Krügel, F.; Mäs, S. A Web-Application for Measuring Spatial Accessibility in Health Planning. AGILE GIScience Ser. 2023, 4, 1–11. [Google Scholar] [CrossRef]
  17. Thompson, C.A.; Saxberg, K.; Lega, J.; Tong, D.; Brown, H.E. A Cumulative Gravity Model for Inter-Urban Spatial Interaction at Different Scales. J. Transp. Geogr. 2019, 79, 102461. [Google Scholar] [CrossRef]
  18. Smith, D.; Timberlake, M. Conceptualizing and Mapping the Structure of the World Systems City System. Urban Stud. 1995, 32, 287–302. [Google Scholar] [CrossRef]
  19. Zhang, L.; Marzuki, A.; Liao, Z.; Zhao, K.; Huang, Z.; Chen, W. Spatial and Temporal Evolution of Guangdong Tourism Economic Network Structure from the Perspective of Social Networks. Heliyon 2023, 9, e18570. [Google Scholar] [CrossRef]
  20. Zhang, W.; Zhao, P.; Niu, C.; Thill, J.-C.; Zhu, J. City Networks and Clusters as Expressed in Chinese and Japanese Languages: A Multiscale Network Analysis with Language-Sensitive Webpage Big Data. Cities 2023, 141, 104502. [Google Scholar] [CrossRef]
  21. Sun, Y.; Shao, Y.; Chan, E.H.W. Co-Visitation Network in Tourism-Driven Peri-Urban Area Based on Social Media Analytics: A Case Study in Shenzhen, China. Landsc. Urban Plan. 2020, 204, 103934. [Google Scholar] [CrossRef]
  22. Huang, Y.; Hong, T.; Ma, T. Urban Network Externalities, Agglomeration Economies and Urban Economic Growth. Cities 2020, 107, 102882. [Google Scholar] [CrossRef]
  23. Yang, H.; Du, D.; Wang, J.; Wang, X.; Zhang, F. Reshaping China’s Urban Networks and Their Determinants: High-Speed Rail vs. Air Networks. Transp. Policy 2023, 143, 83–92. [Google Scholar] [CrossRef]
  24. Hong, M.; Wei, W.; Yin, L.; Xia, J. Exploring the Mechanism of the Impact of Basic Public Service Facilities on Residents’ Satisfaction: Based on the “Homo-Urbanicus” Theory. Hum. Geogr. 2023, 38, 107–117. [Google Scholar] [CrossRef]
  25. Wei, W.; Tao, Y.; Yang, H. Satisfaction Improvement on Layout of Primary Schools in Central Area of Big City. Planners 2020, 36, 13–18. [Google Scholar] [CrossRef]
  26. Wei, W.; Ke, Z. Analysis of Supply and Demand Matching and Planning Methods of Community Logistics Points from the Perspective of “Homo Urbanicus”: A Case Study of Wuhan City. Mod. Urban Res. 2020, 38, 8–17. [Google Scholar] [CrossRef]
  27. Wan, Y.; Tan, X.; Shu, H. Finding and Evaluating Community Structures in Spatial Networks. ISPRS Int. J. Geo.-Inf. 2023, 12, 187. [Google Scholar] [CrossRef]
  28. Reyes, V.; Suárez, M. Firm Survival and Location Preference: Evidence from Mexico City. Heliyon 2022, 8, e09219. [Google Scholar] [CrossRef] [PubMed]
  29. Gan, C.; Voda, M.; Wang, K.; Chen, L.; Ye, J. Spatial Network Structure of the Tourism Economy in Urban Agglomeration: A Social Network Analysis. J. Hosp. Tour. Manag. 2021, 47, 124–133. [Google Scholar] [CrossRef]
  30. Han, M.; He, D.; Gao, P. Boundary Effect and Multi-Dimensional Mechanism of Inter-City Producer Services Network in Yangtze River Economic Belt. Econ. Geogr. 2021, 41, 126–135. [Google Scholar] [CrossRef]
  31. Klauss, G.; Staub, L.; Widmer, M.; Busato, A. Hospital Service Areas—A New Tool for Health Care Planning in Switzerland. BMC Health Serv. Res. 2005, 5, 33. [Google Scholar] [CrossRef] [PubMed]
  32. Bai, L.; Tao, Z.; Cheng, Y.; Feng, L.; Wang, S. Delineating Hierarchical Obstetric Hospital Service Areas Using the Huff Model Based on Medical Records. Appl. Geogr. 2023, 153, 102903. [Google Scholar] [CrossRef]
  33. Koylu, C.; Delil, S.; Guo, D.; Celik, R.N. Analysis of Big Patient Mobility Data for Identifying Medical Regions, Spatio-Temporal Characteristics and Care Demands of Patients on the Move. Int. J. Health Geogr. 2018, 17, 32. [Google Scholar] [CrossRef] [PubMed]
Figure 1. The comprehensive framework for analyzing the characteristics of regional medical supply and demand networks.
Land 13 00142 g001
Figure 2. Patient motivation judgment.
Land 13 00142 g002
Figure 3. Study area and factor distribution.
Land 13 00142 g003
Figure 4. Construction method of supply and demand network.
Land 13 00142 g004
Figure 5. Analysis method of supply and demand characteristics.
Land 13 00142 g005
Figure 6. Correlation characteristics of regional medical supply and demand network: (a) spatial layout of hierarchical medical linkages; (b) differences in the strength of medical associations by classification; (c) differences in the number of medical contacts by classification.
Land 13 00142 g006
Figure 7. Node supply and demand characteristics analysis: (a) the correlation between the quantity of supply and the intensity of “supply-type” node; (b) the correlation between demand quantity and intensity of “demand-type” node.
Land 13 00142 g007
Figure 8. Spatial distribution of node supply and demand characteristics: (a) supply quantity spatial layout of “supply-type” node; (b) spatial distribution of supply intensity of “supply-type” nodes; (c) spatial layout of demand quantity of “demand-type” nodes; (d) spatial distribution of demand intensity of “demand-type” nodes.
Land 13 00142 g008
Figure 9. Medical service community division process and results, where ‘Resolution’ is abbreviated as ‘R’.
Land 13 00142 g009
Figure 10. Spatial layout of community medical supply and demand indicators: (a) localization index spatial layout of each community; (b) spatial layout of outflow index in each community; (c) spatial distribution of community sharing index; (d) spatial layout of the inflow index of each community.
Land 13 00142 g010
Table 1. Social network analysis methods and related indicators.
Index Name‘Supply-Type’ Town‘Demand-Type’ Town
Town connection quantityThe number of ‘demand-type’ towns radiated by medical services reflects the sharing scope of medical services in the townThe number of ‘supply-type’ towns providing medical services reflects the number of cross-border medical destinations in the town
Town connection intensityThe sum of the intensity of external medical services reflects the level of medical resource allocation in the townThe sum of the strength of the medical supply and demand connection established externally reflects the difficulty of the town’s patients in obtaining medical services
Intensity of medical contactIntensity of supply and demand connection between two types of towns
Table 2. Community supply and demand characteristics and analysis of related indicators.
Index NameCalculation FormulaIndex InterpretationRemark
Localization index L I i = A A   +   B Proportion of patients in Community i who have cross-border medical treatment within the community A is the sum of the flow of patients in the community, that is, the sum of the supply and demand connection intensity among all towns in the community
Sharing index S I i = C A   +   C The proportion of non-local residents who go to Community i out of all people who go to community i for medical treatment
Inflow flow I F i The quantity of patients from the remaining communities who went to Community i for medical care-
Outflow flow O F i The quantity of patients within Community i who went to other communities for medical treatment
Table 3. Community medical supply and demand indicators.
Community CodeLISIIFOF
W10.8100.7920.9390.841
W20.7890.7611.0130.864
W30.6950.7091.2501.331
W40.5680.5970.4980.561
W50.3760.3810.2800.285
H10.4460.5860.1820.320
H20.5920.5350.2780.221
H30.4940.4690.1860.168
H40.4110.4500.1970.231
Disclaimer/Publisher’s Note: The statements, opinions and data contained in all publications are solely those of the individual author(s) and contributor(s) and not of MDPI and/or the editor(s). MDPI and/or the editor(s) disclaim responsibility for any injury to people or property resulting from any ideas, methods, instructions or products referred to in the content.

