
Urban Disparities in Energy Performance Premium Prices: Towards an Unjust Transition?


1
Department of Architecture and Art, Università Iuav di Venezia, 30135 Venice, Italy
2
Department of Civil, Environmental Engineering and Architecture, University of Cagliari, 09123 Cagliari, Italy
3
Department of Management Engineering, University of Padua, 36100 Vicenza, Italy
*
Author to whom correspondence should be addressed.
Land 2024, 13(2), 224; https://doi.org/10.3390/land13020224
Submission received: 12 January 2024
/
Revised: 6 February 2024
/
Accepted: 8 February 2024
/
Published: 11 February 2024
(This article belongs to the Special Issue Urbanization and Land Use Planning for Achieving the Sustainable Development Goals (SDGs))
Abstract
:In recent years, numerous studies have explored how energy and environmental performance impact property values. Superior energy efficiency is the basis for value disparities in real estate markets. However, measurements of these variations vary significantly. This research aims to investigate the relationship between market size and vitality and market value differences. This has significant implications for the nature of the energy transition, potentially determining fairness or inequality. The study considers the real estate market in six Italian cities: three metropolitan (Milan, Turin, and Florence) and three medium-sized cities (Padua, Mestre, and Bergamo). The sample includes 2935 properties. In metropolitan cities, hedonic pricing models confirm the relevance of energy performance in market value formation, highlighting a potential depreciation in property values by up to 30% between properties belonging to the highest energy class (A) compared to the lowest (G), and 14% between class D and G. Such premium gaps are halved in medium-sized cities. Conclusions foresee a scenario of socially and economically unjust transition that must be considered in policies aimed at improving the energy efficiency of existing buildings, with a specific concern for the nature and characteristics of the real estate markets involved.
1. Introduction
Climate change and the energy transition constitute two of the most relevant challenges that the international community must address in the 21st century. Real estate in Europe represents 40% of total energy consumption from fossil fuels and is responsible for 36% of greenhouse gas emissions [1]. Its transformation is an indispensable part of a broader set of actions leading to the practical implementation of policies for city decarbonization [2]. Energy transition in real estate aims to achieve the goal of net-zero emissions by 2050, as established by the European Green Deal, through simultaneous reductions in consumption coupled with the production of energy from renewable sources [3,4].
The transition to an energy-efficient building stock is not only a cost but also an opportunity [5,6]. When a building’s operating costs for heating and cooling are reduced and appropriately capitalized, the market records this shift in value [7,8,9]. Additionally, there is the prospect of increasing restrictions on the sale and lease of properties with modest energy efficiency due to more stringent regulatory constraints adopted by the EU. The increased value of more energy-efficient properties at the expense of less-performing ones represents the consistent outcome of this evolution [10].
A large number of studies empirically confirm the presence of a price variation for more sustainable real estate in terms of energy efficiency (Energy Performance Certificate classification) [11,12,13,14,15,16,17,18,19,20,21,22]. The Energy Performance Certificate (EPC) is a standardized classification system introduced by the European Union to categorize buildings based on their energy performance, measured in kilowatt-hours per square meter required for heating or cooling the property. Currently, there are 10 energy efficiency classes ranging from G (the least efficient with an EPgl > 3.50) to A (the most efficient with EPgl < 0.4). EPgl stands for energy performance global.
However, while the existence of price differences according to energy performance is suggested, the extent of these differences is less clear. The percentages that separate the value of inefficient properties from more efficient ones vary significantly, and the literature has only partially considered the reasons for such differentiation.
Some authors [9] hypothesize that the value difference is lower in major urban markets, characterized by extensive demand and greater vitality. The larger and more vibrant the market, the less pronounced the value difference between more and less energy-efficient properties. Supporting this hypothesis, Addae-Dapaah and Wilkinson [23] highlight smaller value differences in the tertiary market in areas of maximum demand concentration compared to peripheral areas. Similarly, Taruttis and Weber [24] argue that different market conditions correspond to different gradients of appreciation for the energy characteristics of properties. The locational aspect of the considered real estate portfolio seems to be a central element of this reasoning. In large cities, the price premium associated with energy efficiency is lower than in medium-sized cities.
The purpose of this research is to delve into the factors contributing to the valorisation of energy characteristics. The study specifically aims to examine two relationships: first, the one between the value of properties and their energy efficiency, and second, the relationship between any recorded differences and the relevance and vitality of their respective urban markets.
The specific geographic and economic context of this research focuses on the housing markets of six cities located in the northern and central regions of Italy. Three of these cities have the status of major metropolitan centres: Milan, Turin, and Florence, while the other three—Padua, Mestre, and Bergamo—are medium-sized cities. The verification of such a hypothesis has significant implications for the nature of the transition. Cities with less attractiveness and, consequently, less vibrant real estate markets may find themselves with significantly devalued assets. Conversely, highly attractive cities, already benefiting from a lively and sustained market, may experience a contained depreciation of less efficient properties. The transition would thus highlight a significant disparity in impact [25].
Some studies have already indicated how the economic burden of the green transition focuses on areas that are already economically fragile in comparison to cities with a robust economic base, with a simultaneous rise in social inequalities [26,27]. The disparate effects on real estate may exacerbate an already problematic and challenging path to a just transition [28,29].
This paper is structured into four sections. The first considers the main theoretical and empirical references on the topic. The second illustrates the adopted methodology and the information sources used. The third section presents the models for the investigated cities, while the fourth section deals with the discussion and interpretation of the results obtained.
2. Background
This research aims to measure the value gap between properties with different levels of energy efficiency and to delve into the reasons for this value gap based on the rank and vitality of the considered real estate markets. This latter aspect is crucial when considering the nature of the energy and environmental transition. The achievement of a just transition may be hampered by a differentiation in real estate values based on energy performance that proves to be a function of city rank.
Energy-efficient properties distinguish themselves with a cost advantage over less efficient ones due to operational costs, which, when capitalized, result in a market-recognized premium price. Aydin et al. [7] and Eichholtz et al. [8] argue that demand appreciates superior sustainability, translating future savings from higher energy performance into a recognizable price advantage.
A second theoretical consideration complements this initial perspective. Regulators have imposed increasing constraints on real estate in terms of energy and environmental performance. Such regulations could render a property difficult or impossible to sell or lease, leading to a consequent loss in value. Therefore, the market should assign a higher value to properties free from any forms of rental or sale limitations compared to properties that otherwise may be subject to such circumstances.
The European Union has been active in this regard for years. In March 2023, the proposal for a directive on energy performance in buildings was approved [30], mandating zero emissions for all new buildings from 2028 onward, while existing buildings must reach energy class E of the EPC scale by 2030 and class D by 2033.
These two elements contribute to establishing market differentiation among properties characterized by different energy levels. Empirical investigations conducted nationally and internationally confirm the hypothesis that the market recognizes and appreciates energy performance as a fundamental component of value.
Fuerst et al. [16], Copiello et al. [31], and Zhang et al. [32] have reviewed the most significant research findings on the premium price associated with energy performance, with a focus on the residential market. Although exceptions exist [33], almost all studies highlight positive marginal prices associated with housing’s energy savings.
Sensitivity to these issues is particularly apparent in northern European countries. Brounen and Kok [11] conducted one of the first studies targeting the value differentiation between properties with varying degrees of efficiency in the Netherlands. Jensen et al. [13] studied the effects of EPC classification in the residential segment of the Danish market, highlighting the positive effect of energy efficiency on property values. Other research has narrowed the investigation to specific cities. Fuerst et al. [16] examined the real estate market in Helsinki, revealing a 3.5% premium price for buildings with higher energy efficiency (A, B, and C classes) compared to class D properties.
Fuerst et al. [14,15] and the Bio Intelligence Service report [34] have highlighted a similar trend for the English market. Hyland et al. [12] recorded positive differences in energy-efficient properties in the Irish market.
In recent years, research has considered markets in the Mediterranean region with additional confirmations of the outlined hypothesis. In Spain, De Ayala et al. [17] measured the effect of energy efficiency on housing prices. A study limited to the city of Barcelona revealed a premium price for apartments that are maximally efficient in terms of energy (class A) compared to those classified as non-efficient (class G) [18].
In Italy, research highlights a demand increase for properties with superior energy performance. Studies have covered various cities, including Turin [35], Bari [19,36], Bolzano [19,20], Reggio Calabria [37,38], and others in Northern Italy [39]. A recent nationwide study conducted by the Banca d’Italia [40] recorded an increase of over 25% in prices for energy-efficient homes compared to those with lower energy performance.
There is ample consensus on the presence of a positive value gap between energy-efficient properties and more energy-intensive ones. EPC classes are now predictors of statistically significant value gaps. However, there is much less convergence in research regarding the magnitude of these value gaps, which vary considerably between the territories and cities examined. The value gap is always positive with increasing energy efficiency, but the magnitude of value gaps, as reported in Table 1 and Table 2, varies considerably from a few percentage points to just under half of the property value.
Therefore, it is crucial to consider the underlying reasons for such differentiation. Eichholtz et al. [9], Addae-Dapaah and Wilkinson [23], and Taruttis and Weber have all proposed an important research perspective [24]. This perspective establishes an inverse relationship between the magnitude of the value gap and the size and vitality of real estate markets. Large cities with significant real estate markets should experience less impact from the growing value associated with superior energy efficiency, while small cities with weak market vitality should exhibit more pronounced and significant gaps. Therefore, a lower value gap is expected in larger and more important urban markets.
The relevance of the gap proves decisive in assessing the impact of the energy transition on the wealth of Italian families, whose wealth is significantly tied to owned homes [40,41,42]. Furthermore, verifying such a hypothesis has consequences for the very nature of the energy transition. Just consideration can be given to the when it takes into account the economic, environmental, and social impacts it generates [43,44,45,46]. Faced with the challenge of climate change, international organizations and states aim to implement policies to manage the transition fairly, recognizing that an unjust transition on a social level does not meet the requirements of sustainability itself [26,47,48].
Underestimating aspects related to territorial and social justice in the transition can lead to green discontent, becoming an obstacle to the support of environmental policies [49]. The potential concentration of costs in vulnerable regions and cities can determine social cohesion and transform into social discontent [28,50,51]. The gilets jaunes uprising in France represents the most notable example of how energy transition environmental policies have triggered a hostile reaction to the transition itself [52].
3. Materials and Methods
The research examines the residential markets of six Italian cities, categorizing three as major metropolitan cities and the remaining three as medium-sized cities. Notably, the majority of the Italian population resides in medium-sized cities [53]. The primary objective is to verify a statistically significant value gap between properties with higher and lower energy efficiency. Subsequently, the focus shifts to the existence of differentiated value gaps between large- and medium-sized cities.
Milan, Turin, and Florence are the three cities whose real estate markets have higher ranks and vitality. Situated in the northern and central macro-regions of Italy, these cities exhibit positive growth indicators and comparable economic, social, and administrative ranks [54].
Milan is currently undergoing a process of concentration, as shown by positive demographic and economic indicators. The city’s infrastructure and intangible resources are aligned with a significant increase in real estate values [54,55,56]. Enriching the metropolitan scenario dominated by Milan, Turin, and Florence represents relevant territorial polarities emerging within a concentration paradigm [57,58,59,60]. In terms of population, Milan has 1,358,420 inhabitants, Turin has 847,398 inhabitants, and Florence has 362,742 inhabitants [61].
The examined medium-sized cities are Padua, Bergamo, and Mestre. They exhibit comparable size, economic and social relevance, and administrative rank. In terms of population, Padua has 207,112 inhabitants, Bergamo has 119,809 inhabitants, and Mestre has 88,552 inhabitants [61]. Despite being part of the metropolitan city of Venice, Mestre constitutes a semi-independent market with a rank and values similar to the other two cities under consideration. All three are located in the country’s northern part of Italy.
The sample data were randomly selected within the administrative boundaries of the urban areas of the six cities under study. Each city was divided into three zones: centre, semi-centre, and periphery, in accordance with the stratification carried out by the Agenzia delle Entrate. Data acquisition involved collecting asking prices for each area from major real estate platforms, with a focus on the Immobiliare.it digital portal. The asking prices for residential assets in the three major cities, totaling 2034 units, comprise 873 units for Milan, 754 for Turin, and 407 for Florence. The data were collected in July 2023 (Figure 1). The asking prices for the three medium-sized cities are based on a dataset of 901 cases distributed among Padua (354 units), Mestre (254 units), and Bergamo (293 units). The data were collected in January 2023 (Figure 2).
The systematic comparison of energy performance appreciation measures in the real estate market initially entails the development of hedonic price models, which are commonly used in real estate market analysis. The fundamental hypothesis underlying hedonic price analysis is that the value of a heterogeneous asset (in this case, the property unit) is a function of the characteristics that make it up. Therefore, the methodology is used to determine the contribution of the positional and technical aspects of properties to their value [62,63,64]. A representative sample of the real estate market in a specific area allows for the application of multivariate regression analysis to the observed real estate market values [65]. The estimates allow for evaluating the appreciation of an energy-efficient property in comparison to a poorly performing one. Hedonic prices and their impact on average prices are compared across the six cities to highlight any differences between large- and medium-sized cities.
During data collection, the characteristics of each property were recorded, and the associated descriptive statistics and frequency distributions are provided in Appendix A. The properties’ energy classes follow the regulations of the European Parliament and the Council [66] and are grouped into seven energy levels from A to G in accordance with the EPC classification. In this work, the grouping observed in the real estate market is more detailed for energy class A, with twelve energy levels recorded, ranging from A4 to G.
Methodologically, the energy performance feature is initially considered on an ordinal scale in the models. However, in order to more accurately measure the robustness of the generated estimates, a second model that classifies energy characteristics has been introduced. Consumers who simplify their choice of property based on heuristics can consider the grouping of energy levels into a smaller set of categories. The sampled properties are thus categorized into maximally energy-efficient (class A and above and class B), moderately energy-efficient (classes C and D), and poorly performing properties (class E and below).
Additional intrinsic features of the sampled real estate are related to typological properties, which distinguish between single-family (villas) and aggregated units (apartments). Each sampled property’s number of bathrooms considered an index of typological quality, was specified. To better measure the contribution of intrinsic and technological features, properties were classified into “luxury”, “prestigious”, “ordinary”, and “economic” units. The survey also considered maintenance status information, classifying properties as “new—under construction”, “excellent—renovated”, “good—habitable”, or “poor—to be renovated”. The size of the properties, measured in square meters, was also recorded.
The survey also covered locational characteristics, classifying properties based on their location relative to the reference macro area (centre, semi-centre, and periphery), in line with the classification promoted by the Real Estate Market Observatory of the Agenzia delle Entrate. Additionally, the survey considered proximity to major local transport infrastructures.
The analysis highlights the prevalence of properties belonging to lower energy efficiency levels. The percentage of less energy-efficient properties (EPC classes E, F, and G) reaches values of 77.4%, 67.2%, and 87.8% for Milan, Turin, and Florence, respectively. Similar percentages are recorded for medium-sized cities, where these classes reach values of 79.1% for Padua, 79.2% for Mestre, and 66.5% for Bergamo. The aggregated data reveal statistics that are consistent with those pertaining to the national building stock, highlighting a percentage of 68.1% for the last three EPC classes (Figure 3).
The descriptive statistics of the samples present a homogeneous picture concerning intrinsic typological characteristics and maintenance status (Appendix A). The sampled properties can be primarily categorized as multi-family, predominantly prestigious or ordinary level, and are characterized by a suitable maintenance status.
Hedonic price estimation is based on multiple regression models. The literature does not provide unequivocal indications regarding the most suitable functional form to represent the grouping of real estate value [67]. However, studies highlight some issues related to functional forms that can lead to distortions, including spatial autocorrelation, multicollinearity, and heteroskedasticity [68,69].
The analysis developed in this research considers the Ordinary Least Squares (OLS) technique and does not employ spatial models capable of minimizing result distortions related to spatial autocorrelation. Two reasons underlie this choice. Two reasons underlie this choice. The first reason is related to the objective of the data analysis, which is to focus on the energy efficiency of buildings [70]. Variables that incorporate the main characteristics of the market, including the zoning variable associated with the Agenzia delle Entrate’s Property Market Observatory, are also considered. These zones are defined based on market areas that have similar values, solving the problem of spatial autocorrelation where values for nearby objects are alike.
The OLS algorithm assumes the absence of multicollinearity among the model’s variables [68]. The problem is addressed at two points: during variable selection by simplifying variables that summarize clear foundational aspects of value and during verification through the control of the Variance Inflation Factor (VIF) [71].
The functional form identified for the regression model is semi-logarithmic. This form is widely used because it entails several advantages over linear–linear and log–log formulations. In a semi-logarithmic function, coefficients relating to individual variables explain the percentage change in property price in relation to the unitary change in the independent variable, expressed by the natural logarithm of the market value. Additionally, the hedonic price of each characteristic is linked to the value of other characteristics. The semi-logarithmic functional form minimizes the problem of heteroskedasticity [72,73] and highlights the non-linear relationship between property prices and value-explanatory characteristics.
4. Results
The hedonic price model considers the natural logarithm of the unit market value as the unknown variable. The known variables consist of the technological, typological, and positional characteristics of the dwelling. The model uses statistical analysis of property asking prices to assess the contribution of each variable to the market price. This allows for the assessment of the relative impact of each characteristic on the overall property value. It is a valuable tool for understanding the factors that influence property prices and can be used for property valuations and market analyses. The function is thus as follows:
where
- Pi is the natural logarithm of the price of a dwelling expressed in EUR/sqm;
- β0 is the constant of the model;
- βi represents the marginal price of the characteristic;
- Xi is the numerical value of the observed variables, including EPC;
- ei represents a random error.
To ensure the utmost robustness of the research finding, the variable related to the energy characteristics of the properties is processed in two ways. In the first approach, energy characteristics are categorized into 12 energy levels from most efficient to least efficient. In the second approach, assuming simplified heuristics underlying the buyer’s choice, energy performance is categorized into three levels, considering an aggregated assessment for maximally efficient classes (A and B), moderately efficient classes (C and D), and energetically inefficient classes (E, F, and G).
Twelve models are thus developed for the six cities, taking into account the different processing methods of the variable related to the property’s energy class (Table 3, Table 4, Table 5, Table 6, Table 7 and Table 8).
Regarding the models derived from the 12-level energy variable (models A), the R2 statistic is 62.6%, 52.9%, and 60.6% for the cities of Milan, Turin, and Florence, respectively, while the adjusted and corrected R2 is 62.3% for Milan, 52.4% for Turin, and 60.0% for Florence (Table 3). In terms of medium-sized cities, the models report an R2 of 51.9% for Padua, 52.2% for Mestre, and 35.9% for Bergamo, with adjusted and corrected R2 values of 51.3%, 51.2%, and 34.8%, respectively (Table 3).
Similar results are reported by regression models based on the three-level energy variable (models B). Regarding the R2 index, the values are 62.0%, 53.4%, and 60.3% for the cities of Milan, Turin, and Florence, respectively. The adjusted and corrected R2 statistic amounts to 61.7% for Milan, 53.0% for Turin, and 59.7% for Florence (Table 4). Medium-sized cities report comparable values for the R2 and adjusted and corrected R2 statistics. In particular, R2 percentages are recorded at 51.6% for Padua, 52.0% for Mestre, and 34.9% for Bergamo, with values of 50.7%, 51.0%, and 33.7%, respectively, for the adjusted R2 statistic (Table 4).
The reliability of the models was further tested with reference to the F-statistic, whose p-value is found to be below 0.05 in all six urban areas. Model fit measures are reported in Table 3 for models A and in Table 4 for models B.
Hedonic prices related to the identified characteristics can be considered adequately significant when they report a p-value below 0.05. Table 5, Table 6, Table 7 and Table 8 present these values, complemented by the Variance Inflation Factor (VIF), which provides a measure of multicollinearity among the regression model’s independent variables. The six cases considered exhibit a VIF close to unity, indicating that the variables under consideration are weakly correlated and, therefore, independent of one another [68].
The EPC energy classification is a crucial factor in pricing properties in urban markets, specifically in terms of technical and maintenance status. A higher energy performance and reference level corresponds to a higher asking price for the property. The EPC energy classification is a crucial factor in pricing properties in urban markets, specifically in terms of technical and maintenance status. A higher energy performance and reference level correspond to a higher asking price for the property. The change in price as a function of the energy performance of the property is estimated both in the case where the energy characteristics are classified into 12 energy levels (A models) and in the case where they are classified into 3 levels, taking into account an aggregated assessment (B models).
Similarly, other typological and technological characteristics determine the value of assets. From a typological perspective, the difference between apartments and villas is only significant in the regression models for the city of Turin: in all samples, it is clear that high-density urban areas are mainly composed of multi-family dwellings. Real estate values for luxury and prestigious properties are higher in Turin models compared to ordinary or economy properties. Additionally, properties that are adequately equipped with services command a premium compared to poorly equipped dwellings, as indicated by the bathroom variable. Similarly, the consistency of assets is relevant. In all real estate markets we analysed, with the exception of Turin, an increase in asset size corresponds to a decrease in unit values, in accordance with the law of diminishing marginal utility.
The maintenance status of a property is a crucial factor in determining its price. A decrease in the value of a property is often due to a decline in its maintenance. The value of real estate is also influenced by its location. Typically, there is a gradual decrease in property values as you move from central to semicentral and peripheral areas. The market in Mestre is an exception as it does not follow the traditional hierarchy of central and outer areas of the city. Additionally, in model B, the positional advantage of being close to the main public transport infrastructure, which is a value-generating element for other markets, is not considered for Mestre, similar to Bergamo.
The identified hedonic prices have similar magnitudes, confirming the robustness of the processed models.
5. Discussion
The analysis confirms the theoretical premises presented in the first paragraph and the empirical investigations conducted at the national and international levels. The results demonstrate significant value differences based on the energy performance of properties. The market recognizes the economic advantage derived from lower operating costs, coupled with the notion of unencumbered and unrestricted commercialization for properties exhibiting superior energy performance.
Examining the value differential between properties differentiated in terms of energy efficiency is essential to identify any systematic difference between large- and medium-sized cities. This analysis facilitates an understanding of the relationship between the size and vibrancy of urban real estate markets and the appreciation of energy characteristics.
Regression models for the six cities under consideration enable the determination of the value of ordinary property in different urban contexts. The unit market value is estimated for a property in classes A, D, and G for regression models A. Subsequently, the gap between the estimated prices in relative terms is assessed (Table 9 and Figure 4).
The relative value differential between a property in class G and a property in class D is estimated as follows: 8.44%, 6.50%, and 4.92% for the cities of Milan, Turin, and Florence, respectively. For medium-sized cities, these variations correspond to higher values. Specifically, the results show a percentage increase of 15.84% for Padua, 12.41% for Mestre, and 13.77% for Bergamo (Figure 4).
The same procedure is carried out for regression models B. The results converge even when the energy variable is presented according to an aggregate paradigm of simplified heuristics, as shown in Table 10 and Figure 5.
Particularly in the cities of Milan and Turin, the gap between inefficient properties (classes E, F, and G) and moderately performing ones (classes C and D) is 7.68%, while the gap in Florence is 4.39%. Similarly, with more pronounced variations, the markets in Padua and Mestre exhibit a premium of 17.94% and 17.82%, respectively, whereas Bergamo records a differential of 12.08%. The results also show a convergence in the value gap between properties in classes A and B, which are more energy efficient, and those that are less qualified in terms of energy performance. The percentages for Milan and Turin are 15.95%, while the percentage for Florence is 8.98%. Reaching 39.10%, Padua exhibits a higher appreciation that is comparable to the value recorded in Mestre at 38.82%. Bergamo, on the other hand, presents a premium lower than the other two medium-sized cities but higher than the metropolitan cities, achieving a relative gap value of 25.61% for energy-efficient properties compared to poorly performing ones.
The results obtained affirm the hypotheses of Eichholz et al. [9], Addae-Dapaah and Wilkinson [23], and Taruttis and Weber [24]. A clear inverse relationship between the extent of the value gap and the size and vibrancy of real estate markets is evident. Large cities with significant real estate markets are less affected by the growth in value associated with higher energy efficiency. This is the case for the metropolitan cities of Milan, Turin, and Florence, where the value gap between energy-efficient properties is contained due to higher demand and greater market vibrancy. Smaller cities with less lively markets, as seen in Padua, Mestre, and Bergamo, are conspicuous for their more significant gaps.
The reasons behind the inverse relationship between market size and energy performance appreciation can be attributed to the varying ability of demand to choose among properties with different technological qualities in markets that are more or less competitive and dynamic. Buyers may tend to differentiate more between energy-efficient and non-efficient properties in less vibrant markets. This differs from the strength of demand in highly competitive markets, where the potential for differentiation based on features such as energy performance is possible but within decidedly narrower margins.
The study cannot be considered conclusive due to the limited number of cities examined. However, the trend is evident, and the research confirms the dual hypothesis: the market acknowledges the price variation for higher levels of energy performance, and this recognition is more pronounced in medium-sized centres than in large cities.
This trend is not without impact on the energy transition and the economic implications it entails. Those who fail to align their properties with energy consumption reduction goals will experience a decrease in the value of their property. However, this decline appears to be more pronounced for properties located in medium- and small-sized centres, which are already characterized by lower market values. The transition seems unfair as it disproportionately affects those with lower unit values and limited means for technological property improvements.
Energy transition risks contribute to increasing polarization by feeding the difference in property values between large metropolitan cities and less competitive territories. This aspect warrants further investigation and verification, as it requires particular attention due to the discontent and hostility that the transition may generate due to its economic ramifications rather than for theoretical or principled reasons [74,75,76,77,78]. Based on the research findings, it is important to also consider the polarization of property values, primarily occurring between those who have the financial means to invest in technological upgrades for their property and those who do not, and secondarily, between the owners of large centres and medium to small centres.
6. Conclusions
In recent years, several studies have investigated the appreciation of real estate based on its energy and environmental performance. Throughout Europe, within the broader framework of decarbonization of the built environment, research has highlighted variations in value based on higher energy performance in both residential and tertiary directional segments.
However, the measures of these variations are quite diverse. The research aimed to investigate whether the relevance and vibrancy of real estate markets could explain the differences in the value deviations observed. This issue has implications for the very nature of energy transition, which can be either just or unjust depending on the type of impacts and the locations where they occur.
The research focused on six Italian cities, three of which are metropolitan centers, while the others are medium-sized cities. The sample of asking prices included 2935 properties for which the main locational, typological, and technological characteristics were recorded. Regression models were used to estimate hedonic prices, consistently confirming the statistical relevance of energy performance as represented by the EPC classification. In medium-sized cities, the average gap in premium price between high-efficiency (class A) and low-efficiency (class G) properties is 30%, whereas it decreases to 14% between class D and class G properties. In metropolitan cities, the gap in premium price between high-efficiency (class A) and low-efficiency (class G) properties is 15%, and it decreases to 6% between class D and class G properties. The hypothesis that the size and vibrancy of markets matter has thus been verified, although further statistical tests based on bigger samples referring to a larger number of cities are needed for a complete and definitive verification.
The transition seems to lack the attributes of fairness that are widely evoked in the literature [79,80,81]. The most substantial decline in value seems to be incurred by properties located in medium-sized cities characterized by less relevant and less vibrant markets. In contrast, real estate located in metropolitan cities with lively and dynamic markets appears to be less influenced by the different EPC ranking placements. Given that a significant portion of families’ wealth is represented by real estate and residential assets, the energy transition seems unfair and can potentially adversely impact families’ wealth.
Future research can undoubtedly corroborate the adverse ramifications to real estate assets in medium- to small-sized centres compared to large cities. Additionally, the research can explore other factors that can account for the significant variability in deviations observed between properties with higher and lower energy efficiency.
However, the most promising area concerns policies that can be implemented for real estate energy efficiency, with a particular focus on the residential segment [82,83,84]. The social sustainability of environmental and energy transitions is at stake [85]. If the latter is not suitably guided, there is a risk of accentuating social polarization between territories and social groups, leading to the consequent conflicts that may arise [86,87]. Therefore, the complex relationship between urbanization and climate change needs to be better reflected in spatial planning and urban policies [88]. Additionally, future studies could further investigate the increasing demand for energy-efficient buildings over time, taking into account policies related to ecological transition and the growing collective awareness of energy conservation.
Author Contributions
Conceptualization, E.M., G.G. and E.R.; methodology, E.M., G.G. and E.R.; software, G.G. and G.T.; validation, E.M., G.G. and E.R.; formal analysis, G.G.; investigation, G.G. and G.T.; data curation, G.G. and G.T.; writing—original draft preparation, G.G. and E.R.; writing—review and editing, E.M., G.G. and E.R.; visualization, G.G. and E.R.; supervision, E.M.; project administration, E.M. All authors have read and agreed to the published version of the manuscript.
Funding
This research received no external funding.
Data Availability Statement
The data presented in this study are available on request from the corresponding author.
Conflicts of Interest
The authors declare no conflicts of interest. The funders had no role in the design of the study; in the collection, analyses, or interpretation of data; in the writing of the manuscript; or in the decision to publish the results.
Appendix A

Table A1.
Frequency analysis of the Milan sample.
| Variables | Categories | n | % |
|---|---|---|---|
| Zone | Central zone | 209 | 23.9 |
| Semicentral zone | 224 | 25.7 | |
| Suburban zone | 440 | 50.4 | |
| Proximity to infrastructure | Up to 200 m | 265 | 30.4 |
| From 201 to 500 m | 518 | 59.3 | |
| Over 500 m | 90 | 10.3 | |
| Typology | Villa | 0 | 0.0 |
| Apartment | 873 | 100.0 | |
| Property class | Luxury | 53 | 6.1 |
| Prestigious | 469 | 53.7 | |
| Ordinary | 283 | 32.4 | |
| Economic | 19 | 2.2 | |
| Number of bathrooms | One bathroom | 489 | 56.0 |
| Two bathrooms | 295 | 33.8 | |
| Three bathrooms | 86 | 9.9 | |
| Four bathrooms | 2 | 0.2 | |
| Energy class | A4 | 7 | 0.8 |
| A3 | 8 | 0.9 | |
| A2 | 12 | 1.4 | |
| A1 | 11 | 1.3 | |
| A+ | 6 | 0.7 | |
| A | 24 | 2.7 | |
| B | 22 | 2.5 | |
| C | 20 | 2.3 | |
| D | 87 | 10.0 | |
| E | 130 | 14.9 | |
| F | 182 | 20.8 | |
| G | 362 | 41.5 | |
| Maintenance status | New—under construction | 48 | 5.5 |
| Excellent—renovated | 346 | 39.6 | |
| Good—habitable | 357 | 40.9 | |
| Poor—to be renovated | 110 | 12.6 |
Table A2.
Frequency analysis of the Turin sample.
| Variables | Categories | n | % |
|---|---|---|---|
| Zone | Central zone | 208 | 27.6 |
| Semicentral zone | 151 | 20.0 | |
| Suburban zone | 395 | 52.4 | |
| Proximity to infrastructure | Up to 200 m | 133 | 17.6 |
| From 201 to 500 m | 333 | 44.2 | |
| Over 500 m | 288 | 38.2 | |
| Typology | Villa | 4 | 0.5 |
| Apartment | 750 | 99.5 | |
| Property class | Luxury | 25 | 3.3 |
| Prestigious | 320 | 42.4 | |
| Ordinary | 314 | 41.6 | |
| Economic | 41 | 5.4 | |
| Number of bathrooms | One bathroom | 485 | 64.3 |
| Two bathrooms | 234 | 31.0 | |
| Three bathrooms | 31 | 4.1 | |
| Four bathrooms | 2 | 0.3 | |
| Five bathrooms | 1 | 0.1 | |
| Energy class | A4 | 5 | 0.7 |
| A3 | 2 | 0.3 | |
| A2 | 2 | 0.3 | |
| A1 | 12 | 1.6 | |
| A+ | 3 | 0.4 | |
| A | 19 | 2.5 | |
| B | 25 | 3.3 | |
| C | 54 | 7.2 | |
| D | 125 | 16.6 | |
| E | 171 | 22.7 | |
| F | 137 | 18.2 | |
| G | 197 | 26.1 | |
| Maintenance status | New—under construction | 32 | 4.2 |
| Excellent—renovated | 250 | 33.2 | |
| Good—habitable | 357 | 47.3 | |
| Poor—to be renovated | 102 | 13.5 |
Table A3.
Frequency analysis of the Florence sample.
| Variables | Categories | n | % |
|---|---|---|---|
| Zone | Central zone | 95 | 23.3 |
| Semicentral zone | 183 | 45.0 | |
| Suburban zone | 129 | 31.7 | |
| Proximity to infrastructure | Up to 200 m | 155 | 38.1 |
| From 201 to 500 m | 129 | 31.7 | |
| Over 500 m | 123 | 30.2 | |
| Typology | Villa | 0 | 0.0 |
| Apartment | 407 | 100.0 | |
| Property class | Luxury | 8 | 2.0 |
| Prestigious | 117 | 28.7 | |
| Ordinary | 220 | 54.1 | |
| Economic | 44 | 10.8 | |
| Number of bathrooms | One bathroom | 273 | 67.1 |
| Two bathrooms | 119 | 29.2 | |
| Three bathrooms | 15 | 3.7 | |
| Energy class | A4 | 0 | 0.0 |
| A3 | 2 | 0.5 | |
| A2 | 1 | 0.2 | |
| A1 | 7 | 1.7 | |
| A+ | 6 | 1.5 | |
| A | 4 | 1.0 | |
| B | 12 | 2.9 | |
| C | 3 | 0.7 | |
| D | 14 | 3.4 | |
| E | 30 | 7.4 | |
| F | 69 | 17.0 | |
| G | 255 | 62.7 | |
| Maintenance status | New—under construction | 22 | 5.4 |
| Excellent—renovated | 201 | 49.4 | |
| Good—habitable | 148 | 36.4 | |
| Poor—to be renovated | 33 | 8.1 |
Table A4.
Frequency analysis of the Padua sample.
| Variables | Categories | n | % |
|---|---|---|---|
| Zone | Central zone | 206 | 58.2 |
| Semicentral zone | 42 | 11.9 | |
| Suburban zone | 106 | 29.9 | |
| Proximity to infrastructure | Up to 200 m | 130 | 36.7 |
| From 201 to 500 m | 96 | 27.1 | |
| Over 500 m | 128 | 36.2 | |
| Typology | Villa | 20 | 5.6 |
| Apartment | 334 | 94.4 | |
| Number of bathrooms | One bathroom | 111 | 31.4 |
| Two bathrooms | 184 | 52.0 | |
| Three bathrooms | 59 | 16.7 | |
| Energy class | A4 | 10 | 2.8 |
| A3 | 1 | 0.3 | |
| A2 | 2 | 0.6 | |
| A1 | 6 | 1.7 | |
| A+ | 0 | 0.0 | |
| A | 6 | 1.7 | |
| B | 6 | 1.7 | |
| C | 9 | 2.5 | |
| D | 34 | 9.6 | |
| E | 69 | 19.5 | |
| F | 90 | 25.4 | |
| G | 121 | 34.2 | |
| Maintenance status | New—under construction | 24 | 6.8 |
| Excellent—renovated | 100 | 28.2 | |
| Good—habitable | 177 | 50.0 | |
| Poor—to be renovated | 36 | 10.2 |
Table A5.
Frequency analysis of the Mestre sample.
| Variables | Categories | n | % |
|---|---|---|---|
| Zone | Central zone | 155 | 61.0 |
| Semicentral zone | 47 | 18.5 | |
| Suburban zone | 52 | 20.5 | |
| Proximity to infrastructure | Up to 200 m | 107 | 42.1 |
| From 201 to 500 m | 80 | 31.5 | |
| Over 500 m | 67 | 26.4 | |
| Typology | Villa | 3 | 1.2 |
| Apartment | 251 | 98.8 | |
| Number of bathrooms | One bathroom | 160 | 63.0 |
| Two bathrooms | 90 | 35.4 | |
| Three bathrooms | 2 | 0.8 | |
| Energy class | A4 | 13 | 5.1 |
| A3 | 1 | 0.4 | |
| A2 | 1 | 0.4 | |
| A1 | 2 | 0.8 | |
| A+ | 4 | 1.6 | |
| A | 2 | 0.8 | |
| B | 4 | 1.6 | |
| C | 7 | 2.8 | |
| D | 19 | 7.5 | |
| E | 31 | 12.2 | |
| F | 70 | 27.6 | |
| G | 100 | 39.4 | |
| Maintenance status | New—under construction | 21 | 8.3 |
| Excellent—renovated | 90 | 35.4 | |
| Good—habitable | 126 | 49.6 | |
| Poor—to be renovated | 9 | 3.5 |
Table A6.
Frequency analysis of the Bergamo sample.
| Variables | Categories | n | % |
|---|---|---|---|
| Zone | Central zone | 151 | 51.5 |
| Semicentral zone | 40 | 13.7 | |
| Suburban zone | 102 | 34.8 | |
| Proximity to infrastructure | Up to 200 m | 60 | 20.5 |
| From 201 to 500 m | 124 | 42.3 | |
| Over 500 m | 109 | 37.2 | |
| Typology | Villa | 8 | 2.7 |
| Apartment | 285 | 97.3 | |
| Number of bathrooms | One bathroom | 177 | 60.4 |
| Two bathrooms | 103 | 35.2 | |
| Three bathrooms | 13 | 4.4 | |
| Energy class | A4 | 3 | 1.0 |
| A3 | 3 | 1.0 | |
| A2 | 1 | 0.3 | |
| A1 | 7 | 2.4 | |
| A+ | 4 | 1.4 | |
| A | 8 | 2.7 | |
| B | 20 | 6.8 | |
| C | 23 | 7.8 | |
| D | 29 | 9.9 | |
| E | 52 | 17.7 | |
| F | 44 | 15.0 | |
| G | 99 | 33.8 | |
| Maintenance status | New—under construction | 38 | 13.0 |
| Excellent—renovated | 116 | 39.6 | |
| Good—habitable | 118 | 40.3 | |
| Poor—to be renovated | 19 | 6.5 |
References
- Commissione Europea. Efficienza Energetica Nell’Edilizia. 17 February 2020. Available online: https://commission.europa.eu/news/focus-energy-efficiency-buildings-2020-02-17_it (accessed on 15 December 2023).
- Parlamento Europeo e Consiglio dell’Unione Europea. Direttiva 2010/31/UE del Parlamento Europeo e del Consiglio Sulla Prestazione Energetica Nell’Edilizia. 2010. Available online: https://eur-lex.europa.eu/LexUriServ/LexUriServ.do?uri=OJ:L:2010:153:0013:0035:it:PDF (accessed on 15 December 2023).
- Commissione Europea. Comunicazione della Commissione al Parlamento Europeo, al Consiglio, al Comitato Economico e Sociale Europeo e al Comitato delle Regioni. 2019. Available online: https://eur-lex.europa.eu/legal-content/IT/TXT/?uri=COM%3A2019%3A640%3AFIN (accessed on 15 December 2023).
- Napoli, G.; Barbaro, S.; Giuffrida, S.; Trovato, M.R. The European Green Deal: New Challenges for the Economic Feasibility of Energy Retrofit at District Scale. In New Metropolitan Perspectives; Springer: Cham, Switzerland, 2021; pp. 1248–1258. ISBN 978-3-030-48278-7. [Google Scholar]
- PwC and the Urban Land Institute. Emerging Trends in Real Estate Europe 2023; PwC and the Urban Land Institute: London, UK, 2022; Available online: https://knowledge.uli.org/en/reports/emerging-trends/2023/emerging-trends-in-real-estate-europe (accessed on 12 December 2023).
- RICS Royal Institution of Chartered Surveyors. RICS Sustainability Report; RICS: London, UK, 2023; Available online: https://www.rics.org/news-insights/rics-sustainability-report-2023 (accessed on 20 December 2023).
- Aydin, E.; Brounen, D.; Kok, N. The Capitalization of Energy Efficiency: Evidence from the Housing Market. J. Urban Econ. 2020, 117, 103243. [Google Scholar] [CrossRef]
- Eichholtz, P.; Kok, N.; Quigley, J.M. The Economics of Green Building. Rev. Econ. Stat. 2013, 95, 50–63. [Google Scholar] [CrossRef]
- Eichholtz, P.; Kok, N.; Quigley, J.M. Doing Well by Doing Good? Green Office Buildings. Am. Econ. Rev. 2010, 100, 2492–2509. [Google Scholar] [CrossRef]
- Bragolusi, P.; D’Alpaos, C. The Valuation of Buildings Energy Retrofitting: A Multiple-Criteria Approach to Reconcile Cost-Benefit Trade-Offs and Energy Savings. Appl. Energy 2022, 310, 118431. [Google Scholar] [CrossRef]
- Brounen, D.; Kok, N. On the Economics of Energy Labels in the Housing Market. J. Environ. Econ. Manag. 2011, 62, 166–179. [Google Scholar] [CrossRef]
- Hyland, M.; Lyons, R.C.; Lyons, S. The Value of Domestic Building Energy Efficiency—Evidence from Ireland. Energy Econ. 2013, 40, 943–952. [Google Scholar] [CrossRef]
- Jensen, O.M.; Hansen, A.R.; Kragh, J. Market Response to the Public Display of Energy Performance Rating at Property Sales. Energy Policy 2016, 93, 229–235. [Google Scholar] [CrossRef]
- Fuerst, F.; McAllister, P.; Nanda, A.; Wyatt, P. Does Energy Efficiency Matter to Home-Buyers? An Investigation of EPC Ratings and Transaction Prices in England. Energy Econ. 2015, 48, 145–156. [Google Scholar] [CrossRef]
- Fuerst, F.; McAllister, P.; Nanda, A.; Wyatt, P. Energy Performance Ratings and House Prices in Wales: An Empirical Study. Energy Policy 2016, 92, 20–33. [Google Scholar] [CrossRef]
- Fuerst, F.; Oikarinen, E.; Harjunen, O. Green Signalling Effects in the Market for Energy-Efficient Residential Buildings. Appl. Energy 2016, 180, 560–571. [Google Scholar] [CrossRef]
- De Ayala, A.; Galarraga, I.; Spadaro, J.V. The Price of Energy Efficiency in the Spanish Housing Market. Energy Policy 2016, 94, 16–24. [Google Scholar] [CrossRef]
- Marmolejo-Duarte, C.; Chen, A. The Uneven Price Impact of Energy Efficiency Ratings on Housing Segments and Implications for Public Policy and Private Markets. Sustainability 2019, 11, 372. [Google Scholar] [CrossRef]
- Morano, P.; Tajani, F.; Di Liddo, F.; Guarnaccia, C. The Value of the Energy Retrofit in the Italian Housing Market: Two Case-Studies Compared. WSEAS Trans. Bus. Econ. 2018, 15, 249–258. [Google Scholar]
- Bisello, A.; Antoniucci, V.; Marella, G. Measuring the Price Premium of Energy Efficiency: A Two-Step Analysis in the Italian Housing Market. Energy Build. 2020, 208, 109670. [Google Scholar] [CrossRef]
- Micelli, E.; Giliberto, G.; Righetto, E.; Tafuri, G. The Economic Value of Sustainability. Housing Market and Energy Performance of Homes. Valori E Valutazioni 2023, 34, 3–16. [Google Scholar] [CrossRef]
- Mangialardo, A.; Micelli, E.; Saccani, F. Does Sustainability Affect Real Estate Market Values? Empirical Evidence from the Office Buildings Market in Milan (Italy). Sustainability 2019, 11, 12. [Google Scholar] [CrossRef]
- Addae-Dapaah, K.; Wilkinson, J. Green Premium: What Is the Implied Prognosis for Sustainability? J. Sustain. Real Estate 2020, 12, 16–33. [Google Scholar] [CrossRef]
- Taruttis, L.; Weber, C. Estimating the Impact of Energy Efficiency on Housing Prices in Germany: Does Regional Disparity Matter? Energy Econ. 2022, 105, 105750. [Google Scholar] [CrossRef]
- Horner, R.; Schindler, S.; Haberly, D.; Aoyama, Y. Globalisation, Uneven Development and the North–South ‘Big Switch’. Camb. J. Reg. Econ. Soc. 2018, 11, 17–33. [Google Scholar] [CrossRef]
- Rodríguez-Pose, A. The Revenge of the Places That Don’t Matter (and What to Do about It). Camb. J. Reg. Econ. Soc. 2018, 11, 189–209. [Google Scholar] [CrossRef]
- Marino, E.; Ribot, J. Special Issue Introduction: Adding Insult to Injury: Climate Change and the Inequities of Climate Intervention. Glob. Environ. Chang. 2012, 22, 323–328. [Google Scholar] [CrossRef]
- Dijkstra, L.; Poelman, H.; Rodríguez-Pose, A. The Geography of EU Discontent. Reg. Stud. 2020, 54, 737–753. [Google Scholar] [CrossRef]
- McCann, P. Perceptions of Regional Inequality and the Geography of Discontent: Insights from the UK. Reg. Stud. 2020, 54, 256–267. [Google Scholar] [CrossRef]
- Parlamento Europeo. Prestazione Energetica Nell’Edilizia (Rifusione) Emendamenti del Parlamento Europeo, Approvati il 14 Marzo 2023, alla Proposta di Direttiva del Parlamento Europeo e del Consiglio Sulla Prestazione Energetica Nell’Edilizia (Rifusione). 2023. Available online: https://www.europarl.europa.eu/doceo/document/TA-9-2023-0068_IT.html (accessed on 22 December 2023).
- Copiello, S.; Gabrielli, L.; Micelli, E. Building Industry and Energy Efficiency: A Review of Three Major Issues at Stake. Comput. Sci. Its Appl. ICCSA 2021 2021, 12954, 226–240. [Google Scholar] [CrossRef]
- Zhang, L.; Li, Y.; Stephenson, R.; Ashuri, B. Valuation of Energy Efficient Certificates in Buildings. Energy Build. 2018, 158, 1226–1240. [Google Scholar] [CrossRef]
- Wahlström, M.H. Doing Good but Not That Well? A Dilemma for Energy Conserving Homeowners. Energy Econ. 2016, 60, 197–205. [Google Scholar] [CrossRef]
- Bio Intelligence Service. Energy Performance Certificates in Buildings and Their Impact on Transaction Prices and Rents in Selected EU Countries, Final Report Prepared for European Commission (DG Energy). 2013. Available online: https://energy.ec.europa.eu/system/files/2014-11/20130619-energy_performance_certificates_in_buildings_0.pdf (accessed on 15 December 2023).
- Fregonara, E.; Rolando, D.; Semeraro, P.; Vella, M. The Impact of Energy Performance Certificate Level on House Listing Prices. First Evidence from Italian Real Estate. Aestimum 2015, 65, 143–163. [Google Scholar] [CrossRef]
- Morano, P.; Rosato, P.; Tajani, F.; Di Liddo, F. An Analysis of the Energy Efficiency Impacts on the Residential Property Prices in the City of Bari (Italy). In Green Energy and Technology; Springer: Heidelberg, Berlin, Germany, 2020; pp. 73–88. ISBN 978-3-030-23784-4. [Google Scholar]
- Massimo, D.; Paola, P.; Musolino, M.; Malerba, A.; Del Giudice, F.P. Green and Gold Buildings? Detecting Real Estate Market Premium for Green Buildings through Evolutionary Polynomial Regression. Buildings 2022, 12, 621. [Google Scholar] [CrossRef]
- Del Giudice, V.; Massimo, D.E.; Salvo, F.; De Paola, P.; De Ruggiero, M.; Musolino, M. Market Price Premium for Green Buildings: A Review of Empirical Evidence. Case Study. In New Metropolitan Perspectives; Bevilacqua, C., Calabrò, F., Della Spina, L., Eds.; Springer International Publishing: Cham, Switzerland, 2021; pp. 1237–1247. [Google Scholar] [CrossRef]
- Ruggeri, A.; Gabrielli, L.; Scarpa, M.; Marella, G. What Is the Impact of the Energy Class on Market Value Assessments of Residential Buildings? An Analysis throughout Northern Italy Based on Extensive Data Mining and Artificial Intelligence. Buildings 2023, 13, 2994. [Google Scholar] [CrossRef]
- Loberto, M.; Mistretta, A.; Spuri, M. The Capitalization of Energy Labels into House Prices. Evidence from Italy; Questioni di Economia e Finanza; Banca d’Italia Eurosistema: Roma, Italy, 2023; Available online: https://www.bancaditalia.it/pubblicazioni/qef/2023-0818/QEF_818_23.pdf (accessed on 22 December 2023).
- Guerrieri, G. Il Mercato Della Casa. Domanda, Offerta, Tassazione e Spesa Pubblica; Carocci: Roma, Italy, 2022. [Google Scholar]
- Dalla Zuanna, G.D.; Weber, G. Cose da non Credere: Il Senso Comune alla Prova dei Numeri; Laterza: Bari, Italy, 2012; ISBN 978-88-581-0375-3. [Google Scholar]
- Krawchenko, T.A.; Gordon, M. How Do We Manage a Just Transition? A Comparative Review of National and Regional Just Transition Initiatives. Sustainability 2021, 13, 6070. [Google Scholar] [CrossRef]
- Wang, X.; Lo, K. Just Transition: A Conceptual Review. Energy Res. Soc. Sci. 2021, 82, 102291. [Google Scholar] [CrossRef]
- Heffron, R.J. What Is the “Just Transition”. In Achieving a Just Transition to a Low-Carbon Economy; Heffron, R.J., Ed.; Springer International Publishing: Cham, Switzerland, 2021; pp. 9–19. ISBN 978-3-030-89460-3. [Google Scholar]
- Saiu, V.; Blečić, I.; Meloni, I. Making Sustainability Development Goals (SDGs) Operational at Suburban Level: Potentials and Limitations of Neighbourhood Sustainability Assessment Tools. Environ. Impact Assess. Rev. 2022, 96, 106845. [Google Scholar] [CrossRef]
- Marais, V. The Employment Crisis, Just Transition and the Universal Basic Income Grant. In The Climate Crisis: South African and Global Democratic Eco-Socialist Alternatives; Satgar, V., Ed.; Wits University Press: Johannesburg, South Africa, 2018; pp. 70–106. ISBN 978-1-77614-054-1. [Google Scholar]
- Williams, S.; Doyon, A. Justice in Energy Transitions. Environ. Innov. Soc. Transit. 2019, 31, 144–153. [Google Scholar] [CrossRef]
- Rodríguez-Pose, A.; Bartalucci, F. The Green Transition and Its Potential Territorial Discontents. Camb. J. Reg. Econ. Soc. 2023, 120, rsad039. [Google Scholar] [CrossRef]
- Broekel, T.; Alfken, C. Gone with the Wind? The Impact of Wind Turbines on Tourism Demand. Energy Policy 2015, 86, 506–519. [Google Scholar] [CrossRef]
- Arndt, C.; Halikiopoulou, D.; Vrakopoulos, C. The Centre-Periphery Divide and Attitudes towards Climate Change Measures among Western Europeans. Environ. Politics 2023, 32, 381–406. [Google Scholar] [CrossRef]
- Martin, M.; Islar, M. The “end of the World” vs. the “End of the Month”: Understanding Social Resistance to Sustainability Transition Agendas, a Lesson from the Yellow Vests in France. Sustain. Sci. 2021, 16, 601–614. [Google Scholar] [CrossRef]
- ANCI-IFEL L’Italia delle città medie; I Comuni Quaderni di Analisi. 2013. Available online: https://www.fondazioneifel.it/documenti-e-pubblicazioni/item/download/327_fcde9c60664006139b15e248dee78278 (accessed on 21 December 2023).
- Micelli, E.; Righetto, E. How Do Metropolitan Cities Evolve after the 2008/2012 Crisis and the COVID-19 Pandemic? An Analysis from Real Estate Market Values: Come Evolvono Le Città Metropolitane Dopo Crisi e Pandemia COVID-19? Un’analisi a Partire Dai Valori Del Mercato Immobiliare. Valori E Valutazioni 2023, 31, 49–67. [Google Scholar] [CrossRef]
- Longo, A.; Cicirello, L. Città Metropolitane e Pianificazione di Area Vasta. Prospettive di Governo Territoriale per la Gestione delle Metamorfosi Urbane; Angeli: Milano, Italy, 2016; ISBN 88-917-3762-3. [Google Scholar]
- Camagni, R.; Capello, R.; Caragliu, A. Le città metropolitane: Leader all’interno della gerarchia urbana in Italia? Arch. Di Studi Urbani E Reg. 2021, 132, 121–152. [Google Scholar] [CrossRef]
- Compagnucci, F. Manifattura ed attività della conoscenza nelle città: L’alleanza necessaria. Imprese Città Riv. Della Camera Di Commer. Di Milano 2013, 1, 51–58. [Google Scholar] [CrossRef]
- Gambarotto, F.; Leoncini, R.; Pedrini, G. Nuove Prospettive per La Manifattura Urbana. Sci. Reg. 2018, 8, 3110. [Google Scholar]
- Intesa San Paolo Economia e Finanza Dei Distretti Industriali. Available online: https://group.intesasanpaolo.com/content/dam/portalgroup/repositorydocumenti/public/Contenuti/RISORSE/Documenti%20PDF/PDF_sepa/CNT-05-00000004FDF04.pdf (accessed on 20 December 2023).
- Feldman, M.P.; Audretsch, D.B. Innovation in Cities: Science-Based Diversity, Specialization and Localized Competition. Eur. Econ. Rev. 1999, 43, 409–429. [Google Scholar] [CrossRef]
- ISTAT Istituto Nazionale Di Statistica, Resident Population. Available online: https://esploradati.istat.it/databrowser/#/it/dw/categories/IT1,POP,1.0/POP_POPULATION/DCIS_POPRES1 (accessed on 10 January 2024).
- Lancaster, K.J. A New Approach to Consumer Theory. J. Political Econ. 1966, 74, 132–157. [Google Scholar] [CrossRef]
- Rosen, S. Hedonic Prices and Implicit Markets: Product Differentiation in Pure Competition. J. Political Econ. 1974, 82, 34–55. [Google Scholar] [CrossRef]
- Simonotti, M. I prezzi marginali impliciti delle risorse immobiliari. In Estimo ed Economia Ambientale; Fusco Girard, L., Ed.; Angeli: Milano, Italy, 1993. [Google Scholar]
- Michelangeli, A. Il metodo dei prezzi edonici per la costruzione di indici dei prezzi per il mercato immobiliare. In Principi Metodologici per la Costruzione di Indici dei Prezzi del Mercato Immobiliare; Del Giudice, V., D’Amato, M., Eds.; Maggioli: Rimini, Italy, 2008. [Google Scholar]
- Parlamento Europeo; Consiglio dell’Unione Europea. Regulation 2017/1369 of the European Parliament and of the Council of 4 July 2017 Setting a Framework for Energy Labelling and Repealing Directive 2010/30/EU. 2017. Available online: http://www.bloomsburycollections.com/book/fundamental-texts-on-european-private-law-1 (accessed on 21 December 2023).
- Malpezzi, S. Hedonic Pricing Models: A Selective and Applied Review. In Housing Economics and Public Policy: Essays in Honor of Duncan Maclennan; Blackwell Science: Oxford, UK, 2002; pp. 67–89. [Google Scholar] [CrossRef]
- Bottero, M.; Bravi, M.; Dell’Anna, F.; Mondini, G. Valutazione dell’efficienza energetica degli edifici con il metodo dei prezzi edonici: Gli effetti spaziali sono rilevanti? Valori E Valutazioni 2018, 21, 27–39. [Google Scholar]
- Palmquist, R.B. Chapter 16 Property Value Models. In Handbook of Environmental Economics; Mler, K.-G., Vincent, J.R., Eds.; Valuing Environmental Changes; Elsevier: Amsterdam, The Netherlands, 2005; Volume 2, pp. 763–819. [Google Scholar] [CrossRef]
- Camagni, R. Principi Di Economia Urbana e Territoriale; Carocci editore: Roma, Italy, 1993; ISBN 978-88-430-1217-6. [Google Scholar]
- Marcoulides, K.M.; Raykov, T. Evaluation of Variance Inflation Factors in Regression Models Using Latent Variable Modeling Methods. Educ. Psychol. Meas. 2019, 79, 874–882. [Google Scholar] [CrossRef]
- Boza, E. Investigation of Housing Valuation Models Based on Spatial and Non-Spatial Techniques. Ph.D. Thesis, Middle East Technical University, Ankara, Turkey, 2015. [Google Scholar]
- Ottensmann, J.; Payton, S.; Man, J. Urban Location and Housing Prices within a Hedonic Model. J. Reg. Anal. Policy 2008, 38, 17. [Google Scholar]
- Arler, F. Global Partnership, Climate Change and Complex Equality. Environ. Values 2001, 10, 301–329. [Google Scholar] [CrossRef]
- Cornelius, M.; Adger, W.N.; Paavola, J.; Huq, S.; Mace, M.J. Fairness in Adaptation to Climate Change. Clim. Chang. 2009, 96, 259–267. [Google Scholar] [CrossRef]
- Ribot, J. Vulnerability Does Not Fall from the Sky: Toward Multiscale, pro-Poor Climate Policy. Soc. Dimens. Clim. Chang. Equity Vulnerability A Warm. World 2010, 47–74. [Google Scholar] [CrossRef]
- Fleming, R.; Mauger, R. Green and Just? An update on the ‘European Green Deal’. J. Eur. Environ. Plan. Law 2021, 18, 164–180. [Google Scholar] [CrossRef]
- Balletto, G.; Sinatra, M.; Milesi, A.; Ghiani, E.; Borruso, G.; Zullo, F. Spatial Regional Electricity Intensity and Equitable Well-Being to Support Just Transition. TeMA—J. Land Use Mobil. Environ. 2023, 16, 609–624. [Google Scholar] [CrossRef]
- Harrahill, K.; Douglas, O. Framework Development for ‘Just Transition’ in Coal Producing Jurisdictions. Energy Policy 2019, 134, 110990. [Google Scholar] [CrossRef]
- Galgoczi, B. Phasing out Coal—A Just Transition Approach. SSRN J. 2019. [Google Scholar] [CrossRef]
- Garvey, A.; Norman, J.B.; Büchs, M.; Barrett, J. A “Spatially Just” Transition? A Critical Review of Regional Equity in Decarbonisation Pathways. Energy Res. Soc. Sci. 2022, 88, 102630. [Google Scholar] [CrossRef]
- Carattini, S.; Kallbekken, S.; Orlov, A. How to Win Public Support for a Global Carbon Tax. Nature 2019, 565, 289–291. [Google Scholar] [CrossRef]
- Mehleb, R.I.; Kallis, G.; Zografos, C. A Discourse Analysis of Yellow-Vest Resistance against Carbon Taxes. Environ. Innov. Soc. Transit. 2021, 40, 382–394. [Google Scholar] [CrossRef]
- Mitsch, F.; McNeil, A. Political Implications of ‘Green’ Infrastructure in One’s ‘Backyard’: The Green Party’s Catch 22? LSE International Inequalities Institute: London, UK, 2022; Available online: https://eprints.lse.ac.uk/115269/1/WP_81_political_implications_of_green_infrastructure_published.pdf (accessed on 22 December 2023).
- Crespy, A.; Munta, M. Lost in Transition? Social Justice and the Politics of the EU Green Transition. Transf. Eur. Rev. Labour Res. 2023, 29, 235–251. [Google Scholar] [CrossRef]
- Butler, J. Excitable Speech: A Politics of the Performative; Routledge: London, UK, 1997. [Google Scholar]
- Bronen, R. Climate-Induced Community Relocations: Creating an Adaptive Governance Framework Based in Human Rights Doctrine. N.Y.U Rev. Law Soc. Chang. 2012, 35, 101–148. [Google Scholar]
- Blečić, I.; Cecchini, A.; Falk, M.; Marras, S.; Pyles, D.R.; Spano, D.; Trunfio, G.A. Urban Metabolism and Climate Change: A Planning Support System. Int. J. Appl. Earth Obs. Geoinf. 2014, 26, 447–457. [Google Scholar] [CrossRef]
Figure 1.
Frequency distribution of asking prices in the metropolitan property market.

Figure 2.
Frequency distribution of asking prices in the property market of medium-sized cities.
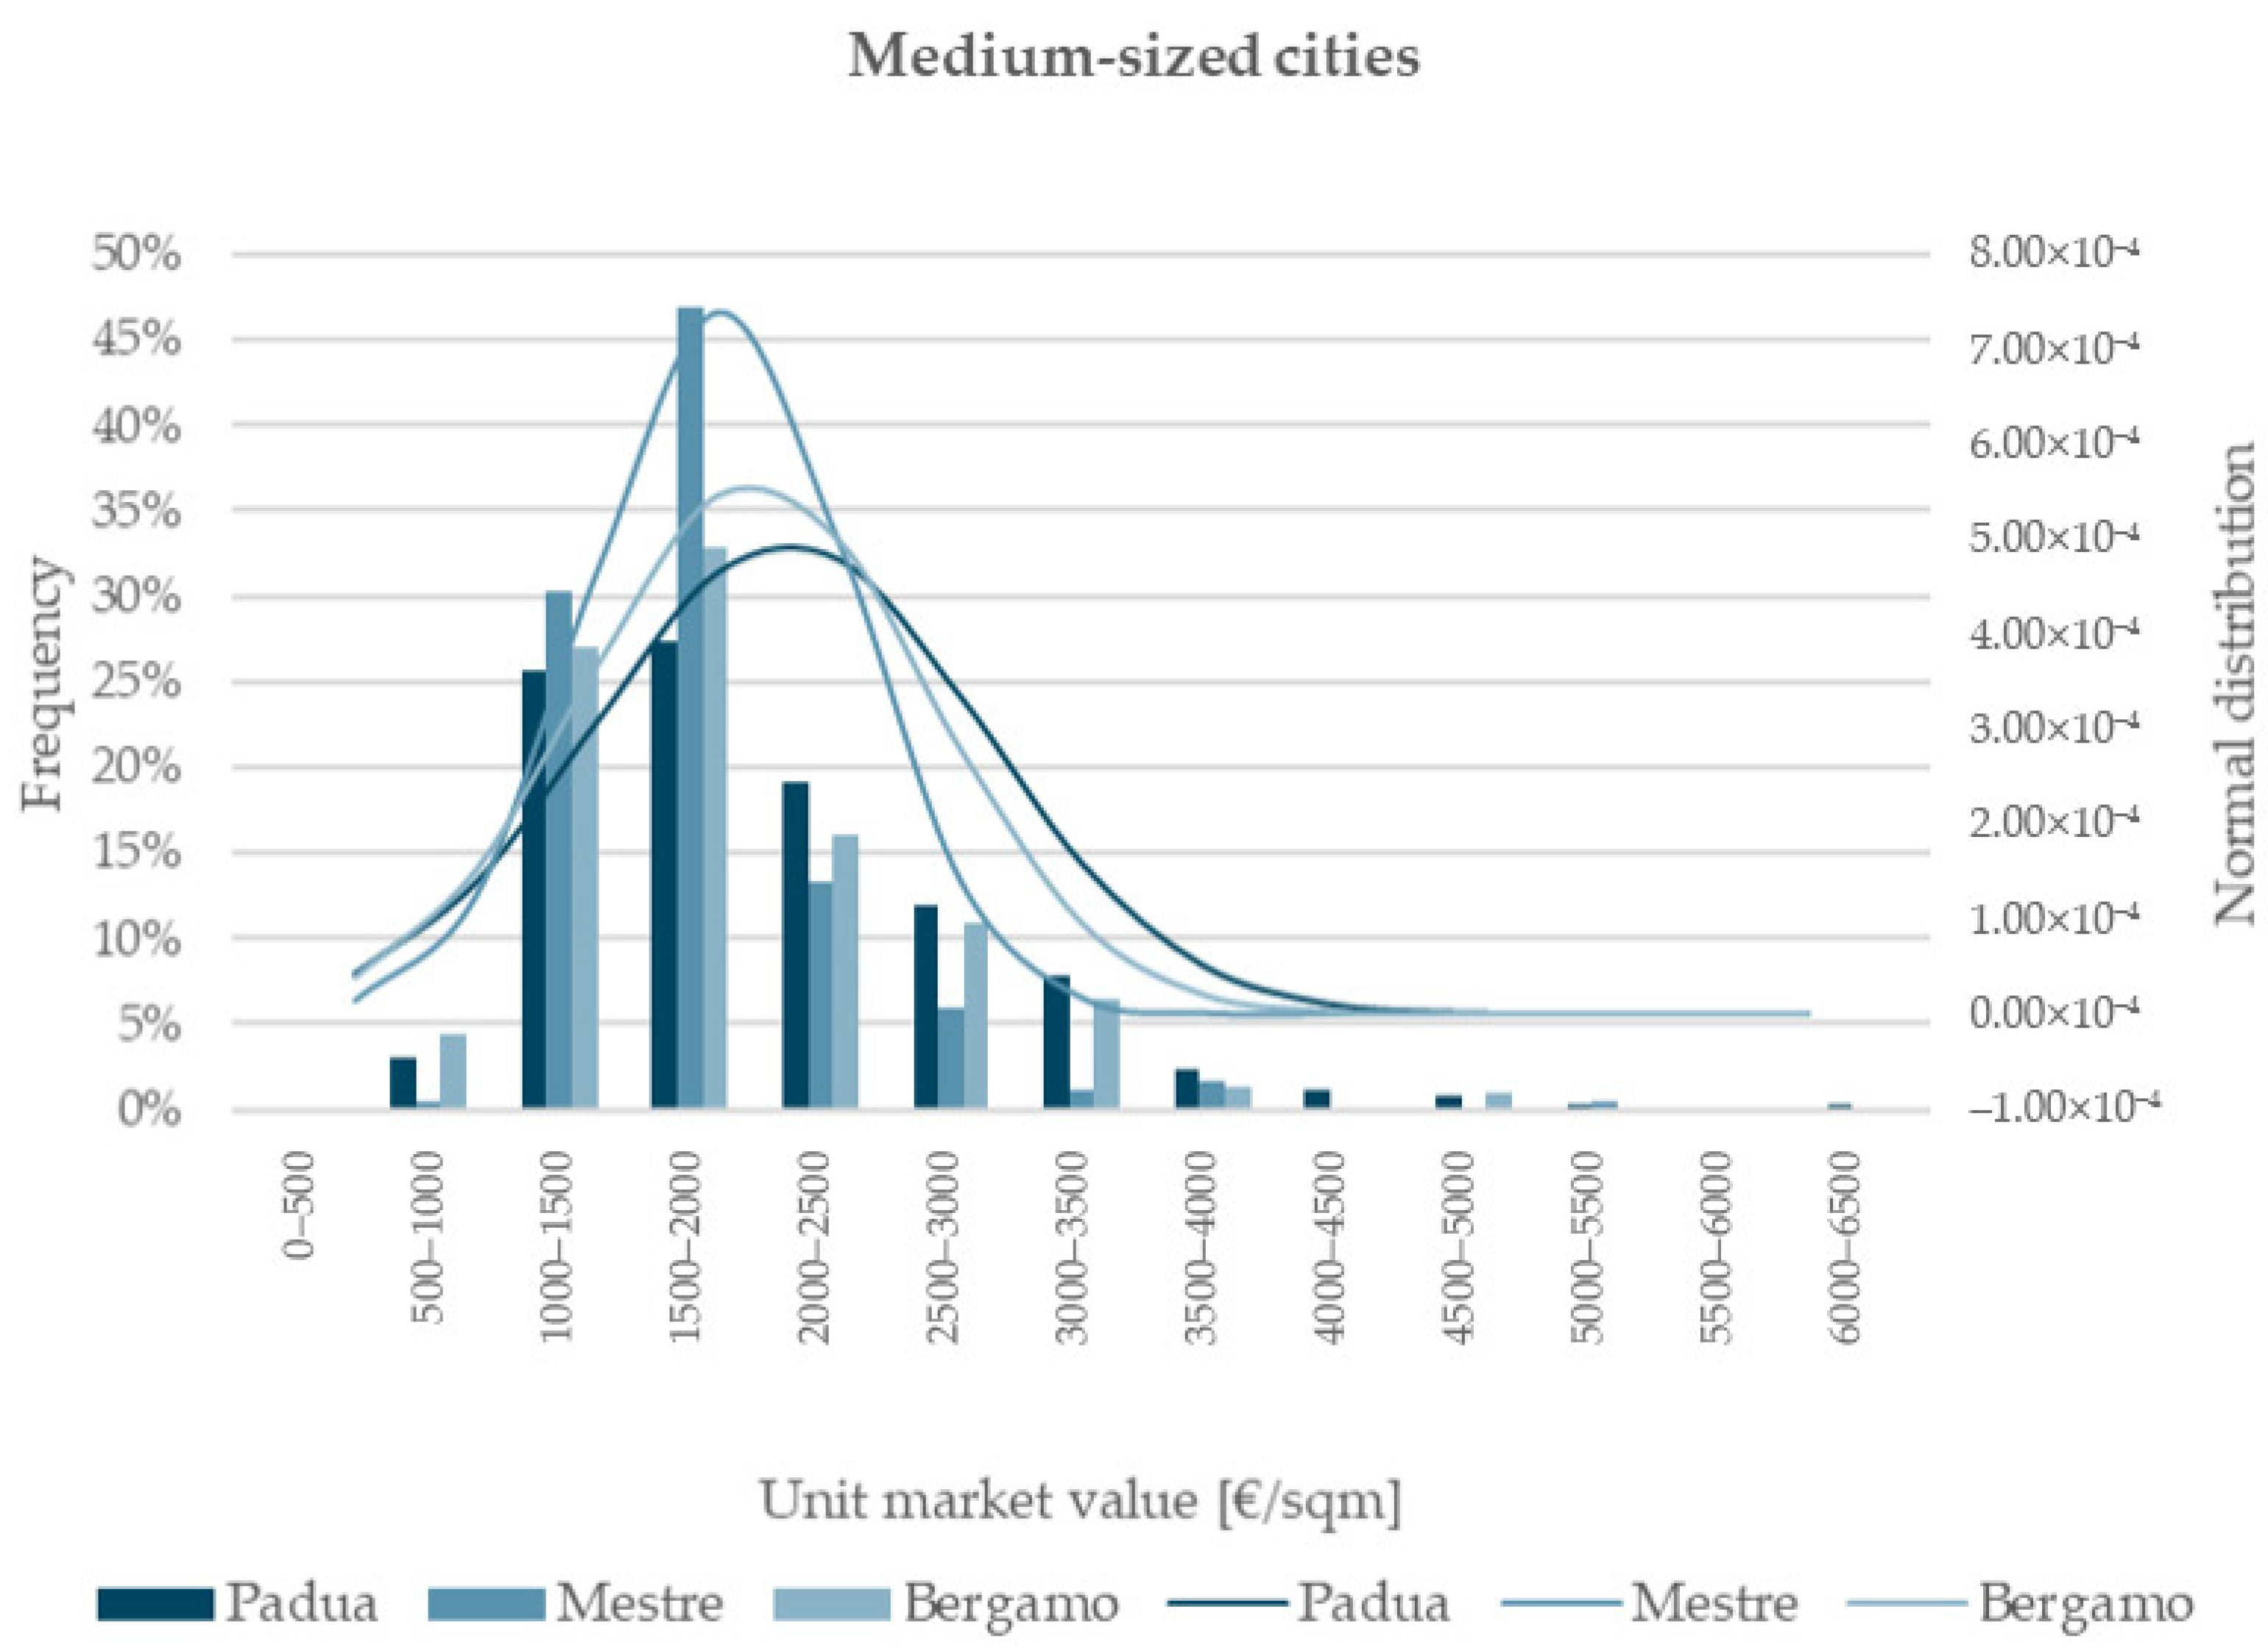
Figure 3.
Energy rating (EPC) of the sampled properties in Italy and studied cities.

Figure 4.
Variation in the value of properties in energy classes G and D, as well as in properties in energy classes G and A, across the six cities (models A).
Figure 4.
Variation in the value of properties in energy classes G and D, as well as in properties in energy classes G and A, across the six cities (models A).
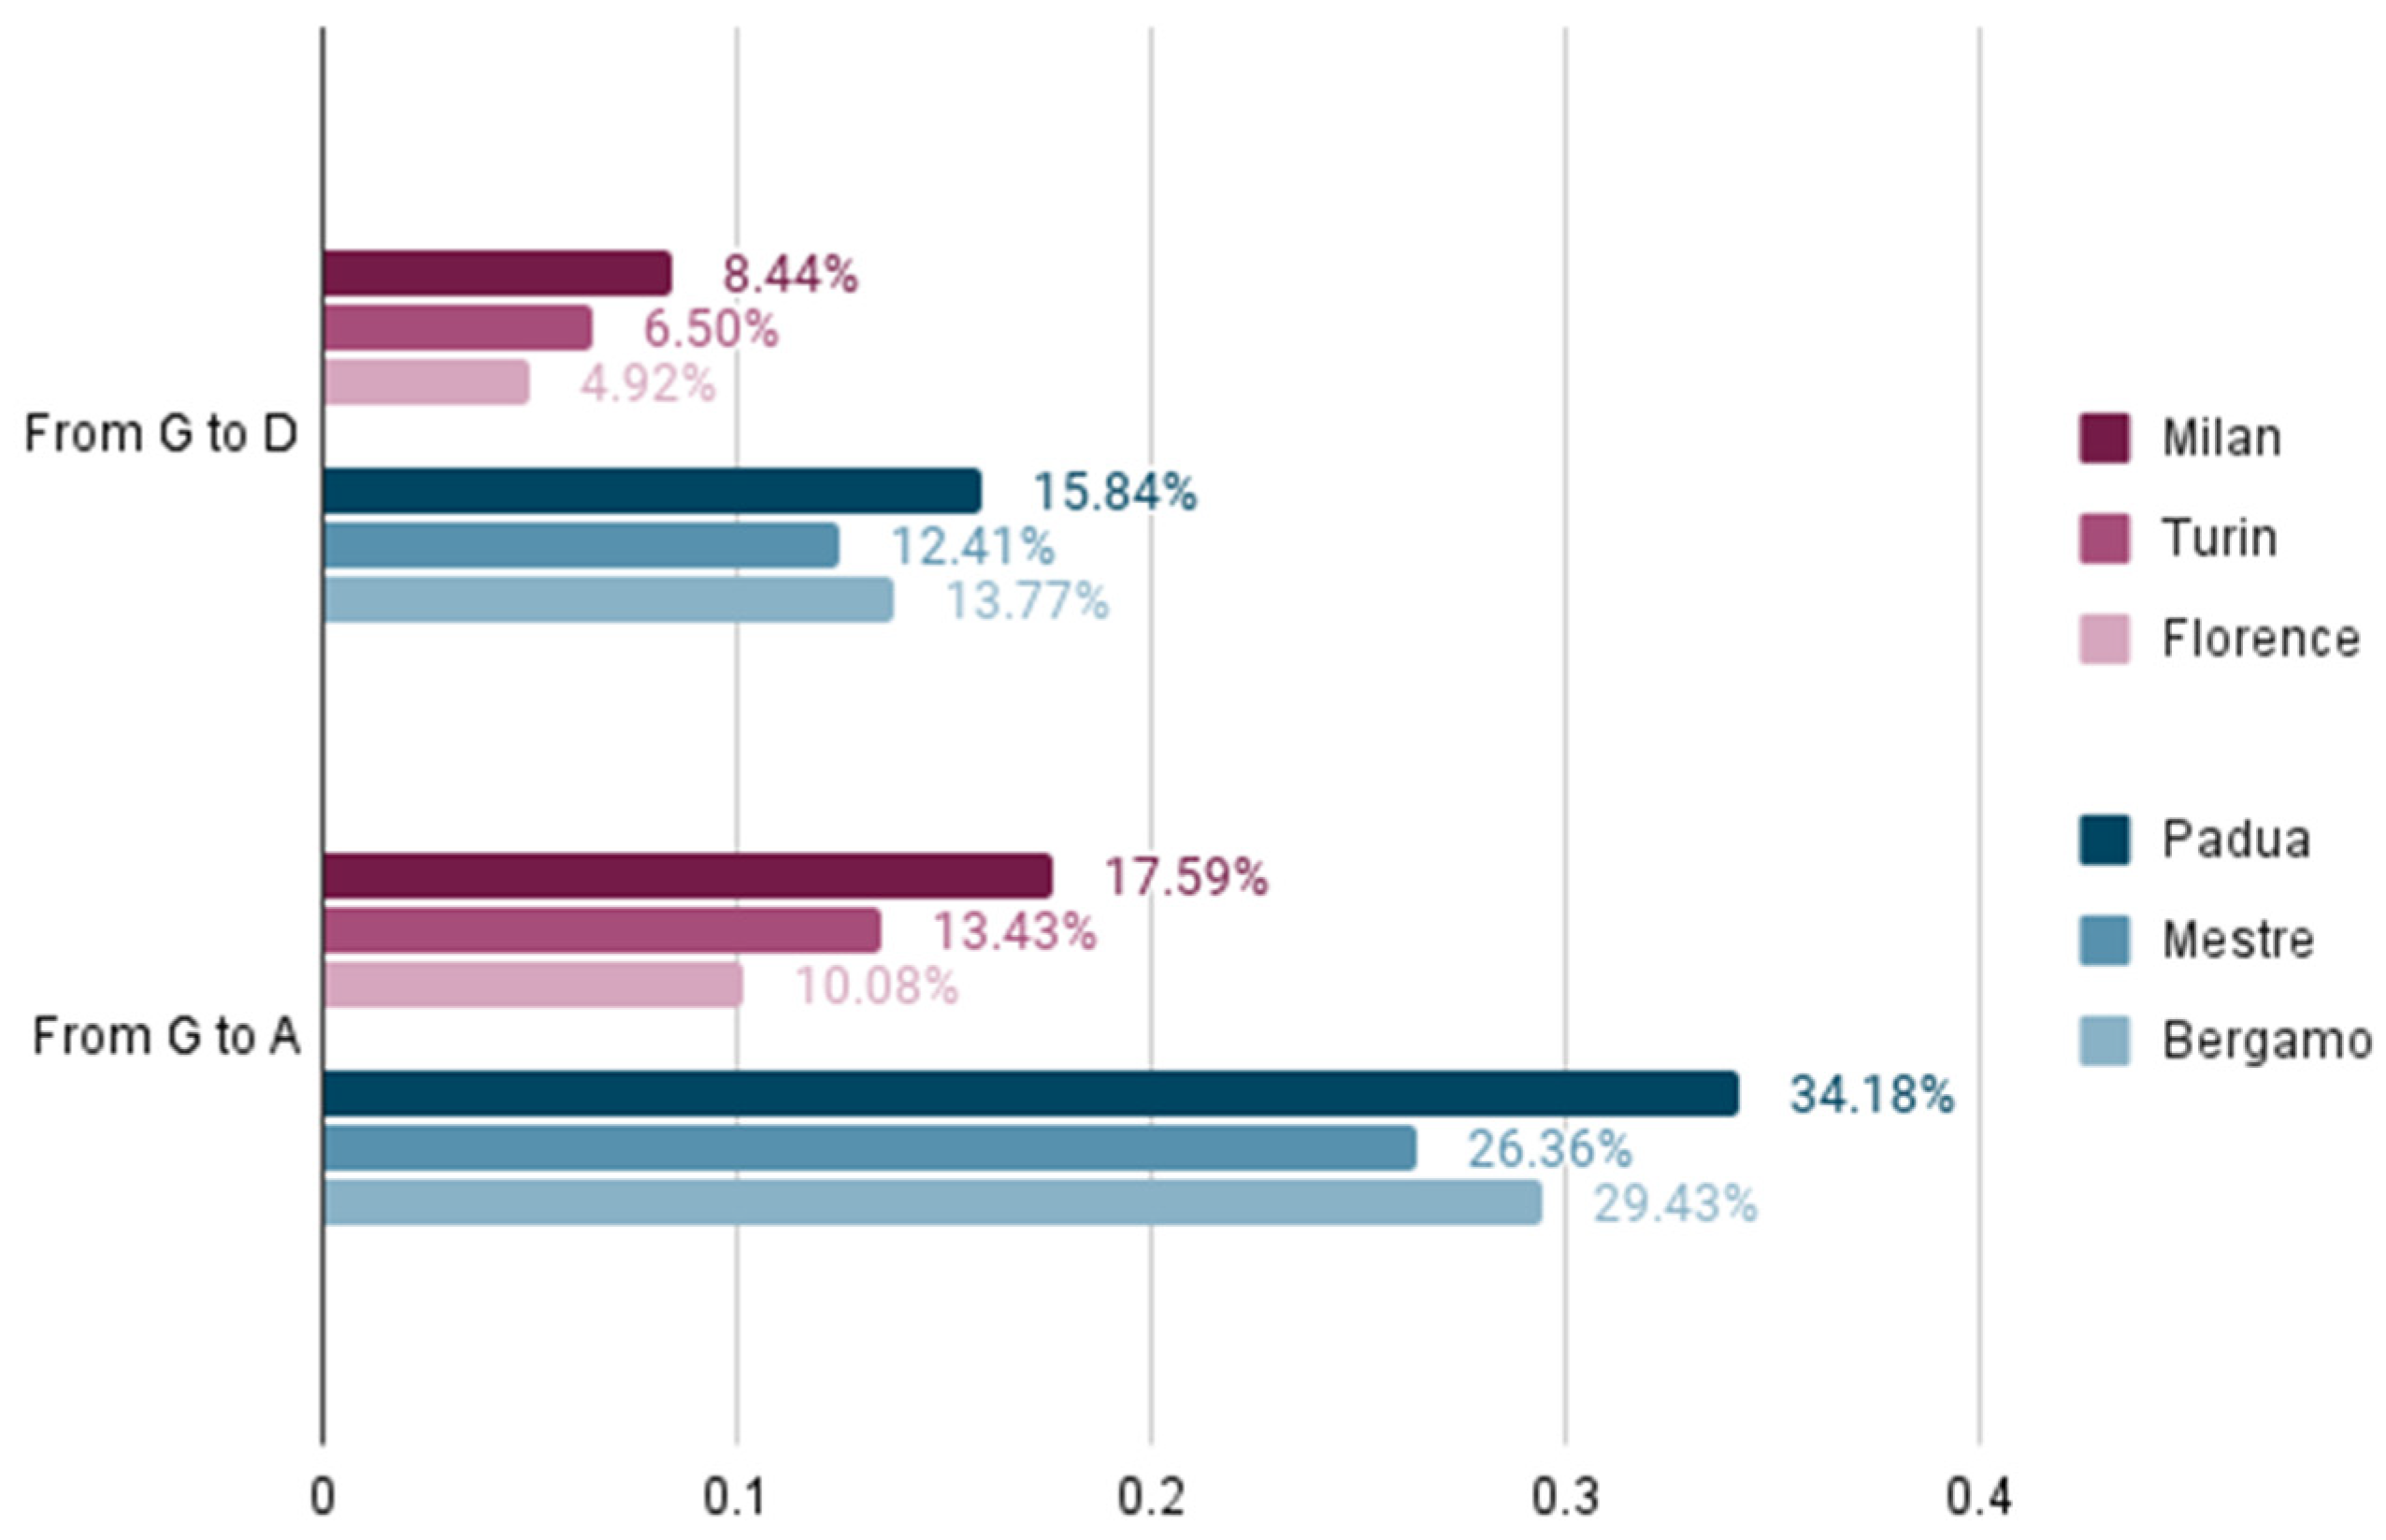
Figure 5.
Variation in the value of poorly performing properties in terms of energy efficiency (classes E/F/G) compared to moderately performing properties (classes C/D) and maximally performing properties (classes A/B) (models B).
Figure 5.
Variation in the value of poorly performing properties in terms of energy efficiency (classes E/F/G) compared to moderately performing properties (classes C/D) and maximally performing properties (classes A/B) (models B).

Table 1.
Premium price in relation to the energy efficiency of the residential market in the European countries.
Table 1.
Premium price in relation to the energy efficiency of the residential market in the European countries.
| Studies | Geographical Coverage | Premium Price |
|---|---|---|
| [11] | The Netherlands | G → D: 5% |
| [12] | Ireland | D → A: 9.3% F/G → A: 10.6% |
| [13] | Denmark | D → A: 6.6% D → G: −9.3% |
| [14] | U.K. | D → A: 5% D → G: −7% |
| [15] | Wales | D → A: 12.8% D → F: −6.5% |
| [16] | Helsinki Metropolitan Area (HMA) | D → A/B/C: 3.5% |
| [17] | Spain | E/F/G → A/B/C/D: 5.4% |
| [18] | Barcelona Metropolitan Area | G → A: 7.8% G → D: 3.3% |
Table 2.
Premium price in relation to the energy efficiency of the residential market in Italy.
| Studies | Geographical Coverage | Premium Price |
|---|---|---|
| [19] | Bolzano Bari | Class A marginal contribution: Bolzano: 45% Bari: 30% Class G marginal contribution: Bolzano: −19% Bari: −27% |
| [20] | Bolzano | Class A marginal contribution: 6.3% |
| [36] | Bari | Class A marginal contribution: 27.94% Class G marginal contribution: 26.44% |
| [37] | Reggio Calabria | Marginal contribution classes A/B: 41.52% |
| [38] | Reggio Calabria | Marginal contribution classes A/B: 29.07% |
| [39] | 13 cities in Northern Italy (Bologna, Modena, Parma, Trieste, Genoa, Bergamo, Brescia, Milan, Novara, Turin, Padua, Mestre, Verona) | G → A: 28% G → A4: 36% (Authors’ calculations based on the variation in property values according to energy classification in absolute terms, as presented by Ruggeri et al., 2023) |
| [40] | Italy | D → A/B: 12–16% E/F → A/B: 33–37% |
Table 3.
Models A.
| Global Model Test | ||||||
|---|---|---|---|---|---|---|
| Models A | R2 | Adjusted R2 | F | df1 | df2 | p-Value |
| Milan | 0.626 | 0.623 | 192.859 | 7 | 807 | <0.001 |
| Turin | 0.529 | 0.524 | 128.001 | 6 | 685 | <0.001 |
| Florence | 0.606 | 0.600 | 96.301 | 6 | 375 | <0.001 |
| Padua | 0.519 | 0.513 | 75.223 | 5 | 348 | <0.001 |
| Mestre | 0.522 | 0.512 | 54.111 | 5 | 248 | <0.001 |
| Bergamo | 0.359 | 0.348 | 32.200 | 5 | 287 | <0.001 |
df1: regression; df2: residual.
Table 4.
Models B.
| Global Model Test | ||||||
|---|---|---|---|---|---|---|
| Models B | R2 | Adjusted R2 | F | df1 | df2 | p-Value |
| Milan | 0.620 | 0.617 | 188.129 | 7 | 807 | <0.001 |
| Turin | 0.534 | 0.530 | 112.109 | 7 | 684 | <0.001 |
| Florence | 0.603 | 0.597 | 94.981 | 6 | 375 | <0.001 |
| Padua | 0.516 | 0.507 | 58.591 | 6 | 330 | <0.001 |
| Mestre | 0.520 | 0.510 | 52.041 | 5 | 240 | <0.001 |
| Bergamo | 0.349 | 0.337 | 30.542 | 5 | 285 | <0.001 |
df1: regression; df2: residual.
Table 5.
Regression models A—metropolitan cities.
| Milan | Turin | Florence | ||||
|---|---|---|---|---|---|---|
| Predictors Xi | βi | VIF | βi | VIF | βi | VIF |
| Constant | 10.306 ** | 8.827 ** | 9.357 ** | |||
| Zone | −0.314 ** | 1.242 | −0.187 ** | 1.169 | −0.177 ** | 1.055 |
| Proximity to infrastructure | −0.076 ** | 1.061 | −0.076 ** | 1.043 | −0.053 ** | 1.012 |
| Typology | - | - | 0.384 * | 1.007 | - | - |
| Property class | −0.170 ** | 1.408 | −0.139 ** | 1.309 | - | - |
| Number of bathrooms | 0.064 * | 2.413 | - | - | 0.074 ** | 1.476 |
| Surface (sqm) | −0.001 ** | 2.496 | - | - | −0.004 ** | 1.612 |
| Energy class | −0.027 ** | 1.409 | −0.021 ** | 1.693 | −0.016 * | 1.253 |
| Maintenance status | −0.036 * | 1.381 | −0.117 ** | 1.629 | −0.094 ** | 1.445 |
**, * significance at <0.01 and <0.05, respectively.
Table 6.
Regression models A—medium-sized cities.
| Padua | Mestre | Bergamo | ||||
|---|---|---|---|---|---|---|
| Predictors Xi | βi | VIF | βi | VIF | βi | VIF |
| Constant | 9.190 ** | - | 8.233 ** | - | 7.970 ** | - |
| Zone | −0.244 ** | 1.141 | - | - | −0.061 * | 1.015 |
| Proximity to infrastructure | −0.115 ** | 1.047 | −0.032 * | 1.122 | - | - |
| Typology | - | - | - | - | - | - |
| Property class | NA | - | NA | - | NA | - |
| Number of bathrooms | - | - | 0.161 ** | 1.667 | 0.275 ** | 1.834 |
| Surface (sqm) | −0.001 ** | 1.073 | −0.003 ** | 1.530 | −0.002 ** | 1.757 |
| Energy class | −0.049 ** | 1.667 | −0.039 ** | 1.537 | −0.043 ** | 1.767 |
| Maintenance status | −0.114 ** | 1.682 | −0.097 ** | 1.462 | −0.066 * | 1.789 |
**, * significance at <0.01 and <0.05, respectively; NA: not available.
Table 7.
Regression models B—metropolitan cities.
| Milan | Turin | Florence | ||||
|---|---|---|---|---|---|---|
| Predictors Xi | βi | VIF | βi | VIF | βi | VIF |
| Constant | 10.247 ** | 8.709 ** | 9.312 ** | |||
| Zone | −0.314 ** | 1.242 | −0.186 ** | 1.169 | −0.177 ** | 1.057 |
| Proximity to infrastructure | −0.076 ** | 1.064 | −0.073 ** | 1.047 | −0.052 ** | 1.014 |
| Typology | - | - | 0.392 * | 1.018 | - | - |
| Property class | −0.175 ** | 1.402 | −0.131 ** | 1.370 | - | - |
| Number of bathrooms | 0.066 * | 2.411 | 0.035 * | 1.110 | 0.074 ** | 1.476 |
| Surface (sqm) | −0.001 ** | 2.504 | - | - | −0.004 ** | 1.615 |
| Energy class | −0.074 ** | 1.413 | −0.074 ** | 1.583 | −0.043 * | 1.204 |
| Maintenance status | −0.044 ** | 1.393 | −0.112 ** | 1.558 | −0.099 ** | 1.403 |
**, * significance at <0.01 and <0.05, respectively.
Table 8.
Regression models B—medium-sized cities.
| Padua | Mestre | Bergamo | ||||
|---|---|---|---|---|---|---|
| Predictors Xi | βi | VIF | βi | VIF | βi | VIF |
| Constant | 9.091 ** | 8.447 ** | 7.846 ** | |||
| Zone | −0.236 ** | 1.123 | - | - | −0.061 * | 1.015 |
| Proximity to infrastructure | −0.117 ** | 1.050 | - | - | - | - |
| Typology | - | - | −0.226 * | 1.076 | - | - |
| Property class | NA | - | NA | - | NA | - |
| Number of bathrooms | 0.065 * | 1.958 | 0.176 ** | 1.639 | 0.286 ** | 1.841 |
| Surface (sqm) | −0.002 ** | 2.012 | −0.003 ** | 1.612 | −0.002 * | 1.757 |
| Energy class | −0.165 ** | 1.544 | −0.164 ** | 1.441 | −0.114 ** | 1.658 |
| Maintenance status | −0.123 ** | 1.622 | −0.104 ** | 1.442 | −0.083 * | 1.708 |
**, * significance at <0.01 and <0.05, respectively; NA: not available.
Table 9.
Value gaps between properties of varying efficiency. Minimum, maximum, and average (models A).
Table 9.
Value gaps between properties of varying efficiency. Minimum, maximum, and average (models A).
| Samples | From G to D | From G to A |
|---|---|---|
| Metropolitan cities (Milan, Turin, Florence) | 4.92–8.44% (average 6.62%) | 10.08–17.59% (average 13.70%) |
| Medium-sized cities (Padua, Mestre, Bergamo) | 12.41–15.84% (average 14.01%) | 26.36–34.18% (average 29.99%) |
Table 10.
Value gaps between properties of varying efficiency. Minimum, maximum, and average (models B).
Table 10.
Value gaps between properties of varying efficiency. Minimum, maximum, and average (models B).
| Samples | From E/F/G to C/D | From E/F/G to A/B |
|---|---|---|
| Metropolitan cities (Milan, Turin, Florence) | 4.39–7.68% (average 6.59%) | 8.98–15.95% (average 13.63%) |
| Medium-sized cities (Padua, Mestre, Bergamo) | 12.08–17.94% (average 15.95%) | 25.61–39.10% (average 34.51%) |
Disclaimer/Publisher’s Note: The statements, opinions and data contained in all publications are solely those of the individual author(s) and contributor(s) and not of MDPI and/or the editor(s). MDPI and/or the editor(s) disclaim responsibility for any injury to people or property resulting from any ideas, methods, instructions or products referred to in the content. |
© 2024 by the authors. Licensee MDPI, Basel, Switzerland. This article is an open access article distributed under the terms and conditions of the Creative Commons Attribution (CC BY) license (https://creativecommons.org/licenses/by/4.0/).
Share and Cite
MDPI and ACS Style
Micelli, E.; Giliberto, G.; Righetto, E.; Tafuri, G. Urban Disparities in Energy Performance Premium Prices: Towards an Unjust Transition? Land 2024, 13, 224. https://doi.org/10.3390/land13020224
AMA Style
Micelli E, Giliberto G, Righetto E, Tafuri G. Urban Disparities in Energy Performance Premium Prices: Towards an Unjust Transition? Land. 2024; 13(2):224. https://doi.org/10.3390/land13020224
Chicago/Turabian StyleMicelli, Ezio, Giulia Giliberto, Eleonora Righetto, and Greta Tafuri. 2024. "Urban Disparities in Energy Performance Premium Prices: Towards an Unjust Transition?" Land 13, no. 2: 224. https://doi.org/10.3390/land13020224
Note that from the first issue of 2016, this journal uses article numbers instead of page numbers. See further details here.