
Spatial Differentiation of Ecotourist Perceptions Based on the Random Forest Model: The Case of the Gansu Section of the Yellow River Basin

1
College of Earth and Environmental Sciences, Lanzhou University, Lanzhou 730000, China
2
School of Architecture & Urban Planning, Shenzhen University, Shenzhen 518060, China
*
Author to whom correspondence should be addressed.
Land 2024, 13(4), 560; https://doi.org/10.3390/land13040560
Submission received: 27 March 2024
/
Revised: 14 April 2024
/
Accepted: 18 April 2024
/
Published: 22 April 2024
Abstract
:Ecotourism is vital for coordinating regional ecological protection with socio-economic development. The Gansu section of the Yellow River Basin is a typical ecologically fragile area in China, and it holds a distinctive position in ecological protection and high-quality development. This study explores spatial differentiation in ecotourist perceptions and their distinct effects on ecotourist satisfaction, revisitation, and recommendation. It uses four cities (Gannan, Linxia, Lanzhou, and Baiyin) in the Gansu section of the Yellow River (mainstream) as examples, employing a questionnaire survey to collect ecotourists’ perception data and applying a random forest model and one-way ANOVA for analysis. It was found that: (1) rich ecotourism potential exists in the Gansu section of the Yellow River Basin as an ecologically fragile area; (2) there is spatial differentiation in ecotourist perceptions, and among the four regions, Baiyin stands out for its nature and atmosphere perception, and Lanzhou excels in accessibility and service perception; (3) spatial disparities exist in the influencing factors of ecotourist satisfaction, revisitation, and recommendation. Ecotourists in districts with unique natural resources, such as Gannan and Baiyin, prioritize nature perception, whereas districts with abundant natural resources and an established foundation for ecotourism development, such as Linxia and Lanzhou, emphasize service and atmosphere perception. This study constructs a new research framework to explore spatial variations in ecotourists’ perceptions, assisting ecotourism destinations to meet the needs of ecotourists from the supply side, and presents distinctive strategies and recommendations for the development of ecotourism in similar ecologically fragile areas.
1. Introduction
In recent years, with the increasing prominence of global ecological environmental issues and the growing emphasis on sustainable development in society, ecotourism has gradually become a focal point as an environmentally friendly and culturally integrated travel mode [1,2]. International experiences indicate that the development of ecotourism can effectively conserve natural landscapes and ecosystems; simultaneously, it can drive regional economic development, and alleviate insufficient funding for public activities such as resource conservation, environmental education, and recreation in underdeveloped areas [3,4,5,6]. The development of ecotourism is considered an effective approach to achieving the dual goals of effective conservation of lucid waters and lush mountains, and transitioning towards invaluable assets [5,7].
Ecotourist perceptions play a significant role in destination management. They reflect the subjective evaluation of the quality of their tourism experience [8]. This insight equips destination managers with precise targeting of market segments and effective strategies for optimizing distinctive ecotourism products and services. Consequently, destinations can better meet tourists’ needs from the supply side, thereby enhancing their overall appeal [9,10]. Simultaneously, positive tourism perceptions contribute to “Place Attachment”, wherein ecotourists recognize the environment’s significance, thereby fostering their pro-environmental behavior [11,12]. By examining spatial variations among ecotourist perceptions from a geographical perspective, destination managers can facilitate comparative destination studies, enabling the implementation of regional differentiation strategies to mitigate homogenized competition among tourist destinations. A comprehensive assessment of spatial differentiations in ecotourist perceptions is advantageous for the development of local ecotourism.
In globally ecologically fragile areas, the increasing influx of tourism activities imposes a substantial burden on ecosystems [13], jeopardizing destinations’ environmental sustainability [14]. Ecotourism development represents the prime opportunity for developing in such areas, effectively addressing the conflict between tourism and environmental conservation. This approach, premised on ecosystem protection and appropriate development, fosters local economic growth [15,16].
Therefore, this study focuses on sustainable tourism development in ecologically fragile areas, taking the Gansu section of the Yellow River Basin in China as an example, to investigate spatial differentiation among ecotourist perceptions and their distinct effects on ecotourist satisfaction, revisitation, and recommendation in different regions. Using questionnaire survey data, the study first analyzes ecotourist perceptions in different regions using one-way analysis of variance. Secondly, it assesses the importance ranking of factors influencing ecotourists’ satisfaction, revisitation, and recommendation using a random forest model. This study aims to establish a new methodological framework for ecotourism by introducing the concept of spatial differentiation. It seeks to uncover the spatial differences in ecotourist perceptions, elucidate the interactive dynamics between ecotourists and destinations, enrich the research content on ecotourist perceptions, and provide a case reference for achieving sustainable tourism development in globally ecologically fragile areas. Additionally, although this study focuses on a specific region, the methodological framework constructed is not limited to specific cultural or geographical backgrounds. The methodological framework has certain guiding significance for the development of ecotourism in globally ecologically fragile areas, contributing to the supply side reform and high-quality development of the global ecotourism industry.
2. Literature Review
In 1983, H. Ceballos Lascurian, the special advisor to the International Union for Conservation of Nature (IUCN), first introduced the concept of ecotourism. Subsequently, ecotourism was defined by The International Ecotourism Society (TIES) as “responsible travel to natural areas that conserves the environment, sustains the well-being of the local communities, and involves interpretation and education” [17]. In the mid to late 20th century, the rapid development of tourism posed a significant threat to the global environment. In response to the contradictions between tourism development and environmental protection, ecotourism emerged as a thoughtful response [18]. Since the rise of the concept of ecotourism, scholars initially researched its definition [3,19] and development models [20,21]. This gradually shifted towards studying the factors to consider for ecotourism development [22,23] and the development of ecotourism resource [24,25,26]. Tourist perception, as a crucial research topic in tourism studies, has reached a level of maturity in academia. However, investigating the perception of ecotourism in the context of contemporary issues holds significant relevance in the new era.
Currently, scholars’ research on ecotourism perception primarily focuses on the destination image of ecotourism [27,28], the influence of tourist perception on tourist loyalty in ecotourism destinations [29,30], tourists’ spatial perception in ecotourism destinations [31,32], ecotourism social media initiatives [33], ecotourism development factors such as stakeholder collaboration [22,34], and ecotourism resources including distinct cultural heritage and unique natural environment [35,36]. Specifically, research on ecotourism spatial differentiation mainly centers around the spatiotemporal behavior pattern differentiation of tourists [37], spatial characteristics of cooperation among tourist attractions [38], and studies on resident perception differences [39,40,41]. Research methods employed in ecotourism perception mainly include text analysis [42], social network analysis [2,32], importance–performance analysis (IPA) [40], structural equation modeling [30,41,43,44], etc. Overall, scholars have made significant progress in the study of ecotourism perception, but there are also some shortcomings. Firstly, existing evaluation methods often overlook complex linear relationships among evaluation factors, and research techniques need further improvement. The application of the random forest model in machine learning facilitates the calculation of nonlinear interactions between variables and is relatively underutilized in the field of tourist perception. Secondly, current research tends to analyze the perception of ecotourism destinations, with limited attention to ecotourists specifically. This paper takes ecotourists as a specific group of interest for research. Thirdly, tourist perception is influenced by spatial factors, and the differences between various tourism destinations result in diverse perceptions. However, few scholars have investigated the spatial differentiation of perceptions among ecotourists. Therefore, this paper introduces the concept of spatial differentiation to gain in-depth insights into the uniqueness of ecotourist perceptions under different regional differentiations, analyzing the perception differences of ecotourists.
3. Study Area and Data Source
3.1. Study Area
The Yellow River Basin is the cradle of Chinese culture and a significant birthplace of Chinese civilization [45]. It also serves as a crucial ecological barrier and economic zone in China [46,47]. The Gansu section located in the upper reaches of the Yellow River is an essential ecological conservation area for the entire basin and the nation. It stands as the core region for political, economic, historical, and cultural development; holding vital significance for the ecological security and socio-economic development of the entire basin [48]. However, over an extended period, the influence of factors such as location, history, and policies, has caused the ecological environment in the basin to be fragile; leading to severe issues such as water scarcity, worsening water pollution, grassland degradation, land desertification, and a sharp decline in biodiversity [4,49,50]. These problems significantly impact the ecological functions of the Yellow River and the regional socio-economic development. Developing a low-carbon green economy and promoting the coordinated development of the regional economy and ecology in the Yellow River Basin has become the consensus in academic circles.
Gansu Province is situated at the convergence zone of the Loess Plateau, the Qinghai–Tibet Plateau, and the Inner Mongolian Plateau. Located in the upper reaches of the Yellow River, its unique geographical position endows it with crucial ecological functions, such as conserving water sources, preventing wind and sand erosion, preserving biodiversity etc.; therefore, Gansu plays a pivotal role in ensuring national ecological security [51]. With a vast territory and a broad geographical span, Gansu has complex and varied geomorphic and climatic types, offering abundant natural landscape and tourism resources. Additionally, the routes of the Silk Road traverse the entire province, from west to east, leaving behind numerous historical and cultural legacies [52].
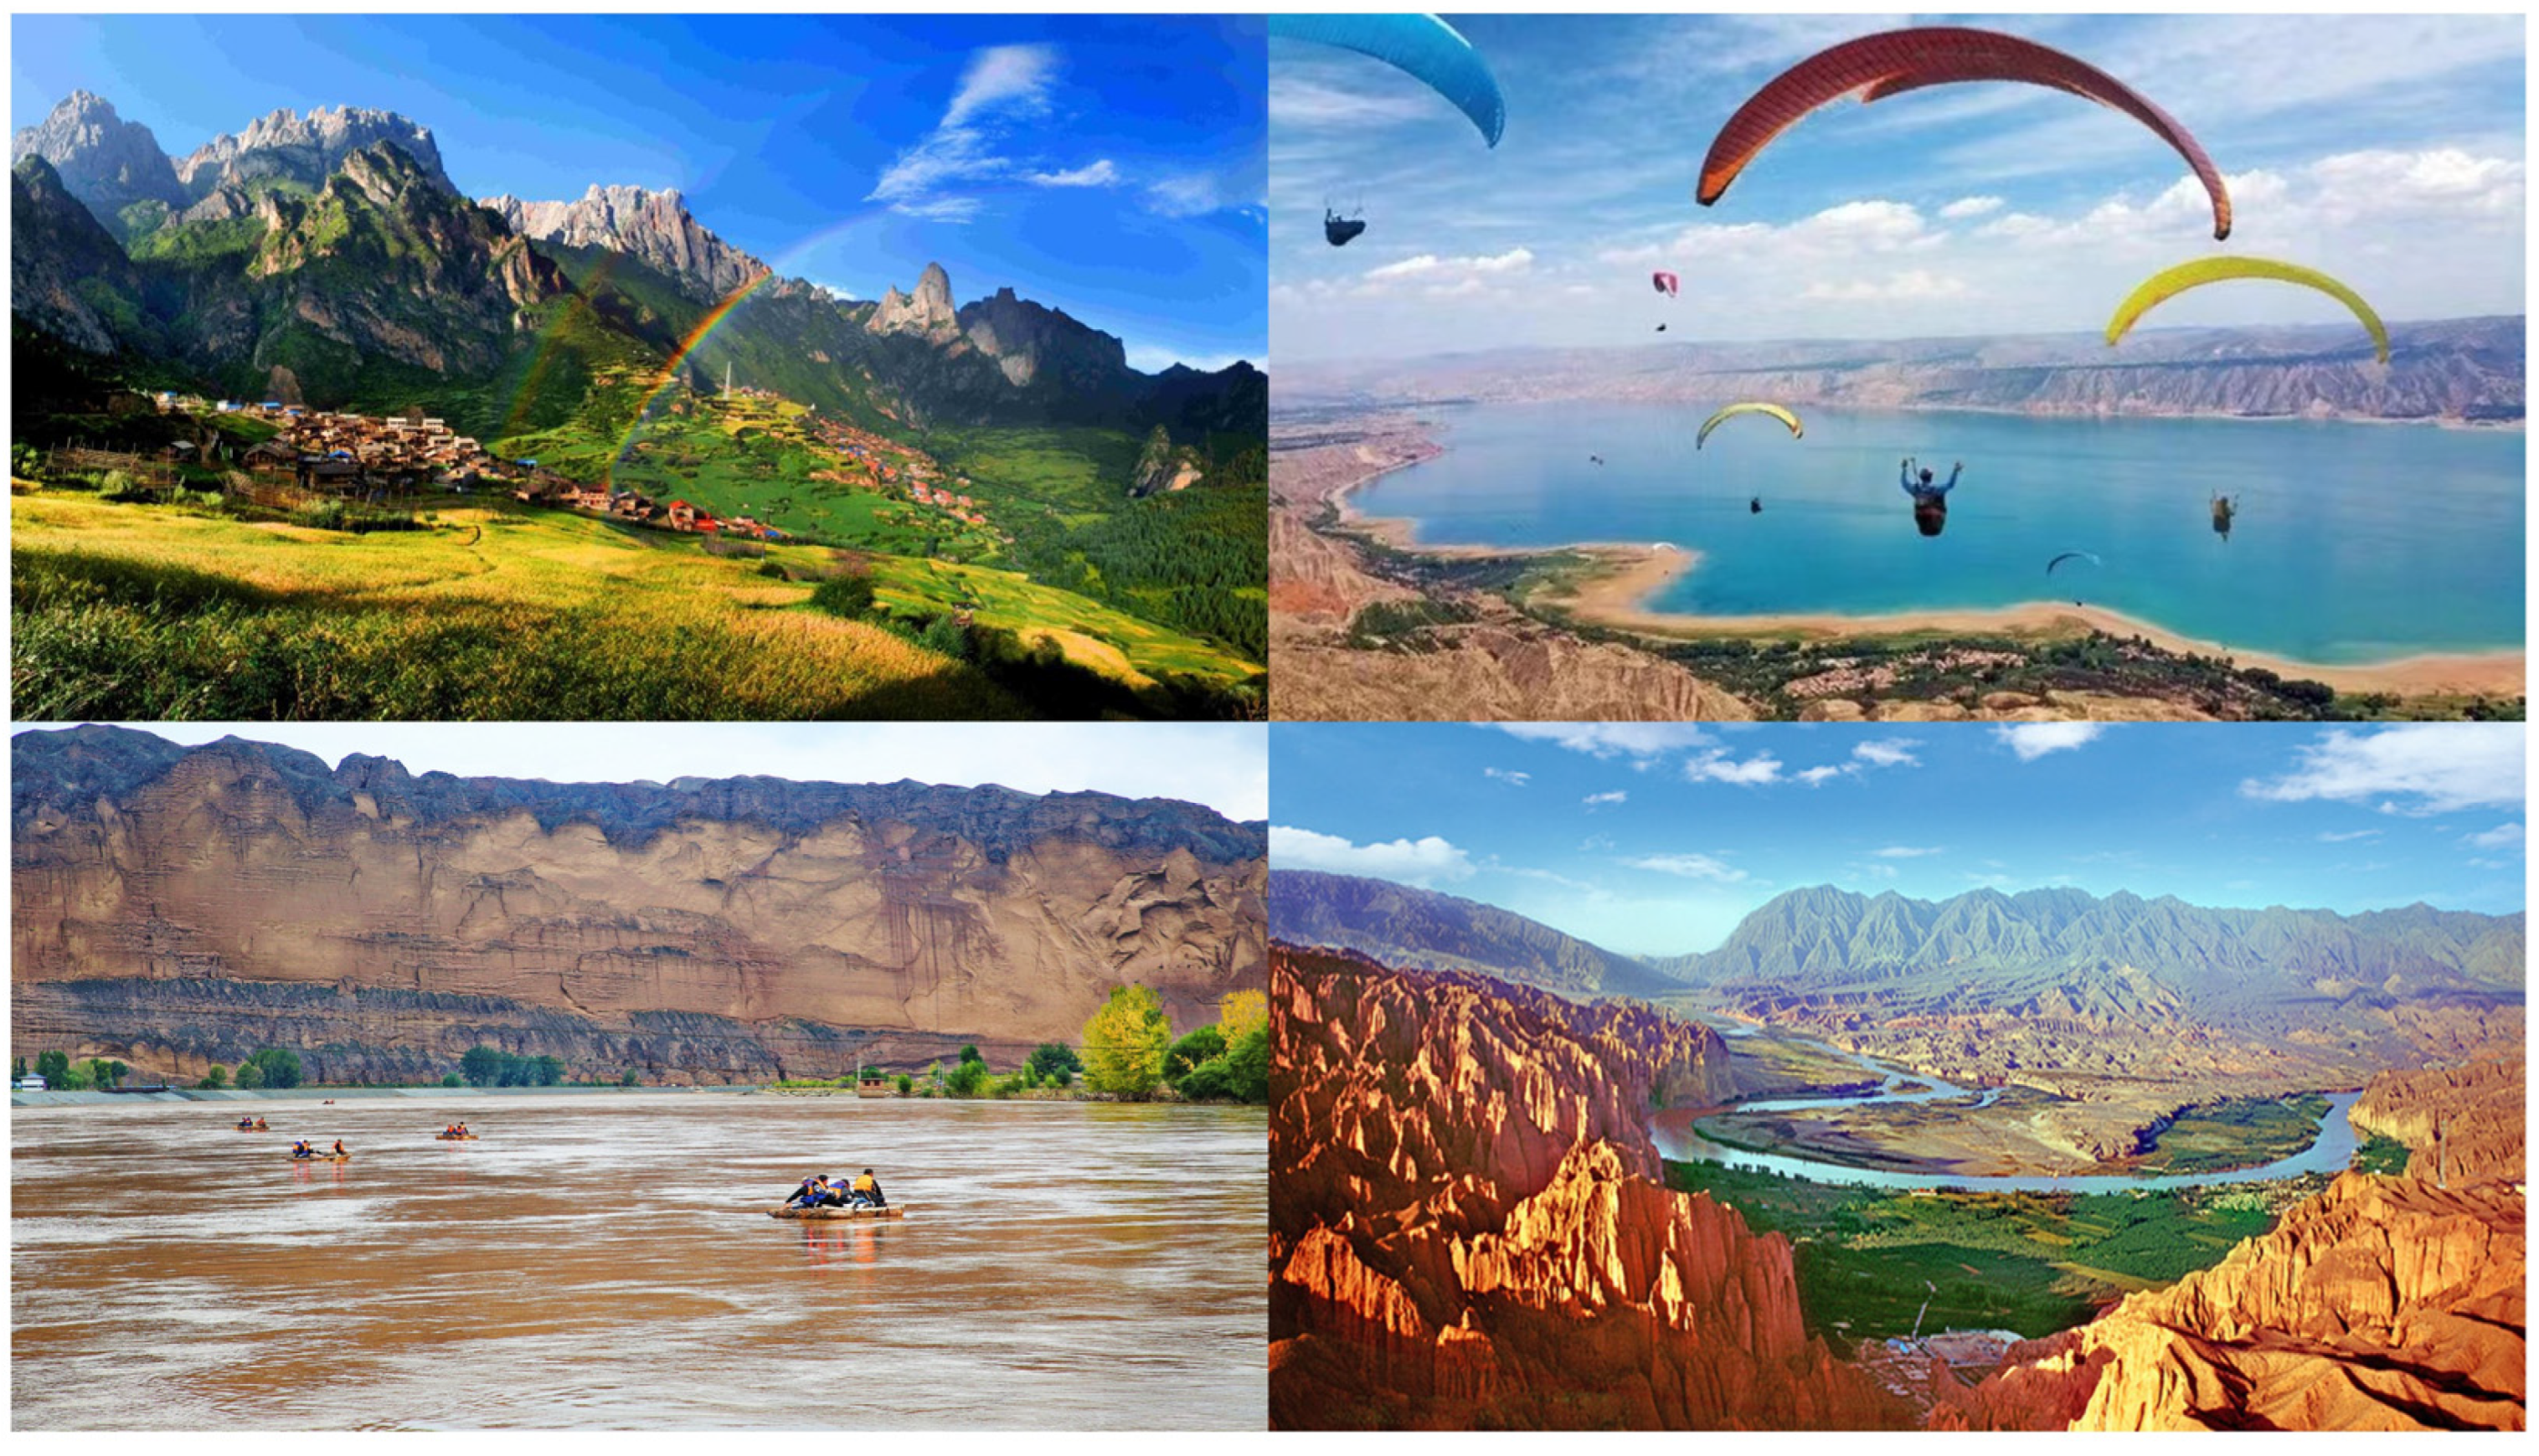
The Yellow River flows through Gansu Province for over 900 km, constituting 16.7% of the total length of the Yellow River. Cities along the mainstream in Gansu include Gannan (GN, excluding some areas of Diebu County and Luqu County), Linxia (LX), Lanzhou (LZ), and Baiyin (excluding some areas of Jingtai County). Figure 1 depicts an overview of the study area, illustrating the distribution of tourist attractions in the Gansu section of the Yellow River Basin, categorized by tourism grades in China, including national 5A, 4A, 3A, 2A, and A-level (the grades are ranked from highest to lowest). Furthermore, the region boasts rich ecotourism resources, encompassing 15 natural reserves, six national geological parks, 11 national forest parks, one national mining park, and two national wetland parks (some of these are depicted in Figure 2).
3.2. Data Sources
3.2.1. Fundamental Data
The Yellow River Basin boundary data used in this study were sourced from the China Knowledge Centre for Engineering Sciences and Technology (http://www.ckcest.cn, accessed on 15 April 2024)) [53], while the data on prefecture-level administrative boundaries were obtained from the Resource and Environmental Science Data Platform (http://www.resdc.cn, accessed on 15 April 2024) [54].
3.2.2. Remote Sensing Data
The study utilized the 2021 global land cover data with a 10 m resolution released by Esri. This dataset, generated from imagery captured by the European Space Agency’s (ESA) Sentinel-2 satellite, employed artificial intelligence (AI) techniques to train on billions of manually labeled pixels, achieving an overall accuracy of 85%.
3.2.3. Questionnaire Data
The questionnaire comprised four sections. The first part provided instructions, assuring respondents of the questionnaire’s anonymity, strict confidentiality of obtained data, and a brief explanation of the research purpose. The second part covered the demographic characteristics of the sample population, including gender, age, education level, occupation, and monthly income. The third part focused on respondents’ knowledge of ecotourism, while the fourth part constituted the main body of the questionnaire, encompassing five variable modules: nature perception, accessibility perception, service perception, atmosphere perception, and overall perception; measured using a Likert 5-point scale.
The survey was conducted from 1 to 7 October 2021, in tourist attractions located across four regions: Gannan, Linxia, Lanzhou, and Baiyin. Tourists visiting these sites had the option to complete our paper questionnaires, which were distributed on site; or to fill out electronic versions by scanning QR codes provided through the Questionnaire Star platform. A total of 1266 questionnaires were collected, including 1146 electronic questionnaires (336 from Gannan, 127 from Linxia, 495 from Lanzhou, and 188 from Baiyin) and 120 paper questionnaires (30 from each location). After screening, 987 of these were judged legitimate for analysis (290 from Gannan, 127 from Linxia, 399 from Lanzhou, and 199 from Baiyin), with an effective rate of 80.17%.
The main object of study is the ecotourist. Given the variance in educational levels and cognitive awareness between developing and developed nations, fostering ecotourism consciousness poses a challenge in developing countries. Moreover, as China is in the early stages of ecotourism development, only a minority engage in practices aligned with its principles. Thus, our research focuses more on the cultivation of ecotourism awareness among Chinese tourists. To this end, we prepared one screening questions to ask the subjects. “Did you know about ecotourism?” The subject was not included in the study if their response was negative, regarding people who know about ecotourism as ecotourists in this study. Of the 987 valid questionnaires, only 532 were ecotourists (176 from Gannan, 64 from Linxia, 205 from Lanzhou, and 87 from Baiyin). Using SPSS 20.0 to test the reliability and validity of the questionnaire, with a Cronbach’s α of 0.855 for the overall scale, KMO value of 0.84, and Bartlett’s test approximate chi-square value of 5134.47; significance at the 0.001 level was reached, indicating good reliability and validity of the questionnaire and the model was suitable for further investigation.
4. Methods
4.1. Ecotourist Perception Evaluation Index System
Building upon previous studies, we have adopted a set of indicators widely recognized in similar studies to establish an evaluation index system of ecotourist perception for our research. The evaluation index system mainly includes four aspects: nature perception, accessibility perception, service perception, and atmosphere perception (Table 1). Specifically, the indicators selected for nature perception are the air freshness, water clarity, and vegetation coverage [55,56]; accessibility perception incorporated external and internal accessibility [55,57]; service perception considered the distribution of sanitation facilities and ecological protection measures [58,59]; atmosphere perception included nature-based activities and ecotourism offerings [59,60]. Overall perception was measured in terms of satisfaction [43], revisitation [61], and recommendation [29,58].
4.2. One-Way ANOVA
Utilizing one-way ANOVA is conducive to gaining insights into whether there are significant differences in ecotourist perceptions among different regions. For this analysis, considering cities as an independent variable, nature, accessibility, service, and atmosphere perception were grouped as a dependent variable. The test was carried out to determine whether ecotourist perceptions among different regions have significant differences while testing the null (H0) and alternative (H1) hypotheses. The null hypothesis (H0) posits that there are no significant differences between ecotourist perceptions among different regions, whereas the alternative hypothesis (H1) asserts that there exist at least two groups with significantly different means. If the p-value obtained from the one-way ANOVA test is less than a predetermined significance level (usually α = 0.05), the null hypothesis (H0) can be rejected and, consequently, it is concluded that there are significant differences between ecotourist perceptions among different regions. If the p-value is greater than α, this suggests there is no significant difference [62].
4.3. Random Forest Models (RF)
Machine learning, which is known for its high result accuracy and precision, has been widely applied in various research [63]. Among these, the random forest model (RF) demonstrates high tolerance to noise and outliers, making it less prone to overfitting and ensuring high predictive accuracy and great robustness [64]. Additionally, RF can handle high-dimensional data with multicollinearity, making it effective in handling nonlinear and non-Gaussian problems [65]. The model requires minimal preprocessing during data processing, offering advantages such as high computational efficiency, minimal parameter tuning, etc. The model has been widely promoted and applied in numerous research fields, addressing the limitations of existing research methods on the ecotourism perception.
The random forest model is an ensemble algorithm based on decision trees, and is applicable for classification and regression, as introduced by Breiman [65]. The following section introduces the principles of decision trees and random forests, as well as the specific process of data processing in this study.
4.3.1. Decision Trees
For a decision tree, the goal is to learn a better tree structure for a given set of samples to support better classification of the samples.
We assume that there exists a sample set with samples, each sample being an n-dimensional vector, namely , . For this sample set, there exists a label set . Then a decision tree recursively partitions the feature space such that the samples with the same labels or similar target values are grouped together.
During a node split of a decision tree, assuming that the current node has samples, the algorithm selects one of the remaining features of these samples and determines a threshold to divide these samples into left and right parts. Namely, is the splitting scheme.
For the selection of the decision tree node splitting scheme, the algorithm calculates the Gini impurity of all the splitting schemes and selects the one with the greatest reduction in Gini impurity before and after splitting for execution. For a candidate split scheme, the Gini impurity is calculated as follows.
In the formula above, is the impurity function to compute the split quality of the candidate scheme . For node splitting of each tree, the optimization objective of the algorithm can be summarized as finding parameters to minimize the impurity of the nodes after splitting.
Taken as a whole, the algorithm will invoke node splitting recursively for subsets and until the maximum allowable depth is reached, or .
4.3.2. Random Forest
Random forests derive their name from two random properties inherent in the algorithm. Firstly, random sampling: during the construction of each tree, random forest utilizes bootstrap sampling to randomly select samples from the original training dataset for each tree; a technique known as bagging. This process may result in duplicate samples within the training dataset for each tree, with some samples from the original data potentially absent in the training set for a specific tree. Secondly, random feature selection: when splitting each decision tree node, the algorithm randomly chooses a subset of all features and identifies the best splitting point solely among these randomly selected features. This approach not only mitigates the risk of overfitting but also enhances model diversity. These two forms of randomness ensure the diversity of decision trees within the RF, thereby enhancing the model’s generalization capability, reducing overfitting, and bolstering overall robustness.
Random forest is an ensemble algorithm that constructs multiple distinct decision trees through the aforementioned randomnesses, serving as weak classifiers, with the final outcome being determined collectively by them. In this study, the final classification result of a random forest is determined by averaging the classification probabilities of the decision trees within the forest.
4.3.3. Overall Procedure
In this study, we employed lattice search for hyperparameters, which necessitated a large number of model calculations. Therefore, Python was utilized to implement the specific code for the random forest model.
In the experiments used in this study, data cleaning was conducted initially; this involved outlier removal from questionnaire data. The DBSCAN algorithm was employed for outlier detection; where samples not belonging to any class were considered outliers, only very few outliers are removed. Following data cleaning, we used the imbalanced-learn machine learning library’s oversampling technique to balance the samples, mitigating overfitting issues due to imbalanced sample distribution. Subsequently, we determined the hyperparameters to be set in the model. Since it is not possible to directly determine the optimal values of the individual hyperparameters, we limited the hyperparameters to a range and generated the Cartesian product for possible combinations of parameters within that range. After completing the preparation of data and parameters, the data were randomly split with a ratio of 3:1 for training and testing. We designed parallel programs using Python to compute all combinations and record the F1 scores of the training and test sets l (Figure 3).
The RF classification model was employed in this study, which can quantitatively assess each explanatory variable’s contribution to the classification results [66]. After completing the computation of all models, we selected the one with the best F1 score for the test set as the final model. Based on the values of the contribution (Gini importance), we quantified and ranked the relative importance of the driving factors of ecotourist satisfaction, revisitation, and recommendation. The variable with the highest importance value was considered “the dominant driver”.
5. Result Analysis
5.1. The Identification and Classification of Ecotourism Attractions
Given that the study area is an ecologically fragile region in the early stage of ecotourism development, rather than a fully established ecotourism destination, an analysis of land use proves benefits for assessing ecotourism resources from a supply-side perspective and determining the feasibility of ecotourism development.
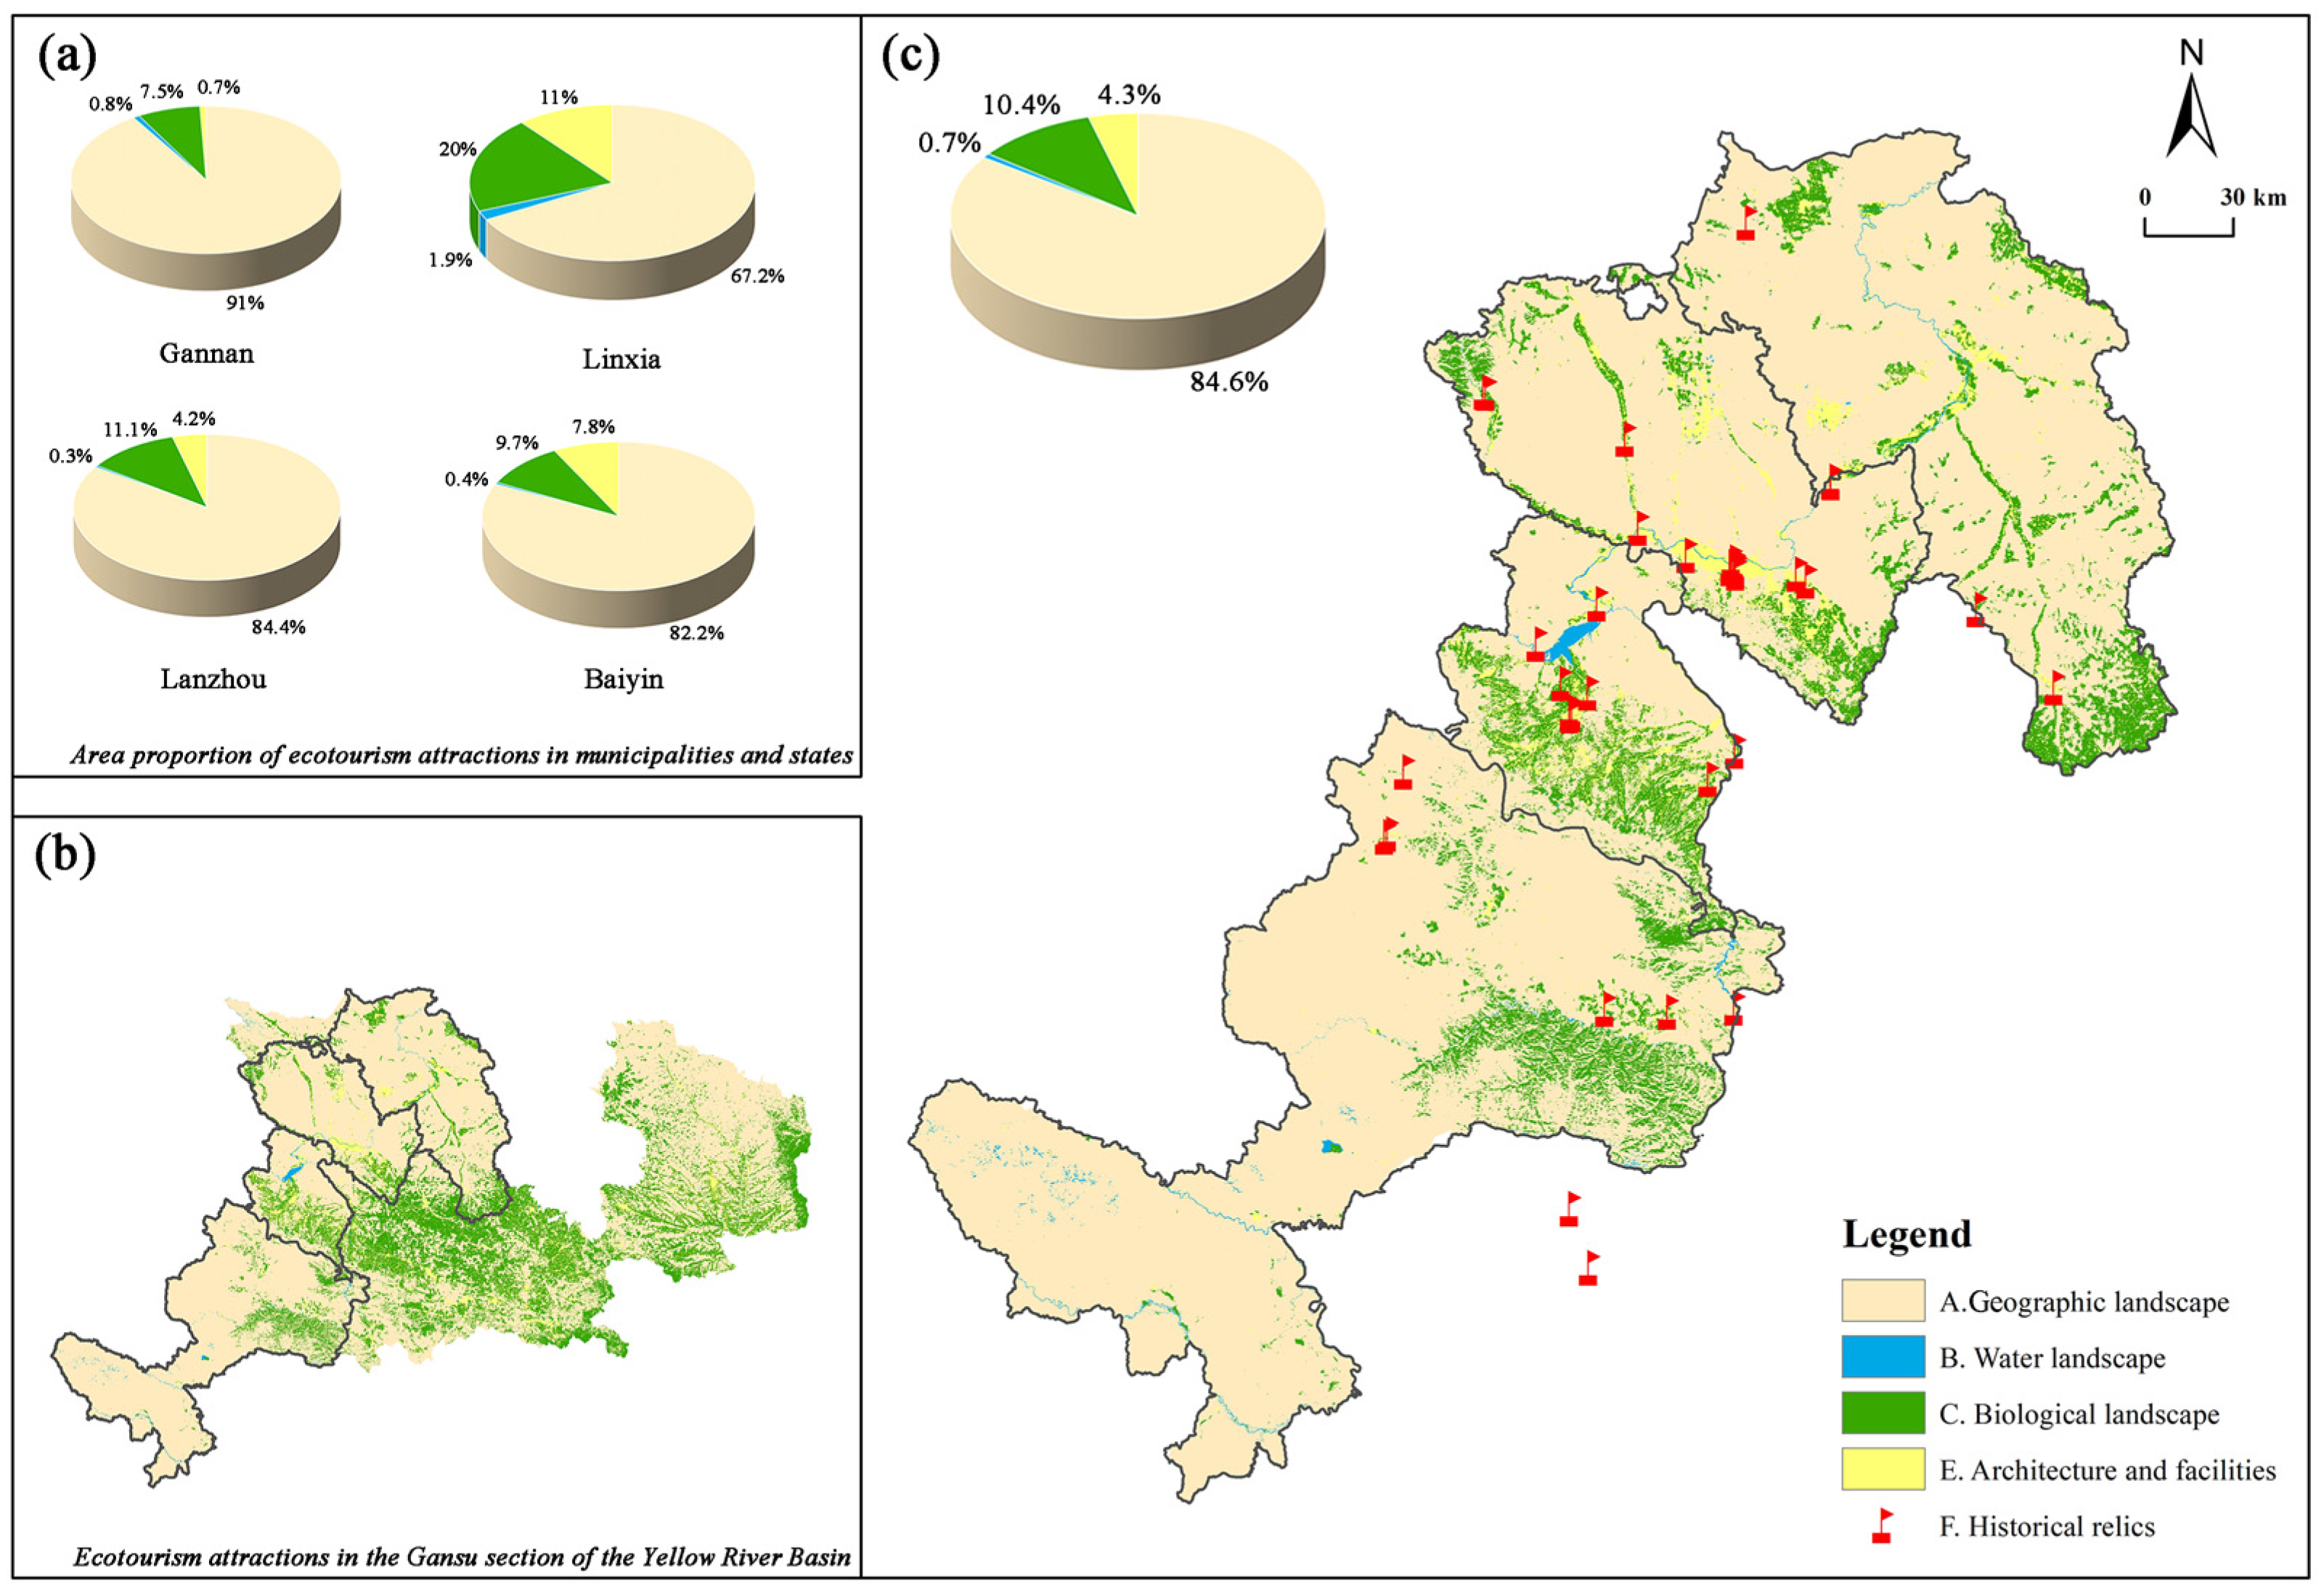
Therefore, based on land cover data and in accordance with the standard [67], the identification and classification of ecotourism attractions in the Gansu section of the Yellow River Basin were completed. Utilizing the distinctive recognition characteristics of various objects in remote sensing images, eight basic land cover types were categorized into four groups: Geographic Landscape, Water Landscape, Biological Landscape, Architecture, and Facilities (see Table 2 for details). Subsequently, a certain number of sample points were selected to validate the accuracy of the actual feature coverage types at these points. The classification results were refined by incorporating field exploration findings and relevant data. In addition, considering the support of cultural landscapes such as historical sites for ecotourism, the POI data of historical sites crawled by Python are included (Figure 4).
The identification and classification of ecotourism attractions in the Gansu section of the Yellow River Basin revealed the following ranking of the quantity of landscape: geographical landscapes (84.6%), biological landscapes (10.4%), architecture and facilities (4.3%), and water landscape (0.7%). As depicted in Figure 3, ecotourism resources in the Gansu section of the Yellow River Basin are abundant and widely distributed. Moreover, the integration of its unique historical and cultural heritage, along with ethnic customs, enhances the synergy between cultural and ecological resources. Therefore, the region exhibits considerable potential for the development of ecotourism.
5.2. Analysis of Tourists’ Knowledge in Ecotourism
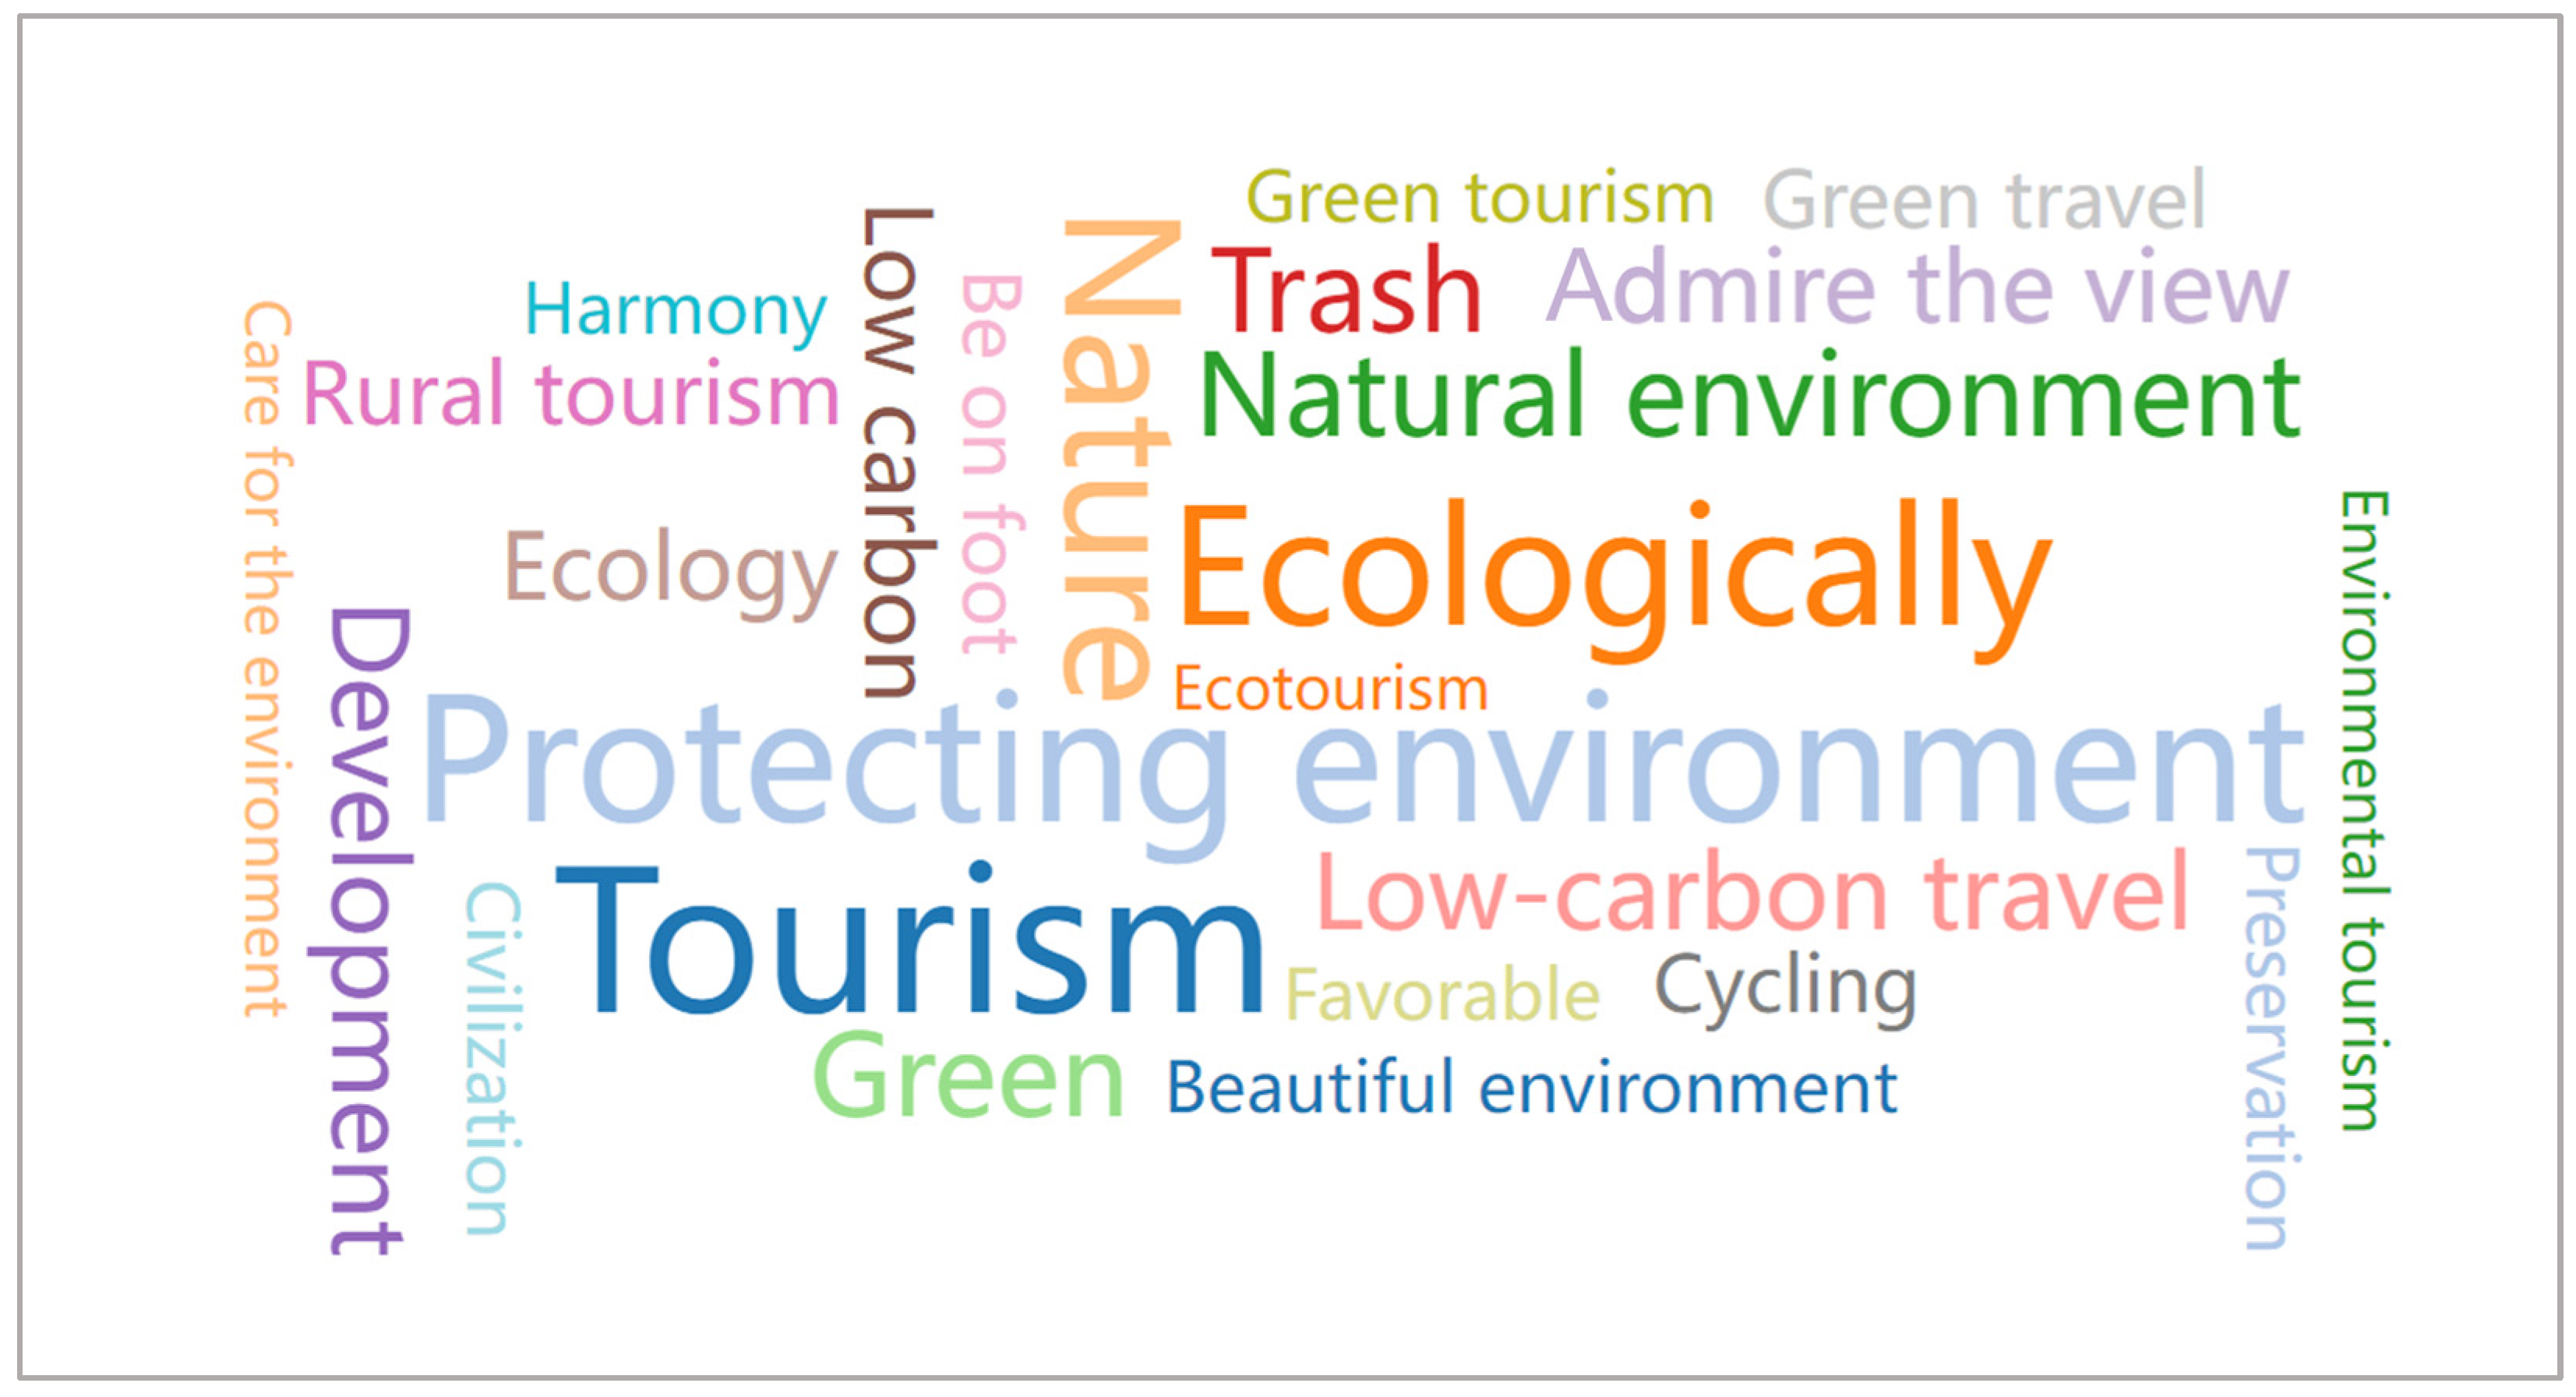
In the 987 valid questionnaires, only 532 respondents can be regarded as ecotourists (the outcomes were derived from the screening questions mentioned earlier in the 3.2.3), indicating that the promotion and education of ecotourism in China are currently insufficient. Figure 5 illustrates the ecotourism behavior perceived by samples of ecotourists in this study. From Figure 5, it can be observed that the current public understanding of ecotourism is more focused on environmental protection, low-carbon travel, etc.
Table 3 compares the demographic characteristics of ecotourists and the entire sample. As shown in Table 3, the gender ratio among ecotourists is balanced. Ecotourists are mostly in the age range of 18–30, with a high concentration of students. The majority of those graduating and above are familiar with ecotourism, while only 60% of undergraduates are familiar, and those with a high school education or below are even less familiar. This indicates that the popularity of ecotourism in China is not high and has not deeply penetrated education. In terms of monthly income, the proportion of ecotourists is higher in higher-income groups. In terms of occupation analysis, senior management has the highest level of awareness of ecotourism, followed by students, company employees, teachers, etc. This suggests that most industries lack sufficient attention to ecotourism.
5.3. Spatial Disparity of Ecotourists’ Perceptions
The spatial disparities in ecotourists’ perceptions were analyzed using one-way ANOVA and variable means, as depicted in Table 4. Ecotourists’ evaluations of the four perception categories are as follows: 4.088 for nature perception, 3.828 for accessibility perception, 3.898 for service perception, and 3.426 for atmosphere perception. Among these, nature perception has the highest mean value, while atmosphere perception has the lowest. The ANOVA results indicate that there is no significant difference in nature perception among the four regions, while there are significant differences in accessibility perception, service perception, and atmosphere perception. Specifically, Baiyin has the highest mean values for nature perception and atmosphere perception, while Lanzhou has the highest mean values for accessibility and service perception. Gannan ranks the lowest in terms of accessibility, service, and atmosphere perception, while Linxia ranks the lowest in nature perception.
5.4. The Importance of Influencing Factors on Ecotourist Satisfaction, Revisitation, and Recommendation
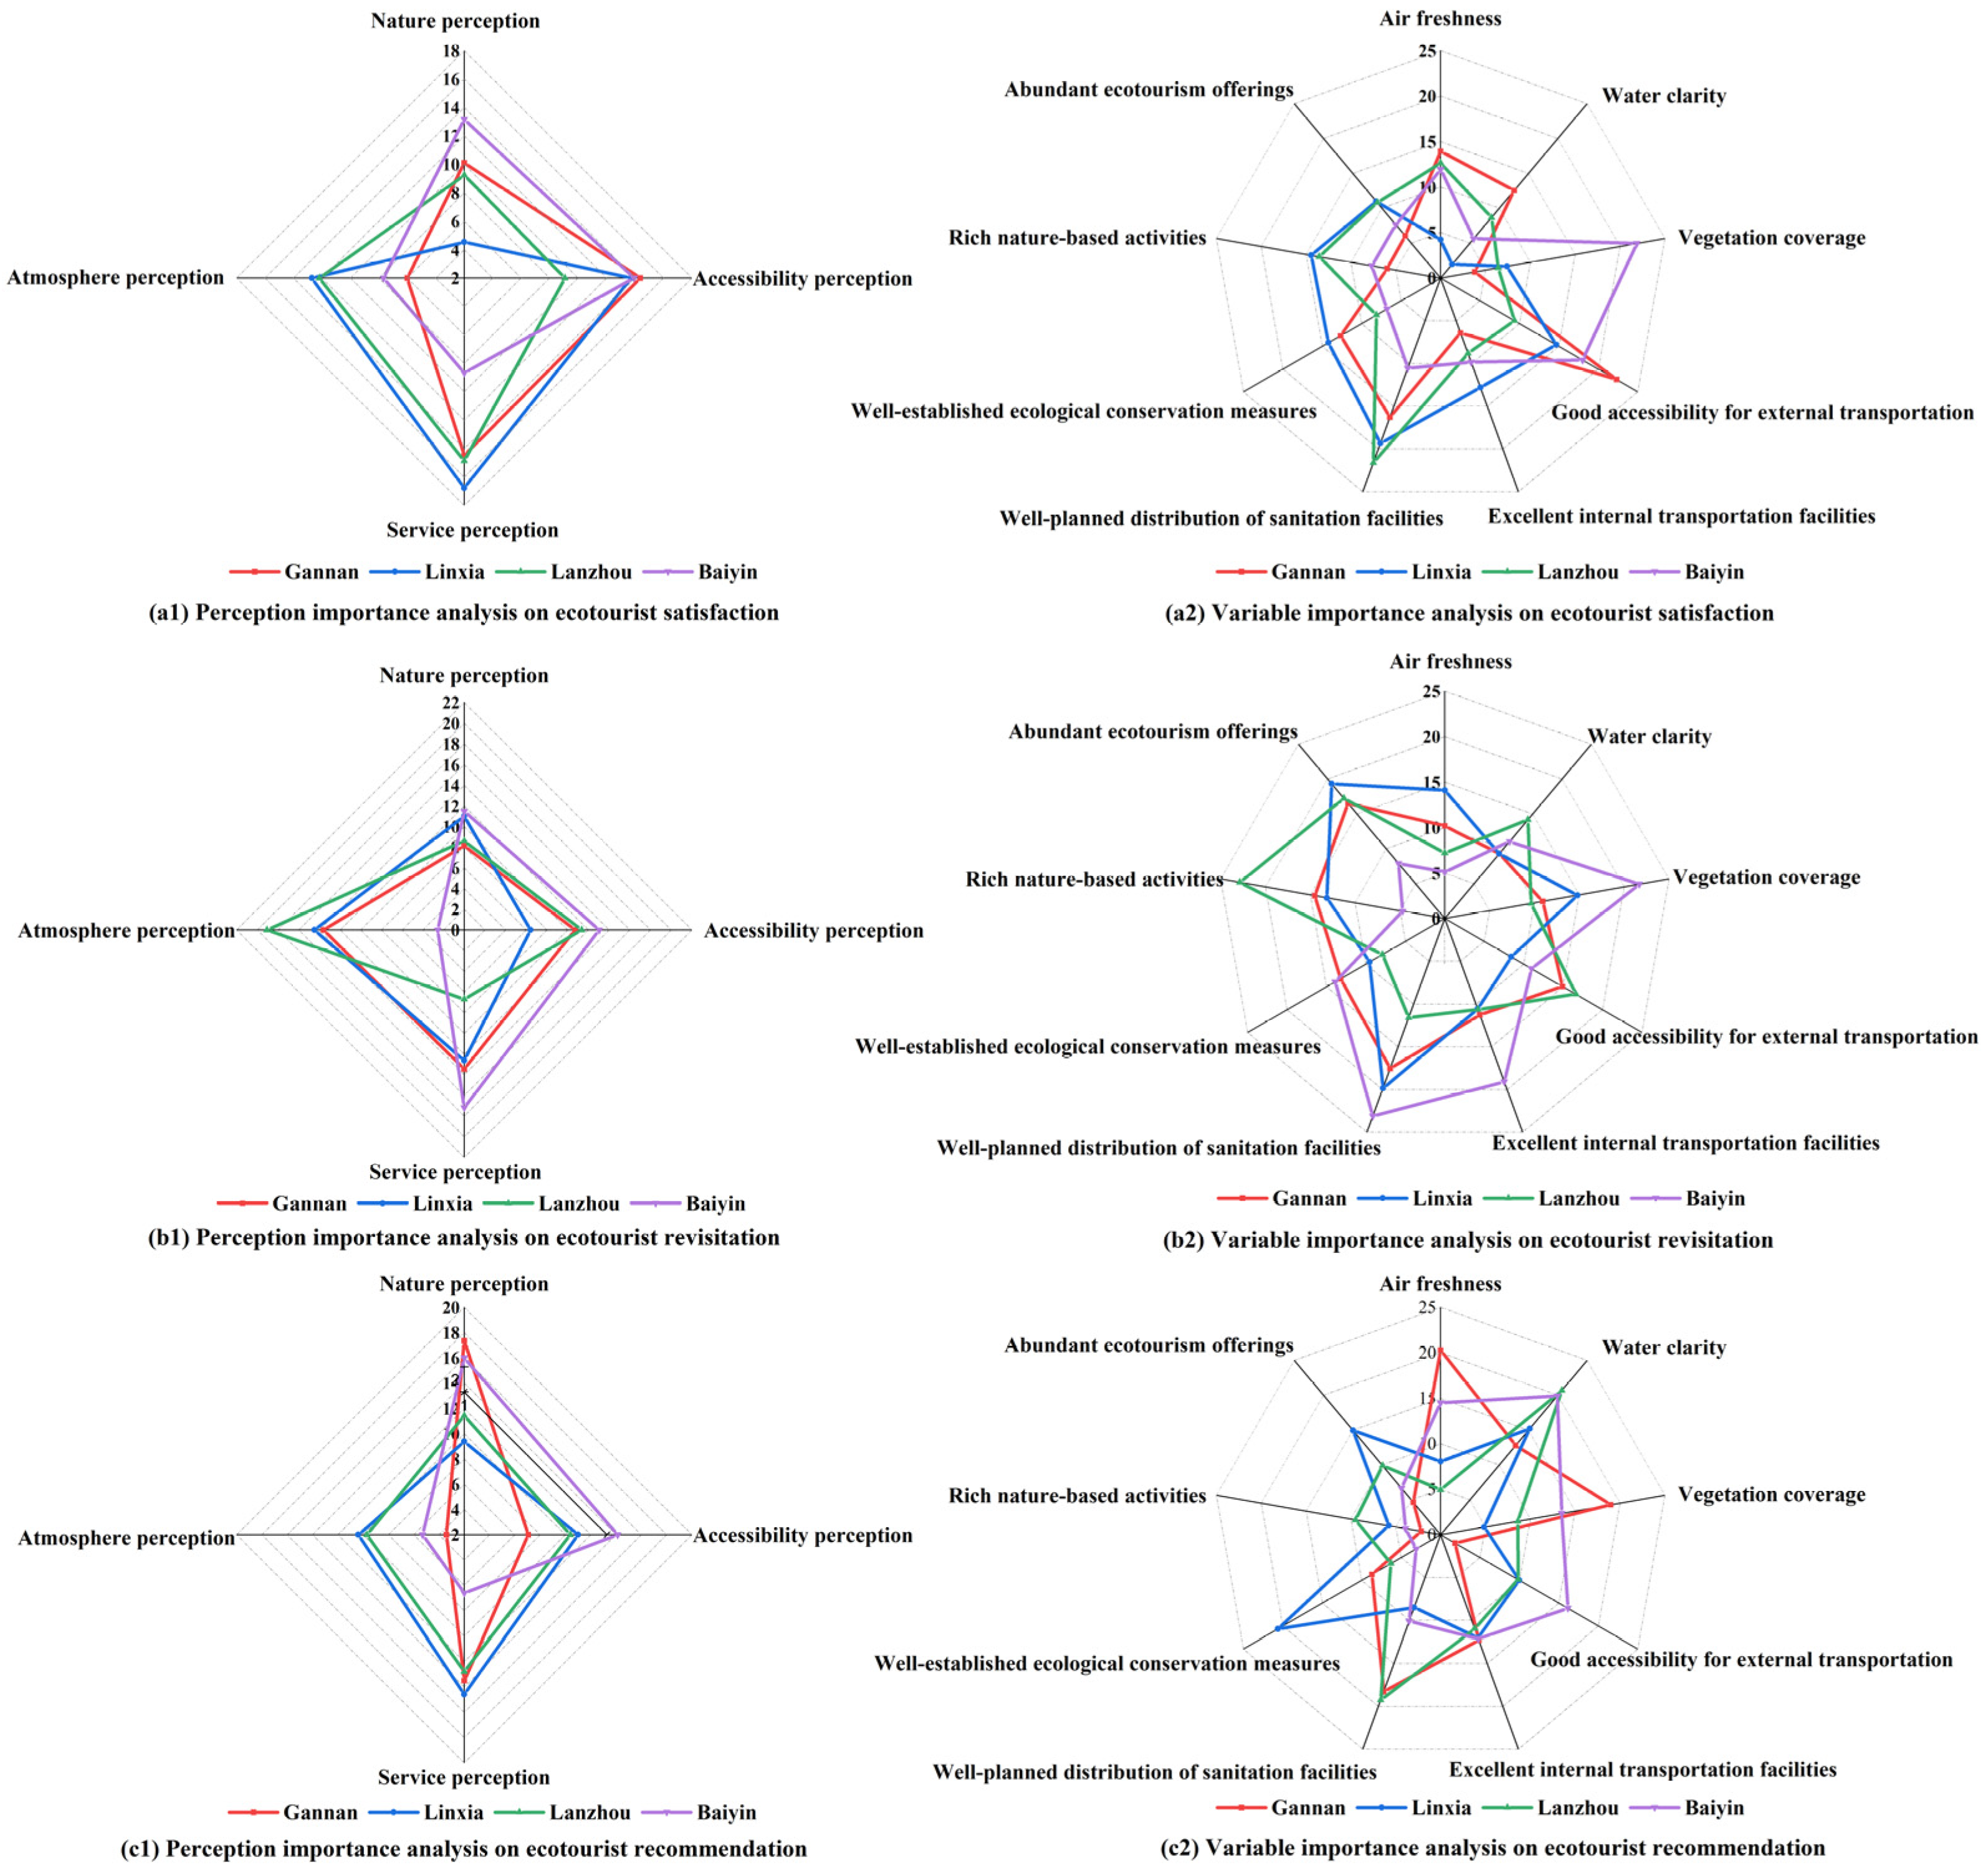
The F1 score of the random forest model range from 0.6 to 0.93 on the training set and from 0.71 to 0.85 on the test set, indicating the model has a good fitting effect and can effectively conduct data analysis. Table 5 and Table 6 present the importance of influencing factors on the satisfaction, revisitation, and recommendation of ecotourists in different cities; and Figure 6 visualizes the data with a radar chart. According to the results, there is spatial differentiation in the importance of factors influencing ecotourist satisfaction, revisitation, and recommendation in different regions.
Analysis of Figure 6(a1,a2) reveals variations in the impact of ecotourist perceptions on satisfaction across different regions. Service perception is most crucial for all cities except Baiyin, where accessibility perception has the greatest impact on satisfaction, followed by nature perception, especially vegetation coverage. Nature perception also significantly influences satisfaction in Gannan, indicating a close relationship between ecotourist satisfaction in the region and perceptions of the natural environment. In Lanzhou and Linxia, ecotourist satisfaction relies more on service and atmosphere perception than natural resources.
Exploring Figure 6(b1,b2) exposes differences in the impact of ecotourist perceptions on revisit intention across regions. Atmosphere perception is the primary factor influencing revisit intention in Lanzhou, Linxia, and Gannan, emphasizing the importance of diverse and unique experiential activities and products in determining whether ecotourists will revisit the region. In Baiyin, service perception is the primary influencing factor on revisit intention, indicating a higher correlation between the willingness to revisit and the quality of services, particularly the distribution of sanitation facilities; while nature and accessibility perceptions do not exhibit a significant influence on revisit intention.
Analysis of Figure 6(c1,c2) indicates varying degrees of influence of ecotourist perceptions on recommendation in different regions. In Gannan and Baiyin, nature perception is the most important factor influencing recommendation, suggesting a strong correlation between the willingness of ecotourists to recommend the region to friends and the natural environment. For Linxia and Lanzhou, service perception has the greatest impact on recommendation. Overall, atmosphere perception has the lowest impact on recommendation across all four regions.
In summary, satisfaction, revisit intention, and recommendation of ecotourists in Gannan and Baiyin are primarily influenced by nature perception. In Linxia and Lanzhou, satisfaction, revisit intention, and recommendation are mainly influenced by service and atmosphere perception. These findings contribute to the development of tailored strategies and measures for ecotourism in different regions within ecologically fragile areas.
6. Conclusions and Implications
6.1. Conclusions and Discussion
This study takes four cities (Gannan, Linxia, Lanzhou, and Baiyin) in the Gansu section of the Yellow River (mainstream) as an example of ecologically fragile areas; perception data from 532 valid ecotourists were obtained through a questionnaire. The one-way ANOVA and the random forest model and were employed to explore the differences in ecotourist perceptions among the four cities and the differential impact of the ecotourist perceptions on ecotourist satisfaction, revisitation, and recommendation. Based on these findings, we gained a more profound insight into the current state of ecotourism development in the region. The theoretical contribution of this study lies in constructing a research framework for exploring spatial variations in ecotourists’ perceptions, thereby facilitating the development of ecotourism in ecologically fragile areas.
The main conclusions are as follows:
(1) Rich ecotourism potential exists in the Gansu section of the Yellow River Basin, as an ecologically fragile area. After identifying and classifying ecotourism attractions in the Gansu section of the Yellow River, the quantity of attractions is ranked as follows: geographical landscapes (84.6%), biological landscapes (10.4%), architecture and facilities (4.3%), and water landscape (0.7%). This indicates rich ecotourism resources in the Gansu section of the Yellow River. Notably, due to the region being situated in the upstream arid and semi-arid areas, human settlement has followed water and grass, resulting in the integrated development of historical and cultural landscapes with ecological landscapes. Therefore, the Gansu section of the Yellow River has considerable potential for ecotourism development. Specifically, Linxia has the highest proportion of biological landscapes, water landscapes, and architecture and facilities; while Gannan has the highest proportion of geographical landscapes.
(2) Ecotourist perceptions exhibit significant spatial differences. According to the results of one-way ANOVA, significant differences exist in ecotourists’ perceptions of accessibility, service, and atmosphere among the four cities in the Gansu section of the Yellow River. Overall, nature perception is the highest, and atmosphere perception is the lowest. This indicates that ecotourists are generally satisfied with the natural environment, including water, air quality, and vegetation coverage; but are less satisfied with nature-based activities and products. The results are consistent with previous studies, due to the early stage of ecotourism development in the study area [68], ecotourism experience projects and related ecotourism products are still in the initial stages of development. Specifically, Baiyin has the highest scores for nature and atmosphere perception. Due to the majority of its attractions being situated near the mainstream of the Yellow River, coupled with diverse ecotourism sites such as Jingtai Baidunzi Salt Marsh National Wetland Park and the Yellow River Stone Forest National Geological Park, the region boasts favorable natural conditions. Moreover, the scenic area offers a variety of experiential nature-based activities, enhancing ecotourists’ perception of resources and atmosphere. Lanzhou has the highest scores for accessibility and service perception, which can be attributed to its role as a crucial transportation hub in the northwest and the relatively complete infrastructure and ecological conservation measures in the provincial capital. Linxia has the lowest nature perception due to its location at the junction of the Qinghai–Tibet Plateau and the Loess Plateau, which makes its landscape less prominent compared to the Qinghai–Tibet Plateau type (Gannan) and the Loess Plateau type (Lanzhou). Gannan has the lowest scores for atmosphere, accessibility, and service perceptions. Gannan, which is mainly inhabited by Tibetans, has unique Tibetan culture and religious beliefs, but lacks diverse nature-based activities, resulting in a lower ecotourism atmosphere. With a high average elevation of 2960 m and no high-speed rail or expressways as of December 2022, Gannan’s accessibility perception is relatively low and needs improvement. The unique Tibetan culture and religious beliefs, coupled with lower economic development and service industry levels, contribute to the lower atmosphere and service perception, requiring further enhancement.
(3) There is spatial differentiation in the influencing factors on ecotourist satisfaction, revisitation, and recommendation. Analyzing the impact of ecotourist perceptions on ecotourist satisfaction, revisitation, and recommendation is a response from the tourism supply side to tourism demand [32]. A comprehensive understanding of ecotourist perception from the demand side is helpful for ecotourism destinations to better meet the needs of visitors from the supply side, continually enhancing the attractiveness of ecotourism destinations [30].
The results of the random forest model show that ecotourists in Gannan and Baiyin prioritize nature perception, reflecting a greater emphasis on appreciating the natural environment. In Linxia and Lanzhou, ecotourists prioritize service and atmosphere perception, indicating a greater emphasis on interactive experiences in these regions. Specifically, the main factors influencing ecotourist satisfaction, revisit intention, and recommendation in Gannan and Baiyin are nature perception. In Gannan, abundant natural resources, air freshness and water clarity are recognized by ecotourists, attracting them to admire the natural scenery [69]. Sites such as the Yellow River Stone Forest and Shuichuan Wetland Park in Baiyin are particularly renowned for their unique natural landscapes, attracting tourists. This finding is similar to that of Jin et al. [12], who studied Guilin in China, and found that ecotourists in that area often have a strong desire to enjoy and appreciate nature. Compared with Jin’s study, the similarities lie in the presence of more unique natural landscapes in these areas.
In both Linxia and Lanzhou, the primary factors influencing ecotourist satisfaction, revisitation, and recommendation are service and atmosphere perception. The results are similar to a study conducted in Western Australia (the Pinnacles) by Li et al. [8], which emphasized the importance of providing enjoyable tourism experiences (such as fun learning) in the areas. Destination managers in these regions should focus more on enhancing the tourist experience. Linxia offers excellent ecological experience venues, with activities such as picking and feeding. Lanzhou, as the provincial capital, provides the most outstanding services and diverse activities in the Yellow River Basin. Both locations boast relatively well developed basic service infrastructure. The main attractions for ecotourists to these areas likely include excellent service and nature-based activities. This category of regions, as identified in contrast with the study by Li et al. [8], shares the commonality of developing ecotourism activities with regional characteristics based on abundant natural resources.
6.2. Implications for the Development of Ecotourism
Analyzing spatial differences in ecotourist perceptions and the differential impact of ecotourist perceptions on satisfaction, revisitation, and recommendation can help ecotourism destinations meet the needs of ecotourists from the supply side. This facilitates the formulation of differentiated marketing strategies for tourist destinations, avoiding homogenized competition with neighboring areas. Based on the research results, the following ecotourism development strategies and recommendations are proposed for ecologically fragile areas.
6.2.1. Emphasize the Development of Ecotourism Resources
This includes implementing strategies for optimizing the development of the water landscape. Given that the study area is located in an upstream arid and semi-arid region with a high demand for water resources, it is recommended to actively expand the area of water landscapes. The government could increase the number of wetland parks, and implement ecological restoration and protection measures to create a broader wetland ecosystem, providing richer natural experiences for tourists.
Enhancing the quality of urban water landscapes can be achieved by improving the water quality of rivers and lakes, greening riverbanks, and creating pleasant waterfront leisure areas. Utilizing water landscapes effectively to create a tourist line of the Yellow River custom by combining the artificial environment with the local natural environment to give visitors a unique experience [70], introducing various water-based activities and entertainment projects such as sheepskin rafting, waterside cycling, and night tours of the Yellow River. Additional measures include delving into the historical and cultural features of the Yellow River, developing related cultural tourism projects such as Yellow River cultural exhibitions, historical site tours, and traditional boat experiences. The geographic advantage of cities along the Yellow River can be leveraged to promote the development of distinctive ecotourism, enhancing tourist perception and contributing to the prosperity and sustainable development of the regional tourism industry.
6.2.2. Implement Targeted Ecotourism Development Strategies in Different Regions
Initiating supply-side reforms based on the demand side contributes to achieving a balance between supply and demand, enhancing tourist perception, and strengthening visitor loyalty, and fostering the sustainable development of ecotourism.
For regions in the early stages of ecotourism development with abundant natural resources, the focus should be on enhancing ecotourism experience projects and related ecotourism products to elevate the overall ecotourism experience. Additionally, local governments should also understand the development disadvantages of different ecotourism destinations and implement targeted regional development strategies. Improving low-perception elements will enhance the attractiveness of tourist destinations.
Easy access is valuable for tourists [71]. For less accessible, underdeveloped regions, such as Gannan in this study, governments should enhance transportation infrastructure such as high-speed rail networks to improve external transportation convenience and enhance perceived accessibility. Internally, improving signage and navigation systems within scenic areas will enhance the ease of movement for tourists, thus improving their perception experience within the scenic area.
Activities and special events at the destination have been identified as crucial elements in creating memorable tourism experiences [72,73]. For regions with lower atmospheric perception, destination managers should enrich nature-based activities and offer corresponding souvenirs. This could involve developing immersive educational and interactive entertainment products related to the ecological environment, flora and fauna, and historical–cultural resources. Unique ecotourism souvenirs themed around nature to enhance tourists’ perception could be designed. Increasing tourists’ understanding and experience of the destination’s natural and cultural values will elevate perception and promote the sustainable development of ecotourism.
6.2.3. Implement Differentiated Ecotourism Development Strategies in Different Regions
Implementing differentiated ecotourism development strategies based on different ecotourists perception can help to avoid homogenized competition among neighboring areas.
Therefore, based on the evaluation of ecotourists’ perceptions in the study area, it is recommended that regions such as Gannan and Baiyin, which possess unique natural resources, focus on the development of nature-oriented ecotourism. Emphasizing the satisfaction of ecotourists perception needs for the natural environment is crucial. A good ecological environment serves as the primary attraction for ecotourism destinations in such areas. Enhancing the protection and showcasing of natural landscapes allows visitors to immerse themselves more deeply in the beauty and uniqueness of the local natural environment. Leveraging unique natural resources, further development of ecotourism experiences can be pursued.
In regions such as Linxia and Lanzhou, which boast abundant natural resources and already have a foundation for ecotourism development, the focus should be on developing service-oriented ecotourism. This involves emphasizing the improvement of service quality and experiences. Activities and souvenirs based on nature should be diversified, including experiences such as ecotourism farm visits, wilderness hiking adventures, and crafting unique handicrafts to engage tourists. The design of souvenirs should highlight local cultural characteristics. Unique souvenirs purchased by tourists and taken back to their place of residence can serve as indirect promotion [70]. Strengthening interactive experiences for ecotourists can enhance satisfaction, revisitation, and recommendation.
6.2.4. Promote the Dissemination of Ecotourism Awareness
In countries at the early stages of ecotourism development, there is often insufficient awareness of ecotourism concepts, necessitating a systematic promotion of ecotourism principles through social communication and citizen education processes. In this process, all relevant stakeholders—particularly government departments, ecotourism destination managers, and non-profit organizations dedicated to promoting ecotourism—should strictly adhere to policy guidelines such as the National Ecotourism Development Plan in China and establish deep strategic partnerships with tourist destinations. For instance, establishing dedicated funds to provide capital support for ecotourism projects ensures balanced development in economic performance, social welfare, and ecological conservation.
These strategies aim to cater to the specific characteristics and challenges of each region, promoting a more tailored and sustainable development of ecotourism in ecologically fragile areas.
6.3. Limitations and Prospects
Despite constructing a research framework to explore spatial variations in ecotourists’ perceptions in ecologically fragile areas, conducting a comprehensive investigation into ecotourists perceptions, and utilizing the random forest model to study the spatial variations in the impact of ecotourist perceptions on satisfaction and loyalty, this study sheds light on the issues existing in these regions from the demand side and facilitates the sustainable development of ecotourism in ecologically fragile areas. This study has certain limitations. Firstly, in terms of data acquisition, this study employed traditional questionnaire surveys, resulting in a relatively singular data source. In future studies, it would be beneficial to incorporate diverse data sources, such as utilizing web scraping techniques to obtain online reviews and photos shared by users on websites. This approach would enhance the scientific validity and persuasiveness of the research findings. Secondly, for subsequent research, incorporating comparative methods is recommended to further improve the precision of the research model and obtain more accurate results.
Author Contributions
Conceptualization, G.M. and J.Y.; methodology, H.G.; software, H.G. and Y.S.; validation, J.Y.; formal analysis, J.Y.; investigation, J.Y.; resources, J.Y.; data curation, J.Y.; writing—original draft preparation, J.Y.; writing—review and editing, G.M.; visualization, J.Y. and Y.S.; supervision, G.M.; project administration, G.M.; funding acquisition, G.M. All authors have read and agreed to the published version of the manuscript.
Funding
This research was funded by the Natural Science Foundation of Gansu province of China (Grant Number: 20JR10RA629).
Data Availability Statement
Dataset available on request from the authors.
Conflicts of Interest
The authors declare no conflicts of interest.
References
- Shasha, Z.T.; Geng, Y.; Sun, H.; Musakwa, W.; Sun, L. Past, Current, and Future Perspectives on Eco-Tourism: A Bibliometric Review between 2001 and 2018. Environ. Sci. Pollut. Res 2020, 27, 23514–23528. [Google Scholar] [CrossRef] [PubMed]
- Khanra, S.; Dhir, A.; Kaur, P.; Mäntymäki, M. Bibliometric Analysis and Literature Review of Ecotourism: Toward Sustainable Development. Tour. Manag. Pers. 2021, 37, 100777. [Google Scholar] [CrossRef]
- Valentine, P.S. Ecotourism and Nature Conservation: A Definition with Some Recent Developments in Micronesia. Tour. Manag. 1993, 14, 107–115. [Google Scholar] [CrossRef]
- Wang, S.-Y.; Liu, J.-S.; Ma, T.-B. Dynamics and Changes in Spatial Patterns of Land Use in Yellow River Basin, China. Land. Use Policy 2010, 27, 313–323. [Google Scholar] [CrossRef]
- Weaver, D.; Tang, C.; Zhao, Y. Facilitating Sustainable Tourism by Endogenization: China as Exemplar. Ann. Tour. Res. 2020, 81, 102890. [Google Scholar] [CrossRef]
- Wang, Z.; Jia, Y.; Liu, Z.; Mao, X.; Song, C. International experience of national park funding patterns and its enlightenment to China. Ecol. Econ. 2019, 39, 138–144. [Google Scholar]
- Chen, Y.; Zhang, K.; Chen, X.; Liao, Y.; Song, B.; Huang, H.; Wang, X. Ecological protection and high quality development in the Yellow River Basin. Reg. Econ. Rev. 2020, 8–22. [Google Scholar] [CrossRef]
- Li, T.; Liu, F.; Soutar, G.N. Experiences, Post-Trip Destination Image, Satisfaction and Loyalty: A Study in an Ecotourism Context. J. Destin. Mark. Manag. 2021, 19, 100547. [Google Scholar] [CrossRef]
- Kim, M.; Thapa, B. Perceived Value and Flow Experience: Application in a Nature-Based Tourism Context. J. Destin. Mark. Manag. 2018, 8, 373–384. [Google Scholar] [CrossRef]
- Moon, H.; Han, H. Tourist Experience Quality and Loyalty to an Island Destination: The Moderating Impact of Destination Image. J. Travel. Tour. Mark. 2019, 36, 43–59. [Google Scholar] [CrossRef]
- Chiu, Y.-T.H.; Lee, W.-I.; Chen, T.-H. Environmentally Responsible Behavior in Ecotourism: Antecedents and Implications. Tour. Manag. 2014, 40, 321–329. [Google Scholar] [CrossRef]
- Jin, M.; Choi, Y.; Lee, C.-K.; Ahmad, M.S. Effects of Place Attachment and Image on Revisit Intention in an Ecotourism Destination: Using an Extended Model of Goal-Directed Behavior. Sustainability 2020, 12, 7831. [Google Scholar] [CrossRef]
- Du, Q.; Guan, Q.; Sun, Y.; Wang, Q. Assessment of Ecotourism Environmental Carrying Capacity in the Qilian Mountains, Northwest China. Sustainability 2024, 16, 1873. [Google Scholar] [CrossRef]
- Seraphin, H.; Sheeran, P.; Pilato, M. Over-Tourism and the Fall of Venice as a Destination. J. Destin. Mark. Manag. 2018, 9, 374–376. [Google Scholar] [CrossRef]
- Saidmamatov, O.; Matyakubov, U.; Rudenko, I.; Filimonau, V.; Day, J.; Luthe, T. Employing Ecotourism Opportunities for Sustainability in the Aral Sea Region: Prospects and Challenges. Sustainability 2020, 12, 9249. [Google Scholar] [CrossRef]
- Tajer, E.; Demir, S. Ecotourism Strategy of UNESCO City in Iran: Applying a New Quantitative Method Integrated with BWM. J. Clean. Prod. 2022, 376, 134284. [Google Scholar] [CrossRef]
- The International Ecotourism Society What Is Ecotourism. TIES 2015. Available online: https://ecotourism.org/what-is-ecotourism/ (accessed on 15 April 2024).
- Zhong, L.; Ma, X.; Kang, W. Progresses and prospects of ecotourism research in China. Progress. Geogr. 2016, 35, 679–690. [Google Scholar]
- Zhu, Y.; Lu, X.; Zeng, Y. Study on development of urban tourism based on dissipative structure theory. Geogr. Geo-Inf. Sci. 2007, 23, 100–104. [Google Scholar]
- Uddhammar, E. Development, Conservation and Tourism: Conflict or Symbiosis? Rev. Int. Political Econ. 2006, 13, 656–678. [Google Scholar] [CrossRef]
- Xu, H. A Model Study in the Development of Ecotourism Destination. Tour. Trib. 2006, 4, 75–80. [Google Scholar]
- Wondirad, A.; Tolkach, D.; King, B. Stakeholder Collaboration as a Major Factor for Sustainable Ecotourism Development in Developing Countries. Tour. Manag. 2020, 78, 104024. [Google Scholar] [CrossRef]
- Beall, J.M.; Boley, B.B.; Landon, A.C.; Woosnam, K.M. What Drives Ecotourism: Environmental Values or Symbolic Conspicuous Consumption? J. Sustain. Tour. 2021, 29, 1215–1234. [Google Scholar] [CrossRef]
- Ke, L. New Development Direction on Worse Ecological System Resource of China Eco-Tourism. Energy Procedia 2012, 14, 445–450. [Google Scholar] [CrossRef]
- Shen, H.; Zheng, X.; Li, J.; Jia, J.; Hayat, K. Tourists’ wilingness to pay for the non-use values of ecotourism resources in a national forest park. J. Resour. Ecol. 2023, 14, 331–343. [Google Scholar]
- Garrod, B.; Fennell, D.A. Strategic Approaches to Accessible Ecotourism: Small Steps, the Domino Effect and Not Paving Paradise. J. Sustain. Tour. 2023, 31, 760–777. [Google Scholar] [CrossRef]
- Zhang, Y. An image perception research on ecotourism destination under the Internet word of mouth and horizon:Take Wanlv Lake scenic spot in Guangdong as an example. Tour. Res. 2016, 8, 63–68. [Google Scholar]
- Pham, H.S.T.; Khanh, C.N.T. Ecotourism Intention: The Roles of Environmental Concern, Time Perspective and Destination Image. Tour. Rev. 2020, 76, 1141–1153. [Google Scholar] [CrossRef]
- Romão, J.; Neuts, B.; Nijkamp, P.; Shikida, A. Determinants of Trip Choice, Satisfaction and Loyalty in an Eco-Tourism Destination: A Modelling Study on the Shiretoko Peninsula, Japan. Ecol. Econ. 2014, 107, 195–205. [Google Scholar] [CrossRef]
- Zhao, L.; Wu, W.; Li, J.; Wu, Y. The formation mechanism of tourist loyalty in ecotourism scenic spots from the perspective of tourist perceived value: Evidence from Xixi National Wetland Park. Acta Ecol. Sin. 2018, 38, 7135–7147. [Google Scholar]
- Lian Chan, J.K.; Baum, T. Ecotourists’ Perception of Ecotourism Experience in Lower Kinabatangan, Sabah, Malaysia. J. Sustain. Tour. 2007, 15, 574–590. [Google Scholar] [CrossRef]
- Dai, L.; Xue, D. Tourists’spatial perception and place imagination in frontier ecotourism destination: A case of Ejin Oasis, Inner Mongolia. Arid. Land Geogr. 2022, 45, 1302–1312. [Google Scholar]
- Cheng, M.; Wong, I.A.; Wearing, S.; McDonald, M. Ecotourism Social Media Initiatives in China. J. Sustain. Tour. 2017, 25, 416–432. [Google Scholar] [CrossRef]
- Sun, Y.; Liu, B.; Fan, J.; Qiao, Q. The Multi-Player Evolutionary Game Analysis for the Protective Development of Ecotourism. Environ. Sci. Policy 2021, 126, 111–121. [Google Scholar] [CrossRef]
- Grilli, G.; Tyllianakis, E.; Luisetti, T.; Ferrini, S.; Turner, R.K. Prospective Tourist Preferences for Sustainable Tourism Development in Small Island Developing States. Tour. Manag. 2021, 82, 104178. [Google Scholar] [CrossRef]
- Zhou, Q.; Zhu, K.; Kang, L.; Dávid, L.D. Tea Culture Tourism Perception: A Study on the Harmony of Importance and Performance. Sustainability 2023, 15, 2838. [Google Scholar] [CrossRef]
- Dong, W.; Kang, Q.; Wang, G.; Zhang, B.; Liu, P. Spatiotemporal Behavior Pattern Differentiation and Preference Identification of Tourists from the Perspective of Ecotourism Destination Based on the Tourism Digital Footprint Data. PLoS ONE 2023, 18, e0285192. [Google Scholar] [CrossRef]
- Wang, Y.; Lu, C.; Chen, H.; Zhao, Y. Evaluation and Spatial Characteristics of Cooperation among Tourist Attractions Based on a Geographic Information System: A Case Study of The Yangtze River Delta Region, China. Sustainability 2022, 14, 13041. [Google Scholar] [CrossRef]
- Wang, Y.; Huang, Z. An analysis on residents tourism perceptions differences and influential factors in Wetland ecotourism destination. J. Nanjing Norm. Univ. (Nat. Sci. Ed.) 2011, 34, 113–118. [Google Scholar]
- Boley, B.B.; McGehee, N.G.; Tom Hammett, A.L. Importance-Performance Analysis (IPA) of Sustainable Tourism Initiatives: The Resident Perspective. Tour. Manag. 2017, 58, 66–77. [Google Scholar] [CrossRef]
- Gong, J.; Liu, C.; Knight, D. Research on the spatial differentiation and influence mechanism of sustainable tourism perception among Shennongjia National Park residents. Resour. Environ. Yangtze Basin 2021, 30, 2854–2865. [Google Scholar]
- Liu, Y.; Zhao, Z.; Li, X.; Zhang, J.; Li, Y. The spatial response and its formation mechanism of community residents perceived conflicts in nature reserve: A case study of Qionghai National Wetland Park. Sci. Geogr. Sin. 2022, 42, 401–412. [Google Scholar] [CrossRef]
- Oviedo-García, M.Á.; Castellanos-Verdugo, M.; Vega-Vázquez, M.; Orgaz-Agüera, F. The Mediating Roles of the Overall Perceived Value of the Ecotourism Site and Attitudes Towards Ecotourism in Sustainability Through the Key Relationship Ecotourism Knowledge-Ecotourist Satisfaction. Int. J. Tour. Res. 2017, 19, 203–213. [Google Scholar] [CrossRef]
- Luong, T.-B. Eco-Destination Image, Environment Beliefs, Ecotourism Attitudes, and Ecotourism Intention: The Moderating Role of Biospheric Values. J. Hosp. Tour. Manag. 2023, 57, 315–326. [Google Scholar] [CrossRef]
- Lu, D.; Sun, D. Development and management tasks of the Yellow River Basin: A preliminary understanding and suggestion. Acta Geogr. Sin. 2019, 74, 2431–2436. [Google Scholar]
- Jiang, W.; Gao, W.; Gao, X.; Ma, M.; Zhou, M.; Du, K.; Ma, X. Spatio-Temporal Heterogeneity of Air Pollution and Its Key Influencing Factors in the Yellow River Economic Belt of China from 2014 to 2019. J. Environ. Manag. 2021, 296, 113172. [Google Scholar] [CrossRef] [PubMed]
- Li, J.; Sun, W.; Li, M.; Meng, L. Coupling Coordination Degree of Production, Living and Ecological Spaces and Its Influencing Factors in the Yellow River Basin. J. Clean. Prod. 2021, 298, 126803. [Google Scholar] [CrossRef]
- Zhang, Q.; Ye, P.; Wang, J.; Zhang, L.; Gan, Z.; Wang, Y. Scientific discussion and ponder on the coordination of naturaenvironmental in the upper Yellow River Basin. Adv. Eath Sci. 2023, 38, 320–329. [Google Scholar]
- Ding, C. Land Policy Reform in China: Assessment and Prospects. Land. Use Policy 2003, 20, 109–120. [Google Scholar] [CrossRef]
- Zhang, P.; Qin, C.; Hong, X.; Kang, G.; Qin, M.; Yang, D.; Pang, B.; Li, Y.; He, J.; Dick, R.P. Risk Assessment and Source Analysis of Soil Heavy Metal Pollution from Lower Reaches of Yellow River Irrigation in China. Sci. Total Environ. 2018, 633, 1136–1147. [Google Scholar] [CrossRef]
- Yan, M.; Kou, J.; Ma, W.; Jian, Y.; Yang, H.; Xue, B.; Gou, X. Scale Effect of Population and Area Exposed to Water Scarcity Based on Different Recurrence Periods: A Case Study of Gansu Province, China. Ecol. Indic. 2023, 157, 111254. [Google Scholar] [CrossRef]
- Zhu, G.; Shi, P. Optimization and arrangament of natural ecotouris resources in Gansu. J. Arid. Land. Resour. Environ. 2009, 23, 188–193. [Google Scholar]
- China Knowledge Centre for Engineering Sciences and Technology. Available online: https://www.ckcest.cn/ (accessed on 15 April 2024).
- Resource and Environmental Science Data Platform. Available online: https://www.resdc.cn/ (accessed on 15 April 2024).
- Lu, W.; Stepchenkova, S. Ecotourism Experiences Reported Online: Classification of Satisfaction Attributes. Tour. Manag. 2012, 33, 702–712. [Google Scholar] [CrossRef]
- Yuan, L.; Lv, J.; Huang, X. Evaluation and countermeasure research on the competitiveness of rural tourism in urban agglomerations in the middle reaches of Changiiang river. Resour. Dev. Mark. 2020, 36, 1034–1038. [Google Scholar]
- Wu, X.; Du, Y. Empirical study on perceptive image formation of tourists on tourism destination:A case study of Nantong, Jiangsu Province. Geogr. Res. 2011, 30, 1554–1565. [Google Scholar]
- Carvache-Franco, M.; Carvache-Franco, O.; Carvache-Franco, W. Exploring The Satisfaction of Ecotourism In Protected Natural Areas. Geoj. Tour. Geosites 2020, 29, 672–683. [Google Scholar] [CrossRef]
- Chen, D.; Wang, Y.; Guo, Y. Research on the experience products development of forest tour based on tourists’ satisfaction:Taking 49 national forest parks in Shandong province as examples. For. Econ. 2021, 43, 62–79. [Google Scholar]
- Mafi, M.; Pratt, S.; Trupp, A. Determining Ecotourism Satisfaction Attributes—A Case Study of an Ecolodge in Fiji. J. Ecotourism 2020, 19, 304–326. [Google Scholar] [CrossRef]
- Castellanos-Verdugo, M.; Vega-Vázquez, M.; Oviedo-García, M.Á.; Orgaz-Agüera, F. The Relevance of Psychological Factors in the Ecotourist Experience Satisfaction through Ecotourist Site Perceived Value. J. Clean. Prod. 2016, 124, 226–235. [Google Scholar] [CrossRef]
- Siegel, A.F.; Wagner, M.R. Chapter 15—ANOVA: Testing for Differences Among Many Samples and Much More. In Practical Business Statistics, 8th ed.; Siegel, A.F., Wagner, M.R., Eds.; Academic Press: New York, NY, USA, 2022; pp. 485–510. ISBN 978-0-12-820025-4. [Google Scholar]
- Huang, H.-Y.; Broughton, M.; Mohseni, M.; Babbush, R.; Boixo, S.; Neven, H.; McClean, J.R. Power of Data in Quantum Machine Learning. Nat. Commun. 2021, 12, 2631. [Google Scholar] [CrossRef]
- Belgiu, M.; Drăguţ, L. Random Forest in Remote Sensing: A Review of Applications and Future Directions. ISPRS J. Photogramm. Remote Sens. 2016, 114, 24–31. [Google Scholar] [CrossRef]
- Breiman, L. Random Forests. Mach. Learn. 2001, 45, 5–32. [Google Scholar] [CrossRef]
- Sulova, A.; Jokar Arsanjani, J. Exploratory Analysis of Driving Force of Wildfires in Australia: An Application of Machine Learning within Google Earth Engine. Remote Sens. 2021, 13, 10. [Google Scholar] [CrossRef]
- Standardization Administration of China. GB/T 18972-2017; Classification, Investigation, and Evaluation of Tourism Resources. China National Tourism Administration: Beijing, China, 2017.
- Cui, M.; Liu, R. A study on the coupling coordination and obstacle factors of ecotourism and rural revitalization in the Yellow River Basin. J. Henan Norm. Univ. Nat. Sci. Ed. 2024, 52, 1–9. [Google Scholar] [CrossRef]
- Li, W.; Liu, C.; Su, W.; Ma, X.; Zhou, H.; Wang, W.; Zhu, G. Spatiotemporal Evaluation of Alpine Pastoral Ecosystem Health by Using the Basic-Pressure-State-Response Framework: A Case Study of the Gannan Region, Northwest China. Ecol. Indic. 2021, 129, 108000. [Google Scholar] [CrossRef]
- Zhang, Z.; Plathong, S.; Sun, Y.; Guo, Z.; Munnoy, T.; Ma, L.; Jantharakhantee, C.; Tanboot, L. Analysis of the Island Tourism Environment Based on Tourists’ Perception—A Case Study of Koh Lan, Thailand. Ocean. Coast. Manag. 2020, 197, 105326. [Google Scholar] [CrossRef]
- Tyrväinen, L.; Uusitalo, M.; Silvennoinen, H.; Hasu, E. Towards Sustainable Growth in Nature-Based Tourism Destinations: Clients’ Views of Land Use Options in Finnish Lapland. Landsc. Urban. Plan. 2014, 122, 1–15. [Google Scholar] [CrossRef]
- Kim, J.-H. The Antecedents of Memorable Tourism Experiences: The Development of a Scale to Measure the Destination Attributes Associated with Memorable Experiences. Tour. Manag. 2014, 44, 34–45. [Google Scholar] [CrossRef]
- Anaya, G.J.; Lehto, X. ‘Moments to Be Had’: Understanding The Experience of Memorable Tourism Moments. Tour. Manag. 2023, 95, 104674. [Google Scholar] [CrossRef]
Figure 1.
Study area. Notes: (a) displays the location of the study area within the Yellow River Basin; (b) illustrates the location of the study area within the Gansu Province; (c) illustrates the distribution of tourist attractions (5A, 4A, 3A, 2A, and A-level) in the Gansu section of the Yellow River Basin. The 5A grade represents the highest level for tourist attractions in China, symbolizing the country’s world-class premium scenic spots; 4A indicates high-quality tourist attractions with excellent amenities and services; 3A denotes good-quality tourist attractions offering enjoyable experiences; 2A represents tourist attractions with moderate facilities and services; A-level indicates basic-level tourist attractions with limited amenities and services. The figure was produced by the authors, and the data on scenic areas are sourced from the “List of A-level Tourist Attractions in Gansu Province” (as of 31 December 2022).
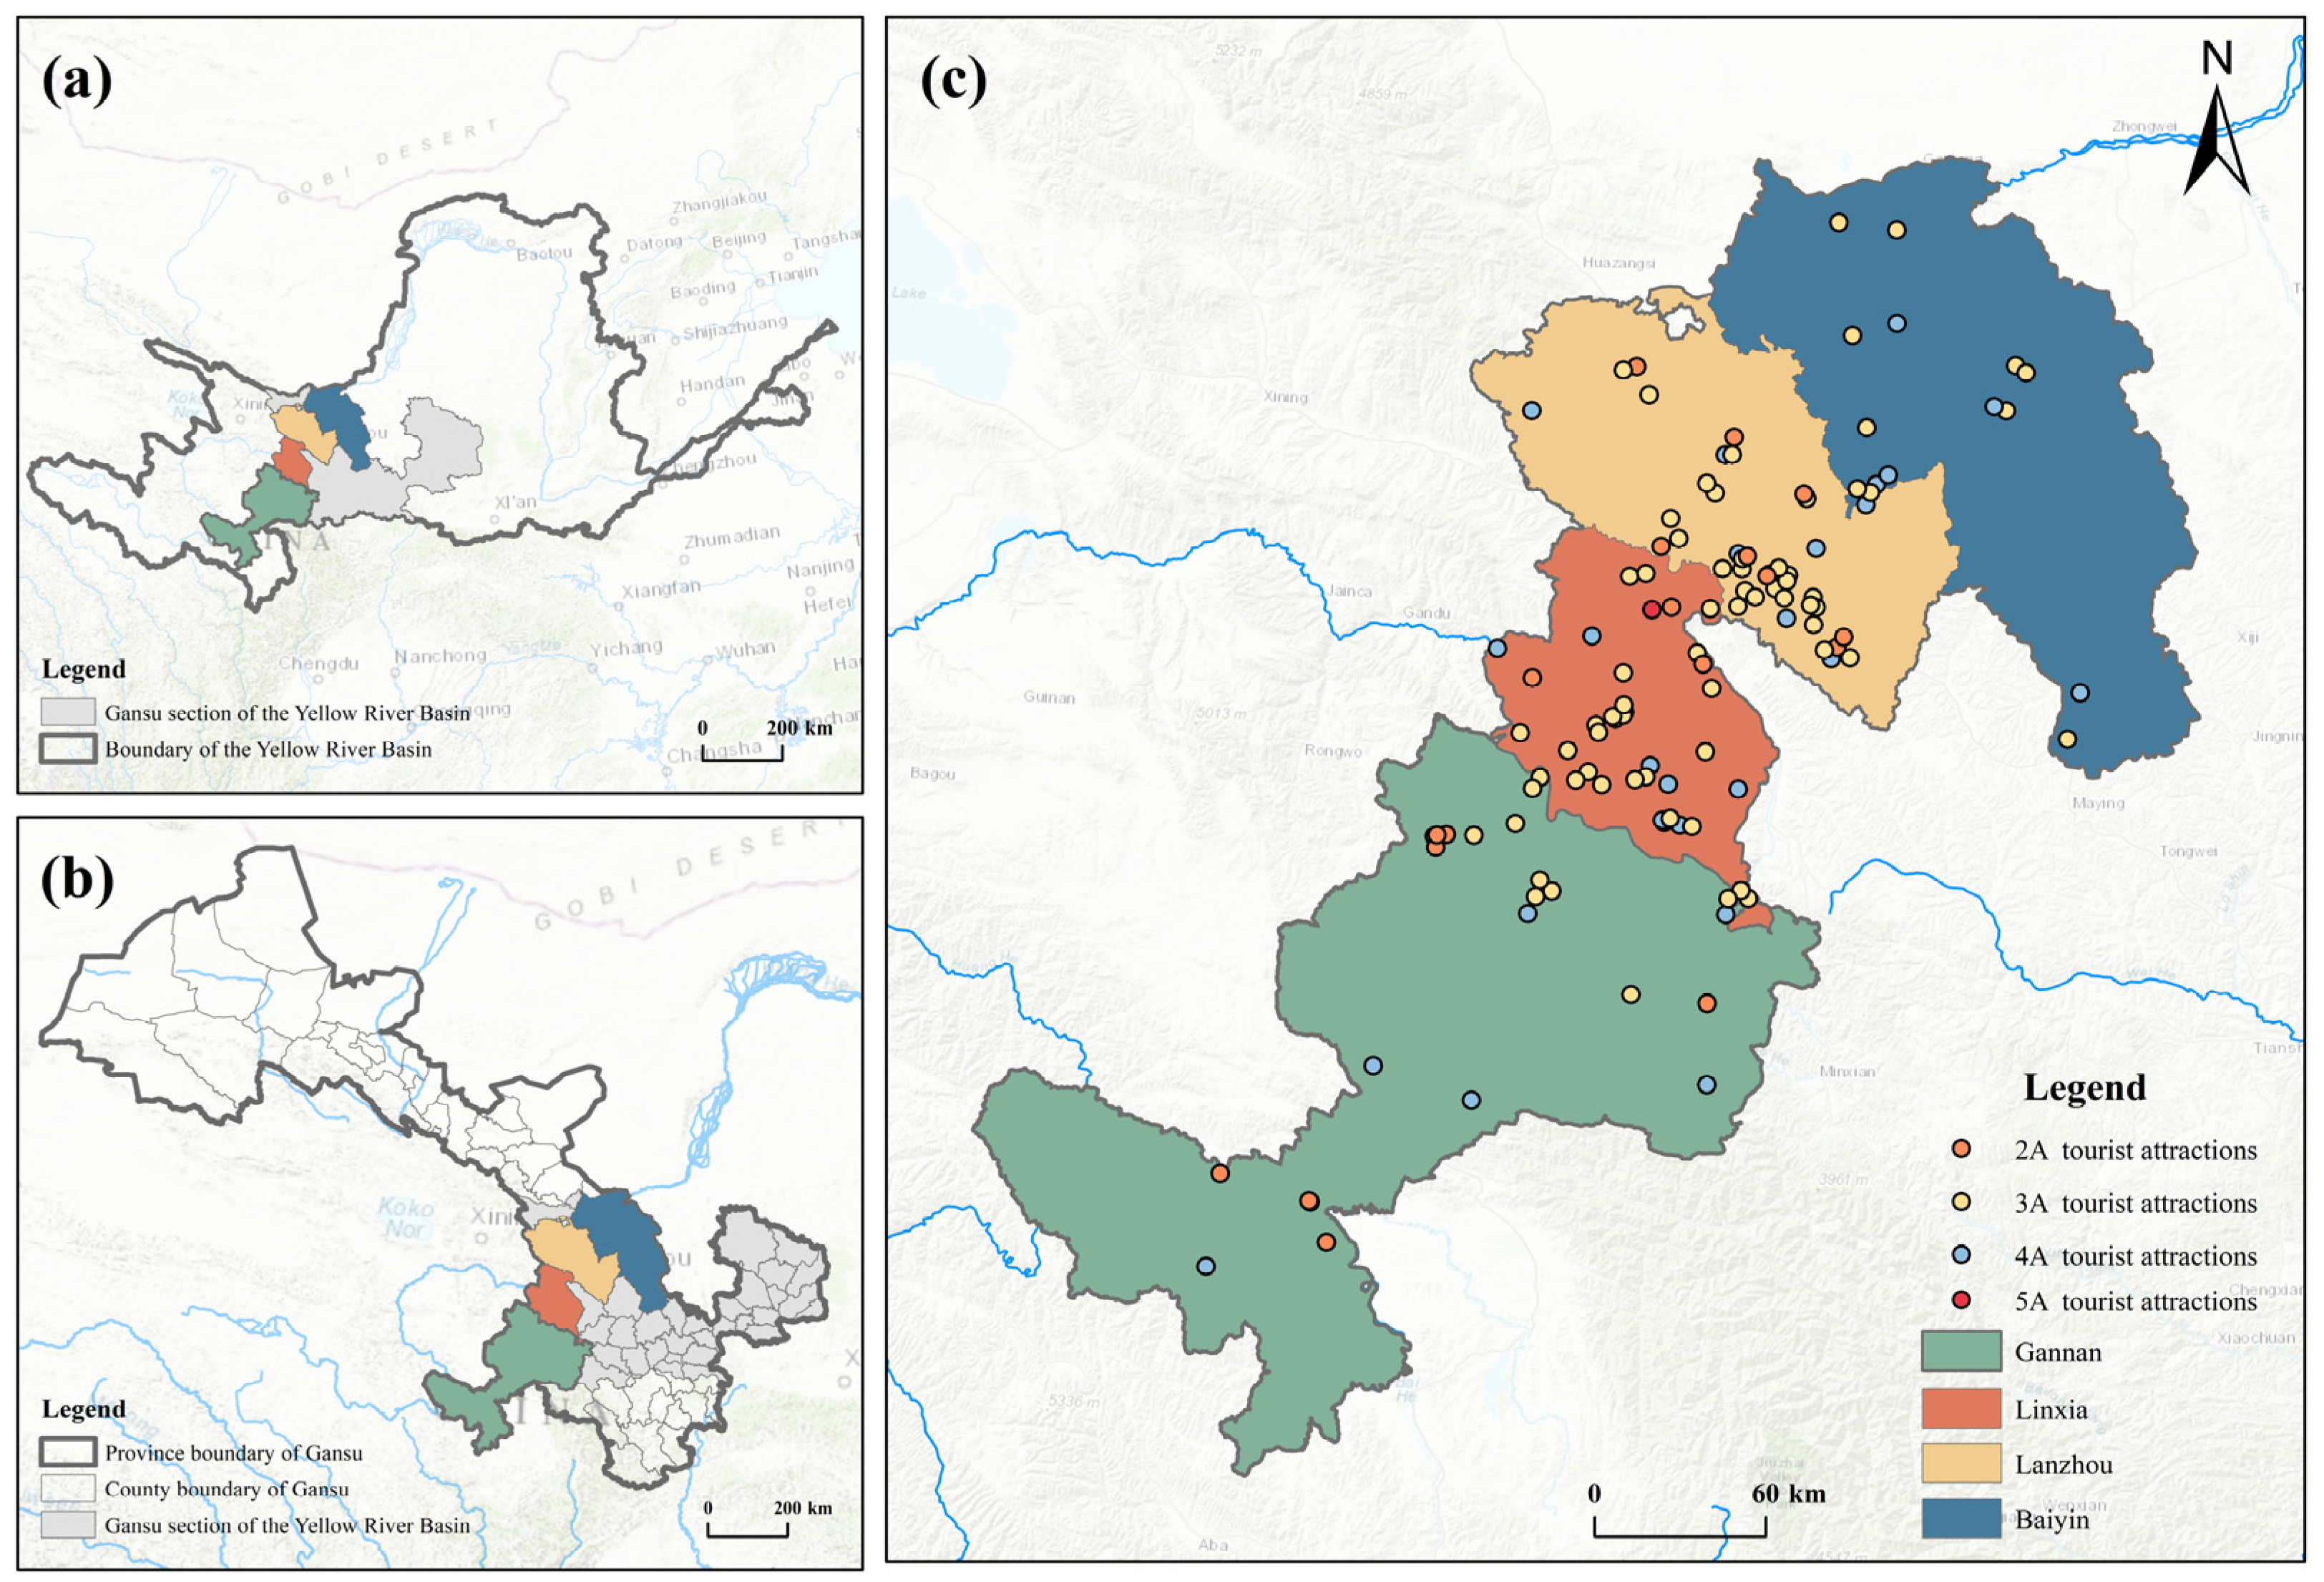
Figure 2.
Ecotourism resource of study area. Notes: Zhagana, one of the world’s 50 outdoor paradises in Gannan (top left); International Gliding Campsite Scenic Area in Linxia (top right); sheepskin raft drifting in the Yellow River in Lanzhou (bottom left); the Yellow River Stone Forest National Geological Park in Baiyin (bottom right).

Figure 3.
Random forest model computation flowchart.

Figure 4.
Ecotourism attractions in study area. Notes: (a) displays the area proportion of ecotourism attractions in municipalities and states within study area; (b) illustrates ecotourism attractions in the Gansu section of the Yellow River Basin; (c) shows the overall area proportion of ecotourism attractions within study area.

Figure 5.
Word clouds of ecotourism behavior. Notes: Figure 5 illustrates ecotourism behavior perceived by samples of ecotourists in the survey.
Figure 5.
Word clouds of ecotourism behavior. Notes: Figure 5 illustrates ecotourism behavior perceived by samples of ecotourists in the survey.

Figure 6.
Perception and variable importance analysis on ecotourist satisfaction, revisitation, and recommendation in different regions. Notes: (a1) and (a2), respectively, illustrate the perception and variable importance analysis on ecotourist satisfaction; (b1) and (b2), respectively, depict the outcomes of perception and variable importance analysis on ecotourist revisitation; (c1) and (c2), respectively, present the results of the perception and variable importance analysis on ecotourist recommendation.

Table 1.
Ecotourist perception evaluation index system for the Yellow River Basin (Gansu section).
| Ecotourism Perception | Indicators |
|---|---|
| Nature perception | Air freshness |
| Water clarity | |
| Vegetation coverage | |
| Accessibility perception | Good accessibility for external transportation |
| Excellent internal transportation facilities | |
| Service perception | Well-planned distribution of sanitation facilities |
| Well-established ecological conservation measures | |
| Atmosphere perception | Rich nature-based activities |
| Abundant ecotourism offerings | |
| Overall perception | I am satisfied with this visit |
| I would repeat the visit | |
| I will recommend the visit to my families and friends |
Table 2.
Classification of ecotourism attractions in the Yellow River Basin (Gansu section).
| Basic Land Cover Types | The Subclass of Tourism Resources | The Class of Tourism Resources (Area Ratio %) |
|---|---|---|
| Sparse plants/valley bare land (hilly valleys, stratigraphic profiles, vertical natural zones and other natural landmarks and natural landscape structural phenomena) | AA Natural landscape complex AB Geology and structural traces AC Surface configuration AD Natural markers and natural phenomena | A geographic landscape (82.480%) |
| Natural water bodies (rivers, lakes, waterfalls, and wetlands) | BA/BB Rivers/lakes | B Water landscape (0.698%) |
| Snow/ice (snow cover with relatively low temperature) | BD Snow and ice land | |
| Crops (wheat and flower) Woodland (single tree and jungle) | CA Vegetation landscape | C Biological landscape (12.784%) |
| Water-flooded vegetation (aquatic animals and birds) Sand/shrub (terrestrial animals and butterflies) | CB Wildlife habitat | |
| Construction area/human activity site (social and commercial activities, cultural activities, human settlements, bridges and roads, pavilions and other buildings) | EA Human landscape complex EB Practical architecture and core facilities EC Landscape and sketch architecture | E Architecture and facilities (4.038%) |
| National key cultural relics protection units (4 in Gannan; 7 in Linxia; 10 in Lanzhou; 3 in Baiyin) National historical and cultural town (1 in Gannan; 3 in Lanzhou) Historical and cultural blocks in Gansu Province (2 in Gannan; 2 in Linxia; 5 in Lanzhou) National intangible cultural heritage (Gannan: 13 of national and 49 of provincial; Linxia: 11 of national and 28 of provincial; Lanzhou: 5 of national and 42 of provincial; Baiyin: 2 of national and 21 of provincial) | FA Tangible cultural heritage FB Intangible cultural heritage | FA Tangible historical relics (37 in total) FB Intangible historical relics (171 in total) |
Table 3.
Demographic profile of ecotourists.
| Tourist Demographic | Ecotourists | Total | % | Tourist Demographic | Ecotourists | Total | % | ||
|---|---|---|---|---|---|---|---|---|---|
| Sex | Male | 296 | 545 | 54.31 | Household monthly income (Yuan) | No | 152 | 260 | 58.46 |
| Female | 236 | 442 | 53.39 | Less than 3000 | 67 | 151 | 44.37 | ||
| Age | <18 | 28 | 67 | 41.79 | 3000–5000 | 155 | 299 | 51.84 | |
| 18–30 | 265 | 449 | 59.02 | 5000–8000 | 93 | 171 | 54.39 | ||
| 30–45 | 130 | 221 | 58.82 | More than 8000 | 65 | 106 | 61.32 | ||
| 45–60 | 90 | 188 | 47.87 | Occupation | Student | 21 | 34 | 61.76 | |
| 60–77 | 17 | 57 | 29.82 | Civil servant | 91 | 186 | 48.92 | ||
| >77 | 2 | 5 | 40.00 | Company employees | 60 | 100 | 60.00 | ||
| Education | High school or below | 76 | 219 | 34.70 | Senior management | 49 | 69 | 71.01 | |
| Junior college | 89 | 172 | 51.74 | Teachers | 175 | 297 | 58.92 | ||
| Undergraduate | 320 | 538 | 59.48 | Workers | 22 | 69 | 31.88 | ||
| Graduate and above | 47 | 58 | 81.03 | Retired personnel | 58 | 104 | 55.77 | ||
| Self-employment | 14 | 52 | 26.92 | ||||||
| Others | 42 | 76 | 55.26 | ||||||
Table 4.
Ecotourist perception of different cities.
| Ecotourist Perception | Variables | Mean of Ecotourist Perception | Mean of Variables | ||||||||
|---|---|---|---|---|---|---|---|---|---|---|---|
| GN | LX | LZ | BY | GN | LX | LZ | BY | F-Value | p-Value | ||
| Nature perception | Air | 4.076 | 3.99 | 4.107 | 4.138 | 4.16 | 4.16 | 4.36 | 4.26 | 0.44 | 0.72 |
| Water | 4.08 | 4.09 | 3.95 | 4.08 | |||||||
| Vegetation | 3.99 | 3.72 | 4.01 | 4.07 | |||||||
| Accessibility perception | External transportation | 3.503 | 3.836 | 4.050 | 3.954 | 3.47 | 3.84 | 4.05 | 4.03 | 15.9 | 0.00 |
| Internal transportation | 3.53 | 3.83 | 4.05 | 3.87 | |||||||
| Service perception | Sanitation facilities | 3.605 | 3.914 | 4.073 | 4.069 | 3.56 | 3.92 | 4.16 | 4.03 | 14.5 | 0.00 |
| Conservation measures | 3.65 | 3.91 | 3.99 | 4.10 | |||||||
| Atmosphere perception | Nature-based activities | 3.281 | 3.445 | 3.476 | 3.586 | 3.11 | 3.37 | 3.34 | 3.60 | 2.84 | 0.00 |
| Ecotourism offerings | 3.45 | 3.52 | 3.61 | 3.58 | |||||||
Table 5.
Perceptions importance analysis on ecotourist satisfaction, revisitation, and recommendation in different cities.
Table 5.
Perceptions importance analysis on ecotourist satisfaction, revisitation, and recommendation in different cities.
| Ecotourist Perception | Satisfaction(%) | Revisitation (%) | Recommendation (%) | |||||||||
|---|---|---|---|---|---|---|---|---|---|---|---|---|
| GN | LX | LZ | BY | GN | LX | LZ | BY | GN | LX | LZ | BY | |
| Nature perception | 10.1 | 4.5 | 9.2 | 13.2 | 8.2 | 11.0 | 8.6 | 11.5 | 17.4 | 9.4 | 11.4 | 16.0 |
| Accessibility perception | 14.4 | 13.7 | 9.1 | 13.9 | 10.7 | 6.4 | 11.3 | 13.0 | 7.1 | 11.0 | 10.4 | 14.1 |
| Service perception | 14.5 | 16.8 | 14.9 | 8.7 | 13.5 | 12.6 | 6.7 | 17.2 | 13.5 | 14.6 | 12.8 | 6.6 |
| Atmosphere perception | 6.0 | 12.7 | 12.2 | 7.7 | 13.6 | 14.5 | 19.1 | 2.6 | 3.4 | 10.4 | 9.7 | 5.3 |
Notes: Darker colors indicate greater variable importance, whereas lighter colors denote lesser variable importance.
Table 6.
Variable importance analysis on ecotourist satisfaction, revisitation, and recommendation in different cities.
Table 6.
Variable importance analysis on ecotourist satisfaction, revisitation, and recommendation in different cities.
| Ecotourist Perception | Variables | Satisfaction (%) | Revisitation (%) | Recommendation (%) | |||||||||
|---|---|---|---|---|---|---|---|---|---|---|---|---|---|
| GN | LX | LZ | BY | GN | LX | LZ | BY | GN | LX | LZ | BY | ||
| Nature perception | Air | 13.9 | 4.2 | 12.6 | 11.9 | 10.2 | 14.1 | 7.2 | 5.1 | 20.3 | 8.1 | 5.0 | 14.5 |
| Water | 12.6 | 2.0 | 8.7 | 5.6 | 6.2 | 6.2 | 12.0 | 8.3 | 12.8 | 15.2 | 20.7 | 19.9 | |
| Vegetation | 3.8 | 7.4 | 6.4 | 21.9 | 8.1 | 12.7 | 6.6 | 21.0 | 19.0 | 4.9 | 8.6 | 13.5 | |
| Accessibility perception | External transportation | 22.3 | 14.7 | 9.4 | 18.0 | 12.9 | 5.1 | 14.9 | 8.2 | 1.8 | 10.0 | 9.8 | 16.1 |
| Internal transportation | 6.4 | 12.8 | 8.8 | 9.8 | 8.5 | 7.7 | 7.8 | 17.9 | 12.3 | 12.0 | 11.0 | 12.1 | |
| Service perception | Sanitation facilities | 16.3 | 19.3 | 21.6 | 10.5 | 16.1 | 18.8 | 8.9 | 22.7 | 18.3 | 8.5 | 19.2 | 10.1 |
| Conservation measures | 12.7 | 14.2 | 8.2 | 6.8 | 10.8 | 6.5 | 4.5 | 11.7 | 8.7 | 20.6 | 6.3 | 3.1 | |
| Atmosphere perception | Nature-based activities | 6.0 | 14.4 | 13.5 | 7.7 | 12.4 | 10.8 | 22.4 | 0.6 | 2.2 | 5.8 | 9.5 | 3.9 |
| Ecotourism offerings | 6.0 | 11.0 | 10.8 | 7.7 | 14.8 | 18.2 | 15.7 | 4.5 | 4.7 | 15.0 | 9.9 | 6.7 | |
Notes: Darker colors indicate greater variable importance, whereas lighter colors denote lesser variable importance.
Disclaimer/Publisher’s Note: The statements, opinions and data contained in all publications are solely those of the individual author(s) and contributor(s) and not of MDPI and/or the editor(s). MDPI and/or the editor(s) disclaim responsibility for any injury to people or property resulting from any ideas, methods, instructions or products referred to in the content. |
© 2024 by the authors. Licensee MDPI, Basel, Switzerland. This article is an open access article distributed under the terms and conditions of the Creative Commons Attribution (CC BY) license (https://creativecommons.org/licenses/by/4.0/).
Share and Cite
MDPI and ACS Style
Yuan, J.; Gao, H.; Shen, Y.; Ma, G. Spatial Differentiation of Ecotourist Perceptions Based on the Random Forest Model: The Case of the Gansu Section of the Yellow River Basin. Land 2024, 13, 560. https://doi.org/10.3390/land13040560
AMA Style
Yuan J, Gao H, Shen Y, Ma G. Spatial Differentiation of Ecotourist Perceptions Based on the Random Forest Model: The Case of the Gansu Section of the Yellow River Basin. Land. 2024; 13(4):560. https://doi.org/10.3390/land13040560
Chicago/Turabian StyleYuan, Jing, Hang Gao, Yanlong Shen, and Guoqiang Ma. 2024. "Spatial Differentiation of Ecotourist Perceptions Based on the Random Forest Model: The Case of the Gansu Section of the Yellow River Basin" Land 13, no. 4: 560. https://doi.org/10.3390/land13040560
Note that from the first issue of 2016, this journal uses article numbers instead of page numbers. See further details here.