
Ecological Risk Assessment of Land Use Change in the Tarim River Basin, Xinjiang, China

1
School of Economics and Management, University of Chinese Academy of Sciences, Beijing 100190, China
2
Natural Resources Bureau of Xinjiang Production and Construction Corps, Urumqi 830000, China
3
School of Earth and Environment, Anhui University of Science and Technology, Huainan 232001, China
4
Key Laboratory of Land Surface Pattern and Simulation, Institute of Geographic Sciences and Natural Resources Research, Chinese Academy of Sciences, Beijing 100101, China
5
Hebei Collaborative Innovation Center for Urban-Rural Integration Development, Shijiazhuang 050061, China
*
Author to whom correspondence should be addressed.
Land 2024, 13(4), 561; https://doi.org/10.3390/land13040561
Submission received: 24 March 2024
/
Revised: 15 April 2024
/
Accepted: 20 April 2024
/
Published: 22 April 2024
(This article belongs to the Special Issue Landscape Ecological Risk in Mountain Areas)
Abstract
:In recent years, global climate change and human alterations to land use have led to a decrease in ecosystem services, making ecosystems more vulnerable. However, unlike the well-established risk assessment frameworks used in natural disaster research, the concept of ecological risks arising from changes in land use is still in its early stages, with its nuances and assessment methodologies yet to be clearly defined. This study proposes a new framework for assessing ecological risks resulting from changes in land use in the Tarim River Basin. The framework employs a coupled PLUS and Invest model to evaluate the ecological risks of land use change under three development scenarios projected for the Tarim River Basin in Xinjiang by 2035. The findings indicate that: (1) Between 2000 and 2020, the predominant land use types in the Tarim River Basin in Xinjiang were primarily unused land, followed by grassland and cropland. Conversely, grassland, water, and construction land were relatively less prevalent. During this period, the area of unused land and cultivated land increased, while grassland, forest land, and water exhibited a declining trend. Moving forward, under the three scenarios from 2020 to 2035, land use changes in the study area are characterized by the expansion of cropland and unused land, coupled with a significant decrease in grassland area, while other land categories demonstrate minor fluctuations. (2) From 2020 to 2035, across various scenarios, the total ecosystem service within the study area demonstrates an overall increasing trend in both the northern and southern marginal zones. Specifically, under the baseline scenario, the total amount of ecosystem services in the study area decreased by 15.247% compared to 2020. Similarly, under the economic development scenario, this decrease amounted to 13.358% compared to 2020. Conversely, under the ecological protection scenario, the decrease reached 19.852% compared to 2020. (3) The structure of ecological risk levels from 2020 to 2035, across multiple scenarios, demonstrates a consistent pattern, characterized by a predominant proportion of moderate risk. Conversely, other risk levels occupy relatively smaller proportions of the area.
1. Introduction
Since the beginning of the 21st century, the combination of human activities and natural processes has caused significant changes in land use and global ecosystems. This has brought attention to the ecological risks associated with changes in land use [1,2], which are a major concern for both developed and developing nations [3]. Human alterations to land use patterns in recent decades have significantly disrupted ecosystems, resulting in ecological functional degradation, soil erosion, land desertification, environmental pollution, and diminishing biodiversity [4,5]. These alterations have markedly increased ecosystem risks [6] and pose severe threats to human well-being [7,8,9,10]. Assessing ecological risks associated with changes in land use and identifying their causes is essential for establishing an ecological risk warning system. This system can help accurately and effectively control ecological risks, guide human behavior, and provide a scientific basis for ecological construction.
The concept of ecological risk assessment originated in the United States Environmental Protection Agency (EPA), which defines ecological risk as the probability of adverse ecological impacts resulting from exposure to one or more stressors [10]. Since the 1990s, ecological issues have become increasingly prominent, leading to a shift in the focus of risk assessment from human health to ecological risk assessment [11]. This shift has extended to populations, communities, and entire ecosystems. Ecological risk is typically defined as the probability and magnitude of adverse effects on ecosystem structure, function, stability, and sustainability caused by external stressors [12]. As research scales expand from local to regional, a significant branch of ecological risk research has emerged, known as regional ecological risk assessment. This primarily evaluates the probability and extent of adverse effects of environmental pollution, human activities, or natural disasters on multiple risk receptors at the regional scale [13]. Currently, ecological risk sources include natural variability and human activities. Within the domain of natural disasters, a theoretical and methodological framework for ecological risk assessment has been established [14,15]. Changes in land use can reflect the impact of human activities on natural ecosystems [16,17]. Such changes can have significant ecological impacts on atmospheric, soil, aquatic, and biological systems [18]. These impacts are cumulative and can have regional effects.
The assessment of ecological risks associated with changes in land use primarily focuses on urban areas, watersheds, coastal regions, administrative districts, and nature reserves. In urban areas, frequent conversions among different land use types due to excessive population density and rapid spatial expansion have resulted in increasingly prominent ecological issues [19,20]. Watershed areas are ecologically sensitive due to their poor natural endowments, particularly water resources. The landscape in these areas experiences both ecological improvement and deterioration. However, the deterioration trend outweighs the improvement trend, leading to an intensification of landscape ecological deterioration [21,22]. During the development of coastal areas, uncontrolled urban expansion in the early stages of economic development can lead to landscape fragmentation, which increases overall ecological risk and tends to concentrate spatially. However, as expansion is restrained, overall ecological risk decreases [23,24]. Establishing conceptual models for ecological risk assessment and determining quantitative assessments of ecological risk present significant challenges due to the complexity of ecosystems and the uncertainty of risk occurrence.
Two mature theories and methods currently exist in the field of ecological risk assessment. The first is the traditional assessment approach based on the source–pathway–receptor theory, known as “source analysis–receptor assessment–exposure and hazard assessment–risk characterization’ [25]. The Relative Risk Model (RRM) is widely employed for conceptual model construction within this framework. For example, Muditha K. and Heenkenda used this assessment system to rank and classify pressure sources and habitats in a specific area. They modeled the interactions between them using exposure and effect filters, revealing the spatio-temporal distribution of ecological risks in a port setting [26,27]. Yu et al. [28] constructed a “source–pressure source–ecosystem–ecological adverse endpoint” assessment framework based on the principles of RRM to predict and rank the potential ecological risks of various sub-regions in Xiamen Bay. In comparison to RRM, the Landscape Pattern Risk Assessment and Evaluation (LPRAE) method is more commonly used to assess single risk sources. LPRAE quantitatively evaluates ecological risk by assessing the likelihood of ecological risk occurrence within a region and the losses caused by risk sources to risk receptors [29]. Another method involves ecological risk assessment based on landscape ecology theory. This method emphasizes the impact of landscape patterns on specific ecological functions or processes and focuses on the overall loss of landscape in providing ecosystem services and ecological functions [30,31]. Evaluation indicators include landscape fragility, resilience, and stability. Research outcomes emphasize the comprehensive characterization and spatial visualization of multiple risk sources, supporting sustainable landscape planning, design, and ecological management. Landscape ecological risk assessments often overlook the structure and functionality of the ecosystem, focusing solely on the landscape perspective. Despite the fact that the landscape represents only a small portion of the entire ecosystem, assessments are typically static, failing to account for the dynamic nature of land use changes. As a result, landscape ecological risk assessments do not adequately capture the fluctuations in ecological risks associated with land use changes. Current risk assessment methodologies only consider the impact of baseline land use changes, without exploring the potential transitions between different land use types and ignoring future risks. Therefore, a new approach is needed to evaluate the ecological risks associated with land use changes, capable of addressing the dynamic alterations in land use and the complex nature of ecosystems.
The Tarim River Basin (TRB) is located in an extremely arid region of China and is heavily influenced by dry climates and intense human activities. As a result, significant alterations in ecological processes have occurred, leading to a heightened ecological vulnerability (EV). Furthermore, rapid urbanization and extensive cropland development in the region have resulted in dramatic changes to the ecosystem. The study’s logical framework focuses on analyzing and simulating land use changes, assessing ecosystem service functions, and spatially identifying and evaluating ecological risks. To achieve this, we coupled the PLUS and Invest models [32] to simulate potential future scenarios of land use changes in the TRB under three development scenarios for the year 2035: baseline development, economic development, and ecological conservation. The economic Sharpe ratio [33] is subsequently introduced to integrate land use simulation results and ecosystem services into ecological risk assessment. This study provides empirical evidence for ecological risk assessment in the TRB by analyzing the spatiotemporal differentiation of ecological risks associated with land use changes under the three development scenarios for 2035 and exploring their attribution. It also offers technical support and a multi-level research approach for similar study areas.
2. Overview of the Study Area and Data Sources
2.1. Overview of the Study Area
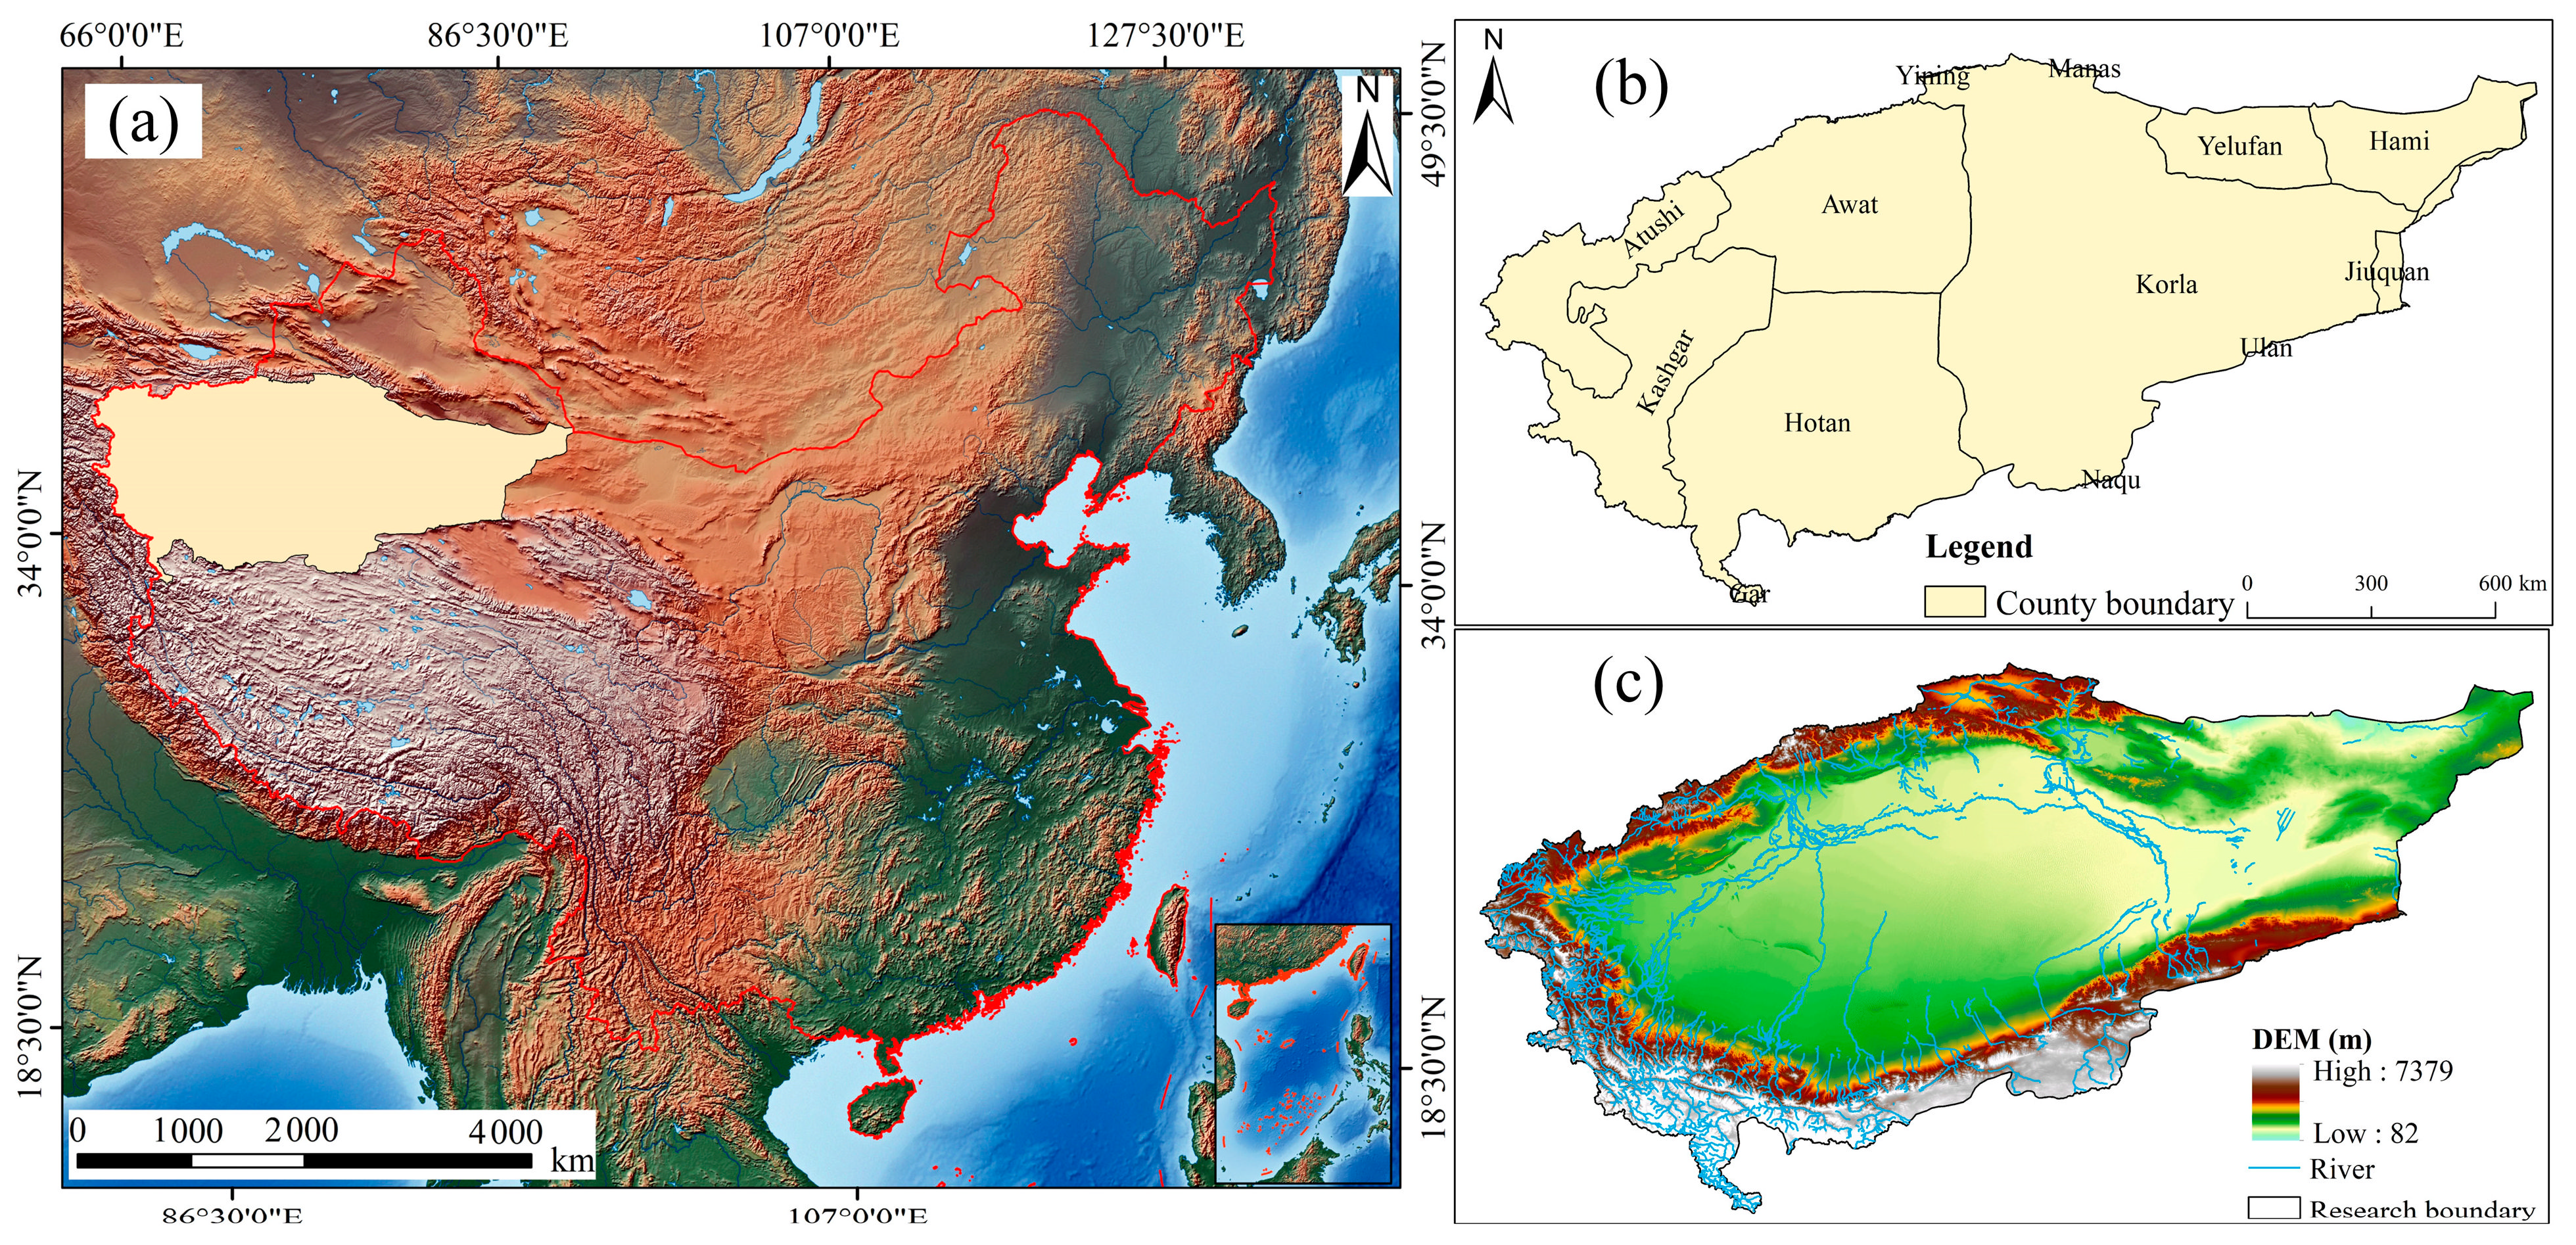
The Tarim River is the largest inland river in China, stretching 2179 km in length, and ultimately flowing into the Taitema Lake. Its basin covers an area of 1.02 million square kilometers, accounting for approximately one-sixth of China’s territory [34]. The geographical coordinates range from longitude 71°39′ E to 93°45′ E and latitude 34°20′ N to 43°39′ N. The TRB has a total of 42.9 billion cubic meters of water resources, with 39.83 billion cubic meters being surface water resources and 3.07 billion cubic meters being groundwater resources. Its climate is typical of a temperate arid continental climate, characterized by abundant sunshine, dryness, strong winds, large diurnal temperature variations, sparse precipitation, and intense evaporation. This region contains 54% of the world’s natural poplar forests and 90% of China’s natural poplar forests. It serves as a gene bank for poplar forest resources and is a crucial component of China’s “Two Screens and Three Belts” ecological security strategy. Its ecological significance is irreplaceable [35] (Figure 1).
2.2. Data Sources
The study utilized various types of data, including land use, topographic, meteorological, socioeconomic, and other sources (Table 1). All data were resampled to a spatial resolution of 250 m and projected onto the WGS_1984_World_Mercator coordinate system.
3. Methodology
3.1. Research Framework
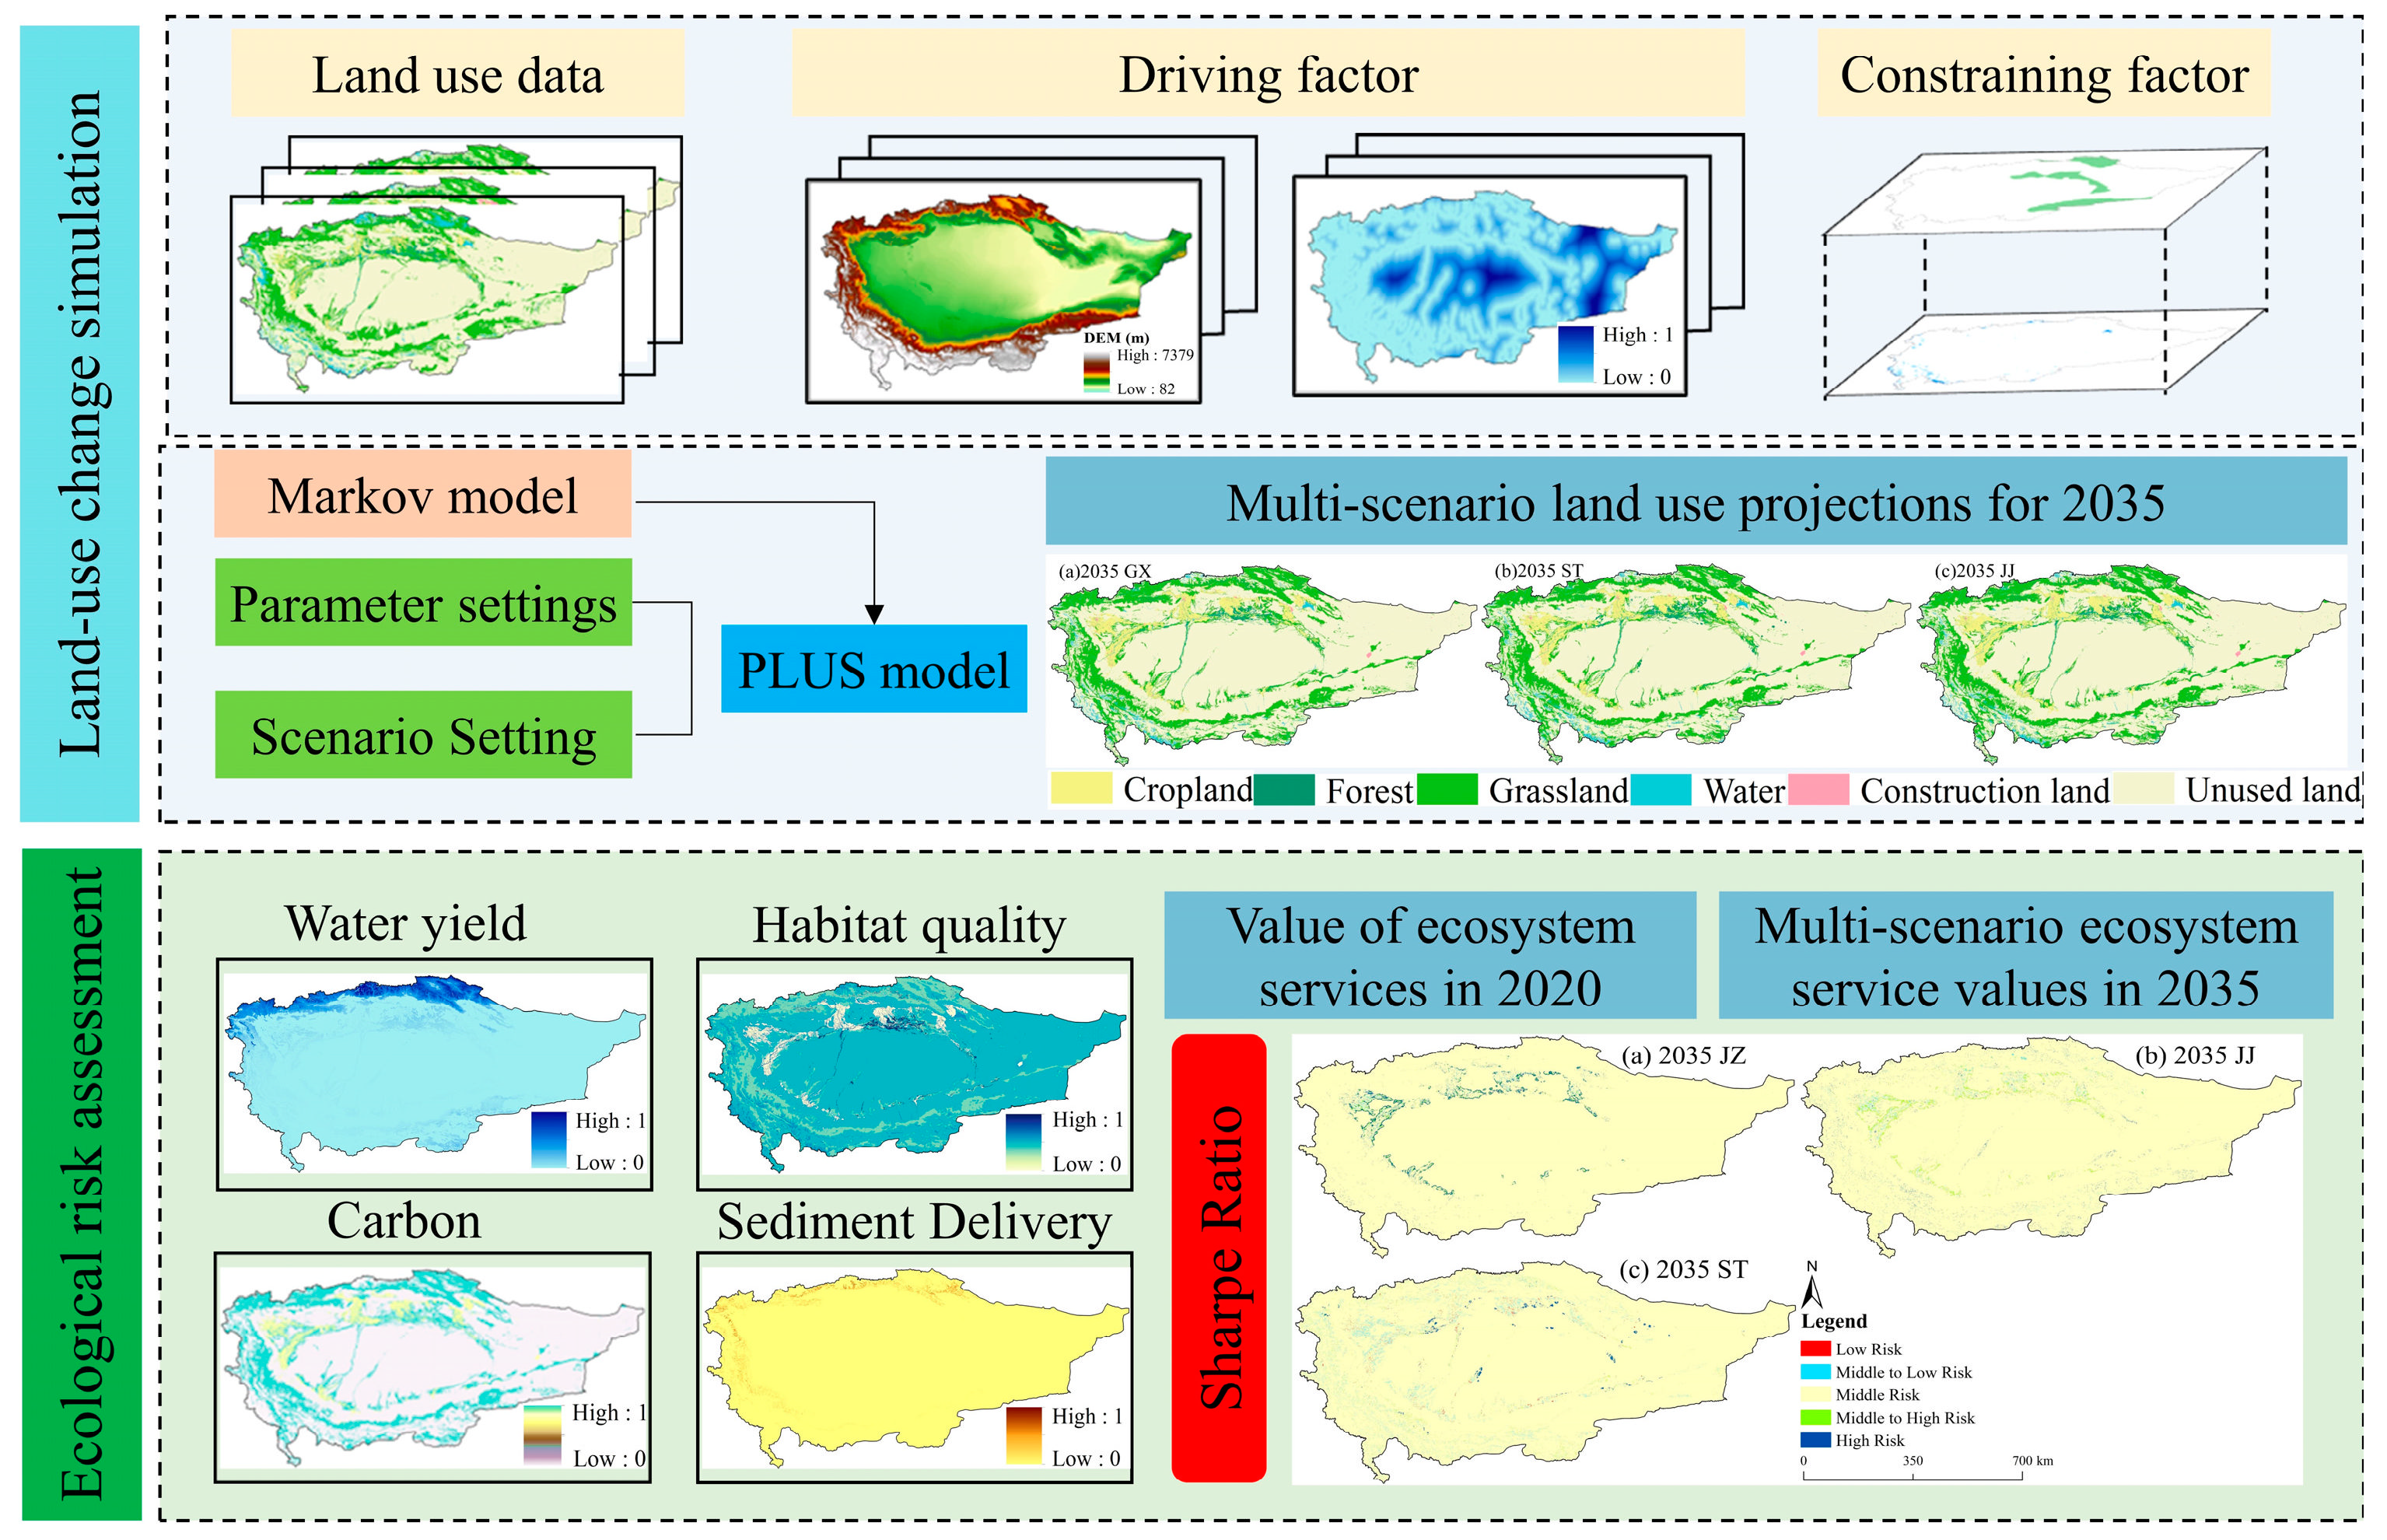
This study analyzes the ecological risks associated with land use changes in the TRB of China. The PLUS model was used to simulate three scenarios for the year 2035: baseline development, economic development, and ecological conservation. Four ecosystem service functions were quantified: water yield, carbon storage, soil retention, and habitat quality. The study quantified the ecological risk of land use changes using the Sharpe ratio and simulated the spatial distribution of ecological risks under three scenarios. Figure 2 illustrates the specific framework.
3.2. Quantification of Ecosystem Services
3.2.1. Carbon Stocks
The Carbon module in the InVEST model version 3.9.2 was used to evaluate and study land use cover type and carbon stock. The overall carbon stock was calculated by determining the above-ground carbon stock of vegetation, below-ground carbon stock of vegetation, soil carbon stock, and dead organic matter carbon stock using a specific carbon density reference [36]. The calculation formula is as follows:
where Ctotal is the total carbon stock, Cabove is the above-ground part of the carbon stock, Cbelow is the below-ground part of the carbon stock, Csoil is the soil carbon stock, and Cdead is the dead organic carbon stock.
3.2.2. Water Production
The water production module in the Invest model uses the water balance principle based on Budyko’s [37] coupled hydrothermal equilibrium assumptions and average annual precipitation data. This means that the annual water production, Y(x), for each raster cell, x, in the study area is calculated as the difference between precipitation and actual evapotranspiration, which is shown in the formulas below:
where Yxj is the average annual water production of grid x, and Px is the annual rainfall of grid x. Since the actual annual evapotranspiration cannot be obtained by direct measurement, it can be approximated by using a curve to AETx/Px. The Rx value is dimensionless and is an index of dryness of grid x, which can be calculated from the potential evapotranspiration and rainfall. wx is an empirical parameter that can be calculated. AWCx is the vegetation available water content, which is determined by soil texture and effective soil depth, and is used to determine the total amount of water stored and provided by the soil for plant growth. Z is known as the Zhang coefficient [38], and the final Z coefficient was determined to be 3.6 in this study.
3.2.3. Soil Conservation
Soil conservation aims to reduce soil erosion by improving the structure of vegetation. This is achieved by calculating the potential soil erosion and sand production, as well as the real erosion and sand production, based on the topography of the study area region, precipitation, and other factors. The difference between these two measurements is used as the quantitative value of soil conservation. The specific formulas are shown below:
where Qsrx is the soil retention, Qse_px is the potential soil erosion, Qse_ax is the actual soil erosion, Rx is the rainfall erosivity factor, Kx is the soil erodibility factor, Lx is the slope length factor, Sx is the slope gradient factor, Cx is the vegetation cover factor, and Px is the factor that indicates soil and water conservation measures.
3.2.4. Habitat Quality
The InVEST model’s habitat quality module quantifies regional habitat quality by considering the range of vegetation types in a given area and the degree of degradation of each type. The model assumes that areas with good habitat quality also have high biodiversity. Specific calculations are as follows:
where Dxj denotes the degree of habitat degradation of raster x in habitat type j; R is the number of threat factors; Wr is the weight of the threat source r; Yr is the number of rasters of the threat source; ry is the coercion value of raster y; irxy is the accessibility of the threat source to raster x; βx is the sensitivity of the habitat type j to the threat source r; and dxy denotes the level of stress exerted by the grid cell y on grid x, with two types of effects—linear and exponential.
where dxy is the straight-line distance between grid x and grid y; and dr max the maximum coercive distance of the threat source r. The habitat quality formula is:
In the equation, Qxj represents the habitat quality index of grid x in habitat type j; Hj denotes the habitat suitability of habitat type j, ranging from 0 to 1; k is the half-saturation constant, set to half of the maximum habitat degradation degree, designated as 0.5; z is the normalization constant, typically set to 2.5. Threat sources are extracted from cropland, construction land, and unused land. The maximum threat distance, weight, attenuation type, and sensitivity of different habitats for each threat source are specified in Table 2.
This study selected cropland, construction land, and unused land directly affected by anthropogenic factors as threat factors based on the geographical environment and land use patterns in the TRB, as well as the model user manual [37] and existing relevant literature [39]. The maximum threat distance, weight, and decay characteristics of the threat factors were determined through comparison and calibration, as specified in Table 3.
3.2.5. Quantification of Total Ecosystem Services
To emphasize the significance of ecosystems, this study selected four key indicators for ecosystem service assessment in the TRB based on the principles of data accessibility, necessity, and priority, and considering the current situation and ecological service importance. These indicators include water conservation, habitat quality, soil erosion, and carbon storage. According to this research, the total quantity of ecosystem services in the TRB is the sum of soil retention, water yield, habitat quality, and carbon storage, which represent four critical ecosystem service functions.
where ESIj represents the sum of standardized values of the four ecosystem services in grid j. It signifies the total ecosystem service in grid j. ESNij denotes the standardized ith ecosystem service in grid j. To standardize the four dimensions of ecosystem services, the values are normalized to ensure that the value of each ecosystem service falls between 0 and 1.
where ESNij is the ith ecosystem service in standardized grid j; ESij represents the value of the ith ecosystem service in grid j; ESmax is the maximum value of the ith ecosystem service in grid j; ESmin is the minimum value of the ith ecosystem service.
Thus, the value of ESI, j, ranges from 0 to 4; higher values indicate a higher capacity of the ecosystem to provide ecosystem services. To facilitate subsequent calculations, ESI was normalized using the formula. j is again a value between 0 and 1; values close to 1 indicate a higher capacity of the ecosystem to provide ecosystem services.
3.3. Model of PLUS Land-Use Dynamics
3.3.1. The PLUS Model
The PLUS model is a cellular automaton (CA) model that simulates land use/land cover (LULC) changes at the patch scale using raster data. It integrates rule mining methods based on land expansion analysis and a CA model based on multi-type random seed mechanisms. This allows for the identification of driving factors of land expansion and the prediction of the patch-level evolution of land use landscapes. The PLUS model enhances existing CA models by utilizing the Transition Analysis Strategy (TAS) and Pattern Analysis Strategy (PAS) to better represent patch-level changes in land use processes. It also employs landscape dynamic change simulation strategies and targets transformation rule mining strategies. Furthermore, the Transformation Rule Mining Framework (LEAS) and the Cellular Automaton Random Seed (CARS) model offer advantages in land expansion analysis. To assess the accuracy of simulated land use data, we generated simulation data for the year 2020 based on baseline land use data from 2000 and 2010. We validated the accuracy of both real and simulated land use data using the Figures of Merit (FOM) coefficient and the Overall coefficient. The FOM for the year 2020 was 0.135, and the overall coefficient was 0.813. These results demonstrate a high level of spatial consistency between the two layers, satisfying future scenario simulations. Please refer to reference [40] for specific formulas.
3.3.2. Multi-Scenario Model
Land use change predictions involve planning interventions, incentives, and restrictive measures. Changes in natural reserves and infrastructure may alter the land development process when modeling future scenarios. The PLUS model, which utilizes historical land use changes and suitability maps, can forecast land use scenarios for specific future dates. In this study, three future scenarios were set: the baseline development scenario, ecological protection scenario, and urban expansion scenario.
(1) Baseline Development Scenario (JZ): The LULC changes in this scenario follow the current development trends from 2000 to 2020. The areas of LULC types in 2035 were obtained through Markov chain analysis.
(2) Ecological Protection Scenario (ST): This scenario primarily focuses on a development pattern centered around protecting forest ecosystems within the basin. This scenario utilizes the most recent data on natural reserves in China to establish ecological limitations and incentives for land changes within the reserves. Transfer probabilities from cropland, grassland, unused land, and construction land to forest land are increased by 50%, while probabilities of transfer from forest land to grassland, construction land, cropland, and unused land are decreased by 40%.
(3) Economic Development Scenario (JJ): This scenario assumes an acceleration in the rate of conversion from grassland, unused land, and construction land to cropland of 50%. Similarly, the rate of conversion from grassland, cropland, and unused land to construction land is also accelerated by 50%, based on thresholds set by previous studies and expert opinions.
3.4. Quantification of Ecological Risk Indicators
The purpose of this paper is to evaluate the Regional Ecological Risk Index (ERI) using the Sharpe ratio. The formula for the Sharpe ratio is provided below:
where E(Rp) is the expected return of the portfolio and Rf is the risk-free rate; E(Rp) − Rf is the excess return of the portfolio and σp is the standard deviation of the portfolio, which is used to measure the level of risk. The ratio is an indicator of risk-adjusted return. The higher the ratio, the higher the return for a given level of risk, and vice versa. Drawing on this concept, future ESV at a given spatial unit can be considered as the expected ecological return, and uncertainty about future land use change can be considered as risk. Combined with the scenario approach, the likelihood of future land use patterns and corresponding ESV can be obtained. However, the Sharpe ratio is anomalous when negative excess returns are encountered. Therefore, the formula was improved. The evaluation model for ERI is shown below:
where ERIj is the ecological risk index of region j, and is the excess ecological return of region j, which is calculated by subtracting the risk-free ecological return from the expected ecological return. In this study, ESVkj is the ESV of region j in 2020 as the risk-free ecological regression, ESVij is the total ecosystem services of region j under scenario i in 2030 as the expected ecological regression, and σj is the standard deviation of EER.
4. Results
4.1. Analysis of the Evolution of Spatial and Temporal Patterns of Land Use
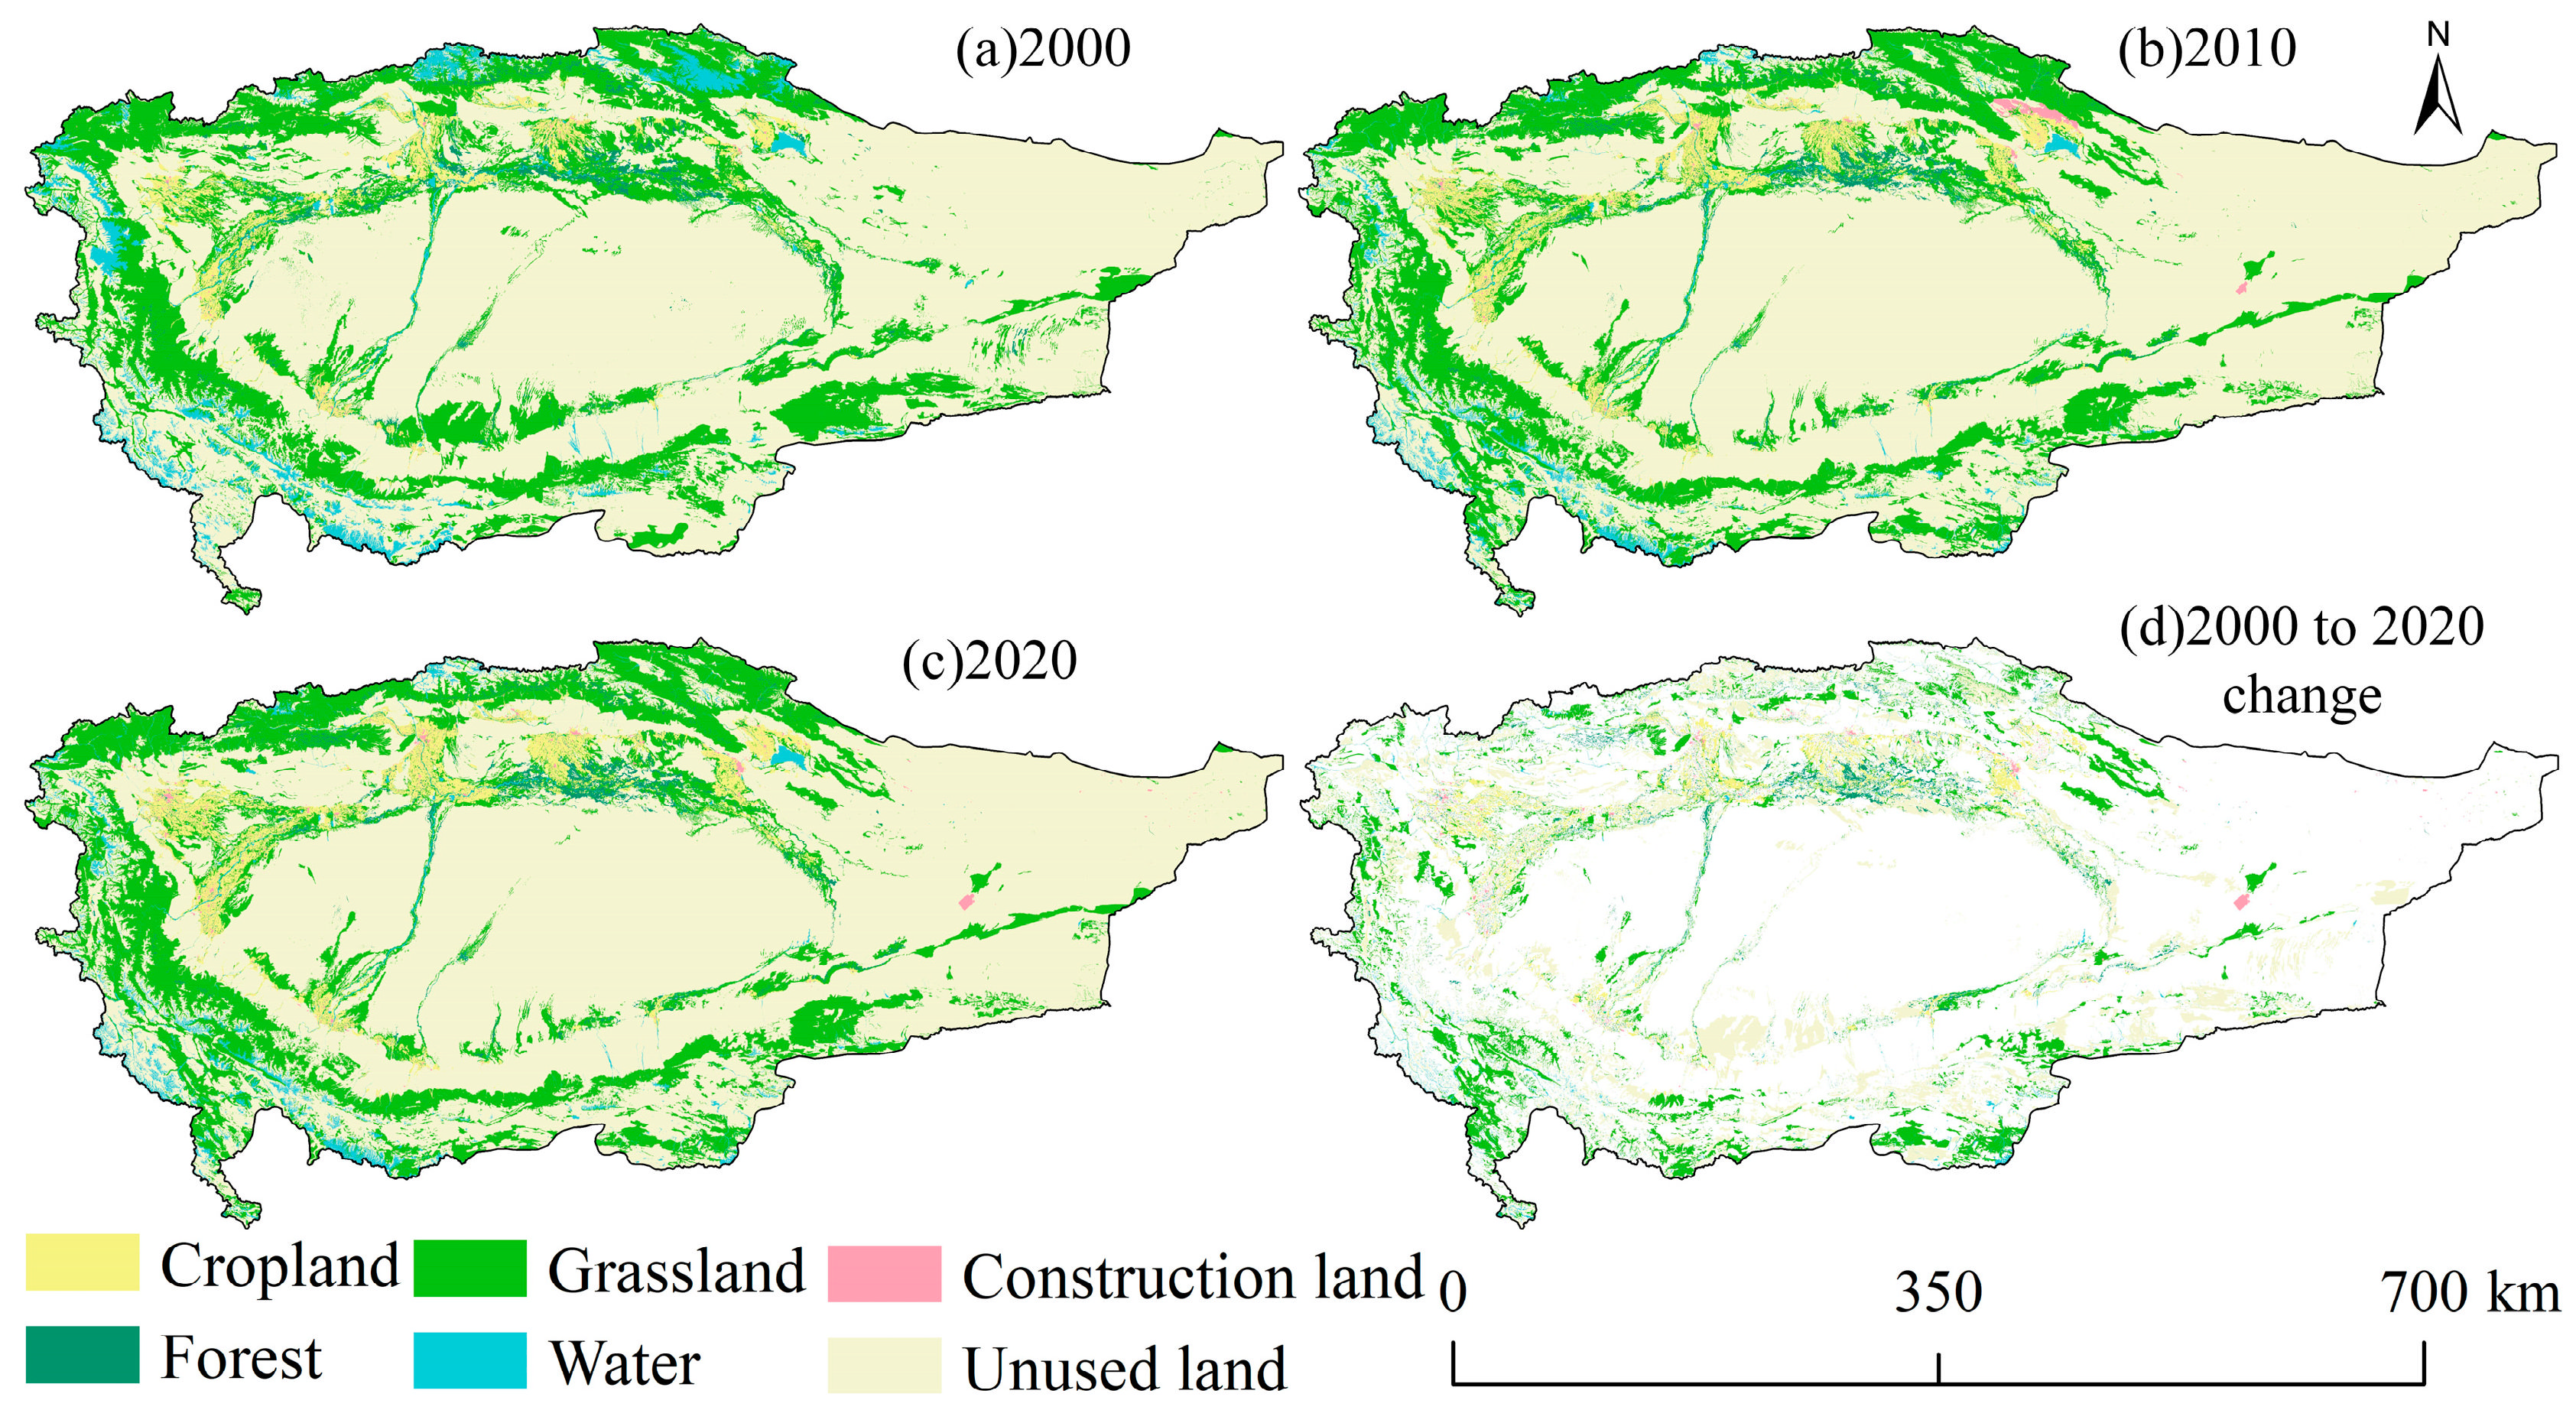
From 2000 to 2020, the land use types in the study area were predominantly unused land, followed by grassland and cropland, with comparatively fewer areas covered by grassland, water, and construction land (refer to Figure 3). Unused land is concentrated mainly in the central part of the basin, belonging to the Taklimakan Desert region. Cropland is primarily distributed in the central-western and southwestern central zones, while forestland is concentrated in the Awat area in a strip-like pattern. Grassland predominantly occupies the northern and southern edge areas, with substantial area coverage, while water and construction land are relatively dispersed. Table 4 shows that from 2000 to 2020, cropland, construction land, and unused land increased, while forestland, grassland, and water decreased. The proportion of unused land increased significantly by 1.72%, and cropland increased by 1.54%. In contrast, the grassland area experienced the most significant decrease, with its proportion declining by 1.87%. This was followed by a decrease in water proportion by 1.45% and forestland area proportion by 0.10%. However, the area of construction land only saw a marginal increase of 0.17%. Therefore, from 2000 to 2020, there were minimal changes in the area of construction land and forestland.
4.2. Spatial Increase or Decrease in Different Land Use Types
The study analyzes the spatial dynamics of different land use types during historical periods, showing the areas of increase and decrease for each category from 2000 to 2020. Figure 4 illustrates that cropland has increased mainly in the northwest of Kashgar and the central region of Awat, with a relatively concentrated distribution. Conversely, the areas experiencing loss of cropland are sparse and scattered. Regions with increased forestland exhibit a sporadic distribution patterns, whereas areas with decreased forestland are primarily concentrated in the central region of Awat. Increased grassland areas are sporadically distributed along the southern fringe, whereas areas of decrease are mainly concentrated in the northwest of Kashgar, the central region of Awat, and the northern part of Manas, displaying a relatively concentrated distribution. There are no substantial changes observed in water. Areas of increased construction land are predominantly distributed in the eastern part of Korla, while areas of decrease are primarily concentrated in the northern region of Korla, exhibiting a relatively concentrated distribution. Regions of increased unused land are mainly situated in the northern part of Korla, with a relatively concentrated distribution, whereas areas of decrease in unused land are predominantly characterized by sparse and scattered distribution patterns.
4.3. Multi-Scenario Model of Land-Use Change
Using the 2020 baseline image, and based on the expansion changes in land use between 2010 and 2020 in the study area, three scenarios of land use in the TRB for 2035 were simulated (refer to Figure 5).
Compared to 2020, according to the statistical data under the baseline development scenario, the area of cropland increased by 15,976.63 km2, with a growth rate of 2.46%; the area of water increased by 945.19 km2, with a growth rate of 0.13%. Meanwhile, the areas of forestland, grassland, and unused land decreased by 480.31 km2, 13,352 km2, and 2461.81 km2, respectively, with reduction rates of 0.12%, 2.64%, and 1.40%. Under the economic development scenario, the areas of cropland, water, and construction land increased by 24,545.79 km2, 996.13 km2, and 702.31 km2, respectively, with growth rates of 2.95%, 1.40%, and 0.21%; whereas the areas of forestland, grassland, and unused land decreased by 499.90 km2, 19,622.50 km2, and 6121.84 km2, respectively, with reduction rates of 0.13%, 3.00%, and 1.37%.
Figure 5 depicts the expansion of cropland towards the northwest in the Kashgar area under the baseline development scenario (Figure 5b). The encroachment of cropland and unused land on grasslands is significant, particularly in the northwest region. Unused land primarily expands towards the marginal zones, while changes in construction land, forestland, and water are less pronounced. Under the economic development scenario (Figure 5d), cropland expands more actively in the northwest of Kashgar, the central region of Awat, and the northern region of Korla. In particular, there is extensive encroachment of grassland by cropland in the northwest of Kashgar and the central region of Awat. Unused land mainly encroaches upon grassland at the margins and continues to expand towards the periphery, while construction land predominantly exhibits scattered patchy distributions in the northern region. Under the economic development scenario (see Figure 5c), the expansion of cropland is notably active in the northwest of Kashgar, the central region of Awat, and the northern region of Korla. Extensive encroachment of cropland into grassland is observed in the northwest of Kashgar and the central region of Awat. Forestland expansion is concentrated in the eastern region of Awat and the western region of Korla, displaying patchy distributions. Water exhibits more active expansion in the southwest of Hotan and the northern region of Yining.
4.4. Characterizations of Ecosystem Services under Different Model Scenarios
The total ecosystem service quantity in the study area exhibits significant spatial heterogeneity, showing a general increasing trend in the northern and southern marginal zones. Specifically, under the baseline development scenario, the total ecosystem service quantity decreased by 15.247% compared to 2020, with a decrease of 3.818% in water yield, 0.02% in habitat quality, and 0.061% in carbon storage, and an increase of 0.036% in soil retention. Under the economic development scenario, the total ecosystem service quantity decreased by 13.358% compared to 2020, with a decrease of 4.81% in water yield, 0.253% in habitat quality, and 0.005% in carbon storage, and an increase of 0.451% in soil retention. Under the urban expansion scenario, the total ecosystem service quantity decreased by 19.852% compared to 2020, with a decrease of 3.628% in water yield and 0.516% in habitat quality, an increase of 0.011% in carbon storage, and a decrease of 7.113% in soil retention.
There is significant regional variation in ecosystem services in the study area, with ecosystem service conditions in the marginal areas significantly better than those in the plains (see Figure 6). Specifically, significant changes are observed in the northwestern, southern, and western parts of the study area, while minimal changes are noted in the central and eastern regions, with the lowest values of ecosystem service functions. Particularly, the spatial distribution of soil retention function predominantly exhibits low values, with relatively higher values observed in the northern and western marginal areas. Water yield appears to be clustered in large areas of high-value regions in the northern area, while the spatial distribution characteristics of habitat quality and carbon storage remain consistent with the overall ecosystem services, showing a pattern of high values in the periphery and low values in the central region.
4.5. Characteristics of Changes in the Distribution of Ecological Risks under Different Scenarios
Based on the statistics of changes in risk zones at various levels, it is clear that in 2035, the ecological risk level structure in the study area will be dominated by medium risk, with other risk levels accounting for a small proportion of the total area. It is important to note that this analysis is objective and does not include any subjective evaluations. The medium-risk zones cover the largest and most widespread area, accounting for over 97% of the total ecological risk level area. In contrast, the low-risk zones are the smallest, each accounting for less than 0.2%. Under the baseline development scenario, the area distribution of high-risk levels is the widest, accounting for 1.14%. Meanwhile, the area of medium-risk levels reaches its maximum under the economic development scenario, accounting for 98.17%, followed by the baseline development scenario, accounting for 98.03%. In the medium-high risk levels, the economic development scenario increases by 0.36% compared to the ecological protection scenario. Meanwhile, the ecological protection scenario has the largest proportions of low-risk and medium–low-risk levels, accounting for 0.15% and 1.32%, respectively, with increases of 0.12% and 1.05%.
The spatial distribution of risk zones remains consistent across the three scenarios, mainly dominated by medium risk (see Figure 7). However, there are significant changes in the medium–low-risk and high-risk levels. Under the baseline development scenario (see Figure 7a), high-risk areas are primarily located in the northwest of Kashgar, the central part of Awate, the central part of Hotan, and the northwest direction of Korla. The widest distribution of high-risk areas is in the northwest of Kashgar, while other regions exhibit scattered and patchy distributions. In the economic development scenario (see Figure 7b), the main changes occur in the medium–high-risk and medium–low-risk aspects. Medium–low-risk areas are concentrated mainly in the northwest of Kashgar and the central part of Awate. Medium–high-risk areas are mainly distributed in the central part of Kashgar, the north-central part of Awate, the northwest of Korla, and the central part of Hotan. Other areas exhibit scattered patchy distributions. Regarding ecological protection (see Figure 7c), significant changes occur mainly in the medium–low-risk level. These changes are mainly distributed in Atushi, the central and northern parts of Kashgar, the northern part of Awate, the central and southern parts of Hotan, and the central part of Korla. The distribution in Kashgar is the most concentrated, while the high-risk level is mainly distributed in scattered patches, mainly concentrated in the Kashgar and Awate areas.
5. Discussion
5.1. Spatial Heterogeneity of Ecological Risk Indices and Their Formation Mechanisms
Land is a crucial element for socio-economic activities, and serves as a tangible representation of human development and utilization of the natural environment. Changes in land structure and patterns are closely related to the spatiotemporal distribution of ecological risk. By assessing the spatial patterns of ecological risk, we can reveal the impacts of land use changes on the structure and function of ecosystems. In the TRB report of 2035, the spatial distribution of ecological risk remained largely unchanged across all three scenarios. The risk tends to increase from the central part of the basin towards the periphery, with medium risk being the most common. The study area is characterized by peripheral regions with high- and medium-high risk areas, while low- and relatively low-risk areas are mainly distributed around the basin. The most extensive distribution of areas with medium risk is observed. Unused land is the predominant land use type in the study area, especially in the basin’s central region, which includes the Taklamakan Desert, China’s largest and the world’s tenth-largest desert, as well as the second-largest mobile desert globally. As a result of the land use types, the overall ecosystem services in the basin’s central region are relatively low [41]. The transitional zones adjacent to the desert have extensive grasslands and forests. However, these areas are experiencing a decrease in forest, grassland, and water due to the encroachment and expansion of unused land [42]. As a result, ecosystem services are declining. In this environmentally harsh region, the types of land available for human development and utilization are relatively limited. Therefore, the expansion of construction land will not be significant over the next 20 years, although it will be relatively concentrated in distribution.
Under the baseline development scenario, land use changes mainly follow historical developmental trends. The expansion of cropland and unused land predominates, while there is a trend of decreasing ecological land areas such as forests, grasslands, and water. Construction land experiences concentrated expansion, with relatively insignificant land encroachment. However, the proportion of cropland and unused land encroaching on other ecological areas increases, leading to significantly reduced vegetation cover, sparse vegetation, severe soil erosion, and intense desertification. Consequently, ecosystem service indices, such as water yield, habitat quality, and carbon storage, are relatively low, while soil conservation service indices increase. Under the baseline development scenario, the transitional zones at the periphery of the basin present higher ecological risks. Therefore, it is necessary to control agricultural and ecological spaces. Protection measures should be improved in the agroforestry transition zones, as well as in the grassland and unused land transition zones, to enhance forest and grass cover and strengthen ecosystem stability. In the scenario of economic development, rapid urbanization and agricultural expansion worsen human activities, which significantly contribute to the decline in regional ecological environment quality [43]. The expansion of construction and cropland increases the size of areas classified as medium- to high-risk. Urbanization accelerates soil erosion and water loss, while cropland expansion encroaches upon other ecological land, resulting in decreased grassland and forest areas. This threatens ecological balance [44]. Therefore, ecological risks in transitional areas between cropland and grassland or forest are worsened. In the ecological protection scenario, the proportion of cropland, forest land, and water increases, resulting in significant changes in areas classified as low-ecological-risk and medium–low-ecological-risk. These changes are mainly concentrated in the transitional zones between grassland and cropland, which are characterized by high vegetation cover, high organic matter content in soil, and fertile soil, thus exhibiting strong ecosystem service functions. However, the study area’s unique location and fragile ecological environment exacerbate the pressures on cropland, forest land, and unused land due to intensified human disturbances. Therefore, it is crucial to nurture mountain vegetation and water resources in this region for sustainable development.
Simulations of multiple future scenarios indicate an urgent need to optimize land use structures to provide decision support for sustainable development and high-quality ecological environments. Considering the extensive desertification in the hinterland of this basin, which may exacerbate desertification in peripheral areas, it is imperative to rationally plan urban development boundaries, limit uncontrolled expansion, and improve land use efficiency at the same time. Urban development boundary planning is significant in mitigating the exacerbation of desertification and improving land use efficiency [45]. To enhance the ecological benefits of forest and grassland areas with low to medium–low ecological risks, it is essential to promote the positive feedback evolution of forest–grassland ecosystems and urgently strengthen land remediation efforts. The goal is to intensify cropland and grassland use, limit the disorderly expansion of unused and construction land, and harmonize relationships among various ecological landscapes. This will reduce ecological risk levels and enhance the stability of the land ecosystem. Additionally, measures can be taken to increase soil carbon sequestration and fertility potential. This can be achieved by actively implementing ecological protection projects [46], optimizing species richness, enhancing ecosystem stability and resilience, and promoting synergies among ecosystem services. These actions can enhance ecosystem productivity and sustainability [47,48].
The TRB is a crucial ecological barrier in western China. The degradation of its ecological environment poses significant challenges to the high-quality development of ecological civilization. The rapid development and transformation of urban construction have inevitably altered land use patterns and functions, leading to ecological risks. In the core area of the study region, the activation speed of marginal sand dunes has accelerated, posing a severe threat to cropland. This is particularly concerning as artificial oases continue to expand, replacing natural ones. As a result, the buffer zone between oases and deserts is continuously shrinking, which has a negative impact on desert-edge vegetation. Therefore, to implement the concept of guided restoration, it is essential to create artificial ecosystems in the Taklamakan Desert by constructing artificial oases. Additionally, adjusting the industrial structure and optimizing the allocation of agriculture, forestry, animal husbandry, and subsidiary industries can help mitigate the risks of vegetation destruction caused by human activities. Under the conditions of economic and technological priority, broad-scale afforestation is an effective method for protecting vegetation on the edges of deserts. Therefore, it is necessary to strictly adhere to policies and regulations to protect the ecological environment, mitigate the negative impacts of human activities on the environment, and promptly initiate ecological restoration efforts.
5.2. Comparison with Previous Research
Currently, the ecological risks of land use changes in the TRB have not been assessed. This study integrates simulated land use results and ecosystem services into ecological risk assessment by introducing the economic Sharpe ratio [33].
Extensive research has been conducted on the ecosystem services of the TRB. The ecological security assessment, based on ecological footprint, indicates that water scarcity is a significant constraint on the socio-economic development of the TRB. This is exacerbated by climate change and rapid cropland expansion. Furthermore, the significant growth of artificial ecosystems, referred to as artificial oases, resulting from the transformation of natural oases or deserts, worsens landscape fragmentation and the ongoing degradation of ecological security levels in the basin [49]. The increase in ecological risks due to water scarcity is consistent with the findings of this study, primarily resulting in a gradual rise in ecological risks in the transitional zones between cropland and forests. The TRB indicates an overall increase in ecosystem vulnerability levels, with some areas experiencing extremely severe vulnerability [50]. This finding is consistent with the gradual rise in ecological risk levels discussed in this study. The evaluation of ecological risks resulting from ecosystem degradation shows a significant correlation between these risks and the swift urbanization and expansion of cropland, which are the primary drivers of ecological risks in the TRB [13].
The study shows that the spatial distribution of ecological risk resulting from land use change in the TRB is closely aligned with the spatial distribution pattern of ecosystem service functions in the TRB after the implementation of ecological restoration projects, as described in other studies [51]. This suggests that human activities significantly influence land use change-induced ecological risks.
5.3. Shortcomings and Prospects
The PLUS model’s Markov module relies exclusively on past land use changes for quantitative prediction. However, accurately predicting the transfer of land use types in the future is challenging due to the influence of multiple factors, limiting the model’s accuracy. To enhance accuracy, it is advisable to comprehensively consider policy and natural economic factors for precise quantitative analysis. Furthermore, the spatiotemporal evolution of ecological risk is influenced by multiple factors, which requires additional research. To clarify the impact of land use change on ecological risk, longer time series studies are necessary, along with a thorough investigation of the relationship between ecosystem services and ecological risk. In summary, future research on the ecological risk of land use change should consider multiple variables, including social, economic, and environmental factors, and conduct more empirical studies. Furthermore, ecological protection should be a dynamic adaptive response, focusing on the trends of land use change in high-risk areas, and intensifying land restoration efforts to enhance resilience against ecological risks.
6. Conclusions
(1) Between 2000 and 2020, the primary land use types in the study area were unused land, followed by grassland and arable land. Grassland, water, and construction land had relatively less coverage. There was a significant increase in unused and arable land, while grassland, forest land, and water exhibited a declining trend. From 2020 to 2035, the main trend in the three development scenarios was the expansion of arable and unused land, while the grassland area decreased significantly. There were minimal changes in other land types. Unused land was mainly clustered in the central part of the basin, while arable land was concentrated in the central areas of Kashgar and Awat. The Awat region had a strip-like pattern of forest land, while the northern and southern marginal areas had mainly grassland. Water and construction land areas were relatively dispersed in comparison.
(2) Between 2020 and 2035, the total quantity of ecosystem services in the study area showed significant spatial differentiation under various scenarios. There was an overall increasing trend in the total quantity of ecosystem services in the northern and southern marginal areas. Under the baseline development scenario, the total quantity of ecosystem services decreased by 15.247% compared to 2020. Under the economic development scenario, it decreased by 13.358% compared to 2020. Under the ecological protection scenario, it decreased by 19.852% compared to 2020.
(3) Between 2020 and 2035, various scenarios showed that ecological risk levels had similar characteristics. The majority of the areas fell under the moderate-risk category, with other risk levels accounting for a smaller proportion of the total area. Moderate-risk areas had the largest and most widespread distribution, covering over 97% of the total ecological risk level area. Conversely, low-risk areas had the smallest area, with proportions all below 0.2%. In various scenarios, the distribution of high-risk areas varied. In the baseline development scenario, high-risk areas were mainly located in the northwest of Kashgar, the central part of Awate, the central part of Hotan, and the northwest part of Korla. Under the economic development scenario, there were significant changes in the distribution of moderate–high-risk and moderate–low-risk areas. Under the ecological protection scenario, there were noticeable changes in the distribution of moderate- to low-risk areas. These changes were mainly concentrated in specific regions, with Kashgar having the most concentrated distribution.
Author Contributions
Y.C. and X.Z.: methodology, software, data curation, validation, and writing—original draft; Y.C. and X.Z.: project administration and writing—review and editing; W.S.: conceptualization, funding acquisition, writing—review and editing. All authors have read and agreed to the published version of the manuscript.
Funding
This research was funded by The Third Comprehensive Scientific Investigation in Xinjiang (Grant No. 2022xjkk0905).
Data Availability Statement
All relevant data sets in this study are described in the manuscript.
Conflicts of Interest
The authors declare no conflicts of interest.
References
- Foley, J.A.; DeFries, R.; Asner, G.P.; Barford, C.; Bonan, G.; Carpenter, S.R.; Chapin, F.S.; Coe, M.T.; Daily, G.C.; Gibbs, H.K. Global consequences of land use. Science 2005, 309, 570–574. [Google Scholar] [CrossRef] [PubMed]
- García-Nieto, A.P.; Geijzendorffer, I.R.; Baró, F.; Roche, P.K.; Bondeau, A.; Cramer, W. Impacts of urbanization around Mediterranean cities: Changes in ecosystem service supply. Ecol. Indic. 2018, 91, 589–606. [Google Scholar] [CrossRef]
- Omar, H.; Cabral, P. Ecological risk assessment based on land cover changes: A case of Zanzibar (Tanzania). Remote Sens. 2020, 12, 3114. [Google Scholar] [CrossRef]
- Wu, X.; Hu, F. Analysis of ecological carrying capacity using a fuzzy comprehensive evaluation method. Ecol. Indic. 2020, 113, 106243. [Google Scholar] [CrossRef]
- Bryan, B.A.; Gao, L.; Ye, Y.; Sun, X.; Connor, J.D.; Crossman, N.D.; Stafford-Smith, M.; Wu, J.; He, C.; Yu, D. China’s response to a national land-system sustainability emergency. Nature 2018, 559, 193–204. [Google Scholar] [CrossRef] [PubMed]
- Qiu, M.; Zuo, Q.; Wu, Q.; Yang, Z.; Zhang, J. Water ecological security assessment and spatial autocorrelation analysis of prefectural regions involved in the Yellow River Basin. Sci. Rep. 2022, 12, 5105. [Google Scholar] [CrossRef] [PubMed]
- Schirpke, U.; Tasser, E.; Borsky, S.; Braun, M.; Eitzinger, J.; Gaube, V.; Getzner, M.; Glatzel, S.; Gschwantner, T.; Kirchner, M. Past and future impacts of land-use changes on ecosystem services in Austria. J. Environ. Manag. 2023, 345, 118728. [Google Scholar] [CrossRef] [PubMed]
- Cao, Q.; Zhang, X.; Lei, D.; Guo, L.; Sun, X.; Wu, J. Multi-scenario simulation of landscape ecological risk probability to facilitate different decision-making preferences. J. Clean. Prod. 2019, 227, 325–335. [Google Scholar] [CrossRef]
- Chen, J.; Dong, B.; Li, H.; Zhang, S.; Peng, L.; Fang, L.; Zhang, C.; Li, S. Study on landscape ecological risk assessment of Hooded Crane breeding and overwintering habitat. Environ. Res. 2020, 187, 109649. [Google Scholar] [CrossRef]
- US Environmental Protection Agency. Risk Assessment Forum 1992. Report on the Ecological Risk Assessment Guidelines Strategic Planning Workshop; US Environmental Protection Agency: Washington, DC, USA, 1992. [Google Scholar]
- Tian, P.; Li, J.; Gong, H.; Pu, R.; Cao, L.; Shao, S.; Shi, Z.; Feng, X.; Wang, L.; Liu, R. Research on land use changes and ecological risk assessment in Yongjiang River Basin in Zhejiang Province, China. Sustainability 2019, 11, 2817. [Google Scholar] [CrossRef]
- Liang, Y.; Song, W. Integrating potential ecosystem services losses into ecological risk assessment of land use changes: A case study on the Qinghai-Tibet Plateau. J. Environ. Manag. 2022, 318, 115607. [Google Scholar] [CrossRef]
- Deng, G.; Jiang, H.; Zhu, S.; Wen, Y.; He, C.; Wang, X.; Sheng, L.; Guo, Y.; Cao, Y. Projecting the response of ecological risk to land use/land cover change in ecologically fragile regions. Sci. Total Environ. 2024, 914, 169908. [Google Scholar] [CrossRef] [PubMed]
- Bertollo, P. Assessing landscape health: A case study from northeastern Italy. Environ. Manag. 2001, 27, 349–365. [Google Scholar] [CrossRef] [PubMed]
- Barnthouse, L.W.; Suter, I.I. User’s Manual for Ecological Risk Assessment; Oak Ridge National Lab.: Oak Ridge, TN, USA, 1986. [Google Scholar]
- Kong, X.; Fu, M.; Zhao, X.; Wang, J.; Jiang, P. Ecological effects of land-use change on two sides of the Hu Huanyong Line in China. Land Use Policy 2022, 113, 105895. [Google Scholar] [CrossRef]
- Liang, Y.; Song, W. Ecological and Environmental Effects of Land Use and Cover Changes on the Qinghai-Tibetan Plateau: A Bibliometric Review. Land 2022, 11, 2163. [Google Scholar] [CrossRef]
- Song, W.; Deng, X. Land-use/land-cover change and ecosystem service provision in China. Sci. Total Environ. 2017, 576, 705–719. [Google Scholar] [CrossRef]
- Wang, D.; Ji, X.; Li, C.; Gong, Y. Spatiotemporal variations of landscape ecological risks in a resource-based city under transformation. Sustainability 2021, 13, 5297. [Google Scholar] [CrossRef]
- Gao, L.; Tao, F.; Liu, R.; Wang, Z.; Leng, H.; Zhou, T. Multi-scenario simulation and ecological risk analysis of land use based on the PLUS model: A case study of Nanjing. Sustain. Cities Soc. 2022, 85, 104055. [Google Scholar] [CrossRef]
- Qu, Y.; Zong, H.; Su, D.; Ping, Z.; Guan, M. Land use change and its impact on landscape ecological risk in typical areas of the Yellow River Basin in China. Int. J. Environ. Res. Public Health 2021, 18, 11301. [Google Scholar] [CrossRef]
- Cheng, Y.; Song, W.; Yu, H.; Wei, X.; Sheng, S.; Liu, B.; Gao, H.; Li, J.; Cao, C.; Yang, D. Assessment and Prediction of Landscape Ecological Risk from Land Use Change in Xinjiang, China. Land 2023, 12, 895. [Google Scholar] [CrossRef]
- Zhang, W.; Chang, W.J.; Zhu, Z.C.; Hui, Z. Landscape ecological risk assessment of Chinese coastal cities based on land use change. Appl. Geogr. 2020, 117, 102174. [Google Scholar] [CrossRef]
- Li, J.; Pu, R.; Gong, H.; Luo, X.; Ye, M.; Feng, B. Evolution characteristics of landscape ecological risk patterns in coastal zones in Zhejiang Province, China. Sustainability 2017, 9, 584. [Google Scholar] [CrossRef]
- Men, C.; Liu, R.; Xu, L.; Wang, Q.; Guo, L.; Miao, Y.; Shen, Z. Source-specific ecological risk analysis and critical source identification of heavy metals in road dust in Beijing, China. J. Hazard. Mater. 2020, 388, 121763. [Google Scholar] [CrossRef] [PubMed]
- Heenkenda, M.K.; Bartolo, R. Regional ecological risk assessment using a relative risk model: A case study of the Darwin Harbour, Darwin, Australia. Hum. Ecol. Risk Assess. 2016, 22, 401–423. [Google Scholar] [CrossRef]
- Kanwar, P.; Bowden, W.B.; Greenhalgh, S. A regional ecological risk assessment of the Kaipara Harbour, New Zealand, using a relative risk model. Hum. Ecol. Risk Assess. 2015, 21, 1123–1146. [Google Scholar] [CrossRef]
- Yu, W.; Zhang, L.; Ricci, P.F.; Chen, B.; Huang, H. Coastal ecological risk assessment in regional scale: Application of the relative risk model to Xiamen Bay, China. Ocean. Coast. Manag. 2015, 108, 131–139. [Google Scholar] [CrossRef]
- Du, X.; Lin, X. Conceptual model on regional natural disaster risk assessment. Procedia Eng. 2012, 45, 96–100. [Google Scholar] [CrossRef]
- Du, L.; Dong, C.; Kang, X.; Qian, X.; Gu, L. Spatiotemporal evolution of land cover changes and landscape ecological risk assessment in the Yellow River Basin, 2015–2020. J. Environ. Manag. 2023, 332, 117149. [Google Scholar] [CrossRef] [PubMed]
- Yu, Z.; Deng, X.; Fu, P.; Grebby, S.; Mangi, E. Assessment of land degradation risks in the Loess Plateau. Land Degrad. Dev. 2024, 35, 2409–2424. [Google Scholar] [CrossRef]
- Liang, X.; Guan, Q.; Clarke, K.C.; Liu, S.; Wang, B.; Yao, Y. Understanding the drivers of sustainable land expansion using a patch-generating land use simulation (PLUS) model: A case study in Wuhan, China. Comput. Environ. Urban Syst. 2021, 85, 101569. [Google Scholar] [CrossRef]
- Sharpet, W.F. Capital asset prices: A theory of market equilibrium under conditions of risk. J. Financ. 1964, 19, 425–442. [Google Scholar]
- Feng, M.; Chen, Y.; Li, Z.; Duan, W.; Zhu, Z.; Liu, Y.; Zhou, Y. Optimisation model for sustainable agricultural development based on water-energy-food nexus and CO2 emissions: A case study in Tarim river basin. Energ. Convers. Manag. 2024, 303, 118174. [Google Scholar] [CrossRef]
- Chen, Y.; Li, Z.; Li, W.; Deng, H.; Shen, Y. Water and ecological security: Dealing with hydroclimatic challenges at the heart of China’s Silk Road. Environ. Earth Sci. 2016, 75, 881. [Google Scholar] [CrossRef]
- Zhang, Z. Study on Trade-Off Synergistic Relationships and Driving Factors of Key Ecosystem Services in Xinjiang Region. Master’s Thesis, Chinese Academy of Environmental Sciences, Beijing, China, 2023. [Google Scholar]
- Sharp, R.; Tallis, H.T.; Ricketts, T.; Guerry, A.D.; Wood, S.A.; Chaplin-Kramer, R.; Nelson, E.; Ennaanay, D.; Wolny, S.; Olwero, N. VEST 3.2. 0 user’s guide. In The Natural Capital Project; Stanford University: Stanford, CA, USA, 2015; Volume 133. [Google Scholar]
- Zhang, L.; Dawes, W.R.; Walker, G.R. Response of mean annual evapotranspiration to vegetation changes at catchment scale. Water Resour. Res. 2001, 37, 701–708. [Google Scholar] [CrossRef]
- Baixue, W.; Weiming, C.; Shengxin, L. Impact of land use changes on habitat quality in Altay region. J. Resour. Ecol. 2021, 12, 715–728. [Google Scholar] [CrossRef]
- Zhang, X.; Zhou, Y.; Long, L.; Hu, P.; Huang, M.; Xie, W.; Chen, Y.; Chen, X. Simulation of land use trends and assessment of scale effects on ecosystem service values in the Huaihe River basin, China. Environ. Sci. Pollut. Res. 2023, 30, 58630–58653. [Google Scholar] [CrossRef] [PubMed]
- Congjuan, L.; Abulimiti, M.; Jinglong, F.; Haifeng, W. Ecologic service, economic benefits, and sustainability of the man-made ecosystem in the taklamakan desert. Front. Environ. Sci. 2022, 10, 813932. [Google Scholar] [CrossRef]
- Zhang, F.; Yushanjiang, A.; Wang, D. Ecological risk assessment due to land use/cover changes (LUCC) in Jinghe County, Xinjiang, China from 1990 to 2014 based on landscape patterns and spatial statistics. Environ. Earth Sci. 2018, 77, 491. [Google Scholar] [CrossRef]
- Xu, D.; Cheng, J.; Xu, S.; Geng, J.; Yang, F.; Fang, H.; Xu, J.; Wang, S.; Wang, Y.; Huang, J. Understanding the relationship between China’s eco-environmental quality and urbanization using multisource remote sensing data. Remote Sens. 2022, 14, 198. [Google Scholar] [CrossRef]
- Meng, Z.; Dong, J.; Ellis, E.C.; Metternicht, G.; Qin, Y.; Song, X.; Löfqvist, S.; Garrett, R.D.; Jia, X.; Xiao, X. Post-2020 biodiversity framework challenged by cropland expansion in protected areas. Nat. Sustain. 2023, 6, 758–768. [Google Scholar] [CrossRef]
- Li, Z.; Cheng, X.; Han, H. Future impacts of land use change on ecosystem services under different scenarios in the ecological conservation area, Beijing, China. Forests 2020, 11, 584. [Google Scholar] [CrossRef]
- Cai, D.; Ge, Q.; Wang, X.; Liu, B.; Goudie, A.S.; Hu, S. Contributions of ecological programs to vegetation restoration in arid and semiarid China. Environ. Res. Lett. 2020, 15, 114046. [Google Scholar] [CrossRef]
- Yu, C.; Zhang, Z.; Jeppesen, E.; Gao, Y.; Liu, Y.; Liu, Y.; Lu, Q.; Wang, C.; Sun, X. Assessment of the effectiveness of China’s protected areas in enhancing ecosystem services. Ecosyst. Serv. 2024, 65, 101588. [Google Scholar] [CrossRef]
- Zhang, Y.; Zhao, X.; Gong, J.; Luo, F.; Pan, Y. Effectiveness and driving mechanism of ecological restoration efforts in China from 2009 to 2019. Sci. Total Environ. 2024, 910, 168676. [Google Scholar] [CrossRef]
- Zhang, J.; Hao, X.; Li, X.; Fan, X.; Zhang, S. Evaluation and regulation strategy for ecological security in the Tarim River Basin based on the ecological footprint. J. Clean. Prod. 2024, 435, 140488. [Google Scholar] [CrossRef]
- Xue, L.; Wang, J.; Zhang, L.; Wei, G.; Zhu, B. Spatiotemporal analysis of ecological vulnerability and management in the Tarim River Basin, China. Sci. Total Environ. 2024, 649, 876–888. [Google Scholar] [CrossRef]
- Qian, K.; Ma, X.; Yan, W.; Li, J.; Xu, S.; Liu, Y.; Wang, Y. Trade-offs and synergies among ecosystem services in Inland River Basins under the influence of ecological water transfer project: A case study on the Tarim River basin. Sci. Total Environ. 2024, 908, 168248. [Google Scholar] [CrossRef]
Figure 1.
Overview of the study area. (a) Location of the Tarim River Basin in China, (b) Tarim River Basin countries, (c) Tarim River Basin DEM.
Figure 1.
Overview of the study area. (a) Location of the Tarim River Basin in China, (b) Tarim River Basin countries, (c) Tarim River Basin DEM.

Figure 2.
Research framework.

Figure 3.
Spatial distribution of land use from 2000 to 2020.

Figure 4.
Distribution of increases and decreases in different land use types.

Figure 5.
Distribution of multi-scenario land use projections for 2035.

Figure 6.
Spatial distribution of multi-scenario projections of ecosystem services from 2020 to 2035.
Figure 6.
Spatial distribution of multi-scenario projections of ecosystem services from 2020 to 2035.

Figure 7.
Spatial distribution of ecological risks under multiple scenarios in 2035.


Table 1.
Land use change ecological risk data characterization.
| Data Type | Data Name | Spatial Resolution | Data Sources |
|---|---|---|---|
| Land Use Data | 2000 | 30 m | https://www.resdc.cn/ (accessed on 13 March 2020) |
| 2010 | 30 m | ||
| 2020 | 30 m | ||
| Limiting Factor | Open Water | 30 m | https://www.resdc.cn/ (accessed on 13 March 2020) |
| Nature Reserve | 250 m | https://www.resdc.cn/ (accessed on 13 March 2020) | |
| Driving Factor | DEM | 250 m | https://www.resdc.cn/ (accessed on 15 March 2020) |
| Slope | 250 m | by DEM data | |
| Aspect | 250 m | by DEM data | |
| Roads | 250 m | http://www.gis5g.com/ (accessed on 15 March 2020) | |
| Waterways | 250 m | http://openstreetmap.org/ (accessed on 15 March 2020) | |
| NDVI | 30 m | https://www.resdc.cn/ (accessed on 15 March 2020) | |
| Other Factors | Rainfall Erosion Factor R | 1000 m | http://www.gis5g.com/ (accessed on 16 March 2020) |
| Soil Erodibility Factor K | 300 m | http://www.gis5g.com/ (accessed on 16 March 2020) | |
| Potential Evaporation | 1000 m | https://www.resdc.cn/ (accessed on 16 March 2020) | |
| Amount of Precipitation | 1000 m | https://www.resdc.cn/ (accessed on 16 March 2020) |
Table 2.
The habitat sensitivity data.
| Name | Habitat | Cropland | Construction Land | Unused Land |
|---|---|---|---|---|
| Cropland | 0.3 | 0 | 0.8 | 0.4 |
| Forest | 1 | 0.6 | 0.4 | 0.2 |
| Grassland | 1 | 0.8 | 0.6 | 0.6 |
| Water | 0.7 | 0.5 | 0.4 | 0.2 |
| Construction land | 0 | 0 | 0 | 0.1 |
| Unused land | 0.6 | 0.6 | 0.4 | 0 |
Table 3.
The threats data.
| Threat | Max_dist | Weight | Decay |
|---|---|---|---|
| Cropland | 4 | 0.6 | Linear |
| Construction land | 8 | 0.4 | Exponential |
| Unused land | 6 | 0.5 | Linear |
Table 4.
The areas of land use types for the years 2000, 2010, and 2020.
| Land Use Type | 2000 | 2010 | 2020 | Change of Percentage (%) | |||
|---|---|---|---|---|---|---|---|
| Areas (km2) | Percentage (%) | Areas (km2) | Percentage (%) | Areas (km2) | Percentage (%) | ||
| Cropland | 45,496.3 | 2.61 | 61,433.9 | 3.52 | 72,384.8 | 4.15 | 1.54 |
| Forest | 23,854.9 | 1.37 | 22,583.8 | 1.29 | 22,168.1 | 1.27 | −0.10 |
| Grassland | 427,430.4 | 24.50 | 404,483.4 | 23.19 | 394,739.2 | 22.63 | −1.87 |
| Water | 61,828.1 | 3.54 | 35,809.1 | 2.05 | 36,452.3 | 2.09 | −1.45 |
| Construction land | 2552.3 | 0.15 | 6788.4 | 0.39 | 5436.3 | 0.31 | 0.17 |
| Unused land | 1,183,220.6 | 67.83 | 1,213,283.9 | 69.55 | 1,213,201.9 | 69.55 | 1.72 |
Disclaimer/Publisher’s Note: The statements, opinions and data contained in all publications are solely those of the individual author(s) and contributor(s) and not of MDPI and/or the editor(s). MDPI and/or the editor(s) disclaim responsibility for any injury to people or property resulting from any ideas, methods, instructions or products referred to in the content. |
© 2024 by the authors. Licensee MDPI, Basel, Switzerland. This article is an open access article distributed under the terms and conditions of the Creative Commons Attribution (CC BY) license (https://creativecommons.org/licenses/by/4.0/).
Share and Cite
MDPI and ACS Style
Cheng, Y.; Zhang, X.; Song, W. Ecological Risk Assessment of Land Use Change in the Tarim River Basin, Xinjiang, China. Land 2024, 13, 561. https://doi.org/10.3390/land13040561
AMA Style
Cheng Y, Zhang X, Song W. Ecological Risk Assessment of Land Use Change in the Tarim River Basin, Xinjiang, China. Land. 2024; 13(4):561. https://doi.org/10.3390/land13040561
Chicago/Turabian StyleCheng, Yaqi, Xuyang Zhang, and Wei Song. 2024. "Ecological Risk Assessment of Land Use Change in the Tarim River Basin, Xinjiang, China" Land 13, no. 4: 561. https://doi.org/10.3390/land13040561
Note that from the first issue of 2016, this journal uses article numbers instead of page numbers. See further details here.