Article

Navigating Post-COVID-19 Social–Spatial Inequity: Unravelling the Nexus between Community Conditions, Social Perception, and Spatial Differentiation

1
Department of Architecture, Tianjin University, Tianjin 300072, China
2
Suzhou Institute of Future City Design, Suzhou City University, Suzhou 215000, China
3
School of Art and Design, Suzhou City University, Suzhou 215000, China
4
Faculty of Architecture, The University of Hong Kong, Hong Kong 999077, China
5
School of Architecture and Urban Planning, Suzhou University of Science and Technology, Suzhou 215000, China
6
Key Laboratory of Spatial Intelligent Planning Technology, Ministry of Natural Resources, Beijing 100034, China
7
College of Architecture and Urban Planning, Fujian University of Technology, Fuzhou 350118, China
8
Department of Tourism, Jinan University, Shenzhen 518053, China
*
Author to whom correspondence should be addressed.
These authors contributed equally to this work.
Land 2024, 13(4), 563; https://doi.org/10.3390/land13040563
Submission received: 1 March 2024 / Revised: 15 April 2024 / Accepted: 18 April 2024 / Published: 22 April 2024

Abstract

:
The 2023 SDGs report underscores the prolonged disruption of COVID-19 on community living spaces, infrastructure, education, and income equality, exacerbating social and spatial inequality. Against the backdrop of the dual impact of significant events and the emergence of digital technologies, a coherent research trajectory is essential for characterizing social–spatial equity and understanding its influential factors within the urban planning discipline. While prior research emphasized spatial dimensions and mitigated spatial differentiation to ensure urban equity, the complexity of these interconnections necessitates a more comprehensive approach. This study adopts a holistic perspective, focusing on the “social–spatial” dynamics, utilizing social perception (sentiment maps) and spatial differentiation (housing prices index) pre- and post-pandemic to elucidate the interconnected and interactive nature of uneven development at the urban scale. It employs a multi-dimensional methodological framework integrating morphology analysis of housing conditions, GIS analysis of urban amenities, sentiment semantic analysis of public opinion, and multiscale geographically weighted regression (MGWR) analysis of correlation influential factors. Using Suzhou, China, as a pilot study, this research demonstrates how these integrated methods complement each other, exploring how community conditions and resource distribution collectively bolster resilience, thereby maintaining social–spatial equity amidst pandemic disruptions. The findings reveal that uneven resource distribution exacerbates post-pandemic social stratification and spatial differentiation. The proximity of well-maintained ecological environments, such as parks or scenic landmarks, generally exhibits consistency and positive effects on “social–spatial” measurement. Simultaneously, various spatial elements influencing housing prices and social perception show geographic heterogeneity, particularly in areas farther from the central regions of Xiangcheng and Wujiang districts. This study uncovers a bilateral mechanism between social perception and spatial differentiation, aiming to delve into the interdependent relationship between social–spatial equity and built environmental factors. Furthermore, it aspires to provide meaningful references and recommendations for urban planning and regeneration policy formulation in the digital era to sustain social–spatial equity.

1. Introduction

The United Nations’ SDGs for 2030 articulate an ambitious vision for sustainable development, with a particular emphasis on creating communities characterized by safety, inclusivity, sustainability, and resilience [1]. The intricate relationship between sustainable community development and social–spatial equity underscores the imperative for the justified allocating of urban resources and opportunities [2]. Ensuring an equitable distribution of socio-spatial benefits among residents, including access to education, services, and healthcare opportunities, fosters the creation of a more inclusive and egalitarian societal milieu [3]. Pressing global challenges, exemplified by pandemic crises, disproportionately impact vulnerable societal groups [4,5,6]. The COVID-19 pandemic’s disruption encompasses a multi-spatiotemporal dimension and influential impact and is enduring, diverse, and nonlinear in social and spatial environments [7]. As the SDGs Report 2023 highlighted, COVID-19 has had unprecedented and continuous negative impacts on spatial infrastructure, public services, and social income, leading to the most significant exacerbation of inequalities in the past thirty years [8]. Hence, investigations of the impact of the pandemic on community social–spatial equity are urgently needed for understanding and addressing similar challenges, guiding future urban planning and sustainable community development [9,10].
Socialists such as David Harvey and Saskia Sassen have intensely criticized injustices such as residential differentiation, public spatial deprivation, and neglect of the alienation of people’s social perception [11,12]. They advocate for a more dynamic understanding of contemporary urban spaces, linking the interrelationship between “social perception, spatial quality, and housing conditions” to achieve relational, interconnected, and constantly evolving social–spatial equity [13,14]. For instance, the Revised Perceived Residential Environment Quality (R-PREQ) theory highlights the increasingly tight interaction between physical space and social perception, where residential environment quality positively influences social perception through community attachment as an intermediate variable [15]. Therefore, a comprehensive measurement framework is essential for understanding the interrelationship between social perception and spatial quality [16]. However, current research needs more detailed explanations of the dynamic measurement of all elements of social perception and spatial quality at the regional geographical scale and their interrelations with community-built environmental elements [17]. Additionally, a singular, fixed perspective fails to capture the adaptability of dynamic, multidimensional social perception and spatial differentiation under the impact of pandemics. Utilizing a diverse range of measurement methods can effectively address the gaps in research on the multidimensional “social–spatial” equity perspective. Nevertheless, further exploration is needed to appropriately select data and methods for application in logical and comprehensive measurement frameworks.
Following the discourse on current research trends and gaps, this research proposes a comprehensive, multidimensional measurement framework to put the insights gained from the P-PREQ theory into practice. The framework explores the combination of corresponding measurement data, objects, and methods, revealing which neighborhood elements are more effective in improving social perception and spatial quality, enhancing community resilience, and mitigating the impact of the COVID-19 pandemic. The research introduces two analytical categories to achieve this goal: social sentiment mapping and residential spatial differentiation metrics [18]. A pilot case study was demonstrated to test the interrelationships between different scales and regions. Tracking the dynamic changes in multiple elements pre- and post-pandemic enhances our understanding of how cities transform and allocate resources equally to cope with complex contexts such as sudden public health emergencies [19]. Thus, we can comprehensively understand how social–spatial inequalities manifest and evolve amidst rapid spatial changes and the compounded impacts of pandemics.
Aligning with the establishment of the research framework, there has been an increased emphasis on integrating multi-source and dynamic spatiotemporal data in research data selection. This involves a semantic analysis of Location-Based Social Network services (LBSNs) data [20], geographic information system (GIS) analysis of community conditions and surrounding amenities, and multiscale geographically weighted regression (MGWR) analysis of correlation influential factors [21]. LBSNs data can be used to analyze urban residents’ behavior and interactions, revealing instances of social inequality [22]. Semantic analysis via machine learning enables the visualization of LBSNs data and the measurement of public opinions [23]. The GIS-based morphological analysis integrated measurement approach involves obtaining high-precision fine-grained multi-source data and applying geographic spatial analytic techniques [24]. The MGWR analysis method contributes to understanding social and spatial disparities in different city areas, studying resource allocation, infrastructure distribution, and spatial assessments [21]. This investigation method involves integrating conclusions from social sentiments and spatial quality measurements into the decision-making process to achieve effective resource allocation and sharing, promoting the practical development of community cohesion.
In sum, studying social–spatial equity, a hybrid, diverse measurement approach coupled with the integration of corresponding governance policy, is especially important. Therefore, this study aims to comprehensively analyze different data sources and methods, delving into the impact of the pandemic on social–spatial equity through an integrated examination of community conditions, spatial morphology analysis, geographic information analysis of urban facilities, and sentiment analysis of public opinions, and attempts to address the following questions:
(1)
How can a dynamic and comprehensive assessment framework be established to measure social–spatial equity during pandemic disruptions?
(2)
Based on the integrated MGWR measurement of social–spatial aspects, which factors of community conditions significantly impact social–spatial equity?
(3)
What adaptive policy and planning decision-making suggestions can be proposed to enhance urban social–spatial equity and achieve sustainable development?
By addressing the abovementioned questions, this study aims to provide meaningful insights and recommendations for urban planning and policymaking in promoting urban social–spatial equity, enhancing urban resilience when coping with unforeseen events. The following sections will cover the literature reviews, research conceptual framework, methods, results, and discussion. Through a detailed description of the techniques and data used in the research, coupled with an in-depth exploration of the results and analysis, this research comprehensively presents the impact of the COVID-19 pandemic on the social–spatial dynamic of Suzhou, and particularly the discoveries and insights regarding interaction with social–spatial equity and community conditions.

2. Literature Review and Theoretical Framework

2.1. COVID-19 Pandemic Accelerates Social–Spatial Inequity

The research on ‘social–spatial’ dynamics emphasizes exploring the relationship between society and space and how this relationship influences social order. Reviewing relevant theories in this field reveals a long-standing neglect of space in social theories, with interpretations often remaining segregated (Table 1) [25]. Spatial elements related to planning primarily focus on investigating spatial inequality through housing conditions, community environments, and public facilities [26]. Meanwhile, social elements related to perception explore the connections between social participation, cohesion, and community interaction [27]. However, physical space serves as a medium for residential differentiation, playing either a constructive or deconstructive role in social order generation, maintenance, and transformation [28,29,30]. Therefore, it should be approached as an integral part of the holistic investigation perspective of social–spatial dynamics.
With rapid urbanization, phenomena such as the decline in environmental quality and residential differentiation have spread to varying degrees and scopes within cities [31]. The COVID-19 pandemic has also exacerbated the sense of residential differentiation in the global context. Residential differentiation means a weakening sense of identity, which constitutes significant challenges to the transitional societal order [32]. The connotations of the social–spatial perspective for solving residential differentiation and promoting social–spatial equity encompass chaos and irregularity in spatial and social structures [33]. Issues such as the overall existence of a “heavier emphasis on materiality than humanity” and a “space-centric view” urgently require an expansion in the harmonious interaction between “humans and spatial materiality” to address the existing residential differentiation dilemma effectively [34,35].
Table 1. A summary of the relevant literature concerning social–spatial interaction.
Specific PeriodAcademicsPoint of View
Classical sociologist
From the perspective of early philosophers
Karl Marx, Max Weber, Emil Turgan [36]The concept of space is relatively ignored and regarded as something dead, rigid, non-dialectical, and static.
Georg Simmel [37]Five social characteristics of space are proposed, as well as the role of space in interpersonal relationships, social conflicts, lifestyle, and psychological temperament.
Chicago School and Urban Space ResearchChicago school [38]Urban space research explores spatial structure and social order from the perspective of human ecology, pointing out that space and society interact.
Erving Goffman [39]Divides the space into front- and backstage to explore the spatial limits of the operation of social norms.
Contemporary theorists’ attention to spaceMichel Foucault [40]Revealing the relationship between knowledge, power, time, and space through the changes in the history of punishment. The social theory begins to enter the “space age”.
Anthony Giddens [41]It regards time and space as the basis of social order and emphasizes the impact of the commodification of time and space on society under capitalism.
Space Research in Postmodern TheoryPierre Bourdieu [42]Studying residential spatial structure reveals the impact of unique expressions of time and space on social order.
Space Sociology ResearchHenri Lefebvre [43]Treats space as a social construction and emphasize the political, instrumental, and strategic nature of space.
Edward Soja [44]Develops the theory of spatial dialectics and emphasizes the mutual influence between space and society.
Research on Urban Space under Modern Information TechnologyDavid Harvey
Manuel Castells [45]
Conducts in-depth research on urban space issues and points out that space and social change are inseparable.
Contemporary Social Theory’s Cognition of SpaceDerek Gregory [46]Spatial reorganization and variation. Modern social changes have led to spatial reorganization and variation, which have triggered challenges to the foundation of traditional social order.
Confronting sudden major public health crises like COVID-19 underscores the importance of integrating multilevel and multidimensional research on urban social–spatial equity [47]. From a social perspective, evident disparities exist among different social groups regarding the impact of pandemic disruption on social participation, cohesion, and community interaction [48]. Lower-income communities are more susceptible to the pandemic’s repercussions as they struggle to implement effective social distancing or access sufficient service facility resources [7]. This can unveil how different social groups within the city face the built environment. From a spatial viewpoint, notable variations exist in impact resistance against the pandemic due to the internal community spatial structure and urban configuration [49]. Research in the “social–spatial” domain can investigate the influence of factors such as social service distribution, medical resource allocation, and housing conditions in different urban areas on social equity in depth [50,51,52]. Hence, the urgent debate on social space and the city necessitates establishing a theoretical framework and methodological support to investigate the multilevel and multidimensional impacts of pandemic disruption on social–spatial equity.

2.2. Social–Spatial Dynamic Measurements

The current focus of “social–spatial” research primarily revolves around the multidimensional exploration of space, time, and social interaction. With the support of new data and technologies, comprehensive influencing factors related to urban inequality have been deeply explored [53]. Emerging research methodologies include the utilization of multi-source datasets to enhance the understanding of inequality issues by analyzing social perception and spatial differentiation within cities and how factors of community conditions could enhance social–spatial equity [54,55].
Social media platforms have emerged as invaluable sources for monitoring public perception in the digital age, offering new opportunities for urban studies and sentiment analysis researchers. Analyzing sentiment tones within social media discussions has become a prevalent method for gauging public attitudes and emotions toward urban issues [56]. Researchers utilize this approach to investigate environmental quality, examining how public sentiment on social media platforms like Twitter, Facebook, and Weibo reflects urban environment perceptions [57,58,59,60]. Moreover, sentiment analysis contributes to the reviewing of urban planning theories, providing insights into the effectiveness of different planning strategies and their reception among the public [61,62,63]. Additionally, sentiment analysis aids in managing urban systems and natural areas by providing real-time feedback on public sentiment towards urban developments and environmental conservation efforts [64,65,66].
Spatial differentiation caused by urban inequality often manifests within social spaces, where there is an uneven distribution of social resources, education, cultural facilities, etc. [67]. This inequality was further exacerbated during the COVID-19 pandemic, with more pronounced effects on vulnerable groups. For instance, low-income families might face more significant challenges in obtaining suitable housing conditions during a pandemic [68]. The housing price level acts as a crucial indicator of spatial differentiation within a specific district. Previous research indicates that housing prices are a significant indicator of the spatial quality of urban built environments. Studies have explored the dynamics between housing prices and various elements of the built environment [69,70]. For instance, Gu et al. measured housing prices to identify high-value innovation areas within cities [70]. Similarly, Li et al. investigated the significant relationship between housing prices and different elements of the built environment, such as green spaces, service facilities, education, and healthcare across various urban regions [71].
It is worth mentioning that fluctuations in housing prices, and exceptionally high housing prices, may make it difficult for low-income families to afford to own a property, intensifying social divisions within the city [72]. Fluctuations in housing prices within specific regions may also represent differences in living conditions among different social groups within the same district [73]. The volatility in housing prices during COVID-19 may have highlighted these effects, especially after the pandemic disruption [74]. Therefore, this research utilizes housing prices to represent community quality and proceeds to investigate the relationship between housing prices and social inequality.
Through “big data” analysis, community conditions involve quantifying urban spatial elements, such as commercial facilities, public amenities, and park greenery [61,75,76,77]. Other approaches include examining urban green space (UGS) fairness using MSPA [55], measuring accessibility [16], and evaluating environmental inequality concerning transportation facilities [78], among other aspects of the environment [62,63,70,79]. Moreover, using social media and mobile device data enables researchers to analyze urban residents’ behaviors and interactions, revealing social inequalities. This could be undertaken by, for instance, exploring Cultural Ecosystem Services (CES) indicators using Flickr data or studying pandemic attention trends across different regions through Twitter’s multi-geographic data [80,81,82,83,84,85]. In the context of measuring public amenities, existing studies predominantly focus on dimensions such as spatial quality, accessibility, and density [79]. Considering the most relevant research use of the quantitative assessment model to explore the impact of public facilities on sentiment indexes and housing prices across urban areas, the influence is quantified on a spatial level primarily through “distance”. This includes indicators such as the distance to hospitals, subway stations, parking facilities, and water features. These distance metrics serve to quantify the effect of public amenities on housing prices in different communities, providing a nuanced understanding of how accessibility and proximity to crucial facilities can drive real estate values. In summary, investigations into spatial elements often pertain to diverse attributes of space, including community elements, public facilities distance, and density, as outlined in Table 2.

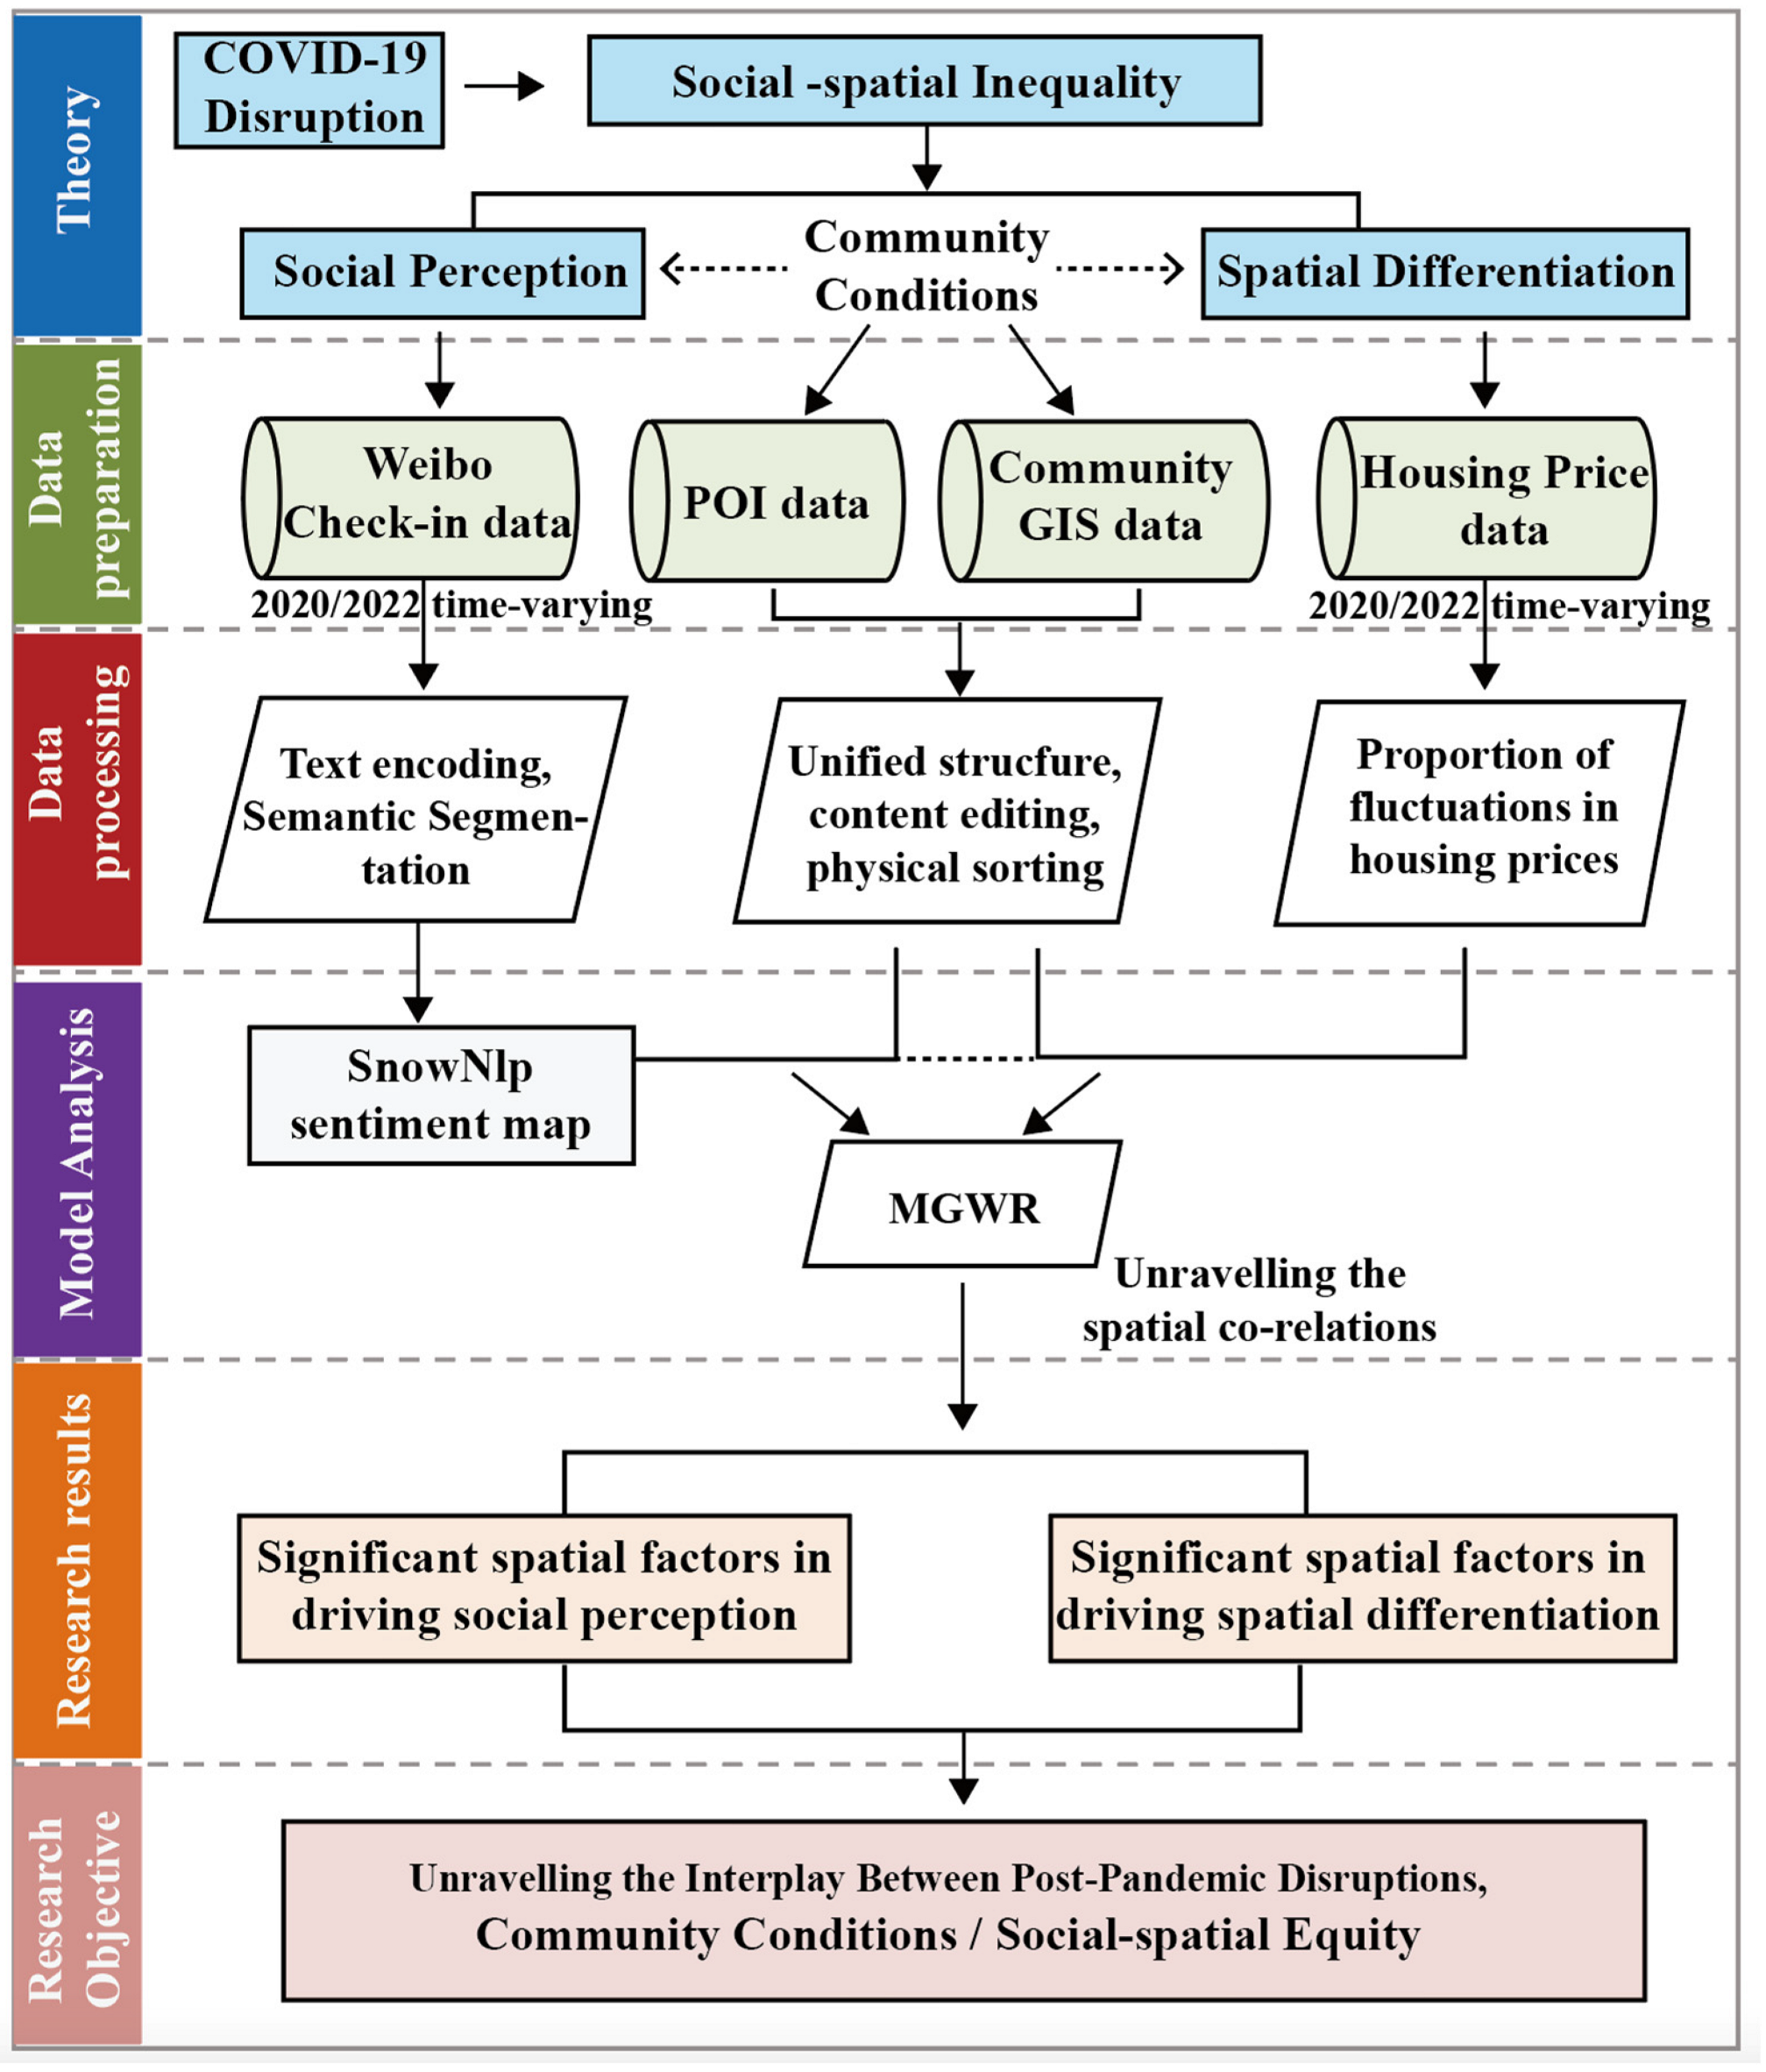
2.3. Research Gaps and Conceptual Framework

While various measurement methods have been proposed to address the complexity of the “social–spatial” equity perspective, there is still a pressing need to explore appropriate data selection and methodological applications within a logical and comprehensive measurement framework. The current state of research lacks a detailed exploration of dynamic measurements of social perception and spatial quality at both individual and regional geographical scales, as well as the correlation between these measures and built environment elements within residential areas [16]. Despite previous research exploring the relationship between built environments and individual activities, systematic and comprehensive measurements are scarce for “social–spatial” assessment [80]. Therefore, urgent attention is needed for interdisciplinary research methodologies that leverage new data and technologies to address gaps in measurement approaches and explore the intricate dynamics of social perception and spatial resource allocation within the context of urban environments and pandemics.
This article comprehensively characterizes the state of social–spatial equity during pandemic disruption. It employs a sentiment analysis of Weibo check-in social media data, using the SnowNLP model to represent social perception, and constructs a quantitative ‘social sentiment’ fluctuation map. Additionally, GIS-based morphological analysis associated with the housing price index is used to create a heatmap. Both dynamic datasets were acquired from the years 2020 and 2022. Furthermore, the study selects community condition elements such as housing status, community environment, and public service facilities as independent variables, with ‘social perception’ and ‘spatial differentiation’ as dependent variables. MGWR is used to assess the relationship between community conditions, social perception, and spatial differentiation, and to explore the influential impact factors of community conditions on urban social–spatial equity. The specific research conceptual framework is illustrated in Figure 1.

3. Research Data and Methods
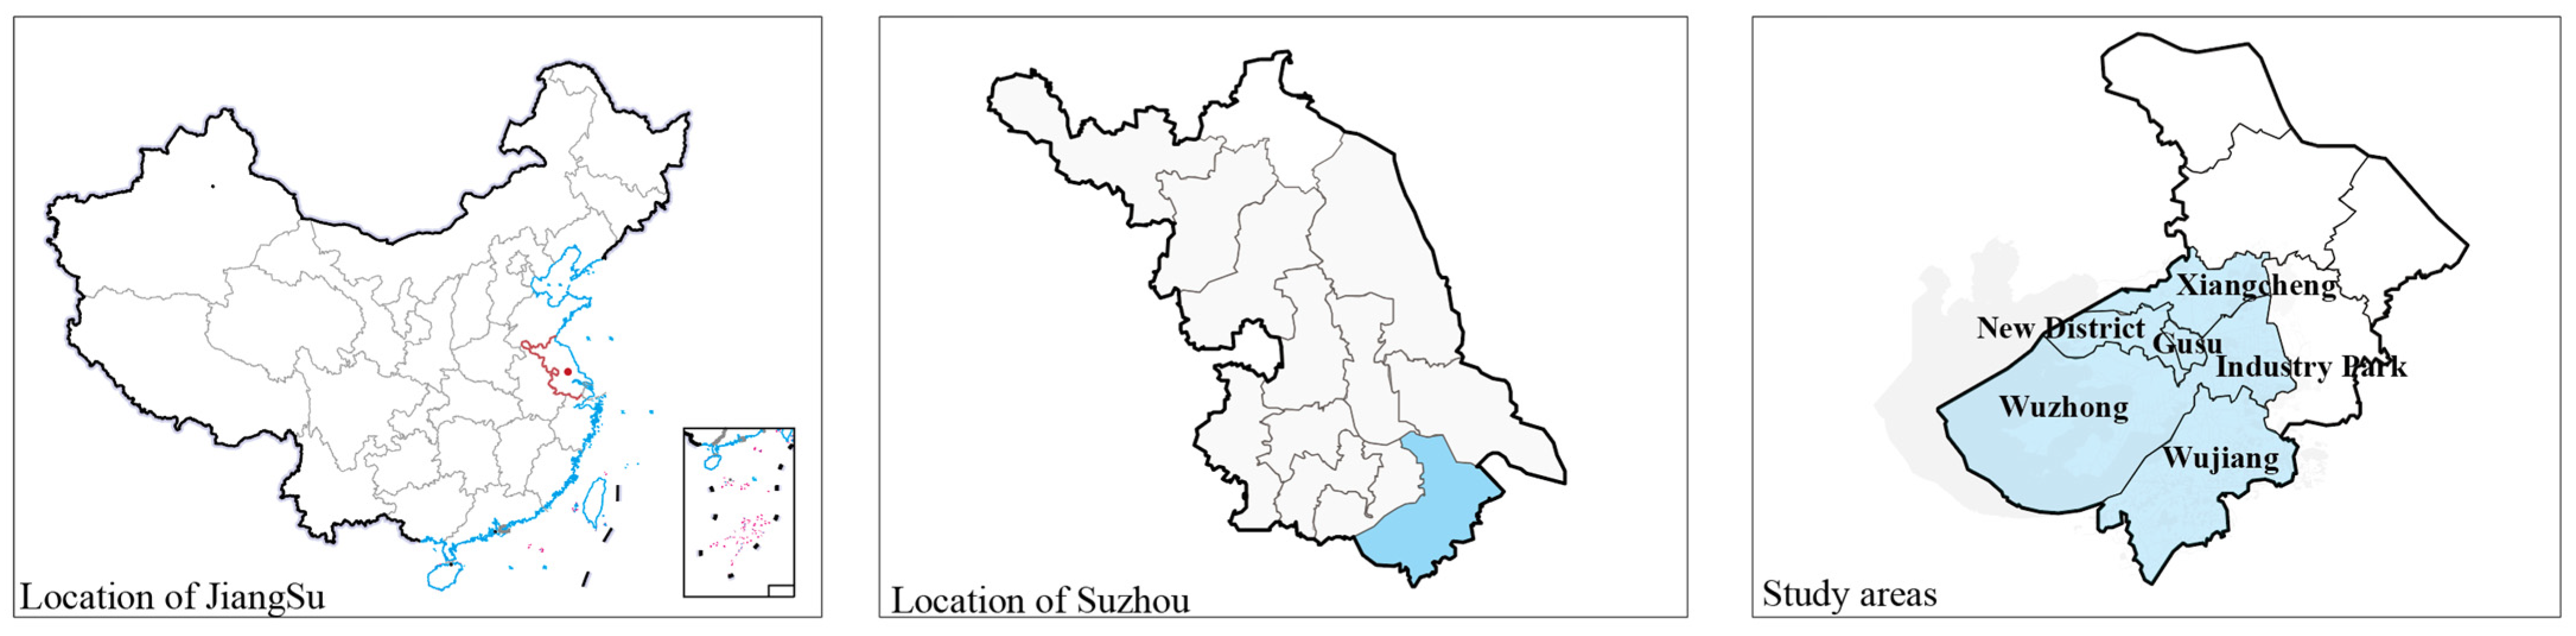
3.1. Research Area

The study focuses on Suzhou as the research area (Figure 2). This choice was driven by Suzhou’s unique social–spatial characteristics, resulting from its distinctive geographical location and social diversity. Suzhou’s significant and representative fluctuations in housing prices make it an ideal subject for study. At the same time, Suzhou enjoys a prime geographic location adjacent to Shanghai, making it a vital part of the Yangtze River Delta economic zone. Within this diverse society, exploring the perceptions and responses of different social groups to urban spaces and housing price fluctuations during the pandemic helps to comprehensively understand the interaction between social and spatial dynamics and urban equity.
Furthermore, Suzhou, a historic and cultural city in the coastal region of Eastern China, is renowned for its unique gardens and developed economy. Its urban development has always been at the forefront of the Chinese urban system, showcasing typical characteristics of an Eastern city. Suzhou’s urban space has many influences, featuring both traditional culture and historic districts alongside modern urban planning and construction, offering diversity for the study of the impact of COVID-19 on urban social–spatial equity. On the other hand, Suzhou’s real estate market has long been a focus of attention, with housing price fluctuations significantly affecting residents and reflecting the spatial differentiation status. During the pandemic, these fluctuations might have been influenced by factors such as transformation in public opinion and economic fluctuations. Studying social perception and spatial differentiation in Suzhou enables a more comprehensive understanding of COVID-19’s impact on social–spatial dynamics and urban equity changes.
In summary, while Suzhou shares similarities with other Chinese cities, its distinctiveness makes it a valuable choice for the study area. The comparability of Suzhou with other cities possessing similar characteristics enhances the study’s generalizability and guides practical applications.

3.2. Data Source

This study collected data in Suzhou from 2020 and 2022, and categorized it into three groups (Table 3). The first category comprises housing price data within the research area during this period, including indices, housing sales prices, transaction prices, regions, and housing types. These data were primarily sourced through API interfaces from publicly accessible real estate transaction platforms such as Anjuke and transaction records from real estate agencies.
The second category involves social network data, specifically Weibo check-in data from 2020 and 2022. Weibo check-in data are widely used in China and encompass individual social and geographical attributes. The study utilized the Sina Weibo API to gather check-in data, including relevant topics and keywords. Natural language processing techniques were applied to perform sentiment analysis on Weibo text content, extracting emotions and attitudes related to topics like the pandemic and housing price fluctuations.
The third data category includes Geographic Information System (GIS) data from 2020 to 2022 and Points of Interest (POI) data related to community conditions. It encompasses Suzhou’s map data, land-use data, urban green space coverage, building density, and other spatial information. GIS technology and spatial statistical methods were utilized to integrate, analyze, and visualize the collected geographical spatial data, aiming to reveal the impact of urban spatial elements on social perception and spatial differentiation.

3.3. Data Variables of Community Condition

This study comprehensively characterizes the state of social–spatial equity before and after the pandemic, utilizing MGWR to measure the impact relationships between community conditions, geographical spatial elements, and social–spatial equity. Drawing from existing literature in Table 1, a measurement framework is constructed based on three aspects within the community: Community Elements (A), Public Facilities Distance (B), and Public Facility Density (C). The specifics are outlined in Table 4.
The community elements (A) mainly encompass the Floor Area Ratio (A1), Community Establishment Age (A2), and Greening Rate (A3). The Floor Area Ratio (A1) involves regulations concerning building density and land usage. The Community Establishment Age (A2) pertains to the duration of housing or infrastructure usage within the community, while the Greening Rate (A3) refers to the proportion of greenery within the community. By studying the Floor Area Ratio, Establishment Age, and Greening Rate, differences in housing conditions, resource allocation, and other aspects among resident communities can be understood [67].
The Public Facilities Distance (B) primarily includes Hospital Distance (B1), Subway Distance (B2), Park Distance (B3), and Water Distance (B4). The selection of these four elements aims to assess the accessibility of critical public resources for different groups within the community. Analyzing the distances between these public facilities and residents’ residential areas allows for an understanding of potential social equity disparities within specific communities. For instance, varying distances to hospitals, subways, parks, and water bodies might influence different groups’ access to and utilization of these resources, thereby revealing potential societal inequalities [69].
Public Facility Density (C) primarily comprises three elements: Education Facility Density (C1), Bus Stop Density (C2), and Commercial Facility Density (C3). Investigations of the influencing factors of public facility density, such as education facility density, bus stop density, and commercial facility density, aim to assess the impact on social–spatial equity. Studying these factors helps to understand the distribution of public services and resources within different communities or regions, thereby evaluating accessibility and equality among different social groups [86,87].

3.4. Research Methodology

3.4.1. Sentiment Semantic Analysis Based on SnowNLP

SnowNLP is a Python-based natural language processing library used for text analysis, sentiment analysis, and keyword extraction [88]. Its fundamental principle involves employing machine learning algorithms and language models to segment text, perform part-of-speech tagging, and conduct sentiment analysis to determine the emotional tendencies of text, such as positive, negative, or neutral sentiments. In this study, the collected text in Weibo check-in data underwent preprocessing steps like cleaning and tokenization to facilitate subsequent sentiment analysis. Using relevant functions from the SnowNLP library, the pre-processed text underwent sentiment analysis, in which a trained model identified the emotional polarity of the text. The sentiment analysis results were statistically analyzed using Nvivo11.0 software and visualized using ArcGIS10.6 to reveal the overall trends and inclinations of the Weibo sentiments map pre- and post-pandemic. The specific process is illustrated in Figure 3.

3.4.2. MGWR

MGWR explores the spatial relationships between dependent/response variables and independent/explanatory variables [72]. This software integrates the widely used method for modeling spatial heterogeneity. MGWR relaxes the assumption that all modeled processes occur at the same spatial scale. Traditionally, the model requires an initial step of Ordinary Least Squares (OLS) regression, upon which the MGWR analysis is conducted.
(1)
OLS Regression
The traditional characteristic model can be expressed as OLS regression, which means that for each observation of housing price or social sentiment map index y i , its basic formula is as follows:
y i = β 0 + β 1 x 1 + β 2 x 2 + β i x i + ε  
where y i is the social–spatial equality index,   β 0 is the intercept, x 1 , x 2 , , x i represents the independent variable, β 0 , β 1 , , β i represents regression coefficients, and ε is the error term, representing random variation that the model cannot thoroughly explain.
(2)
MGWR
From a social–spatial perspective, the influential factors can be quite diverse. Hence, this study focuses on the changes in housing prices and social sentiments during pandemic disruption (2020/2022) while considering the influence of geographical location factors on regression parameters. Analyzing the regression parameters of the MGWR model involves using spatial weighting to obtain the correlation between housing prices and Weibo sentiment at each geographic location. This method unveils the differences and relationships between various regions, with the MGWR model outlined as follows:
y i = β b w 0 u i , u i + k   β b w k u i , u i x i k + ε i
where y i is the social–spatial equality index, and β b is the intercept and the coefficient of local variable k at location i , respectively, and x i k is the k -th variable at location i . u i , u i refers to the coordinates of i . The summation over the b terms accounts for the combined influence of all basis functions on the response variable, capturing the spatial relationships and patterns in the data.
(3)
Test for Spatial Variations (Moran’s I, Monte Carlo Test, and IQR-SE Test)
MGWR generates a set of parameter estimates for each covariate at specific locations. Local T-value (LT) is crucial, distinguishing situations in these sets where spatial variation in these estimates might be sufficiently large due to noise and yet large enough to represent inherently spatially varying processes.
The study initially employs Moran’s Index to measure the spatial autocorrelation within a multivariate geographical regression weighting model. This approach determines whether housing prices or sentiment indexes are clustered, dispersed, or randomly distributed across space. A Moran’s Index close to +1 indicates that similar values are clustered together within the model, while an index close to −1 suggests that dissimilar values are clustered. An index approaching 0 signifies a random distribution of results.
The research conducted global and local Moran’s Index analyses to examine spatial autocorrelation with the dataset. The global Moran’s Index measured overall spatial autocorrelation, indicating a general clustering or dispersion of similar values across the study area. It can also calculate the local Moran’s Index for individual data points to pinpoint specific locations of spatial clusters and outliers. This combined approach could confirm broader spatial patterns and identify localized variations, offering a detailed insight into the spatial dynamics of the region.
Formula (3) specifically represents the global Moran’s Index, and Formula (4) represents the local Moran’s Index, as follows:
I = n W i = 1 N w i j j = 1 N x i x ¯ x j x ¯ i = 1 N ( x i x ¯ ) 2
The global Moran’s Index is denoted as I , and n means the number of observations corresponding to the total number of communities in the designated area. x j and x i represent the values of observations in the i -th and j -th communities within the Suzhou urban area, and x ¯ means the value of all community observations. w i j signifies the spatial weight between the i -th and j -th community observations, with W being the sum of all spatial weights w i j .
I i = x i x ¯ S 2 j = 1 N w i j x j x ¯
where I i is the i-th local Moran’s Index, x i represents the observed value for i-th unit, and x ¯ is the mean of the observed values for all units. S 2 is the variance of the observed values for all units. N is the total number of units. w i j is the spatial weight between the i -th unit and the j -th unit.
Building on this foundation, the study employs a Monte Carlo test to examine the significance level of the Moran’s Index, which determines whether the observed spatial pattern could potentially arise from a random process. The Monte Carlo test for spatial variability is based on local parameter estimates V j , usable in the MGWR2.0 software. Here, V j is defined by the following equation:
V j = 1 n i   ( β i j ^ 1 n i β i j ^ ) 2
where β i j represents the estimated specific local parameters for covariates, and n represents the number of observations in the study. Once V j ( V , original value) has been calculated, the data are randomly distributed in space 999 times, generating a new set of local parameter estimates for each iteration, and computing a new value for V j (V-random). Subsequently, the V j values from each of the 1000 iterations are sorted in descending order. The p-value associated with the null hypothesis of no spatial variation in the accurate parameter estimate is determined by the proportion of V j —random values above the V j —original value. This process is repeated for each specific covariate parameter estimate set.
The second test compares the quartile range of locally estimated values to the standard error from global estimation. Since the standard error (SE) from global estimation is assumed to follow a Gaussian distribution, it is expected that 2 × SE will encompass approximately 60% of all estimated values, defined as the expected variation. Therefore, if the quartile range of locally estimated parameters induced by MGWR (containing 50% of values) exceeds 2 × SE, it indicates significant spatial variation within the local estimation. It is a reasonably informal test but serves as an adequate initial assessment, while Monte Carlo testing, although more time-consuming, is more rigorous. Figure 4 provides a graphical illustration of these two tests.

4. Results and Findings

4.1. Sentiment Map with Weibo Check-In Data

By utilizing Nvivo11.0 software to statistically analyze the results of sentiment analysis, specific outcomes are illustrated in Figure 5. The 2020 Weibo word frequency analysis revealed that the most frequently occurring keywords included geospatial attributes such as “plazas”, “hotels”, “streets”, “shops”, “university”, “stores”, “gardens”, and “bridge”. Further investigation into the text attributes revealed that words like “plazas” and “hotels” primarily represented the main venues for activities during the pandemic in which people gathered to participate in events. The sentiment scores for these words leaned towards neutrality. On the other hand, “university”, “stores”, and “shops” were predominantly negative keywords, encompassing complaints about delayed university openings, grievances about closed management, and dissatisfaction with restrictions or closures in shopping areas. Words with relatively positive sentiment scores, such as “gardens” and “bridges”, mainly reflected a collective longing for green ecological environments.
Compared to the high-frequency vocabulary in 2020, the high-frequency terms in 2022 mainly revolved around keywords such as park, lake, ancient, mountain, scenic, museum, center, city, etc. There was a noticeable increase in terms related to tourism and leisure activities, including museums, mountains, and ‘scenic’, among others. The Weibo texts associated with these keywords were predominantly positive, often featuring check-ins and extensive sharing related to scenic spots and tourist attractions.
Building upon this, ArcGIS was used to assign spatial attributes to the sentiment evaluation results to create a Weibo sentiment map, as illustrated in Figure 6. The sentiment map for the year 2020 indicates that regions with higher emotional values are primarily concentrated in riverside areas within several administrative districts, including the Jinji Lake area in the Industrial Park, the Taihu Lake area in the Wuzhong District, and the moat area in the Gusu District, scattered across the core area. It is worth noting that although high-rated areas are often found in regions with a better ecological environment, such as green spaces, their ratings do not perfectly align with the distribution of water systems. This discrepancy might be attributed to the distribution of different public facilities. Overall, the general assessment tends toward positive sentiments.
Compared to the sentiment map from 2020, the sentiment map for 2022 shows a more evenly distributed overall score, with fewer centralized core areas. Instead, more communities displayed moderately neutral sentiment scores. A few areas with higher sentiment scores are concentrated in the Jinji Lake area of the industrial park (SIP) and the southern region of the new district (SND). This aligns with the analysis from Nvivo11.0 software, indicating that in 2022, areas with higher emotional evaluations were predominantly clustered around scenic spots.

4.2. Spatial Correlation Test of the Weibo Sentiment Map

Table 5 indicates a significant spatial agglomeration effect in the difference between 2020 and 2022 in the Weibo sentiment map. Meanwhile, Moran’s I index is more significant than zero, indicating a positive correlation. This means that communities with more substantial increases in the Weibo index tend to cluster together, while communities with lower increases in the Weibo index also tend to cluster together.
Local autocorrelation analysis was conducted to further explore the spatial clustering distribution patterns of the Weibo sentiment map (Figure 7). The HH-type regions in the local Moran index indicate positive clustering, where units with high values also surround geographic units with high values. Conversely, the LL-type indicates negative clustering, where units with low values surround units with low values. The HL and LH types represent transition zones between two different characteristics. According to Table 6, the number of HH and LL units exceeded 1000 in this study, while the number of transition zones was relatively small, indicating a significant spatial clustering effect.
According to Figure 7, units with different clustering patterns are distributed in different quadrants, with the straight-line slope of the global Moran index being 0.231. It can be observed from the figure that the HH-type clustering areas of Weibo indices are mainly concentrated in the outer periphery of Suzhou, where urban construction and population distribution are relatively sparse. In contrast, LL-type clustering is observed in the central areas of the city, including regions such as Gusu District, indicating a more significant impact of negative emotions in the city center during the pandemic. The spatial correlation and heterogeneity of Weibo sentiment map differences exhibit significant spatial correlation and spatial heterogeneity, which can be further explored using spatial models of the influencing factors of sentiment indices.

4.3. OLS Regression Results of Weibo Check-In Data

As shown in Table 7, below, nine variables were retained through OLS regression, which will undergo further analysis in subsequent MGWR. The research findings indicate that the Floor Area Ratio (A1), Establishment Age (A2), Bus Quantity (C2), and Commercial Public Facility Quantity (C3) have a negative impact on the growth of the Weibo sentiment index. Bus stops tend to be concentrated in older urban areas or regions farther from the city center, and the commuting experience might be comparatively poorer, potentially negatively affecting people’s moods. Additionally, a more significant number of schools around residential areas tends to improve people’s moods. However, increased distances from hospitals, railway stations, parks, and water bodies, along with fewer shops, tend to influence people’s moods positively.
Based on this, the variables selected through OLS underwent MGWR analysis (Figure 8). The study revealed that four elements—Floor Area Ratio (A1), Establishment Age (A2), Bus Quantity (C2), and Commercial Quantity (C3)—exhibited a negative impact, showing an evenly distributed regression pattern. In contrast, B1, B2, B3, and B4 results showed a neutral regression outcome, indicating an evenly distributed spatial relationship overall. Notably, the regression relationship for C1 was distinctive. The Education Quantity (C1) results showed that positive evaluations were mainly concentrated in some regions of the new district, Gusu District, and industrial parks. These areas are surrounded by relatively dense educational resources, including Suzhou University and Suzhou Middle School (industrial park). The overall regression results displayed a primary normal distribution.
As shown in Table 8, the table presents coefficients derived from Ordinary Least Squares (OLS) and Multiscale Geographically Weighted Regression (MGWR) analyses. Here, R-squared (R2) represents the coefficient of determination, indicating the proportion of variance in the dependent variable that can be predicted. AICc, on the other hand, is used for model comparison, where lower values indicate better fitting of the model to the data. The research findings suggest that the determination coefficient (R2) of MGWR (0.6994) is notably higher compared to OLS (0.037680). This implies that the MGWR model explains a more significant proportion of the variance in the Weibo variables. Furthermore, the AICc value of MGWR (9188.6612) is considerably lower than that of OLS (19194), suggesting that, based on this criterion, the MGWR model better suits these data.

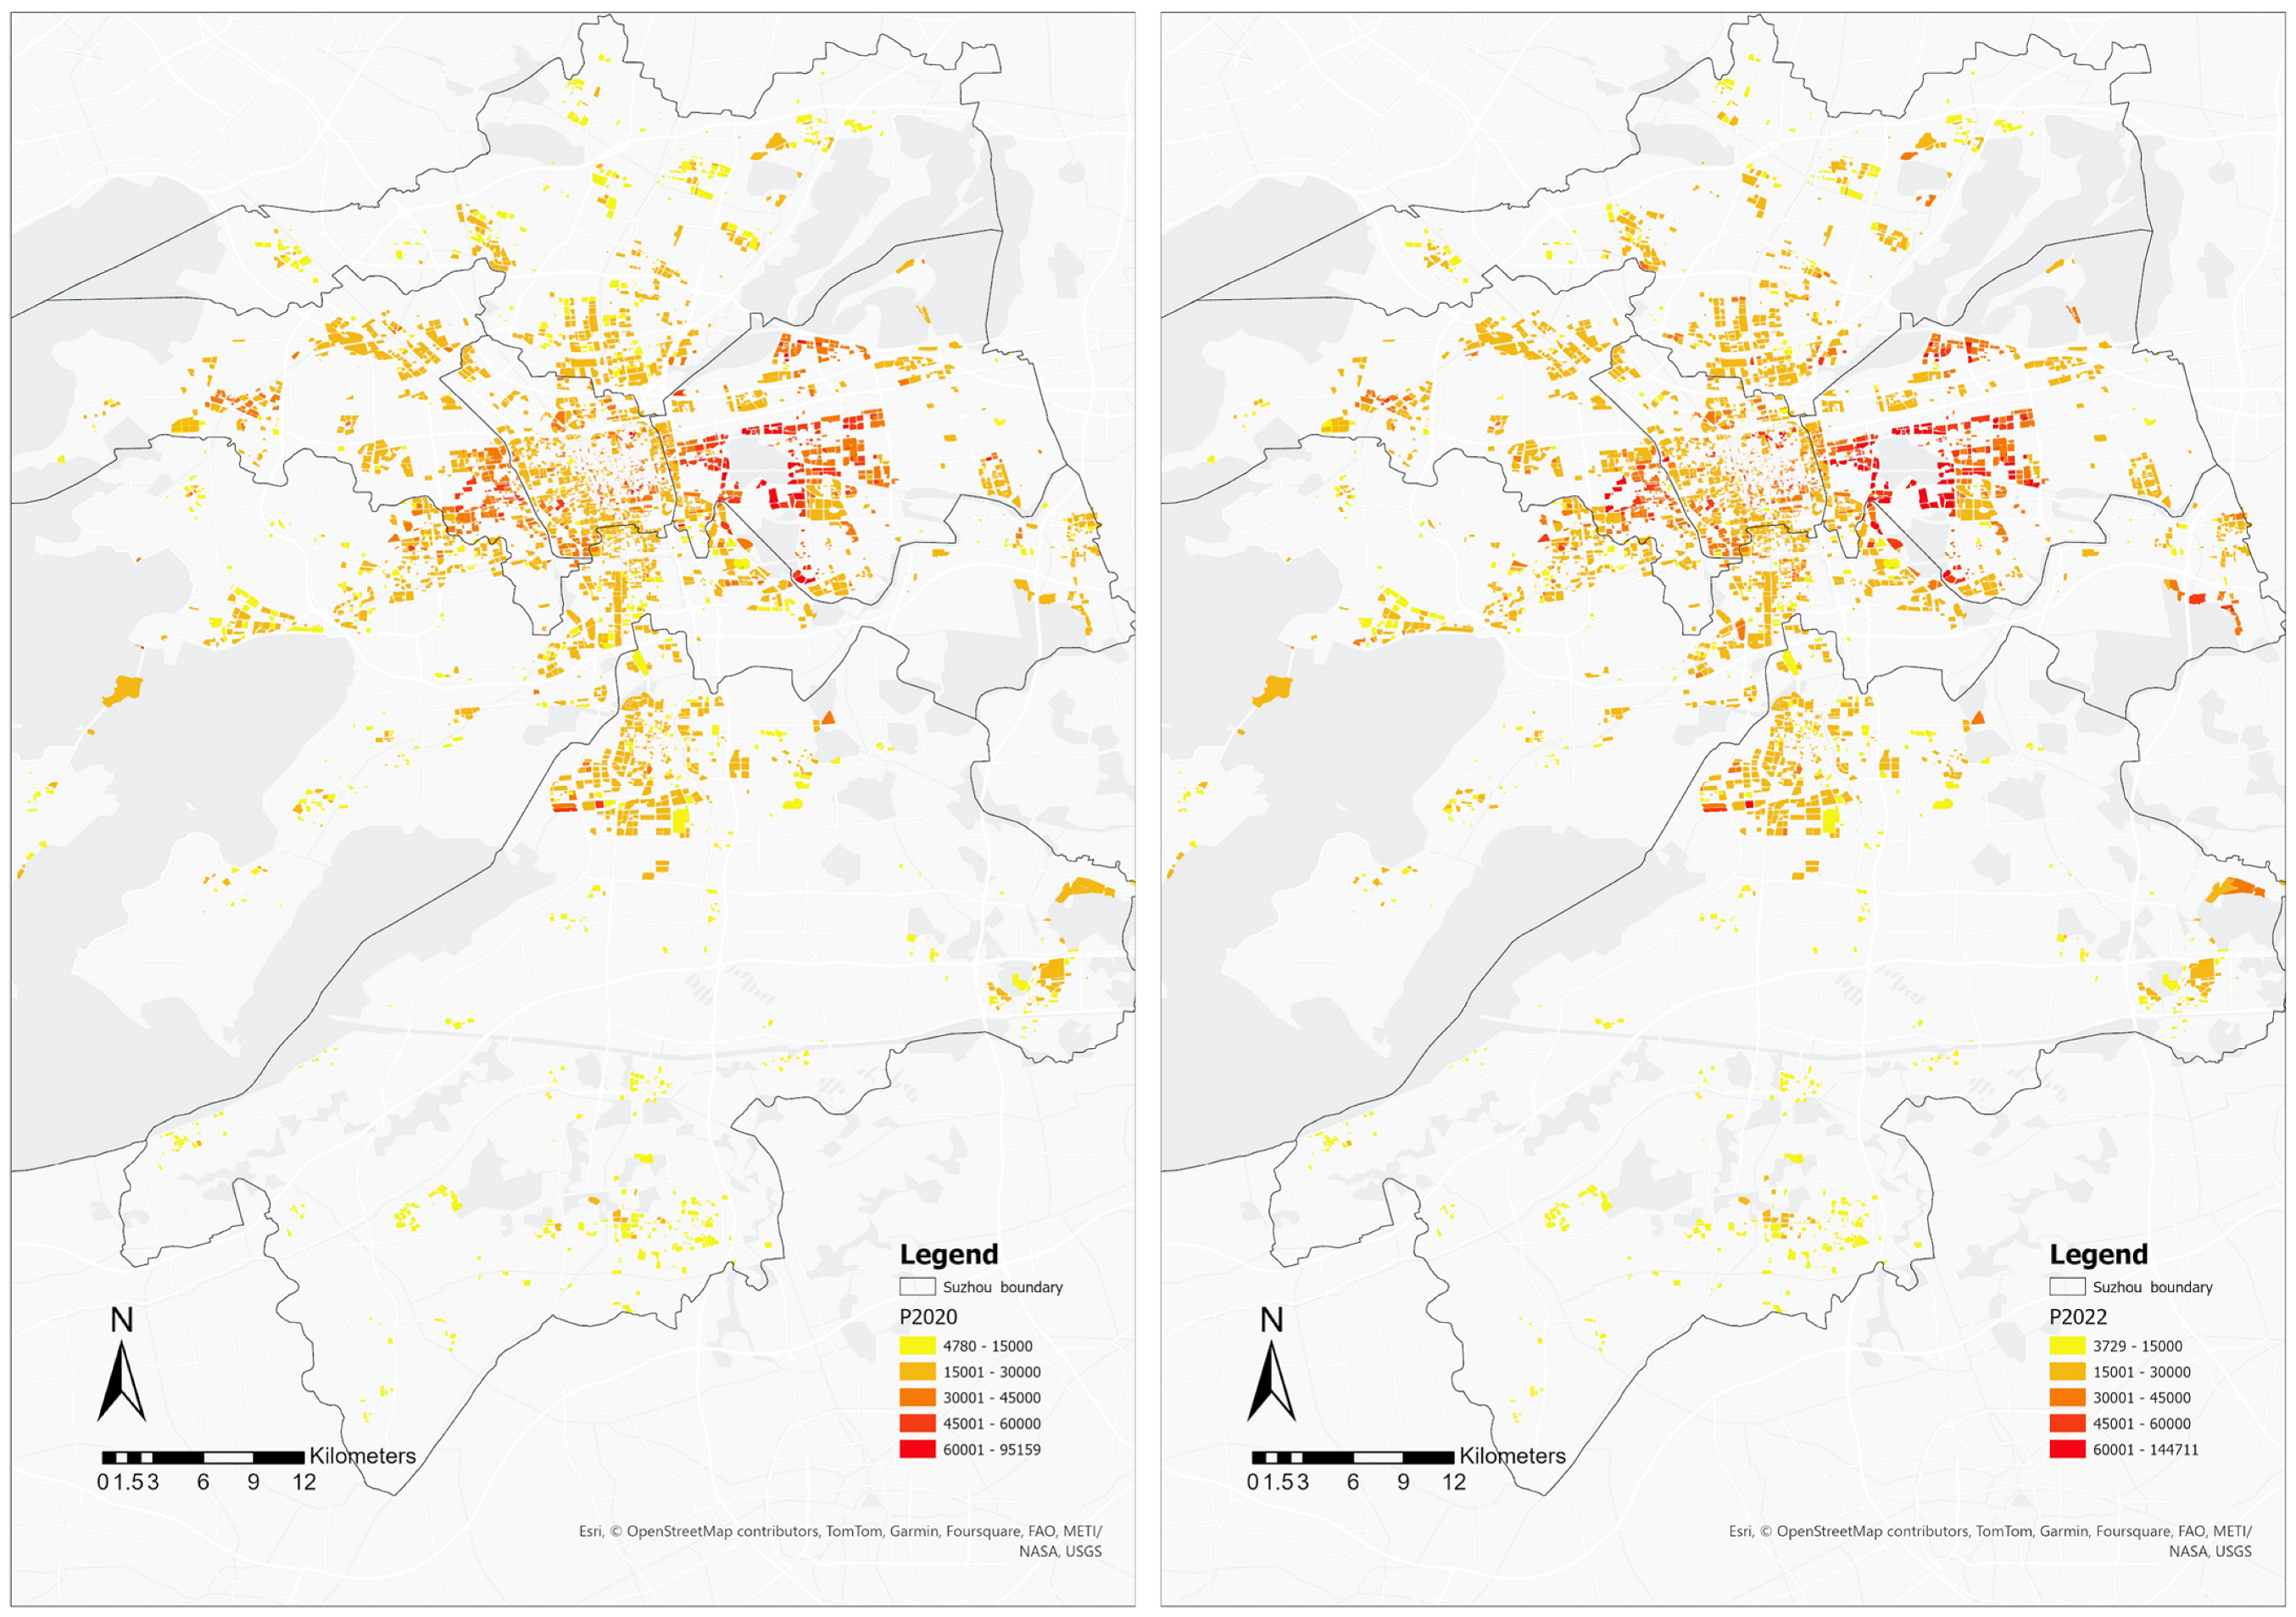
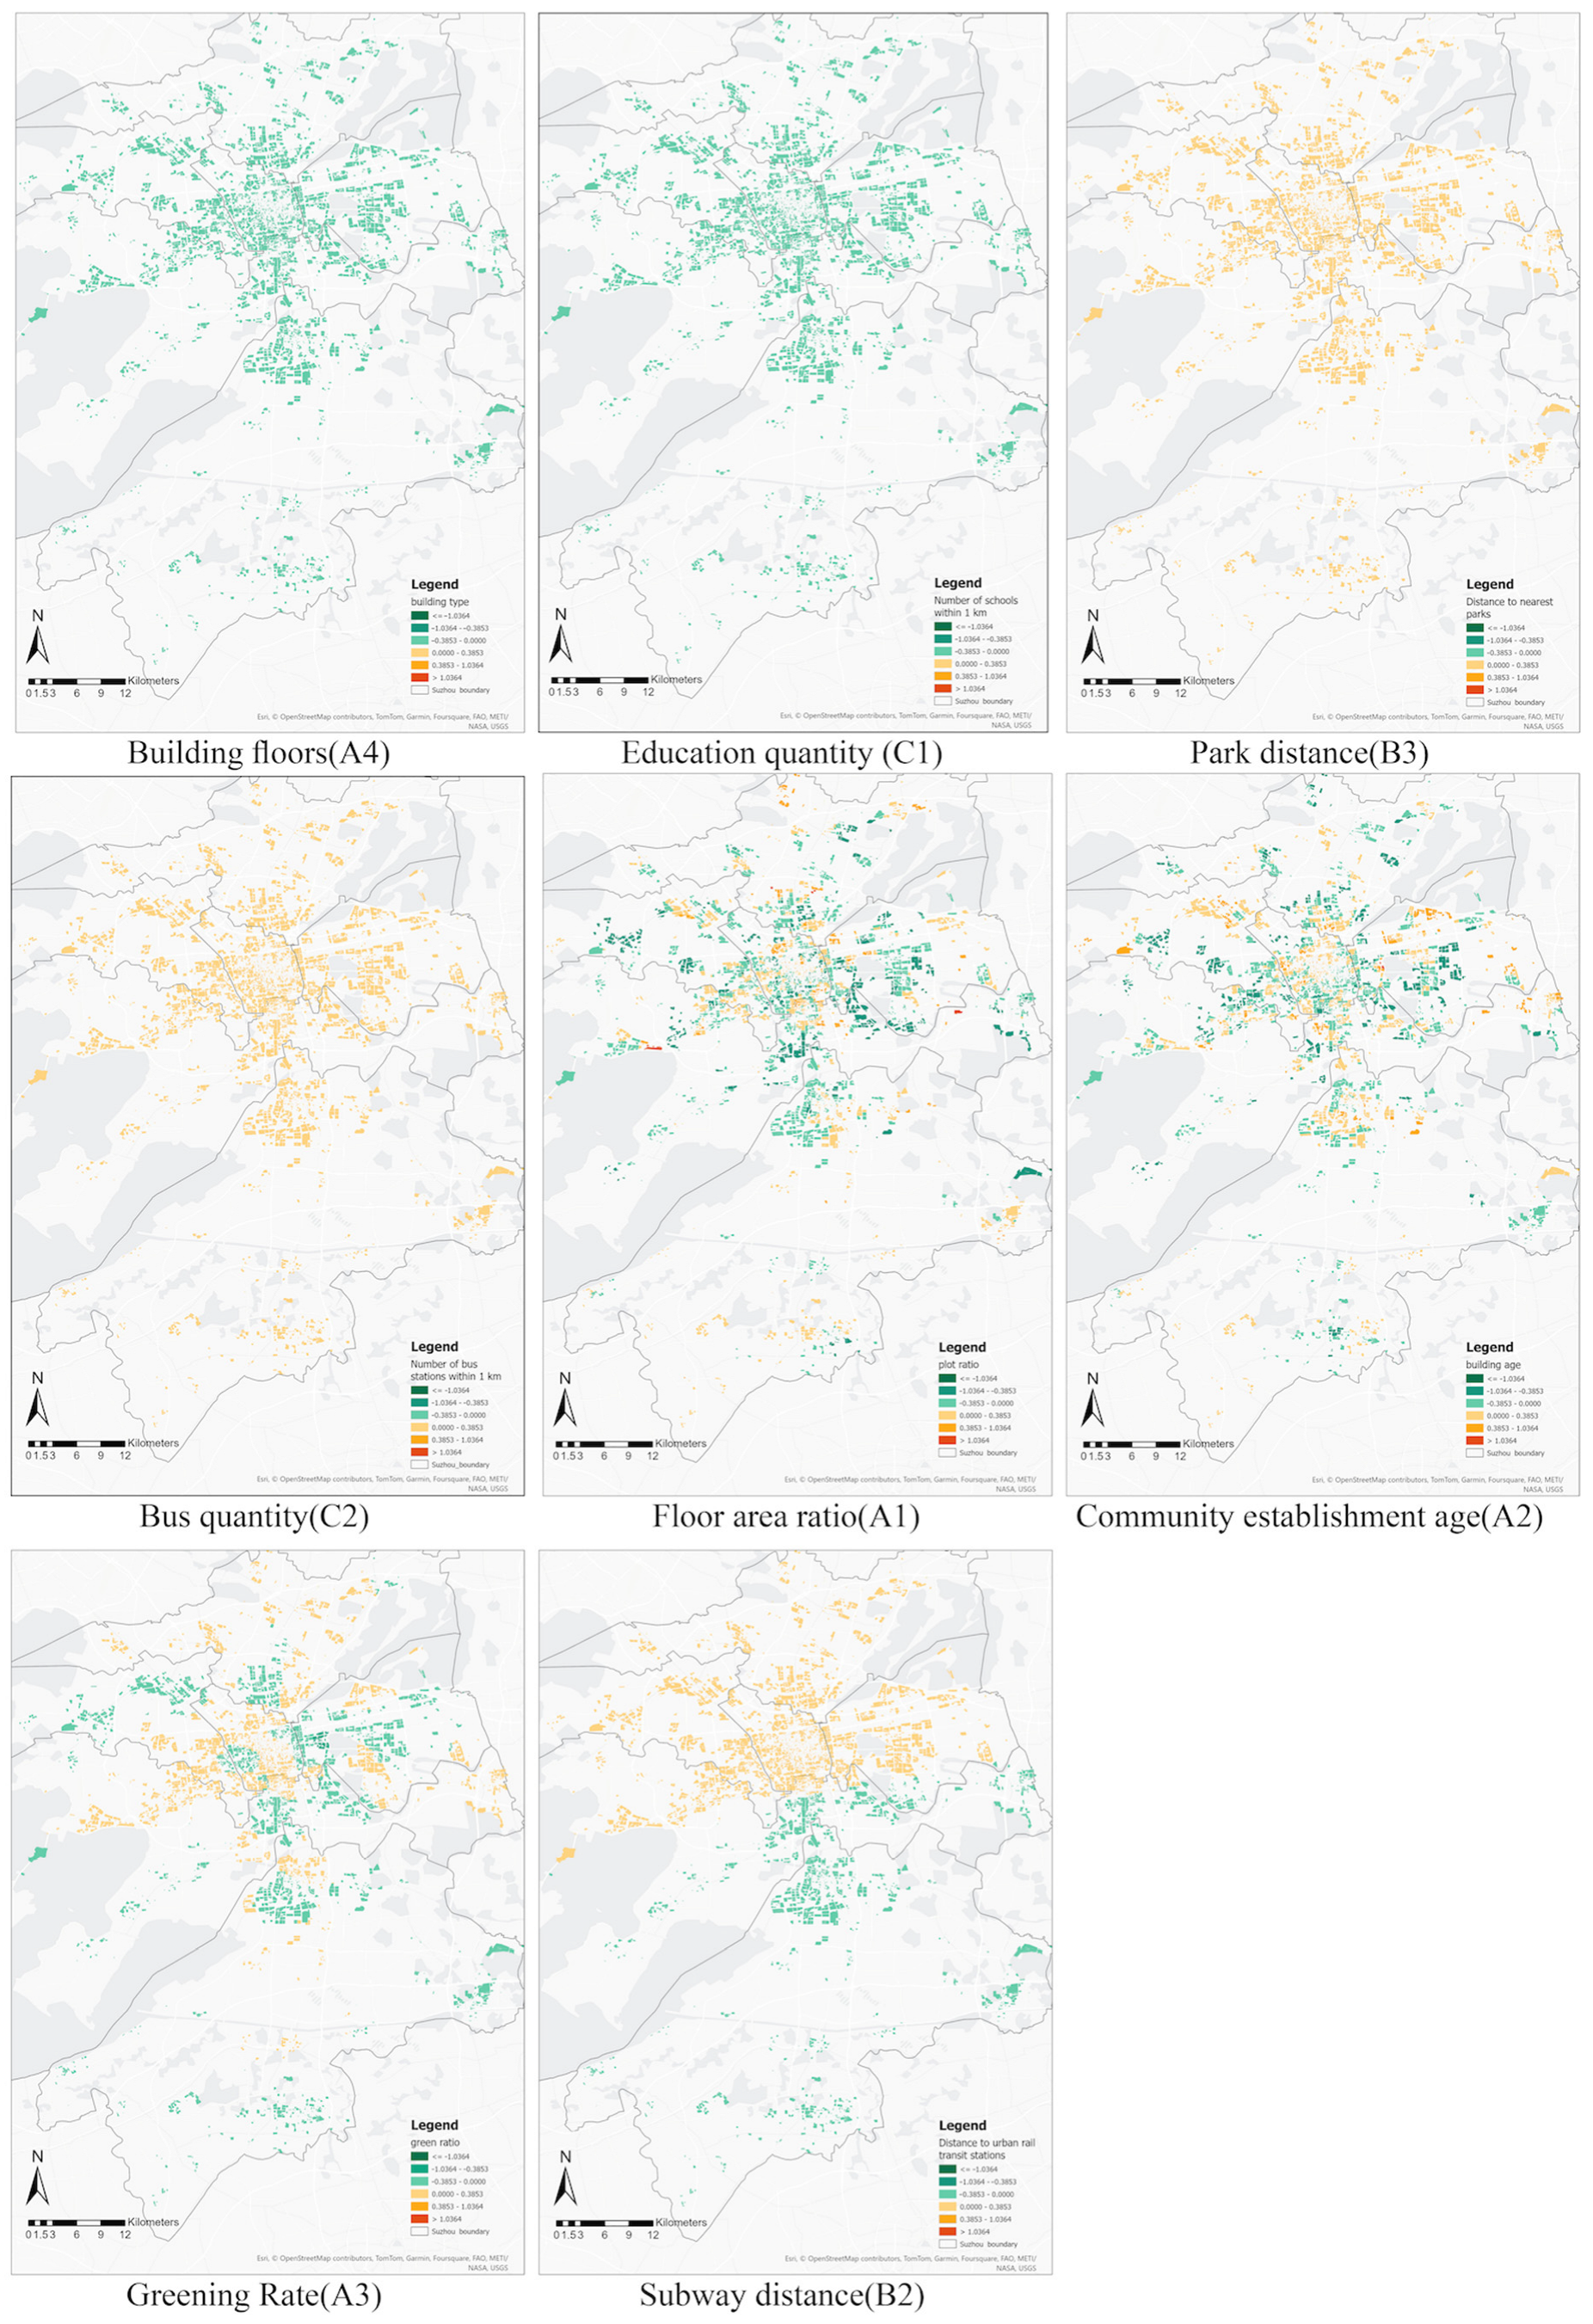
4.4. GIS-Based Spatial Differentiation Measurement

As an important indicator of spatial differentiation, housing prices can reflect the quality of the community and the value recognition of surrounding facilities and environment. Based on ArcGIS, visual representations were created to illustrate the differences in housing prices between 2020 and 2022. The housing price map for 2020 indicates that areas with high housing prices are mainly concentrated in the industrial park and the junction of the high-tech zone with parts of Gusu District (Figure 9).
The average housing price is approximately 25,345 RMB/m2. The spatial distribution map of housing prices in 2022 shows a slight overall increase compared to 2020. Notably, areas where housing prices were below the average line in 2020 experienced a slight elevation in overall prices by 2022. However, specific communities with higher housing prices in 2020 witnessed a decrease by 2022, although they still generally remained relatively high.

4.5. Spatial Correlation Test of the Housing Price Index

Table 9 indicates a significant spatial clustering effect in the price increase of Suzhou housing from 2020 to 2022. Additionally, Moran’s Index is greater than zero, indicating a positive correlation in this clustering, meaning that neighborhoods with larger price increases tend to cluster together.
Local autocorrelation analysis was conducted further to explore the spatial clustering distribution pattern of housing prices. According to Table 10, in this study, the overall number of HH and LL types was relatively high, with the number of HH units being less than the number of LL units. The cold spots of housing price increases, i.e., low-value clusters, were relatively large. There were fewer transitional zones, indicating a significant spatial clustering effect. According to Figure 10, units of different clustering patterns are distributed in different quadrants, with a straight-line slope indicating a global Moran’s Index of 0.140.
Additionally, the figure shows that HH-type clustering areas of housing price increases are mainly concentrated in the outer peripheries of Suzhou’s urban centers, such as Xiangcheng District, the eastern part of the Industrial Park, and the eastern part of Wuzhong District. These regions have relatively good economic development within the districts, where urban construction conditions continuously improve, and there is ample room for housing price growth. LL-type increases in housing prices are clustered in areas such as Wujiang District, the eastern part of the Industrial Park, and the eastern part of Huqiu District, where economic and urban construction conditions are average and have been significantly affected by the pandemic.
The housing price increases exhibit clear spatial correlation and heterogeneity, which can be further explored using spatial models of housing-price-influencing factors.

4.6. Spatial Differentiation Analysis via Housing Price Index Regression Results

As shown in Table 11, the OLS regression retained seven variables, which will be further analyzed in subsequent MGWR. The research findings indicate that the Greening Rate (A3), the quantity of surrounding bus quantity (C2), and the 2020 Weibo sentiment are positively correlated with housing price increases. This suggests that higher convenience and comfort in living conditions correlate with larger housing price increases. Conversely, the Floor Area Ratio (A1), Establishment Age (A2), and the closest distance to subway (B2) exhibit a negative impact on housing price increases. These outcomes align with common sense, indicating that higher convenience and comfort in living conditions significantly affect housing price increases. Notably, a greater distance to parks correlates with larger housing price increases. However, this correlation requires further exploration due to the relatively small R-squared value and poor fit of the OLS model, which only reflects overall linear relationships.
The number of building floors (A4) and the quantity of surrounding schools (C1) are generally negatively correlated with housing price increase across the entire region. The bus stop quantity (C2) and park distance (B3) are positively correlated in the whole area. The impacts of Floor Area Ratio (A1), Establishment Age (A2), and Greening Rate (A3) create uneven spatial distributions. While the effects of the Greening Rate and distance to rail transit stations on housing price increases show both positive and negative influences, they exhibit a distinct clustered spatial distribution (Figure 11).
AICc, as a model selection criterion, indicates that lower values are preferable, suggesting a model that fits the data well while using fewer parameters. Table 12 shows that the MGWR model outperforms OLS, demonstrating a higher goodness of fit and a more concise model. Additionally, MGWR’s R-squared surpasses OLS’s, reaching 0.5540, signifying that the model can explain 55.4% of the variation in housing prices before and after the pandemic.

5. Discussion

5.1. Social Perception Influential Factors via Sentiment Analysis

Studies have shown that different characteristics and distributions of urban spaces and elements significantly impact the allocation of social resources. In addition to the distribution of educational resources, there is a high degree of consistency in the relationship between sentiment maps and community geographic spatial elements. Factors such as community internal elements, distances to public facilities, and density affect the acquisition and utilization of social resources unequally among different societal groups [68]. Urban spatial elements like distances to and density of public facilities and community layouts directly shape people’s social behaviors and resource-acquisition methods [89].
Analyzing the sentiment maps of Weibo check-in data discussions reveals the impact of urban spatial layout on information dissemination, social interactions, and resource allocation [90]. The findings from MGWR analysis imply a connection between urban spatial elements and the distribution of social resources, which is associated with social inequality. For instance, the uneven distribution of educational resources may lead to certain areas having more access to social resources and opportunities, while others might face shortages. Such disparities could exacerbate social inequality, fostering distinct social environments at the urban level [91]. However, these manifestations of differentiation are not prominently visible due to the absence of distinct distribution patterns in educational facilities’ distribution before and after the pandemic [92]. This observation aligns with the spatial representation depicted in the sentiment maps, indicating that in the post-pandemic era, the focus of social resource attention primarily centers around tourism and historical sites.
In other words, regions with a well-maintained ecological environment, such as parks or scenic landmarks, generally exhibit a higher distribution of social resources. This aligns with the Attention Restoration Theory [93]. The Kaplans suggested that individuals have limited attentional resources, and during the pandemic era, familiarity with unchanging environments consumed significant attentional resources. Essentially, people tended to seek environments that differed from their past experiences, including captivating and mysterious natural settings or continuous and consistent cultural environments [94]. This also explains the differential changes observed in the emotional maps based on pre- and post-pandemic data from 2020 and 2022 in this study.

5.2. Spatial Differentiation Influential Factors via Housing Price Index

Based on the analysis results from MGWR, the spatial differentiation measurement characterized by housing prices shows significant heterogeneity in community geographic spatial elements. A negative correlation exists between building floors and housing price increases, suggesting that these factors might, to some extent, restrict housing price escalation. Previous studies indicate that increasing building floors can decrease individual living comfort, indicating that the relationship between overall housing prices within a community and floor height is not absolute. For instance, some high-rise residences might have lower prices due to factors like geographical location or building quality.
On the other hand, a positive correlation exists between the number of bus stops and proximity to parks, indicating a potential association between a higher number of bus stops and closer parks with increased housing price increments. This might stem from the convenience of transportation and nearby amenities, enhancing the attractiveness of real estate and subsequently driving up housing prices. Ecological spaces like urban green areas and parks are not merely features of the cityscape but direct influencers of residents’ quality of life [95]. These spaces offer vital leisure, recreational, and sports venues, serving as places for residents to relax, socialize, and engage in activities. Simultaneously, these ecological spaces aid in improving the urban environment by purifying the air, mitigating the urban heat island effect, and providing ecosystem services, significantly impacting residents’ physical and mental well-being. Relevant studies indicate that communities with higher average prices generally exhibit greater accessibility, serving as a fundamental representation of community spatial elements and reinforcing the conditions for community services [77]. The spatial spillover effect suggests that this influence might arise from spatial autocorrelation or interactions among these elements. Undeniably, increased accessibility between communities is beneficial for reducing social inequalities [78].
Notably, the impacts of Floor Area Ratio, building age, and greening rate are spatially uneven, indicating their diverse influences on housing price increases. This disparity might arise due to inter-regional connections in space. Given the varied community attributes within different areas, the impact of inter-regional connections on community housing prices varies as well [77]. This results in an uneven spatial distribution. Conversely, the distance from railway transit stations exhibits a clustered distribution in its impact on housing price increases. This suggests that in specific areas, the design of railway transit facilities will likely contribute to a boost in regional housing prices, aligning with existing theoretical research [96].

5.3. Adaptive Policy and Planning Decision-Making Suggestions for Social–Spatial Equity

The MGWR analysis of influential factors of community conditions with social perception and spatial differentiation revealed that social perception exhibits consistency in spatial characteristics in contrast to spatial differentiation, while spatial differentiation represented by housing prices shows significant consistency. The results show that perceived residential environment quality, mediated by community attachment, positively influences social perception resilience. Community residential environments are divided into social/spatial infrastructure and tangible/intangible factors, highlighting inappropriate living environments’ direct and indirect impacts on physical and mental health. Nearby natural scenery, such as gardens and community parks, fosters restoration effects, enhancing residential satisfaction and long-term positive effects on psychological well-being. Engaging in leisure activities within or near residential environments has also promoted restoration.
Additionally, in limited resource allocation and urban renewal, planning policies should prioritize factors affecting residents’ psychological well-being. A balanced distribution of urban spatial elements is crucial, particularly equitable access to leisure amenities and educational resources. The optimization of spatial layouts and ensuring equitable access to social resources and opportunities are essential considerations throughout planning and development processes. They entail promoting balanced educational resource distribution, expanding public transportation coverage, and fostering diverse commercial facility development.
Furthermore, it is recommended to enhance urban resilience and promote social equity. Urban planning should strengthen connections and communication between communities, break spatial isolation, and foster community interaction and collaboration to ensure that all residents have fair access to social opportunities and resources.

6. Conclusions

This article investigates the impact of urban spatial elements on community conditions and social–spatial equity pre- and post-pandemic. Departing from prior research that emphasized spatial dimensions to ensure urban equity, this study pioneers a holistic perspective on urban equity, emphasizing the interconnected nature of social and spatial dynamics amidst COVID-19 disruptions. By integrating morphology analysis, geographic information analysis, sentiment semantic analysis, and MGWR analysis, the research establishes a robust methodological framework for examining the complex interplay between social perception, spatial differentiation, and influential factors of community conditions. Findings from the Suzhou case study uncovered the exacerbation of social stratification and spatial differentiation due to uneven resource distribution post-pandemic while highlighting the pivotal role of well-maintained ecological and infrastructural environments in fostering social–spatial equity.
Furthermore, this research indicates a close correlation between community condition and social–spatial equity factors. Compared to sentiment maps, which exhibit considerable consistency in measuring community spatial elements, factors measured under the housing price index display more significant heterogeneity, reflecting the complex mechanisms of influence that the housing price index encapsulates. From social perception measurement via sentiment analysis, factors such as the community’s internal environment, distances to public facilities, and density play unequal roles and show spatial heterogeneity in shaping social perception. A spatial differentiation analysis via the housing price index highlights the complex interplay between various community geographic spatial elements. Factors like building floors, proximity to parks, and accessibility to transportation significantly influence housing prices, impacting residents’ quality of life and well-being. The consistent findings from a holistic social–spatial perspective show that disparities in educational resource distribution exacerbate social inequality, particularly in distinct post-pandemic social environments. Moreover, regions with well-maintained ecological environments tend to exhibit a higher distribution of social resources, aligning with the Attention Restoration Theory, which emphasizes individuals’ preference for diverse and engaging environments. Through meaningful references and recommendations, this research contributes to formulating urban planning and regeneration policies tailored to sustain social–spatial equity in the digital era, ultimately advancing inclusive urban futures.
This study still has some limitations and shortcomings. It is necessary to expand the sample size and, with the support of multiple temporal and spatial data from various cities, explore the factors that affect social–spatial equity, further promoting the construction and development of sustainable and high-quality cities. Additionally, research on indicators for public facilities tends to focus more on quantitative quantity analysis. In the future research stage, we will further enhance the study of safety, leisure amenities, comfort, and other public facilities to strengthen the research’s accuracy and scientific nature.

Author Contributions

Conceptualization, J.C., D.W., N.L. and P.L.; Data curation, J.C. and P.L.; Formal analysis, J.C., D.W. and P.L.; Funding acquisition, J.C., M.Z., D.Y., N.L. and P.Z.; Investigation, J.C., D.W. and P.L.; Methodology, J.C., D.W. and P.L.; Project administration, J.C., M.Z. and N.L.; Resources, J.C., M.Z. and N.L.; Software, J.C., D.W. and P.L.; Supervision, J.C., D.W., N.L. and P.L.; Validation, J.C., M.Z. and N.L.; Visualization, J.C., D.W. and P.L.; Writing—original draft, J.C., D.W. and P.L.; Writing—review and editing, J.C., M.Z., D.Y. and P.Z. All authors have read and agreed to the published version of the manuscript.

Funding

This research was funded by the [Advance Research Program of National Level Projects in Suzhou City University], grant number [2023SGY009]; the [Key Laboratory of Spatial Intelligent Planning Technology], Ministry of Natural Resources, China, grant number [20230303]; the [Natural Science Foundation of Fujian Province], China, grant number [2022J05193]; the [Guangzhou Philosophy and Social Sciences Project], grant number [2022GZQN50]; and funds from the [Guangdong Philosophy and Social Sciences Project], grant number [GD23YTY06]. The APC was funded by [2023SGY009].

Data Availability Statement

The original contributions presented in the study are included in the article, further inquiries can be directed to the corresponding author.

Conflicts of Interest

The authors declare no conflicts of interest.

References

  1. Wahidah, A.N.; Martono, D.N. Supriatna Land Use Sustainability to Mitigate Potential Land Slide in Ciletuh Watershed, Sukabumi, Indonesia. IOP Conf. Ser. Earth Environ. Sci. 2022, 950, 012006. [Google Scholar] [CrossRef]
  2. Chen, J.; Fan, W.J.; Xu, Q.; Zhang, X.W. Electronic Structure and Optical Gain of InAsPN/GaP(N) Quantum Dots. Superlattices Microstruct. 2011, 49, 1–8. [Google Scholar] [CrossRef]
  3. Stern, S. “Separate, Therefore Equal”: American Spatial Segregation from Jim Crow to Kiryas Joel. RSF Russell Sage Found. J. Soc. Sci. 2021, 7, 67–90. [Google Scholar] [CrossRef]
  4. Sepe, M. COVID-19 Pandemic and Public Spaces: Improving Quality and Flexibility for Healthier Places. Urban Des. Int. 2021, 26, 159–173. [Google Scholar] [CrossRef]
  5. Wang, Y.; Gao, Y. Travel Satisfaction and Travel Well-Being: Which Is More Related to Travel Choice Behaviour in the Post COVID-19 Pandemic? Evidence from Public Transport Travellers in Xi’an, China. Transp. Res. Part A Policy Pract. 2022, 166, 218–233. [Google Scholar] [CrossRef] [PubMed]
  6. Cao, W.; Fang, Z.; Hou, G.; Han, M.; Xu, X.; Dong, J.; Zheng, J. The Psychological Impact of the COVID-19 Epidemic on College Students in China. Psychiatry Res. 2020, 287, 112934. [Google Scholar] [CrossRef] [PubMed]
  7. Bower, M.; Buckle, C.; Rugel, E.; Donohoe-Bales, A.; McGrath, L.; Gournay, K.; Barrett, E.; Phibbs, P.; Teesson, M. ‘Trapped’, ‘Anxious’ and ‘Traumatised’: COVID-19 Intensified the Impact of Housing Inequality on Australians’ Mental Health. Int. J. Hous. Policy 2023, 23, 260–291. [Google Scholar] [CrossRef]
  8. Guterres, A. The Sustainable Development Goals Report 2023: Special Edition; Department of Economic and Social Affairs: New York, NY, USA, 2023. [Google Scholar]
  9. Vieira, A.B.D.; Monteiro, P.S.; de Silva, A.L. Social Inequities in COVID-19 Pandemic Times: A Reflection. Rev. Bioética 2021, 29, 459–465. [Google Scholar] [CrossRef]
  10. Macke, J.; Sarate, J.A.R.; de Atayde Moschen, S. Smart Sustainable Cities Evaluation and Sense of Community. J. Clean. Prod. 2019, 239, 118103. [Google Scholar] [CrossRef]
  11. Sassen, S. Cities and Communities in the Global Economy: Rethinking Our Concepts. Am. Behav. Sci. 1996, 39, 629–639. [Google Scholar] [CrossRef]
  12. Harvey, D. Social Justice and the City; University of Georgia Press: Athens, GA, USA, 2010; Volume 1, ISBN 0820336041. [Google Scholar]
  13. Sassen, S. Towards a Sociology of Information Technology. Curr. Sociol. 2002, 50, 365–388. [Google Scholar] [CrossRef]
  14. Jones, R.; Merriman, P. Hot, Banal and Everyday Nationalism: Bilingual Road Signs in Wales. Polit. Geogr. 2009, 28, 164–173. [Google Scholar] [CrossRef]
  15. Bonaiuto, M.; Fornara, F.; Bonnes, M. Perceived Residential Environment Quality in Middle-and Low-Extension Italian Cities. Eur. Rev. Appl. Psychol. 2006, 56, 23–34. [Google Scholar] [CrossRef]
  16. Tian, D.; Wang, J.; Xia, C.; Zhang, J.; Zhou, J.; Tian, Z.; Zhao, J.; Li, B.; Zhou, C. The Relationship between Green Space Accessibility by Multiple Travel Modes and Housing Prices: A Case Study of Beijing. Cities 2024, 145, 104694. [Google Scholar] [CrossRef]
  17. Gaynor, T.S.; Wilson, M.E. Social Vulnerability and Equity: The Disproportionate Impact of COVID-19. Public Adm. Rev. 2020, 80, 832–838. [Google Scholar] [CrossRef] [PubMed]
  18. Hwang, J. The Social Construction of a Gentrifying Neighborhood: Reifying and Redefining Identity and Boundaries in Inequality. Urban Aff. Rev. 2016, 52, 98–128. [Google Scholar] [CrossRef]
  19. Przybylowski, A.; Stelmak, S.; Suchanek, M. Mobility Behaviour in View of the Impact of the COVID-19 Pandemic—Public Transport Users in Gdansk Case Study. Sustainability 2021, 13, 364. [Google Scholar] [CrossRef]
  20. Zhang, Y.; Chen, Z.; Zheng, X.; Chen, N.; Wang, Y. Extracting the Location of Flooding Events in Urban Systems and Analyzing the Semantic Risk Using Social Sensing Data. J. Hydrol. 2021, 603, 127053. [Google Scholar] [CrossRef]
  21. Liu, L.; Yu, H.; Zhao, J.; Wu, H.; Peng, Z.; Wang, R. Multiscale Effects of Multimodal Public Facilities Accessibility on Housing Prices Based on MGWR: A Case Study of Wuhan, China. ISPRS Int. J. Geo-Inf. 2022, 11, 57. [Google Scholar] [CrossRef]
  22. Su, S.; Li, Z.; Xu, M.; Cai, Z.; Weng, M. A Geo-Big Data Approach to Intra-Urban Food Deserts: Transit-Varying Accessibility, Social Inequalities, and Implications for Urban Planning. Habitat Int. 2017, 64, 22–40. [Google Scholar] [CrossRef]
  23. Zhang, J.; Zhang, P.; Xu, B. Analysis of College Students’ Public Opinion Based on Machine Learning and Evolutionary Algorithm. Complexity 2019, 2019, 1712569. [Google Scholar] [CrossRef]
  24. Ruijer, E.; Porumbescu, G.; Porter, R.; Piotrowski, S. Social Equity in the Data Era: A Systematic Literature Review of Data-driven Public Service Research. Public Adm. Rev. 2023, 83, 316–332. [Google Scholar] [CrossRef]
  25. Wu, S.; Ma, L.; Tao, T.; Dou, H. Structure and Governance Model of Rural Social Space Quality: A Case Study of Longxi County in the Loess Hilly Area of China. J. Geogr. Sci. 2022, 32, 1297–1320. [Google Scholar] [CrossRef]
  26. Arundel, R.; Ronald, R. The False Promise of Homeownership: Homeowner Societies in an Era of Declining Access and Rising Inequality. Urban Stud. 2021, 58, 1120–1140. [Google Scholar] [CrossRef]
  27. Cassiers, T.; Kesteloot, C. Socio-Spatial Inequalities and Social Cohesion in European Cities. Urban Stud. 2012, 49, 1909–1924. [Google Scholar] [CrossRef]
  28. Huang, J.; Jones, P.; He, X. Masks, Ventilation and Exposure Time: A Web-Based Calculator of Indoor COVID-19 Infection Risk. Front. Built Environ. 2022, 8, 986923. [Google Scholar] [CrossRef]
  29. Huang, J.; Hao, T.; Liu, X.; Jones, P.; Ou, C.; Liang, W.; Liu, F. Airborne Transmission of the Delta Variant of SARS-CoV-2 in an Auditorium. Build. Environ. 2022, 219, 109212. [Google Scholar] [CrossRef]
  30. Huang, J.; Jones, P.; Zhang, A.; Hou, S.S.; Hang, J.; Spengler, J.D. Outdoor Airborne Transmission of Coronavirus among Apartments in High-Density Cities. Front. Built Environ. 2021, 7, 666923. [Google Scholar] [CrossRef]
  31. Du, J.; Thill, J.-C.; Peiser, R.B.; Feng, C. Urban Land Market and Land-Use Changes in Post-Reform China: A Case Study of Beijing. Landsc. Urban Plan. 2014, 124, 118–128. [Google Scholar] [CrossRef]
  32. Li, X.; Zhang, T. Place Identity and Older Residents’ Coping Strategies While Ageing in Declining Neighbourhoods of Urban China. J. Environ. Psychol. 2021, 78, 101692. [Google Scholar] [CrossRef]
  33. Friedrich, E.; Hillier, B.; Chiaradia, A. Anti-Social Behaviour and Urban Configuration Using Space Syntax to Understand Spatial Patterns of Socio-Environmental Disorder; KTH: Stockholm, Sweden, 2009. [Google Scholar]
  34. Hu, J.; Chen, J.; Li, P.; Yan, J.; Wang, H. Systematic Review of Socially Sustainable and Community Regeneration: Research Traits, Focal Points, and Future Trajectories. Buildings 2024, 14, 881. [Google Scholar] [CrossRef]
  35. Geng, M.; Paola, P.; Hao, W.; Huiqing, H.; Dong, W.; Jinliu, C. Impact of Land-Use Mixing on the Vitality of Urban Parks: Evidence from Big Data Analysis in Suzhou, Yangtze River Delta Region, China. J. Urban Plan. Dev. 2023, 149, 4023045. [Google Scholar] [CrossRef]
  36. Dahms, H.F. Theory in Weberian Marxism: Patterns of Critical Social Theory in Lukács and Habermas. Sociol. Theory 1997, 15, 181–214. [Google Scholar] [CrossRef]
  37. Frisby, D. Fragments of Modernity (Routledge Revivals): Theories of Modernity in the Work of Simmel, Kracauer and Benjamin; Routledge: London, UK, 2013; ISBN 0203795563. [Google Scholar]
  38. Merriman, B. Three Conceptions of Spatial Locality in Chicago School Sociology (and Their Significance Today). Am. Sociol. 2015, 46, 269–287. [Google Scholar] [CrossRef]
  39. Manning, P. Erving Goffman and Dramaturgical Sociology; Cambridge University: Cambridge, UK, 2017. [Google Scholar]
  40. Poorghorban, Y. On Michel Foucault: Power/Knowledge, Discourse, and Subjectivity. OKARA J. Bhs. Sastra 2023, 17, 318–328. [Google Scholar] [CrossRef]
  41. Gross, D. Time-Space Relations in Giddens’ Social Theory. Theory Cult. Soc. 1982, 1, 83–88. [Google Scholar] [CrossRef]
  42. Bourdieu, P. Social Space and the Genesis of Appropriated Physical Space. Int. J. Urban Reg. Res. 2018, 42, 106–114. [Google Scholar] [CrossRef]
  43. Kinkaid, E. Re-Encountering Lefebvre: Toward a Critical Phenomenology of Social Space. Environ. Plan. D Soc. Space 2020, 38, 167–186. [Google Scholar] [CrossRef]
  44. Soja, E.W. Seeking Spatial Justice; University of Minnesota Press: Minneapolis, MN, USA, 2013; Volume 16, ISBN 1452915288. [Google Scholar]
  45. Katznelson, I. Towards a Respatialized Marxism: Lefebvre, Harvey, and Castells. In Marxism and the City; Oxford University: Oxford, UK, 1992; pp. 92–140. [Google Scholar] [CrossRef]
  46. Gregory, D.; Urry, J. Social Relations and Spatial Structures. Sci. Soc. 1988, 52, 362–364. [Google Scholar]
  47. Delmelle, E.C. Mapping the DNA of Urban Neighborhoods: Clustering Longitudinal Sequences of Neighborhood Socioeconomic Change. Ann. Am. Assoc. Geogr. 2016, 106, 36–56. [Google Scholar] [CrossRef]
  48. Horne, R.; Willand, N.; Dorignon, L.; Middha, B. Housing Inequalities and Resilience: The Lived Experience of COVID-19. Int. J. Hous. Policy 2023, 23, 313–337. [Google Scholar] [CrossRef]
  49. Rosenthal, S.S.; Strange, W.C.; Urrego, J.A. JUE Insight: Are City Centers Losing Their Appeal? Commercial Real Estate, Urban Spatial Structure, and COVID-19. J. Urban Econ. 2022, 127, 103381. [Google Scholar] [CrossRef]
  50. de Vries, S.; van Dillen, S.M.E.; Groenewegen, P.P.; Spreeuwenberg, P. Streetscape Greenery and Health: Stress, Social Cohesion and Physical Activity as Mediators. Soc. Sci. Med. 2013, 94, 26–33. [Google Scholar] [CrossRef]
  51. Zhang, X.; Lu, Y.; Xu, Y.; Zhou, C.; Zou, Y. Governing Regional Inequality through Regional Cooperation? A Case Study of the Guangdong-Hong Kong-Macau Greater Bay Area. Appl. Geogr. 2024, 162, 103135. [Google Scholar] [CrossRef]
  52. Li, Y.; Zhang, X.; Xia, C. Towards a Greening City: How Does Regional Cooperation Promote Urban Green Space in the Guangdong-Hong Kong-Macau Greater Bay Area? Urban For. Urban Green. 2023, 86, 128033. [Google Scholar] [CrossRef]
  53. Liu, P.; Song, Y.; Zou, Q.; Tang, J.; Fernandez, J. Environmental Press of Urban Greenspace Pre-Post COVID on Older Adults: A Big Data Study in Metropolitan Atlanta. Cities 2024, 145, 104733. [Google Scholar] [CrossRef]
  54. Chen, J.; Pellegrini, P.; Wang, H. Comparative Residents’ Satisfaction Evaluation for Socially Sustainable Regeneration—The Case of Two High-Density Communities in Suzhou. Land 2022, 11, 1483. [Google Scholar] [CrossRef]
  55. Pan, L.; Gan, W.; Chen, J.; Ren, K. An Integrated Model for Constructing Urban Ecological Networks and Identifying the Ecological Protection Priority: A Case Study of Wujiang District, Suzhou. Sustainability 2023, 15, 4487. [Google Scholar] [CrossRef]
  56. Heyes, A.; Zhu, M. Air Pollution as a Cause of Sleeplessness: Social Media Evidence from a Panel of Chinese Cities. J. Environ. Econ. Manag. 2019, 98, 102247. [Google Scholar] [CrossRef]
  57. Guo, M.; Lin, Y.; Shyu, R.-J.; Huang, J. Characterizing Environmental Pollution with Civil Complaints and Social Media Data: A Case of the Greater Taipei Area. J. Environ. Manag. 2023, 348, 119310. [Google Scholar] [CrossRef]
  58. Zhang, X.; Shen, J.; Sun, Y.; Zhou, C.; Yang, Y. Formation of City Regions from Bottom-up Initiatives: Investigating Coalitional Developmentalism in the Pearl River Delta. Ann. Am. Assoc. Geogr. 2023, 113, 700–716. [Google Scholar] [CrossRef]
  59. Zhang, X.; Sun, Y.; Luan, X. Regulation Flexibility and Legitimacy Building in Governing Intercity Railways: The Polymorphous Role of the Chinese Provincial Government. J. Urban Aff. 2023, 1–16. [Google Scholar] [CrossRef]
  60. Zhang, X.; Chen, Y.; Xu, Y.; Yue, W.; Tang, C. Does Regional Cooperation Constrain Urban Sprawl? Evidence from the Guangdong-Hong Kong-Macao Greater Bay Area. Landsc. Urban Plan. 2023, 235, 104742. [Google Scholar] [CrossRef]
  61. Hao, T.; Chang, H.; Liang, S.; Jones, P.; Chan, P.W.; Li, L.; Huang, J. Heat and Park Attendance: Evidence from “Small Data” and “Big Data” in Hong Kong. Build. Environ. 2023, 234, 110123. [Google Scholar] [CrossRef]
  62. Chen, J.; Wang, H.; Yang, Z.; Li, P.; Ma, G.; Zhao, X. Comparative Spatial Vitality Evaluation of Traditional Settlements Based on SUF: Taking Anren Ancient Town’s Urban Design as an Example. Sustainability 2023, 15, 8178. [Google Scholar] [CrossRef]
  63. Chen, J.; Pellegrini, P.; Yang, Z.; Wang, H. Strategies for Sustainable Urban Renewal: Community-Scale GIS-Based Analysis for Densification Decision Making. Sustainability 2023, 15, 7901. [Google Scholar] [CrossRef]
  64. Freihardt, J. Can Citizen Science Using Social Media Inform Sanitation Planning? J. Environ. Manag. 2020, 259, 110053. [Google Scholar] [CrossRef] [PubMed]
  65. Chen, Y.; Yue, W.; La Rosa, D. Which Communities Have Better Accessibility to Green Space? An Investigation into Environmental Inequality Using Big Data. Landsc. Urban Plan. 2020, 204, 103919. [Google Scholar] [CrossRef]
  66. Hao, T.; Zhao, Q.; Huang, J. Optimization of Tree Locations to Reduce Human Heat Stress in an Urban Park. Urban For. Urban Green. 2023, 86, 128017. [Google Scholar] [CrossRef]
  67. De Vries, S.; Buijs, A.E.; Snep, R.P.H. Environmental Justice in The Netherlands: Presence and Quality of Greenspace Differ by Socioeconomic Status of Neighbourhoods. Sustainability 2020, 12, 5889. [Google Scholar] [CrossRef]
  68. Huang, J.; Cui, Y.; Chang, H.; Obracht-Prondzyńska, H.; Kamrowska-Zaluska, D.; Li, L. A City Is Not a Tree: A Multi-City Study on Street Network and Urban Life. Landsc. Urban Plan. 2022, 226, 104469. [Google Scholar] [CrossRef]
  69. Jia, S.; Wang, Y.; Fan, G.-Z. Home-Purchase Limits and Housing Prices: Evidence from China. J. Real Estate Financ. Econ. 2018, 56, 386–409. [Google Scholar] [CrossRef]
  70. Boyce, J.K.; Zwickl, K.; Ash, M. Measuring Environmental Inequality. Ecol. Econ. 2016, 124, 114–123. [Google Scholar] [CrossRef]
  71. Cordera, R.; Coppola, P.; Dell’Olio, L.; Ibeas, Á. The Impact of Accessibility by Public Transport on Real Estate Values: A Comparison between the Cities of Rome and Santander. Transp. Res. Part A Policy Pract. 2019, 125, 308–319. [Google Scholar] [CrossRef]
  72. Zhang, Z.; Li, J.; Fung, T.; Yu, H.; Mei, C.; Leung, Y.; Zhou, Y. Multiscale Geographically and Temporally Weighted Regression with a Unilateral Temporal Weighting Scheme and Its Application in the Analysis of Spatiotemporal Characteristics of House Prices in Beijing. Int. J. Geogr. Inf. Sci. 2021, 35, 2262–2286. [Google Scholar] [CrossRef]
  73. Wang, C.-H.; Chen, N. A Geographically Weighted Regression Approach to Investigating Local Built-Environment Effects on Home Prices in the Housing Downturn, Recovery, and Subsequent Increases. J. Hous. Built Environ. 2020, 35, 1283–1302. [Google Scholar] [CrossRef]
  74. Huang, H.; Yin, L. Creating Sustainable Urban Built Environments: An Application of Hedonic House Price Models in Wuhan, China. J. Hous. Built Environ. 2015, 30, 219–235. [Google Scholar] [CrossRef]
  75. Li, H.; Chen, P.; Grant, R. Built Environment, Special Economic Zone, and Housing Prices in Shenzhen, China. Appl. Geogr. 2021, 129, 102429. [Google Scholar] [CrossRef]
  76. Tabales, J.M.N.; Caridad, J.M.; Carmona, F.J.R. Artificial Neural Networks for Predicting Real Estate Price. Rev. Métodos Cuantitativos Para Econ. Empresa 2013, 15, 29–44. [Google Scholar]
  77. Schwappach, D.L.B. Resource Allocation, Social Values and the QALY: A Review of the Debate and Empirical Evidence. Health Expect. 2002, 5, 210–222. [Google Scholar] [CrossRef]
  78. Chen, J.; Chang, Z. Rethinking Urban Green Space Accessibility: Evaluating and Optimizing Public Transportation System through Social Network Analysis in Megacities. Landsc. Urban Plan. 2015, 143, 150–159. [Google Scholar] [CrossRef]
  79. Groulx, M.; Nowak, N.; Levy, K.; Booth, A. Community Needs and Interests in University–Community Partnerships for Sustainable Development. Int. J. Sustain. High. Educ. 2021, 22, 274–290. [Google Scholar] [CrossRef]
  80. Havinga, I.; Marcos, D.; Bogaart, P.; Tuia, D.; Hein, L. Understanding the Sentiment Associated with Cultural Ecosystem Services Using Images and Text from Social Media. Ecosyst. Serv. 2024, 65, 101581. [Google Scholar] [CrossRef]
  81. Alshaabi, T.; Arnold, M.V.; Minot, J.R.; Adams, J.L.; Dewhurst, D.R.; Reagan, A.J.; Muhamad, R.; Danforth, C.M.; Dodds, P.S. How the World’s Collective Attention Is Being Paid to a Pandemic: COVID-19 Related n-Gram Time Series for 24 Languages on Twitter. PLoS ONE 2021, 16, e0244476. [Google Scholar] [CrossRef]
  82. Huang, J.; Cui, Y.; Li, L.; Guo, M.; Ho, H.C.; Lu, Y.; Webster, C. Re-Examining Jane Jacobs’ Doctrine Using New Urban Data in Hong Kong. Environ. Plan. B Urban Anal. City Sci. 2023, 50, 76–93. [Google Scholar] [CrossRef]
  83. Chen, W.-H.; Myles, J.; Picot, G. Why Have Poorer Neighbourhoods Stagnated Economically While the Richer Have Flourished? Neighbourhood Income Inequality in Canadian Cities. Urban Stud. 2012, 49, 877–896. [Google Scholar] [CrossRef]
  84. James, L.; Daniel, L.; Bentley, R.; Baker, E. Housing Inequality: A Systematic Scoping Review. Hous. Stud. 2022, 39, 1264–1285. [Google Scholar] [CrossRef]
  85. Kolb, K.; Skopek, N.; Blossfeld, H.-P. The Two Dimensions of Housing Inequality in Europe Are High Home Ownership Rates an Indicator of Low Housing Values? Comp. Popul. Stud. 2013, 38, 4. [Google Scholar] [CrossRef]
  86. Chen, J.; Tian, W.; Xu, K.; Pellegrini, P. Testing Small-Scale Vitality Measurement Based on 5D Model Assessment with Multi-Source Data: A Resettlement Community Case in Suzhou. ISPRS Int. J. Geo-Inf. 2022, 11, 626. [Google Scholar] [CrossRef]
  87. Castro-Abril, P.; Da Costa, S.; Navarro-Carrillo, G.; Caicedo-Moreno, A.; Gracia-Leiva, M.; Bouchat, P.; Cordero, B.; Méndez, L.; Paez, D. Social Identity, Perceived Emotional Synchrony, Creativity, Social Representations, and Participation in Social Movements: The Case of the 2019 Chilean Populist Protests. Front. Psychol. 2021, 12, 764434. [Google Scholar] [CrossRef]
  88. Gamber, W.; Graham, J.; Yadav, A. Stuck at Home: Housing Demand during the COVID-19 Pandemic. J. Hous. Econ. 2023, 59, 101908. [Google Scholar] [CrossRef] [PubMed]
  89. Bolleter, J.; Edwards, N.; Cameron, R.; Hooper, P. Density My Way: Community Attitudes to Neighbourhood Densification Scenarios. Cities 2024, 145, 104596. [Google Scholar] [CrossRef]
  90. Wan, J.; Liu, X.; Zuo, Y.; Luo, J. Analysis on Public Opinion Sentiment Evolution of COVID-19 Based on Weibo Data; WHICEB Proceedings: Wuhan, China, 2021; Volume 67. [Google Scholar]
  91. Zhou, M. Public Opinion on MOOCs: Sentiment and Content Analyses of Chinese Microblogging Data. Behav. Inf. Technol. 2022, 41, 365–382. [Google Scholar] [CrossRef]
  92. Feng, X.; Wang, X.; Zhang, Y. Research on Public Emotional Polarization and Public Opinion Evolution of OTC and Learning during the COVID-19 Epidemic: Taking the Topic of OTC on Zhihu as an Example. Libr. Hi Tech 2022, 40, 286–303. [Google Scholar] [CrossRef]
  93. Nieves-Pavón, S.; López-Mosquera, N.; Jiménez-Naranjo, H. The Role Emotions Play in Loyalty and WOM Intention in a Smart Tourism Destination Management. Cities 2024, 145, 104681. [Google Scholar] [CrossRef]
  94. Basu, A.; Duvall, J.; Kaplan, R. Attention Restoration Theory: Exploring the Role of Soft Fascination and Mental Bandwidth. Environ. Behav. 2019, 51, 1055–1081. [Google Scholar] [CrossRef]
  95. Chen, J.; Kinoshita, T.; Li, H.; Luo, S.; Su, D. Which Green Is More Equitable? A Study of Urban Green Space Equity Based on Morphological Spatial Patterns. Urban For. Urban Green. 2024, 91, 128178. [Google Scholar] [CrossRef]
  96. Im, J.; Hong, S.H. Impact of a New Subway Line on Housing Values in Daegu, Korea: Distance from Existing Lines. Urban Stud. 2018, 55, 3318–3335. [Google Scholar] [CrossRef]
Figure 1. Research conceptual framework.
Land 13 00563 g001
Figure 2. Suzhou location and the main research area. Source: self-drawn by author; map review number of China: GS (2023) 2767, supervised by the Ministry of Natural Resources.
Land 13 00563 g002
Figure 3. Sentiment analysis diagram and principle based on SnowNLP.
Land 13 00563 g003
Figure 4. Robust tests via Monte-Carlo testing for spatial variability.
Land 13 00563 g004
Figure 5. Word frequency analysis of Weibo check-in data. (a) 2020; (b) 2022.
Land 13 00563 g005
Figure 6. Sentiment analysis results of Weibo check-in data ((left) 2020, (right) 2022).
Land 13 00563 g006
Figure 7. Scatter plot and local clustering of Weibo index differences in 2020 and 2022.
Land 13 00563 g007
Figure 8. MGWR analysis results combined sentiment maps with community conditions.
Land 13 00563 g008
Figure 9. Spatial analysis of housing price data ((left) 2020, (right) 2022).
Land 13 00563 g009
Figure 10. Scatter plot and local clustering of the growth rate of housing prices in 2020 and 2022.
Land 13 00563 g010
Figure 11. Spatial-analysis-results-related housing price index via MGWR; building floors (A4); education quantity (Cl); park distance (B3); bus quantity (C2); floor area ratio (Al); community establishment age (A2); greening rate (A3); subway distance (B2).
Land 13 00563 g011
Table 2. Summary of the elements of social–spatial dynamics measurement.
CategoryVariablesGuo; Tabales, etc. [57,67]Schwappach; Jia [68,69]Boyce; Cordera
[70,71]
Zhang
[72]
Tian; Wang
[16,73,74]
Liu; Li
[53,75]
Community ElementsGreening rate
People density
Building floors
Community area
Floor area ratio
Establishment age
Community decoration
Public Facilities DistanceHospital distance
Subway distance
Park distance
Water distance
Public Facility DensityBus quantity
Education quantity
Public bicycle quantity
Public facilities quantity
Commercial facilities quantity
Table 3. A detailed description of the data source used in our empirical research.
ItemDescription and SourceQuantityTime
Community basic informationHouse sale price in RMB/Community construction time/The height of community buildings/The community floor area ratio/The community greenery rate.
Accessed from: https://anjuke.com, accessed on 5 January 2024.
5917 pieces2020/2022
Social network dataWeibo check-in data with text and geo-location.
Accessed from: https://weibo.com, accessed on 5 January 2024.
23,176 pieces2020/2022
POI dataBuilding outline/Urban Park green space/Spatial distribution of public facilities/Public transportation services.
Accessed from: https://lbs.amap.com/ accessed on 5 January 2024.
1479 polygons2022
Table 4. Data variables to represent community conditions.
CategoryVariables
Community Elements (A)Floor area ratio (A1)
Community establishment age (A2)
Greening Rate (A3)
Building floors (A4)
Public Facilities Distance (B)Hospital distance (B1)
Subway distance (B2)
Park distance (B3)
Water distance (B4)
Public Facility Density (C)Education quantity (C1)
Bus quantity (C2)
Commercial Facilities Quantity (C3)
Table 5. Global Moran’s I index based on Weibo check-in data.
Dependent VariableMoran’s I IndexZ Valuep ValueE (I)
Weibo index difference0.23165.5944520.000000−0.000212
Table 6. The number of different spatial aggregation patterns based on Weibo check-in data.
Dependent VariableHHHLLHLLNot Significant
Weibo sentiment map difference117145110011031889
Table 7. Summary of OLS results (model variables).
VariableCoefficient aStdErrort-StatisticProbability bRobust_SERobust_tRobust_Pr bVIF c
Intercept−0.5640460.193173−2.9198930.003526 *0.177823−3.1719520.001539 */
Floor area ratio (A1)−0.0913890.039708−2.3015300.021389 *0.035130−2.6014790.009304 *1.340788
Establishment age (A2)−0.0156270.004059−3.8499060.000130 *0.004526−3.4525450.000576 *1.371478
Hospital distance (B1)0.0001160.0000562.0519940.040214 *0.0000572.0289590.042509 *1.250179
Subway distance (B2)0.0000220.0000045.1574940.000001 *0.0000037.8265130.000000 *1.213479
Park distance (B3)0.0001510.0000503.0200890.002552 *0.0000413.6636460.000265 *1.322192
Water distance (B4)0.0004690.0001004.6892860.000004 *0.0000785.9789880.000000 *1.059280
Education quantity (C1)0.0157620.0033694.6784320.000004 *0.0037064.2530410.000026 *1.817459
Bus quantity (C2)−0.0106240.005171−2.0546820.039954 *0.005326−1.9946970.046125 *1.772654
Commercial quantity (C3)−0.0003020.000116−2.6045690.009221 *0.000115−2.6162140.008913 *4.226762
Coefficient a: The sign of the coefficient a indicates the direction of the influence (positive or negative). Probability b: This is the p value corresponding to coefficient a. Robust_Pr b: This is the p-value of coefficient a calculated taking into account heteroskedasticity and autocorrelation. VIF c: This is an indicator used to test whether there is multicollinearity between independent variables.
Table 8. Comparison of OLS and MGWR analysis results of Weibo sentiment map.
CriterionOLS CoefficientsMGWR Coefficients
MeanMeanMin, Max
Intercept−0.564046−0.0059−5.5626, 2.6726
Floor area ratio (A1)−0.091389−0.0250−0.0289, −0.0188
Establishment age (A2)−0.015627−0.0262−0.0317, −0.0242
Hospital distance (B1)0.0001160.04600.0018, 0.0830
Subway distance (B2)0.0000220.07550.0703, 0.0806
Park distance (B3)0.0001510.03380.0297, 0.0369
Water distance (B4)0.0004690.04900.0485, 0.0507
Education quantity (C1)0.0157620.0850−5.1261, 3.2980
Bus quantity (C2)−0.010624−0.0172−0.0187, −0.0167
Commercial quantity (C3)−0.000302−0.0601−0.0624, −0.0588
R20.0376800.6994
AICc191949188.6612
Table 9. Global Moran’s I Index based on housing data.
Dependent VariableMoran’s I IndexZ Valuep ValueE (I)
Growth rate of prices0.14039.6909480.000000−0.000212
Table 10. The number of different spatial aggregation patterns based on housing data.
Dependent VariableHHHLLHLLNot Significant
Housing price data difference65417929610352550
Table 11. The number of different spatial aggregation patterns.
VariableCoefficient aStdErrort-StatisticProbability bRobust_SERobust_tRobust_Pr cVIF c
Intercept6.9190722.6630032.5982210.009393 *2.7023912.5603520.010479 */
Floor area ratio (A1)−3.224830.534518−6.033160.000000 *0.479604−6.723950.000000 *1.332868
Establishment age (A2)−0.167830.054878−3.058170.002252 *0.061045−2.749250.005996 *1.375253
Greening Rate (A3)15.388924.01693.8310430.000140 *3.8352824.012460.000069 *1.146208
Building floors (A4)−0.4308890.095334−4.5197830.000009 *0.079629−5.4112280.000000 *1.221984
Subway distance (B2)−0.000110.000058−1.973460.048495 *0.000049−2.340010.019309 *1.239474
Park distance (B3)0.0016790.0006762.4844660.012997 *0.0007412.2656560.023501 *1.326039
Education quantity (C1)−0.179530.045534−3.942850.000091 *0.048157−3.728030.000208 *1.821136
Bus quantity (C2)0.2141440.0698453.0659770.002195 *0.0638463.3540650.000819 *1.774402
Coefficient a: The sign of the coefficient a indicates the direction of the influence (positive or negative). Probability b: This is the p value corresponding to coefficient a. Robust_Pr b: This is the p-value of coefficient a calculated taking into account heteroskedasticity and autocorrelation. VIF c: This is an indicator used to test whether there is multicollinearity between independent variables.
Table 12. OLS and MGWR comparison with spatial differentiation.
CriterionOLS CoefficientsMGWR Coefficients
MeanMeanMin, Max
Intercept6.919072−0.0123−0.6566, 1.5419
Floor area ratio (A1)−3.224834−0.1484−2.4387, 1.6185
Establishment age (A2)−0.167827−0.0813−2.3061, 1.4192
Greening rate (A3)15.3889150.0079−0.4746, 0.3506
Building floors (A4)−0.430889−0.0654−0.1226, −0.0049
Subway distance (B2)−0.0001140.0005−0.0065, 0.0064
Park distance (B3)0.0016790.03570.0323, 0.0499
Education quantity (C1)−0.179532−0.0668−0.0675, −0.0651
Bus quantity (C2)0.2141440.02430.0198, 0.0347
R20.0328660.5540
AICc43,73511,774.9415
Disclaimer/Publisher’s Note: The statements, opinions and data contained in all publications are solely those of the individual author(s) and contributor(s) and not of MDPI and/or the editor(s). MDPI and/or the editor(s) disclaim responsibility for any injury to people or property resulting from any ideas, methods, instructions or products referred to in the content.

