
A Study on the Spatio-Temporal Evolution Characteristics of Social Development Levels in China


1
Institute of Geographic Sciences and Natural Resources Research, Chinese Academy of Sciences, Beijing 100101, China
2
University of Chinese Academy of Sciences, Beijing 100049, China
3
School of Public Policy and Management, University of Chinese Academy of Sciences, Beijing 100049, China
*
Author to whom correspondence should be addressed.
Land 2024, 13(5), 565; https://doi.org/10.3390/land13050565
Submission received: 25 March 2024
/
Revised: 16 April 2024
/
Accepted: 18 April 2024
/
Published: 23 April 2024
Abstract
:With the increase in regional economic development disparities, a regional coordinated development strategy is put forward that prioritizes human welfare and holistic social progress over a purely materialistic growth model. To address the challenges of balanced regional development, this paper has developed a multidimensional assessment framework of social development encompassing education, healthcare, culture, and social security. Using the entropy weight TOPSIS method, this study measures the social development level across 296 Chinese prefecture-level cities from 1990 to 2020. It explores the spatio-temporal evolution characteristics of China’s social development level through the Dagum Gini coefficient decomposition method and exploratory spatial data analysis. The results indicate that (1) the level of social development in China exhibits a fluctuating upward trend over the time series, showing a phase-wise pattern of decline–rise–rise; (2) there is a clear heterogeneity in the level of social development, with a general hierarchy of Eastern, Northeastern, Western, and Central regions in terms of social development; (3) spatially, China’s social development level has evolved from a patchy distribution in 1990 to a clustered distribution around urban agglomerations by 2020, with pronounced characteristics of spatial imbalance; (4) the level of social development in China displays varying degrees of spatial clustering, with this trend intensifying over time; and (5) over the period 1990–2020, the overall disparity in China’s social development level presents a fluctuating trend, with a notable reduction after an initial increase, and regional disparities following the order of Central, Western, Eastern, and Northeastern regions. This research offers valuable insights for policymakers and scholars seeking to understand and enhance China’s social development landscape.
1. Introduction
In the new era, China’s societal dynamics have undergone a significant transformation. The primary contradiction in Chinese society has shifted from the historical struggle between the people’s growing material needs and scarce resources, to the contradiction between the desire for a better life and unbalanced, inadequate development. This transition has manifested distinct spatial disparities, with the issue of unbalanced regional development remaining prominent, posing challenges to China’s implementation of a coordinated regional development strategy in the new era [1].
As China’s economy continues to thrive and social development levels gradually improve, the role of social development in achieving regional balance has come into sharp focus, drawing global attention. According to the 2021 “Happiness Index Research Report” published by Tsinghua University’s Academy of New Urbanization, the overall happiness index of the Chinese people is improving, highlighting the significant contribution of social development in enhancing public well-being [2]. However, the happiness index’s growth has not kept pace with GDP expansion since 2006, suggesting that economic prosperity is no longer the sole determinant of happiness [3]. A more comprehensive and in-depth push for social development is needed to address issues such as social structural imbalances and improvements in social security, making it crucial for addressing problems of unbalanced and inadequate regional development and meeting people’s needs for a better life. Therefore, the study of social development holds significant theoretical value and practical significance.
Previous research on social development can be broadly categorized into two levels. At the macro level, there is overall social development, where numerous scholars view the economic and social fabric as an organically unified whole, constituting a broad definition of social development. This perspective posits that the holistic development of society encompasses multiple dimensions, including economic growth, political advancement, cultural progression, and individual development [4]. In contrast, a narrower definition of social development considers it as progress in social sectors beyond the economic and ecological systems, focusing on the advancement of various social undertakings. This encompasses developments in social quality, living standards, education levels, population quality and health, social security, and social welfare [5,6,7]. This perspective acknowledges that social development not only fosters an environment conducive to economic growth but also acts as a driving force for regional economic advancement and societal harmony [8].
The academic community has increasingly focused on the evaluation system for social development levels. Early comprehensive evaluation studies of social development levels, grounded in the new paradigm of social quality, have explored various aspects of life quality, social welfare, and subjective well-being across different social conditions, and national and cultural contexts [9,10,11,12,13,14], showcasing a complex and diverse array of perspectives that reflect the complexity and comprehensiveness of social indicators. In China, social indicator research has evolved, with a notable shift in focus from population, income, education, and employment during the “Ninth Five-Year Plan” to health, social services, employment, and social security during the “Eleventh Five-Year Plan,” and more recently to social quality, resident satisfaction, and social equity during the “Fourteenth Five-Year Plan” [15,16,17]. The construction of China’s social indicators, grounded in theory and aimed at serving policy-making, has, in recent years, centered around achieving a moderately prosperous society and sustainable development goals [18], based on the strategy of coordinated regional development [19,20], and focusing on quality of life and welfare [21]. These studies strive to construct a social indicator system that aligns with China’s realities, supporting the goals of achieving a moderately prosperous society and sustainable development, as well as promoting coordinated regional development strategies. Their research often focuses on a comprehensive measurement of regional development levels from economic, social, and ecological perspectives [22,23,24,25]. It has seen growing attention on the importance of social welfare and ecological environment for sustainable economic growth, and studies on the interaction between social welfare and ecological environment, as well as between social security and economic development, have gradually increased [26,27].
The main issues in current research include a predominance of studies evaluating the economic and social systems as a unified whole or focusing mainly on single indicators within the social system such as basic public services, social security, and social welfare, with relatively fewer studies conducting comprehensive assessments of social development as an independent and pure system. Moreover, research on social development often relies on cross-sectional data at the provincial and urban agglomeration levels, with a need for further development in the comprehensive measurement and study of social systems on the national scale of cities and municipalities.
Therefore, this study addresses these gaps by collecting social data from 296 prefecture-level cities in China for the years 1990 to 2020. We employ a multi-indicator calculation to conduct a comprehensive evaluation of the levels of social development, using the entropy weight TOPSIS method to calculate a composite index. The entropy weight TOPSIS method was utilized to calculate a comprehensive index for social development in China. Furthermore, the study applies the Dagum Gini coefficient decomposition method and exploratory spatial data analysis to examine the spatio-temporal evolution characteristics of social development in China. This approach aids in clarifying the current status of disparities in social development across China and attempts to address the gap in research on the comprehensive measurement of the Chinese social system at a broader geographical scale, thus providing a scientific foundation for further related research.
2. Data and Methods
2.1. Data Source and Preprocessing
The initial data for this research were obtained from a range of publications spanning three decades, from 1990 to 2020. These sources included the ‘China Urban Statistical Yearbook’, the ‘China Regional Economic Statistical Yearbook’, the ‘China City Yearbook’, and the ‘China Labor Statistical Yearbook’. Additionally, the study utilized annual reports from selected provinces, statistical yearbooks from various cities, and statistical bulletins detailing national economic and social development from numerous cities and counties. For some indicators where data collection was incomplete, a selection and substitution process was applied based on the importance of the indicators and the availability of actual data. Missing data were supplemented with statistics from municipal bulletins, and for data that remained elusive, a method of extrapolation using multi-year data was employed to estimate the missing information. As of 31 December 2020, mainland China comprised 4 municipalities directly under the Central Government and 293 prefecture-level cities. Due to significant data gaps for Sansha City in Hainan Province, the final study unit was determined to be 296 prefecture-level cities. In line with the research objectives of this paper, the collected data were processed and standardized, and spatial analysis software was utilized to visually represent the data spatially.
2.2. Research Methods
2.2.1. Establishment of Evaluation Indicator System
Building upon the most recent findings in the evaluation methodologies for comprehensive social development levels, researchers from varied viewpoints have developed distinct comprehensive evaluation systems for social development. Grounded in a thorough literature review and considering the availability of data on social elements, this study selected a relatively representative year during the research period, hence involving data from the years 1990, 2000, 2010, and 2020. Conducted at the national level and focusing on prefecture-level city domains, this paper selects representative indicators from four dimensions—education, culture, healthcare, and social security—to formulate a framework of 4 indicators that reflect the level of social development in China. This framework aids in constructing a comprehensive evaluation system for the social development system in China (Table 1). In the process of building this indicator system, while some indicators’ data can be directly sourced from relevant materials, others require further computation to be derived.
2.2.2. Entropy Weight TOPSIS Method
The entropy weight TOPSIS method is an enhancement of the traditional TOPSIS evaluation approach, determining the weights of the evaluation indicators for the social development system via the entropy weight method [28]. The entropy weight method objectively sets the weights of various evaluation indicators based on the information each provides. Serving as the weight of entropy, this method not only objectively reflects the importance of a given indicator within the system, but also highlights how the weight of an indicator changes over time. Since the measurement units for the indicators of the social development system are not uniform, it is necessary to standardize them before calculating a composite index. This involves transforming the absolute values of the indicators into relative values, thereby addressing the homogenization issue of different qualitative indicator values.
Additionally, the numerical values of positive and negative indicators represent different meanings (higher values are better for positive indicators, whereas lower values are better for negative indicators). Therefore, it is necessary to apply different algorithms for the data standardization of positive and negative indicators. The main calculation formulas are as follows:
- (1)
- Assuming there are entities to be evaluated, each with evaluation indicators, construct a judgment matrix and standardize the original matrix :
- (2)
- Calculate the proportion () of the value of the indicator in the year to that indicator’s total:
- (3)
- Calculate the entropy value () of the indicator. When , :
- (4)
- Calculate the variation coefficient () of the indicator:
- (5)
- Calculate the weight of the indicator:
- (6)
- The weighted normalized matrix can be obtained from the normalized matrix and the weights of each indicator:
- (7)
- Determine the optimal solution and the worst solution:
- (8)
- Calculate the Euclidean distance between each indicator and the optimal solution and the worst solution:
- (9)
- Calculate the comprehensive evaluation index:
In this context, represents the comprehensive evaluation index of social development and represents the weight of each indicator.
2.2.3. Dagum Gini Coefficient and Its Decomposition
The Dagum Gini coefficient decomposition method is used to examine the level of regional social development [29]. The Dagum Gini coefficient decomposition method breaks down the overall Gini coefficient G into three parts: the contribution of intra-group differences , the contribution of inter-group differences , and the contribution of hypervariable density . The intra-group reflects the level gap within each region, the inter-group reflects the level gap between regions, and the hypervariable density reflects the cross-overlapping phenomenon of each region, reflecting the relative gap. The Dagum Gini coefficient was originally used to measure regional income gaps. Its decomposition method by subgroups can effectively solve the source of regional differences. Therefore, it is widely used in many fields to describe the problem of uneven regional development [30]. is the Gini coefficient within a region, and is the Gini coefficient between regions, with the calculation formulas as follows:
In the formula, represents the number of designated regions, with this paper dividing them into four major regions, i.e., = 4. denotes the number of cities, represents the average value of the variable measured across all cities in a region, ) represents the value of the variable measured in any city within region ), and ) is the number of cities within region ).
In the formula, represents the relative impact of the composite index measured between regions, = = = 1, 2, …, , the term denotes the difference in the composite index measured between regions, and represents the transvariation first-order moment.
2.2.4. Exploratory Spatial Data Analysis (ESDA) Methods
Exploratory spatial data analysis (ESDA) methods are supported by spatial analysis and include two types of analytical methods: global statistics and local statistics [31]. This paper utilizes ArcGIS 10.8 spatial data analysis software, adopting both global and local Moran’s I indices. The formulas are as follows:
Here, I represents the global Moran’s I index, is the spatial weight matrix, is the number of study units, is the observed value, and is the variance of the sample. Moran’s I index is a common coefficient used to determine the presence of spatial autocorrelation, primarily analyzing the spatial association and clustering characteristics of geographical entities. Its value ranges from [−1, 1]. A Moran’s I index greater than 0 indicates positive spatial autocorrelation, meaning that similar values are clustered together in space, showing spatial clustering characteristics. A Moran’s I index less than 0 indicates negative spatial autocorrelation, meaning that dissimilar values are adjacent, which suggests spatial dispersion characteristics. The greater the absolute value, the more pronounced the spatial clustering (dispersion) characteristics; when Moran’s I is 0, the spatial distribution is random.
The Getis-Ord G* index is used to explore the local spatial autocorrelation within the social development system of various cities, identifying areas of high-value and low-value clusters. The calculation formula is as follows:
When and are not equal,
In the formula, is the spatial weight matrix, is the expected value of , and is the variance of ; at a statistically significant level, if > 0, then the area is a hotspot of high-value clusters; otherwise, it is a cold spot of low-value clusters.
2.2.5. Standard Deviational Ellipse and Gravity Center Migration
The standard deviation ellipse is a statistical analysis method for the evolution of spatial pattern, which can quantitatively reveal the evolution characteristics of the spatial distribution pattern of geographic elements from the perspectives of centrality, spreading range, distribution direction, distribution shape, etc. The main parameters include the center of gravity, area, azimuthal angle, X-axis standard deviation and Y-axis standard deviation, etc. [31]. The calculation formula of the center of gravity-standard deviation ellipse is as follows:
where and denote the values of longitude and latitude of the center of gravity of the elements to be studied in this paper, m denotes the weights of the elements to be studied, denotes the number of cities in the study area, and and denote the values of longitude and latitude of each land-level study unit, respectively.
where and are denoted as the standard deviation along the x-axis and y-axis, respectively, and are the relative coordinates of each point from the center of gravity of the region, denotes the weights, denotes the area of the standard deviation ellipse, and denotes the azimuth of the ellipse.
3. Results and Analysis
3.1. Characterization of Time-Series Evolution
After cleaning the data and calculating representative indicators of social development in China according to the formula of the aforementioned social development level evaluation indicator system, comprehensive evaluation index values of the social development subsystems for our country’s 296 cities from 1990 to 2020 were obtained. On this basis, the temporal evolution characteristics of the comprehensive level of social development in China from 1990 to 2020 were analyzed from both a national and regional perspective (Figure 1).
3.1.1. Chronological Changes at the National Level
From the trend of the average comprehensive index of the social development level of the 296 prefecture-level cities in China from 1990 to 2020, the overall social development level in China has shown a fluctuating upward trend, characterized by stages of decline, increase, and further increase. The national comprehensive index of social development level grew from 0.452 in 1990 to 0.548 in 2020, reflecting an overall growth rate of 21.24%. This period of social development in China can be divided into three distinct stages: the first stage of slow decline (1990–2000), the second stage of steady development (2000–2010), and the third stage of rapid development (2010–2020).
First Stage: Slow Decline (1990–2000). The national level of social development slightly decreased, with the average dropping from 0.452 in 1990 to 0.413 in 2000, a decline of approximately 8.64%. This period saw profound socio-economic structural changes in China, including accelerated industrialization and urbanization, which may have led to short-term underinvestment in basic education, healthcare, and cultural facilities. Economic resources might have been more heavily allocated to economic construction rather than social development, contributing to a relative decline in social development indicators. The emphasis on economic development over social aspects during the early stages of opening up, along with policy orientations and government development priorities, could also have contributed to the decline. In the pursuit of economic growth, some areas may not have balanced economic and social development effectively, leading to lagging development in education, healthcare, and social security. Additionally, variations in policy enforcement and effectiveness across different regions may have impacted the overall performance of social development indicators.
Second Stage: Steady Development (2000–2010). The national level of social development showed a slow upward trend, with the average increasing from 0.413 to 0.464, representing an average annual growth rate of 12.36%. This period’s relatively rapid growth in social development levels may be attributed to the continued high-speed growth of the Chinese economy, accelerated urbanization, advancements in education and technology, and a series of policies and reforms implemented by the government to promote various aspects of societal development, including education, healthcare, and infrastructure construction.
Third Stage: Rapid Development (2010–2020). The national level of social development further accelerated, with the average increasing from 0.464 in 2010 to 0.548 in 2020, representing an average annual growth rate of 18%. This stage’s rapid growth in social development levels was influenced by economic structural adjustments, technological innovation, and comprehensive deepening reforms. During this period, China continued to implement reform and opening-up policies, focused on addressing social issues, and worked to improve the living standards of its people, significantly promoting the improvement in the social development level.
3.1.2. Chronological Changes at the Regional Level
From 1990 to 2020, the trend of the average comprehensive index of social development levels across 296 prefecture-level cities in China generally mirrors the national trend, exhibiting fluctuations but overall showing a stable upward trend. The comprehensive index values are roughly distributed within the range of 0.2 to 1.0, with clear regional disparities. The average values of the social development level comprehensive index overall present the following regional hierarchy: Eastern Region > Northeastern Region > Western Region > Central Region (Figure 2).
The social development level in the Eastern Region showed a significant overall growth trend from 1990 to 2020. The average value of the comprehensive social development index increased from 0.430 in 1990 to 0.581 in 2020, marking the fastest growth rate at 34.99%. The minimum value increased from 0.248 to 0.435, and the maximum value from 0.718 to 0.976. Between 1990 and 2000, the Eastern Region’s social development level showed a slow decline but accelerated post-2000. This acceleration can be attributed to rapid economic development and the implementation of reform and opening-up policies, with the Eastern Region pioneering economic openness, which promoted economic growth and social development. The region was at the forefront of industrial upgrading and urbanization, with extensive infrastructure construction and economic transformation driving rapid improvements in social development levels.
The Central Region also saw overall growth in its social development level, albeit at a slower pace compared to other regions. From 1990 to 2020, the average value of the social development level comprehensive index increased from 0.456 to 0.521, marking the slowest growth rate among the regions at 14.05%. The minimum value increased from 0.341 to 0.443, and the maximum value from 0.652 to 0.769. Recently, the Central Region has received more policy support, including development planning and industrial transfer policies, which have driven improvements in local economic and social development levels. Gradually optimized industrial structures have strengthened regional coordinated development, thereby promoting growth in social development levels.
The Western Region’s social development level has maintained a trend similar to that of the Central Region, with relatively slow progress. The average value of the comprehensive social development index increased from 0.465 to 0.540, with a growth rate of 16.10%. The government’s implementation of a series of policies for the development of the Western Region, including infrastructure construction, resource integration, and industrial development measures, has driven rapid economic and social growth in the region. Additionally, the effective exploitation of the region’s abundant natural resources in recent years has also contributed to regional economic and social development.
The average value of the comprehensive social development index in the Northeastern Region increased from 0.459 in 1990 to 0.551 in 2020, with a growth rate of 20.10%. The Northeastern Region, traditionally reliant on heavy industries, has faced significant challenges in transitioning as these industries have declined, impacting the improvement in social development levels. Although extensive economic restructuring and industrial upgrading have been undertaken in recent years, these changes take time to have a significant impact, hence the relatively slow growth in social development levels.
3.2. Characterization of Spatial Evolution
3.2.1. Spatial Distribution Patterns
Based on calculations from the Chinese social development indicator system, the spatial distribution of social development levels across China was visualized using ArcGIS10.8 software (Figure 3). Starting with the comprehensive index of social development levels for each city domain in 1990, the natural breaks method (Jenks) was applied to categorize the social development levels of 296 prefecture-level cities into 5 levels at 4 temporal cross-sections. This approach was used to explore the spatial evolution patterns of social development levels on an urban scale in China.
During the study period, the overall level of social development in China has been continuously improving, with significant spatial differences. The distribution pattern evolved from a patchy distribution in 1990 to a clustered distribution around urban agglomerations by 2020, showing significant spatial agglomeration in its spatial distribution. The minimum and maximum values of the comprehensive index of social development levels have continuously increased, with the highest value of the comprehensive index for urban social development levels in China increasing from 0.718 in 1990 to 0.979 in 2020, and the lowest value increasing from 0.248 in 1990 to 0.414 in 2020. After 2000, the gap in the level of social development among Chinese cities showed a narrowing trend.
In 1990, the spatial disparity in urban social development levels was pronounced, with the most significant features of spatial imbalance. High and relatively high values of the comprehensive social development index were predominantly observed in cities across various regions. In the Northeastern region, cities like Shenyang and Harbin stood out. In the Eastern region, significant scores were noted in major cities including Beijing, Tianjin, Shanghai, Jinan, Dezhou, Guangzhou, and Haikou. The Central region also showed strong performances in cities such as Taiyuan, Shiyan, Nanyang, Xinyang, Yichang, Shangqiu, Hefei, and Guilin. Lastly, in the Western region, cities like Ordos, Hohhot, Lanzhou, Kunming, Urumqi, and Karamay demonstrated high index values. Low values of the comprehensive index were primarily in Qingyang, Dingxi, Longnan, Guangyuan, Shaoyang, Songyuan, and other cities. During this period, cities with higher levels of social development were mostly those with higher economic development levels, rich in resources, and geographically advantageous.
By 2000, the spatial disparity in urban social development levels compared to 1990 showed a narrowing trend, but the characteristics of spatial imbalance remained prominent. High-value areas of the comprehensive index were mainly in Northeastern cities like Shenyang, Harbin, and Changchun, Eastern cities like Beijing, Tianjin, Jinan (Shandong), Shanghai, Fuzhou, Hangzhou, Guangzhou, and Haikou, Central cities like Hefei, Taiyuan, Changsha, Nanning, Chengdu, and Western cities like Lanzhou, Yinchuan, Kunming, Lhasa, Turpan, Hami, and Jiuquan. Low-value areas were concentrated in the Central and Western regions. Coastal cities in the East, cities in the Northeast, directly-administered cities, provincial capitals, and large resource-based cities generally had higher levels of social development compared to other regions.
By 2010, the spatial layout of urban social development levels generally maintained the distribution pattern of 2000 but with notable spatial disparities. High-value areas were concentrated in coastal cities in the East and Northeastern regions, as well as provincial capitals, like Beijing, Tianjin, Dalian, Shanghai, Suzhou, Ningbo, Guangzhou, Haikou, Shenyang, Jinan, Taiyuan, Hefei, Changsha, Hohhot, Lanzhou, Chengdu, and Kunming. Low-value areas were concentrated in cities in the Central and Western regions, like Zhoukou, Zhumadian, Xinyang, Bijie, Liupanshui, and Bazhong.
By 2020, there was a significant overall improvement in the level of urban social development, with high-level areas expanding and spatial disparities notably narrowing. There was a relatively larger number of cities with higher levels of social development, concentrated in urban clusters like Liaozhongnan, Jing-Jin-Tang, Shandong Peninsula, Yangtze River Delta, Pearl River Delta, and Chengdu-Chongqing, and across the Taiwan Strait. Cities with lower levels of social development showed a decreasing trend, mainly distributed in southern Sichuan, southern Henan, and other cities.
3.2.2. Spatial Agglomeration Analysis
From 1990 to 2020, there was a significant spatial agglomeration characteristic in the levels of social development across China. The analysis of the spatial patterns of social development levels, followed by a further spatial autocorrelation analysis of urban social development levels (Table 2), reveals insightful findings. The global Moran’s I index analysis indicates that from 1990 to 2020, the global Moran’s I values were all positive, ranging between 0.386 and 0.451, and were statistically significant at the 1% level. This strongly suggests that the social development levels of Chinese cities exhibit significant spatial agglomeration. The trend in the global Moran’s I index over time shows an upward trend, indicating that the spatial positive correlation of social development levels among Chinese cities has been strengthening. This finding underscores the increasing tendency for cities with similar levels of social development to cluster together spatially.
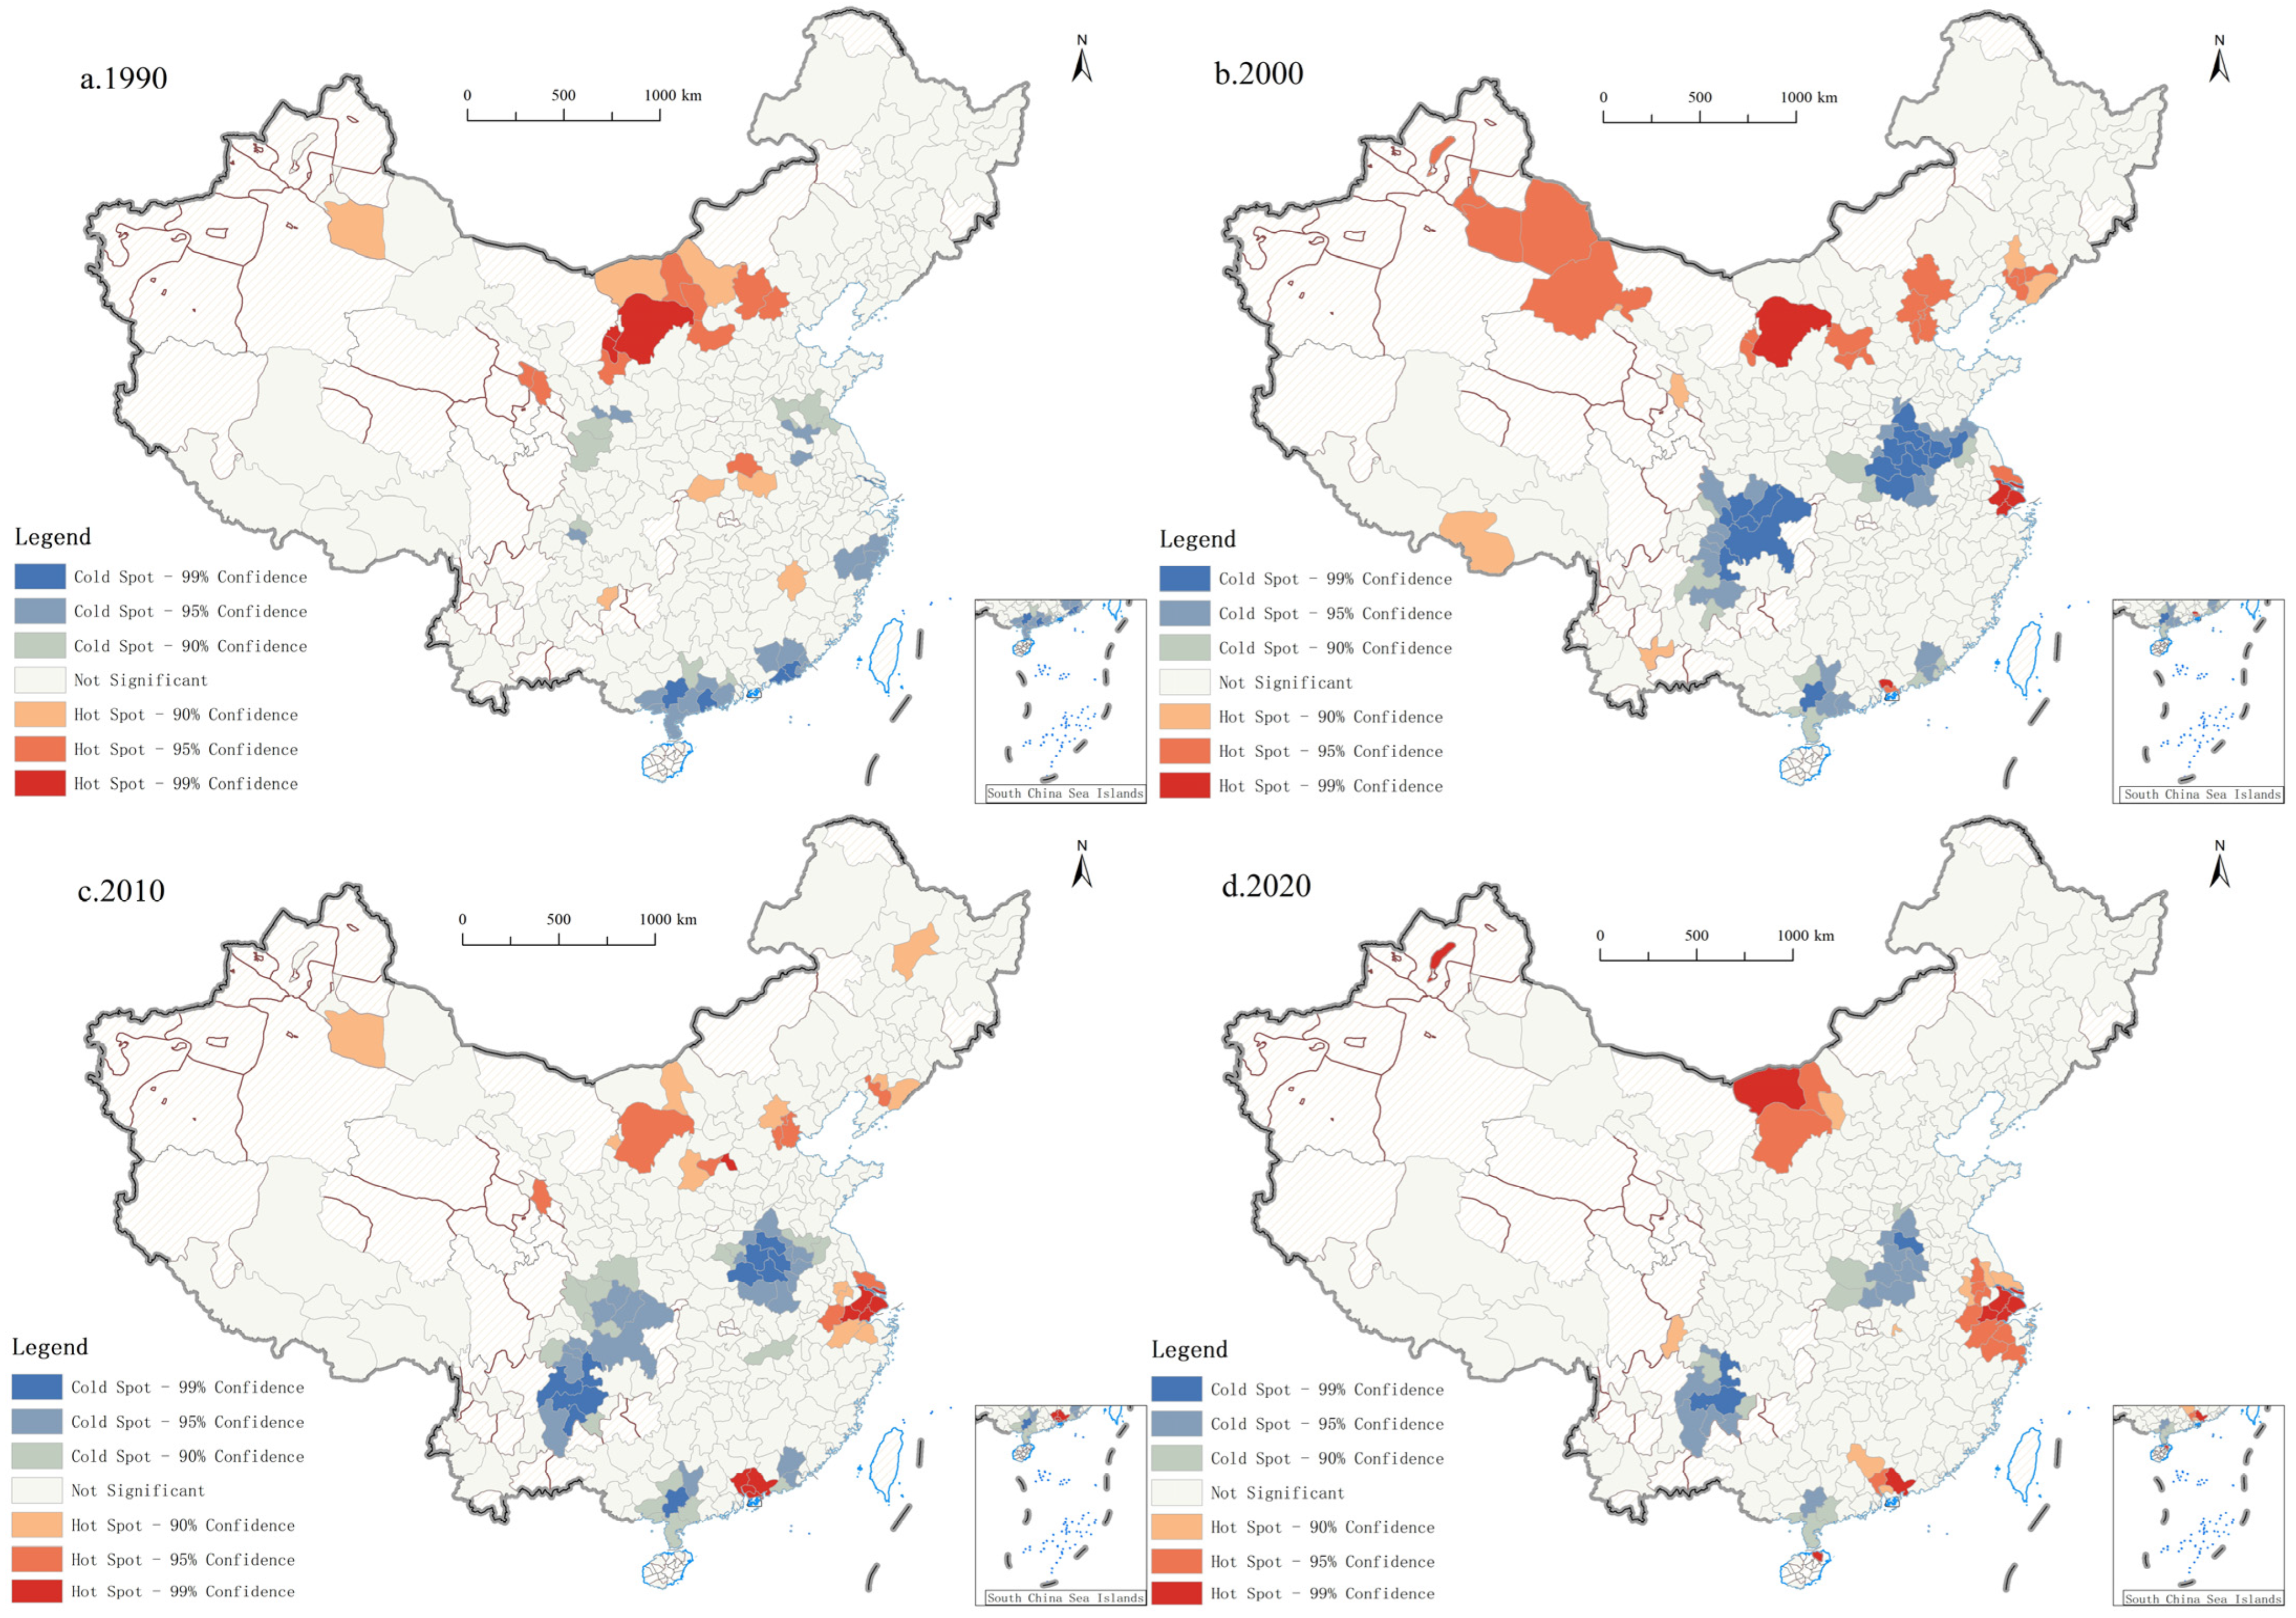
Further, using the Getis-Ord G* index to explore the local spatial autocorrelation of social development levels in each city domain (Figure 4) helps identify high and low value clustering areas of social development levels nationwide. The results of the study show that in 1990, the hotspots with high levels of social development in China were mainly located in Inner Mongolia, western Xinjiang, western Qinghai, and in central regions. Low-value areas were mainly in the eastern and southern coastal regions. In 2000, the high value areas were mainly in western Xinjiang, Inner Mongolia, Beijing-Tianjin-Hebei region, eastern coastal regions, and the Yangtze River Delta region. Low-value areas were mainly in the Central Plains, the middle and lower reaches of the Yangtze River, and the Southwest. Overall, the spatial concentration pattern of China’s urban social development level shows a relatively stable spatial correlation, with cities maintaining a relatively concentrated geospatial distribution.
3.2.3. Regional Difference Analysis
Further, this paper incorporates the coefficient of variation and the Dagum Gini coefficient to measure the spatial disparities in urban social development levels across China, reflecting the degree of imbalance within and between the four major regions as previously delineated (Table 3). Overall, the coefficient of variation in China’s social development levels exhibits a pattern of increase, followed by a decrease, indicating that the overall disparities in social development levels first widened and then narrowed. The Gini coefficient shows a fluctuating downward trend, decreasing from 0.101 in 1990 to 0.076 in 2020, with a reduction of 0.025. The total disparity only fluctuated slightly upwards between 1990 and 2000, suggesting that while the level of social development in China was rising, the overall disparity in social development levels trended downwards, and the overall imbalance in social development levels diminished.
Looking at the gaps within regions, the disparities in social development levels within the Eastern, Central, Western, and Northeastern regions follow a consistent trend with their overall disparity, all showing a fluctuating decrease. From 2000 to 2020, the Gini coefficient in the Eastern region dropped from 0.109 to 0.086, in the Central region from 0.092 to 0.056, in the Western region from 0.108 to 0.077, and in the Northeastern region from 0.058 to 0.049. In terms of the level of internal disparities, the Central region had the largest gap in urban social development levels during the study period, followed by the Western and Eastern regions, with the Northeastern region having the smallest gap.
Regarding the contribution to the gap, the contribution rate of intra-regional disparities remained relatively stable, accounting for nearly one-third of the total contribution. This indicates that within regions, the social development levels of different areas have been relatively stable. Notably, the contribution rate of inter-regional disparities significantly increased in 2010, from 17.98% to 31.90%, and then slightly decreased to 30.27% in 2020. This suggests that the disparities in social development levels between different regions peaked in 2010 and then eased slightly. As for the contribution rate of hypervariability density, it decreased from 56.11% in 1990 to 43.00% in 2020, indicating that over time, the contribution of hypervariability density to the overall Gini coefficient decreased, which may imply a gradual reduction in the disparities in social development levels between different regions. The average contribution rates of intraregional, interregional, and hypervariable density are 27.03%, 24.13%, and 48.84%, respectively. This indicates that hypervariable density is the main source of disparities in China’s level of social development, with interregional disparities having the lowest contribution rate; the impact of hypervariable density has been at the highest level, followed by intraregional disparities, with interregional disparities having the lowest impact.
3.2.4. Evolution of Distribution Patterns
In order to further explore the evolution of the spatial pattern of China’s social development level, this paper analyzes the evolution of its spatial distribution pattern with the help of the standard deviation ellipse method, as shown in Figure 5 and Table 4. The elliptical centre of gravity shifts in longitude from 112.06° E in 1990 to 113.95° E in 2020 and in latitude from 33.18° N in 1990 to 33.35° N in 2020.This indicates that the spatial distribution of the social development level of Chinese cities shows an obvious eastward trend from 1990 to 2000, with a southeast-northeast direction from 2000 to 2020. The ellipse area rises from 3,376,400 km2 in 1990 to 3,411,900 km2 in 2000 and then falls to 3,316,600 km2 in 2020, indicating that the spatial agglomeration of China’s social development level becomes more obvious after 2000. The angle of rotation decreases from 65.75° in 1990 to 55.99° in 2020, indicating that the distribution pattern of the level of social development has shifted more centrally in an eastward direction over time.
4. Discussion and Conclusions
This study provides a comprehensive analysis of the spatio-temporal evolution characteristics of social development level of 296 Chinese cities using the entropy-weighted TOPSIS method, the Dagum Gini coefficient decomposition method and, the exploratory spatial data analysis method and the standard deviation ellipse method. The findings are summarized as follows:
- (1)
- National-Level Temporal Evolution: The overall social development level in China has experienced a fluctuating upward trend, with three distinct phases: a slow decline from 1990 to 2000, steady development from 2000 to 2010, and rapid development from 2010 to 2020. The national comprehensive index of social development level grew by 21.24% over the three-decade period, indicating a significant improvement in social indicators.
- (2)
- Regional Temporal Evolution: The study reveals a clear hierarchy in social development levels across China’s four major regions, with the Eastern Region consistently leading in growth, followed by the Northeastern, Western, and Central Regions. The Eastern Region’s rapid growth can be attributed to its early adoption of economic reforms and opening-up policies, which fostered industrial upgrading and urbanization. The Central and Western Regions have shown slower but steady growth, benefiting from local policy and industrial structure optimization. The Northeastern Region, historically reliant on heavy industries, has faced challenges in transitioning its economic base, leading to relatively slower improvements in social development.
- (3)
- From the viewpoint of spatial distribution pattern, the overall level of China’s social development has been rising, and spatial distribution is now showing a pattern from the patchy distribution in 1990 to the clustered distribution of urban agglomerations in 2020, with obvious spatial imbalance characteristics. The spatial differences in the level of social development of the cities in 1990 were obvious, and spatial imbalance characteristics were the most prominent, with the majority of the cities with a higher level of social development located in areas of higher levels of economic development, resource-rich and geographically favorable regions. By 2020, the social development level of cities as a whole will be significantly improved, and high-level areas will show an expansion trend, showing a significant trend of “eastward movement”, concentrating in the city clusters of Liao-Zhong-South, Beijing-Tianjin-Tangshan, the Shandong Peninsula, the Yangtze River Delta, the Pearl River Delta, Chengdu-Chongqing, and cities across the Taiwan Strait, and so on.
- (4)
- Spatial Evolution: The spatial distribution of social development levels has evolved from a patchy pattern in 1990 to a more clustered distribution around urban agglomeration by 2020. This shift indicates a growing spatial agglomeration, with cities exhibiting similar social development levels increasingly clustering together. The global Moran’s I index analysis confirms this trend, showing a strengthening spatial positive correlation over time. The reduction in the number of low-value areas and the expansion of high-value areas suggest a narrowing gap in social development levels among cities. High-value agglomeration areas of social development levels transitioned from being concentrated in the Northeast region and the Hohhot-Baotou-Ordos-Yulin urban cluster in 1990 to an eastward shift by 2000, with the coastal areas of the East gradually forming high-value clusters. From 2010 to 2020, this pattern became more stable.
- (5)
- Regional Disparities: The result of the coefficient of variation and the Dagum Gini coefficient indicate that while the overall disparities in social development levels initially widened, they later narrowed, with the Gini coefficient decreasing from 0.101 in 1990 to 0.076 in 2020. The contribution rate of intra-regional disparities remained relatively stable, accounting for nearly one-third of the total contribution, suggesting stability within regions. However, the contribution rate of inter-regional disparities peaked in 2010 before slightly decreasing, indicating a temporary increase in regional disparities. The hypervariability density’s contribution to the overall Gini coefficient decreased over time, suggesting a gradual reduction in disparities between regions. The disparities in social development levels within the Eastern, Central, Western, and Northeastern regions exhibited a consistent trend with the overall disparity, all displaying a fluctuating yet decreasing pattern. In terms of intra-regional gaps, the order was Central Region > Western Region > Eastern Region > Northeastern Region.
The results of the centre of gravity-standard ellipse difference analysis show that the spatial distribution of the social development level of Chinese cities in the period from 1990 to 2000 showed an obvious eastward trend, and from 2000 to 2020, it showed a south-east to north-east direction. Moreover, with the passage of time, the spatial agglomeration of China’s social development level becomes more obvious, and the distribution pattern tends to be more stable. Based on the above conclusions, the following insights are obtained:
By conducting an in-depth analysis of the spatio-temporal evolution characteristics of social development in China from 1990 to 2020, this study not only enriches and improves the assessment system of social development indicators but also reveals the interactions and comprehensive impacts of multidimensional factors, such as education, healthcare, and culture, in the process of social development. It offers a comprehensive perspective to understand the changing trends and spatial distribution characteristics of urban social development levels in China. Employing various analytical methods, the research not only showcases the disparities in social development levels across different cities and regions but also reveals how these disparities have evolved over time, providing new insights into the complexity of social development in China. Based on the empirical findings and the related literature, we offer the following insights. Traditionally, the perspectives of measurement studies on Chinese cities have mostly focused on the economic and ecological domains, neglecting the comprehensive measurement of the social dimension. We find that during the past three decades, the comprehensive level of China’s social development has been increasing as a whole, the spatial distribution shows obvious aggregation characteristics, the distribution pattern shows an eastward trend, and the regional differences show a trend of narrowing. This is generally consistent with the findings of existing studies [32]. It shows that the country, in the pursuit of economic growth, at the same time focuses on the improvement in social welfare [26], the social causes of change complement each other, co-development, and mutual promotion of a good social situation. However, with regard to the level of social development, despite the overall trend of improvement, spatial differences are still obvious, and inequality in economic and social development is still prominent. The Eastern region still leads, and the development gap between the Central and Western regions and the Northeastern region is still relatively significant. Therefore, future development strategies should continue to promote the development of the Central, Western, and Northeastern regions, strengthen infrastructure construction, enhance education and healthcare levels, and achieve more balanced regional development. Moreover, the existence of cities with lower social development levels indicates that some areas have not fully realized the improvement in social welfare amid economic growth. These areas should receive strengthened policy support, focusing on addressing fundamental issues such as poverty, education and healthcare, culture, and social security, to ensure that all regions can share the benefits of economic growth, guiding society towards a more equitable, harmonious, and sustainable direction. The research results have practical significance for deepening the understanding of China’s regional development imbalance and promoting balanced regional socio-economic development. They provide important guidance for the government to formulate and implement policies on regional development, social security, and public services, helping the government more effectively address issues in social development and promote balanced societal development and progress.
5. Future Outlook and Deficiencies
Despite the preliminary exploration of the spatio-temporal evolution characteristics of social development in China from 1990 to 2020, there are certain limitations. Firstly, despite covering factors such as education, healthcare, culture, and social security, the quality and completeness of the data relied upon may impact the research results. Secondly, although various methods were employed to analyze the spatio-temporal disparities in social development levels, each method has its assumptions and limitations, possibly not capturing all dimensions of social development fully. Lastly, the research primarily focuses on quantitative analysis, with less discussion on the specific causes and mechanisms behind the disparities in social development levels. Future research could expand in several areas, for example, by incorporating more dimensions of social development indicators to more comprehensively understand the diversity and complexity of social development, thereby potentially enhancing the reliability of research results. The specific factors and mechanisms affecting spatial disparities in social development levels, such as policy factors, economic structural changes, and technological advancements, should be further investigated. Moreover, ensuring the equitable distribution of social welfare and improving social development levels, while achieving high-speed economic growth and promoting balanced social and economic development, are important directions for future research. Lastly, future studies could explore more methods and models to enhance the precision and depth of analysis, thereby providing a scientific basis for formulating more effective social development strategies.
Author Contributions
Conceptualization, J.F. and C.L.; methodology, Y.L.; software, Y.L.; validation, Y.L.; formal analysis, J.F., C.L. and Y.L.; investigation, Y.L.; resources, Y.L.; data curation, Y.L.; writing—original draft preparation, Y.L. and C.L.; writing—review and editing, J.F., C.L. and Y.L.; visualization, Y.L.; supervision, C.L.; project administration, J.F.; funding acquisition, J.F. All authors have read and agreed to the published version of the manuscript.
Funding
This research was funded by the National Natural Science Foundation of China (No. 42230510).
Data Availability Statement
The original contributions presented in the study are included in the article, further inquiries can be directed to the corresponding author.
Conflicts of Interest
The authors declare no conflicts of interest.
References
- Fan, J.; Wang, Y.F. Pattern Evolution of China’s Economic Geography in the Past 40 Years and Regional Coordinated Development in the New Era. Econ. Geogr. 2019, 39, 1–7. [Google Scholar] [CrossRef]
- People’s Happiness Index Research Report: China’s Overall National Happiness Index Continues To Improve. Tsinghua University. Available online: https://www.tsinghua.edu.cn/info/1182/90946.htm (accessed on 6 March 2024).
- Behera, D.K.; Rahut, D.B.; Padmaja, M.; Dash, A.K. Socioeconomic Determinants of Happiness: Empirical Evidence from Developed and Developing Countries. J. Behav. Exp. Econ. 2024, 109, 102187. [Google Scholar] [CrossRef]
- Dempsey, N.; Bramley, G.; Power, S.; Brown, C. The Social Dimension of Sustainable Development: Defining Urban Social Sustainability. Sustain. Dev. 2011, 19, 289–300. [Google Scholar] [CrossRef]
- Wang, S.; Lu, Y. Regional difference and determinants of human well-being in China: Based on the analysis of human development index. Prog. Geogr. 2018, 37, 1150–1158. [Google Scholar] [CrossRef]
- Wang, H.P.; Chen, F. Concept Definition and Connotation Interpretation about Regional Social Development Quality: Based on the Related Concepts Discrimination and Theory Analysis. J. Nanchang Univ. 2012, 43, 78–83. [Google Scholar]
- Wang, S.Y.; Zhai, C.Y. The Evolution of Spatial Difference and the Elements Analysis of Human Development Index in the World. Econ. Geogr. 2018, 38, 34–42. [Google Scholar] [CrossRef]
- Rasnaca, L.; Bela, B. Social Dimension of the Measurement for Regional Development. Res. Rural. Dev. 2020, 2, 133–138. [Google Scholar]
- Social Indicators of Well-Being: Americans’ Perceptions of Life Quality|Semantic Scholar. Available online: https://www.semanticscholar.org/paper/Social-Indicators-of-Well-Being%3A-Americans%27-of-Life-Andrews-Withey/145c9aa78a04ff3308b388a93dae9a93b6ea4709 (accessed on 6 March 2024).
- Barrington-Leigh, C.; Galbraith, E. Feasible Future Global Scenarios for Human Life Evaluations. Nat. Commun. 2019, 10, 161. [Google Scholar] [CrossRef] [PubMed]
- Klugman, J.; Rodríguez, F.; Choi, H.-J. The HDI 2010: New Controversies, Old Critiques. J. Econ. Inequal. 2011, 9, 249–288. [Google Scholar] [CrossRef]
- Choi, Y.-C.; Jang, J.-H. Relationships Among Social Policy Factors, National Competitiveness, and Happiness. Appl. Res. Qual. Life 2016, 11, 1189–1205. [Google Scholar] [CrossRef]
- Helliwell, J.F.; Layard, R.; Sachs, J.D. World Happiness Report 2013. Available online: https://worldhappiness.report/ed/2013/ (accessed on 6 March 2024).
- Stevenson, N. The Contribution of Community Events to Social Sustainability in Local Neighbourhoods. J. Sustain. Tour. 2021, 29, 1776–1791. [Google Scholar] [CrossRef]
- Zhu, Q.F. The Establishment and Application of Social Development Indicator System. China Popul.·Resour. Environ. 1995, 57–60. Available online: https://kns.cnki.net/KCMS/detail/detail.aspx?dbcode=CJFD&filename=ZGRZ199502011 (accessed on 6 March 2024).
- Transportation Disadvantage and Neighborhood Sociodemographics: A Composite Indicator Approach to Examining Social Inequalities|Social Indicators Research. Available online: https://link.springer.com/article/10.1007/s11205-017-1616-2 (accessed on 6 March 2024).
- Sustainability|Free Full-Text|Additional Indicators to Promote Social Sustainability within Government Programs: Equity and Efficiency. Available online: https://www.mdpi.com/2071-1050/7/7/9251 (accessed on 6 March 2024).
- An Assessment of Regional Sustainable Development: Progress and Perspectives|Semantic Scholar. Available online: https://www.semanticscholar.org/paper/An-Assessment-of-Regional-Sustainable-Development%3A-Li/ecb8a0bc216f75fccb9e1a74bd4e4fe8b573a39b (accessed on 6 March 2024).
- Zhang, Y.; Wei, H.K. U-turn and stability analysis of China’s coordinated regional development. Jianghai Acad. J. (Bimon.) 2012, 2, 78–85+238. [Google Scholar]
- Deng, X.Z.; Liang, L.; Wu, F.; Wang, Z.B.; He, S.J. Chinese balanced regional development strategy from the perspective of development geography. Acta Geogr. Sin. 2021, 76, 261–276. [Google Scholar]
- Wang, S.Y.; Sheng, Y.F. Advances in the Researches on Well-being Geography. Prog. Geogr. 2010, 29, 899–905. [Google Scholar]
- Luo, D.; Liang, L.W.; Wang, Z.B.; Chen, L.K.; Zhang, F.M. Exploration of Coupling Effects in the Economy–Society–Environment System in Urban Areas: Case Study of the Yangtze River Delta Urban Agglomeration. Ecol. Indic. 2021, 128, 107858. [Google Scholar] [CrossRef]
- Ge, Y.; Hu, S.; Song, Y.; Zheng, H.; Liu, Y.; Ye, X.; Ma, T.; Liu, M.; Zhou, C. Sustainable Poverty Reduction Models for the Coordinated Development of the Social Economy and Environment in China. Sci. Bull. 2023, 68, 2236–2246. [Google Scholar] [CrossRef] [PubMed]
- Li, W.; Yi, P. Assessment of City Sustainability—Coupling Coordinated Development among Economy, Society and Environment. J. Clean. Prod. 2020, 256, 120453. [Google Scholar] [CrossRef]
- Kou, Y.; Chen, S.; Zhou, K.; Qiu, Z.; He, J.; Shi, X.; Zhou, X.; Zhang, Q. Spatiotemporal Patterns and Coupling Coordination Analysis of Multiscale Social–Economic–Ecological Effects in Ecologically Vulnerable Areas Based on Multi-Source Data: A Case Study of the Tuha Region, Xinjiang Province. Land 2024, 13, 282. [Google Scholar] [CrossRef]
- Li, Q.; Zhao, Y.; Li, S.; Zhang, L. Spatial-Temporal Characteristics of the Coupling Coordination of Social Security and Economic Development in China during 2002–2018. Reg. Sustain. 2021, 2, 116–129. [Google Scholar] [CrossRef]
- Wang, C.; Wang, X.; Wang, Y.; Zhan, J.; Chu, X.; Teng, Y.; Liu, W.; Wang, H. Spatio-Temporal Analysis of Human Wellbeing and Its Coupling Relationship with Ecosystem Services in Shandong Province, China. J. Geogr. Sci. 2023, 33, 392–412. [Google Scholar] [CrossRef]
- Lin, B.; Zhou, Y. Measuring the Green Economic Growth in China: Influencing Factors and Policy Perspectives. Energy 2022, 241, 122518. [Google Scholar] [CrossRef]
- Dagum, C. A New Approach to the Decomposition of the Gini Income Inequality Ratio. Empir. Econ. 1997, 22, 515–531. [Google Scholar] [CrossRef]
- Yuan, X.; Chen, B.; He, X.; Zhang, G.; Zhou, C. Spatial Differentiation and Influencing Factors of Tertiary Industry in the Pearl River Delta Urban Agglomeration. Land 2024, 13, 172. [Google Scholar] [CrossRef]
- Anselin, L.; Sridharan, S.; Gholston, S. Using Exploratory Spatial Data Analysis to Leverage Social Indicator Databases: The Discovery of Interesting Patterns. Soc. Indic. Res. 2007, 82, 287–309. [Google Scholar] [CrossRef]
- Liu, W.; Liu, Z.; Wang, L.; Liu, H.; Wang, Y. Regional Social Development Gap and Regional Coordinated Development Based on Mixed-Methods Research: Evidence from China. Front. Psychol. 2022, 13, 927011. [Google Scholar] [CrossRef]
Figure 1.
Changes in the comprehensive index of social development levels in China from 1990 to 2020.
Figure 1.
Changes in the comprehensive index of social development levels in China from 1990 to 2020.

Figure 2.
Changes in the comprehensive index of social development levels in the four major regions from 1990 to 2020.
Figure 2.
Changes in the comprehensive index of social development levels in the four major regions from 1990 to 2020.

Figure 3.
Spatial changes in the comprehensive index of social development levels in China, 1990–2020.
Figure 3.
Spatial changes in the comprehensive index of social development levels in China, 1990–2020.

Figure 4.
The distribution patterns of cold and hot spots of social development levels in China, 1990–2020.
Figure 4.
The distribution patterns of cold and hot spots of social development levels in China, 1990–2020.

Figure 5.
Standard deviation ellipse of China’s social development level and its center of gravity evolution from 1990 to 2020.
Figure 5.
Standard deviation ellipse of China’s social development level and its center of gravity evolution from 1990 to 2020.


Table 1.
Comprehensive evaluation indicator system for the social development system in China.
| System Level | Standardized Level | Specific Indicators (Units) | Causality | Weight |
|---|---|---|---|---|
| Social development system | Education | General primary and secondary student teacher ratio (%) | Negative | 0.069 |
| Medical | Number of books in public libraries per 100 population (volumes) | Positive | 0.701 | |
| Culture | Number of practicing (assistant) physicians per 10,000 population (number) | Positive | 0.198 | |
| Social security | Urban registered unemployment rate (%) | Negative | 0.032 |
Note: Calculations are retained to 3 decimal places.
Table 2.
Moran’s I index results.
| Year | Moran’ I | Z-Score | p-Value |
|---|---|---|---|
| 1990 | 0.386296 | 11.474121 | 0.000000 |
| 2000 | 0.377674 | 11.222091 | 0.000000 |
| 2010 | 0.433759 | 12.879849 | 0.000000 |
| 2020 | 0.451027 | 13.389274 | 0.000000 |
Table 3.
Dagum Gini coefficient of social development levels in China.
| Year | Overall | Within Regions | Contribution Rate (%) | |||||
|---|---|---|---|---|---|---|---|---|
| Eastern | Central | Western | Northeastern | Within Regions | Between Regions | Hypervariable Density | ||
| 1990 | 0.101 | 0.109 | 0.092 | 0.108 | 0.058 | 27.52 | 16.36 | 56.11 |
| 2000 | 0.102 | 0.108 | 0.085 | 0.116 | 0.050 | 27.38 | 17.98 | 54.64 |
| 2010 | 0.097 | 0.115 | 0.079 | 0.091 | 0.058 | 26.50 | 31.90 | 41.59 |
| 2020 | 0.076 | 0.086 | 0.056 | 0.077 | 0.049 | 26.73 | 30.27 | 43.00 |
Table 4.
Standard deviation ellipse of China’s social development level and its centre of gravity parameter from 1990 to 2020.
Table 4.
Standard deviation ellipse of China’s social development level and its centre of gravity parameter from 1990 to 2020.
| Year | Central Longitudes (°E) | Central Latitudes (°N) | Length of the x-Axis (km) | Length of the y-Axis (km) | Azimuth (°) | Area (million km2) |
|---|---|---|---|---|---|---|
| 1990 | 112.06 | 33.18 | 12.47 | 8.62 | 65.17 | 337.64 |
| 2000 | 113.52 | 33.18 | 12.48 | 8.71 | 62.40 | 341.19 |
| 2010 | 113.57 | 32.94 | 11.89 | 8.98 | 58.48 | 335.10 |
| 2020 | 113.95 | 33.35 | 12.45 | 8.48 | 55.99 | 331.60 |
Disclaimer/Publisher’s Note: The statements, opinions and data contained in all publications are solely those of the individual author(s) and contributor(s) and not of MDPI and/or the editor(s). MDPI and/or the editor(s) disclaim responsibility for any injury to people or property resulting from any ideas, methods, instructions or products referred to in the content. |
© 2024 by the authors. Licensee MDPI, Basel, Switzerland. This article is an open access article distributed under the terms and conditions of the Creative Commons Attribution (CC BY) license (https://creativecommons.org/licenses/by/4.0/).
Share and Cite
MDPI and ACS Style
Lian, Y.; Fan, J.; Lu, C. A Study on the Spatio-Temporal Evolution Characteristics of Social Development Levels in China. Land 2024, 13, 565. https://doi.org/10.3390/land13050565
AMA Style
Lian Y, Fan J, Lu C. A Study on the Spatio-Temporal Evolution Characteristics of Social Development Levels in China. Land. 2024; 13(5):565. https://doi.org/10.3390/land13050565
Chicago/Turabian StyleLian, Yanan, Jie Fan, and Chen Lu. 2024. "A Study on the Spatio-Temporal Evolution Characteristics of Social Development Levels in China" Land 13, no. 5: 565. https://doi.org/10.3390/land13050565
Note that from the first issue of 2016, this journal uses article numbers instead of page numbers. See further details here.