Article

Land Cover Dynamics in the Northwestern Virunga Landscape: An Analysis of the Past Two Decades in a Dynamic Economic and Security Context

by
Charles Mumbere Musavandalo
1,2,*,
Kouagou Raoul Sambieni
1,
Jean-Pierre Mate Mweru
1,
Jean-François Bastin
2,
Chantale Shalukoma Ndukura
3,
Timothée Besisa Nguba
1,2,
Julien Bwazani Balandi
1,2 and
Jan Bogaert
1,2,*
1
Ecole Régionale Post-Universitaire d’Aménagement et Gestion Intégrés des Forêts et Territoires Tropicaux (ERAIFT), Kinshasa P.O. Box 15.373, Democratic Republic of the Congo
2
Biodibersité, Ecosystème et Paysage, Gembloux Agro-Bio Tech, Université de Liège, 5030 Gembloux, Belgium
3
Institut Congolais de Conservation de la Nature (ICCN), Kinshasa, Democratic Republic of the Congo
*
Authors to whom correspondence should be addressed.
Land 2024, 13(5), 566; https://doi.org/10.3390/land13050566
Submission received: 5 March 2024 / Revised: 1 April 2024 / Accepted: 10 April 2024 / Published: 23 April 2024
(This article belongs to the Section Landscape Ecology)

Abstract

:
The Beni region in the eastern Democratic Republic of Congo is grappling with socioeconomic development and security challenges that have affected its natural ecosystems, especially those located in the northern Virunga National Park. This study aims to document the anthropization of the northwestern Virunga landscape from 1995 to 2021 in the context of insecurity. Using a cartographic approach and ecological-landscape-analysis tools, this study delves into the overall landscape changes through a comparative analysis of protected and unprotected areas. These investigations focus on landscape composition, transitions between land-cover classes, and the spatial transformation process. The northwestern Virunga landscape is undergoing significant land cover changes due to the influence of insecurity on socioeconomic activities, primarily agriculture. Agricultural land encompasses a larger area than other land-cover types. However, its expansion has decelerated since the 2000s. The loss of forested area is discontinuous. During relatively stable periods (1995–2005), forests exhibited a reduction of up to 2.90% in area, while in the period of the return of Iturian refugees to their province, followed by terrorist insecurity in Beni (2005–2021), the forested area increased by 2.07%. Savannah areas, which are mainly located in the graben rift valley and near Butembo, have been more heavily affected by human activity than forests. Ultimately, the apparent stability of the landscape can be attributed to its protected areas, especially Virunga National Park.

1. Introduction

The stability of protected areas is important for maintaining ecosystem services and ensuring a high rate of biodiversity conservation. Today, the ecological processes of forest ecosystems and their biological communities in protected areas experience changes in land cover due to anthropogenic pressure. These anthropogenic changes lead to the conversion, fragmentation, and degradation of natural habitats [1,2].
The protected area network of the Democratic Republic of Congo is an important tool for conserving biodiversity and preserving natural ecosystems. This network covers 13% of the national territory [3]. However, nearly a century after the establishment of the country’s first protected area, Virunga National Park, the context for nature conservation has evolved a great deal. Despite the Congolese government’s sustainable conservation efforts and support from several technical and financial partners, many protected areas face increasing anthropization [4]. Although these anthropogenic pressures are complex and difficult to reduce to a few variables, they are generally attributed to the expansion of agricultural activities and the search for energy in the form of wood, exacerbated by demographic growth and decades of insecurity [3]. According to [5], the gross loss of forests in Congolese protected areas is a key parameter for assessing the effectiveness of protected-area management. However, it varies among protected areas according to their conservation status and the landscape in which they are located.
Virunga National Park, created in 1925, is one of these protected areas and a world heritage site. It is famous for its outstanding biodiversity of plants and animals, as well as the range of habitats it encompasses, including tropical rainforests, mountain forests, savannah, volcanic mountains, and lakes, making Virunga National Park a beacon of conservation. However, demographic growth and insecurity in North Kivu over the last three decades have been ecologically affecting both Virunga National Park and its surroundings [6,7].
The northwestern Virunga landscape, while crucial for biodiversity conservation, has rarely been scientifically studied. This landscape plays a significant stabilizing role through its tropical forest, which also ensures the flow of several rivers that are crucial for the hydrological regime of the Nile River. Unfortunately, over the last three decades, the northwestern Virunga landscape has faced rapid economic development in cities such as Beni and Butembo, based mainly on the exploitation of forest resources. Since 2010, this landscape has also been afflicted by the violent activities of terrorist groups and military operations [7]. Developing a rational policy to reduce pressure on natural habitats and restore degraded areas within and around this protected area requires an understanding and quantitative assessment of land-cover-change processes at the landscape scale [8].
The development of remote sensing has facilitated the monitoring of land use at the local, national, and global scales. Remote sensing is used to monitor various types of land cover and use, including forest, savannah, wetland, agricultural areas, and urbanized regions [9,10,11]. Particularly in the context of armed conflict, when data are often scarce, remote sensing is a powerful tool for monitoring land cover and land use, enabling the anticipation of post-conflict management strategies [12,13]. While various spatial products for land use and land cover change are available on a global scale, some are being debated for use in the conservation of biodiversity and protected area management [14,15].
This study analyzes the anthropization of the northwestern Virunga landscape in the context of insecurity. It focuses on the composition and configuration of the northwestern Virunga landscape over the last two decades. Two hypotheses were formulated to achieve the study objective. The first hypothesis is that the anthropization of natural forest ecosystems in the northwestern Virunga landscape increases during periods of insecurity compared to stable periods. This manifests as high fragmentation, low stability, and an high loss of forest and savannah areas during insecure periods. The second hypothesis is that Virunga National Park is less disturbed than its peripheral areas regardless of a period’s stability or insecurity.

2. Materials and Methods

2.1. Study Area

To conduct this study, an area of 6285.11 km2 was isolated from the Virunga landscape, mainly in Beni territory in North Kivu province (Figure 1). This area is geographically part of the “Butembo region”, as defined by [16], located between 0°9′ S and 0°54′ N latitude and 28°57′ and 30°9′ E longitude. Referring to the global Landsat data notation system, the northwestern Virunga landscape is located at position 173 and 060 for the “path” and “row”, respectively. This zone is defined based on the population and Virunga National Park interactions.
The study area is covered by several types of natural forest ecosystems, including typical Central African rainforest, as well as shrubby and grassy savannah. It experiences a humid tropical climate of the Af type according to the Köppen classification, tempered sometimes by the mountains. The study area is characterized by abundant rainfall throughout the year, with a slight decrease between January and March, as well as between June and August. Rainfall in the region varies from 1200 to 2000 mm, with an estimated average of 1600 mm. The temperature ranges from 20 to 30 °C, with an average of 25 °C. The population is estimated at over 2 million and is concentrated mainly in Butembo and Beni cities and the rural communes of Oïcha, Kasindi, and Mangina [7].

2.2. Remote Sensing Data Acquisition

The satellite images used in this study were acquired from a multispectral satellite collection including Landsat 5 Thematic Mapper™, Landsat 7 Enhanced Thematic Mapper (ETM), and Landsat 8 Operational Land Imager (OLI). These Landsat data correspond to the observation periods (1995, 2001, 2005, 2010, 2015, and 2021) and indicate the presence of several types of natural forest ecosystems, including the typical Central African rainforest. The years before 2010 are characterized by relatively more stable security. These images were acquired during the period of low rainfall, between January and March, in order to maintain the uniformity of the vegetation’s spectral responses. Landsat data were filtered using two parameters: availability and cloud cover ≤10% [5]. The selected dates include periods of significant instability (from 2010 to 2021) and periods of apparent peace (between 1995 and 2010). As mentioned by [17], although the African continent often faces challenges regarding the availability of quality images, most images with low cloud cover are acquired between December and April. Furthermore, we estimate that the effect of seasonality is limited because of the low climatic fluctuation in the study area [7]. For each observation period, a composite image was produced by using the median pixel value of cloud-free images acquired during the low rainfall. Each composite image was then projected into the WGS/UTM 35n system [5].

2.3. Spatial Data Processing

Image processing was first conducted on the Google Earth Engine platform, then completed on ArcGIS 10.5. The Google Earth Engine serves as a platform that connects researchers to powerful computational resources, facilitating the virtual and efficient processing of spatial data for research [18]. It is a web-based integrated development code editor that enables users to analyze large-scale spatial data [19]. The primary processing operations included radiometric correction, false color composition, supervised classification, and the assessment of classification accuracy.
  • Supervised classification
Supervised classification was employed to achieve a detailed assessment of land cover and land use. We defined five dominant land-cover classes according to the study objectives. These classes comprised forest and savannah, or natural vegetation areas; field and fallow, bare and built-up land, describing the human footprint on the landscape; and, finally, water, encompassing all bodies of water (Table 1). A total of 1252 training points covering all types of land use were collected on the ground using a Garmin 64 GPS between June and September 2022 and through the visual interpretation of Landsat images supported by our field knowledge. This included 271 points for forested land, 536 points for field and fallow land, 165 points for savannah, 250 points for built-up and bare land, and 30 points for water, using Lake Edward and the Semuliki River as reference points for water. The high number of points in the field and fallow class is explained by the diversity of crops. The random forest classification algorithm was chosen for its robustness and high classification accuracy compared to other classification methods, such as maximum likelihood [20]. Random forest classification operates through multiple decision trees during classification training to offer a final result based on several decision trees [10]. Google Earth’s high-resolution images are considered suitable as reference data [15,16]. Only areas with unchanged spatial composition throughout the observation period were selected for training. The subsequent processing in ArcGIS 10.5 involved vectorization and the calculation of the surface areas of the various land-use classes.
  • Accuracy assessment
A total of 393 points were used to test the accuracy of the maps produced. Different confusion matrices were produced for each map (Appendix A). Accuracy was assessed using conventional indices, including error of omission (producer accuracy), error of commission (user accuracy), and overall accuracy [21,22,23]. These indices were calculated using Equations (1)–(3) of ref. [21] (Table 2).

2.4. Spatial Analysis

The analyses were conducted in terms of insecurity as the key parameter in land-cover change. The stable period spanned 1995 to 2010, while the period of insecurity covered 2010 to 2021. These timeframes coincided with increased activism by ADF-NALU (Allied Democratic Force) terrorist groups imported from Uganda and other armed factions. Both hypotheses were tested through landscape composition and configuration analysis. This classical approach is based on land-cover analysis, transitions between land-cover classes, land-cover stability, pattern processes, and annual rates of change. These analyses were initially conducted on the entire landscape, followed by separate analyses of protected and unprotected areas within the study landscape.
  • Composition assessment
Six land-cover maps corresponding to the six observation periods were generated. The transition matrix [21,24] was used to quantify changes in land cover and evaluate its stability. Five transition matrices were established for the periods of 1995–2001, 2001–2005, 2005–2010, 2010–2015, and 2015–2021. These matrices were utilized to verify our sub-postulate regarding the greater conversion of natural areas (forest and savannah) to anthropogenic areas than the reverse process in the analysis of later transition matrices. The land-cover stability index was calculated as the ratio between unchanged areas and those converted to other forms of land use between two observation periods. This index varied from 0 to ∞ with values approaching 0 when no areas of land cover remained unchanged over two periods and approaching ∞when the unchanged areas surpassed the sum of the transferred or received areas from other land-cover classes. Alongside the stability-index value, its evolution over time was emphasized. Annual land-cover change was computed using the following standardized equation [25]:
R = 1 T 1 T 2 ln ( S 2 S 1 )
where S1 and S2 represent the land-cover areas at times T1 and T2.
  • Structural dynamics
To elucidate the dynamics of the spatial structure, three indices were calculated: the number of patches (NP), the class area (CA), and the largest patches index (LPI) [26]. The following equation were used to determine the values of the LPI.
L P I = M a x ( a i j ) A i
where aij = area (km2) of the patch ij and Ai = total area land cover i.
The LPI tended toward 0 for highly fragmented classes and toward 1 for compact and non-fragmented classes. To identify the spatial transformation processes of the landscape, a decision tree from [27] was employed (Figure 2). This method relies on changes in the class area, perimeter, and the number of patches between two periods [18,26,27,28].
The ratio tos = A t 1 A t 2 was defined to evaluate the loss of surface area for a land-cover class. The obtained ratio was then compared with a theoretical threshold value (ts = 0.50) to differentiate fragmentation from other spatial landscape-transformation processes. Any transformation resulting in tos < 0.50 was considered a fragmentation, and other transformations were considered dissections. Our analysis is based on the theoretical proposition that anthropogenic classes are primarily characterized by the aggregation and creation of patches, while natural classes exhibit characteristics such as dissection, fragmentation, attrition, and shrinkage. These indices and analyses were conducted for the entire landscape and the protected and unprotected areas as distinct zones.

3. Results

3.1. Land-Cover Mapping of the Northwestern Virunga Landscape from 1995 to 2021

Six land-use maps were generated for the years 1995, 2001, 2005, 2010, 2015, and 2021 using the operational process described in Section 2.3. A visual analysis of these maps reveals that between 1995 and 2021, none of the land-cover classes remained virtually unchanged. The land-cover classes experienced regression and progression at different times; nevertheless, the spatial distribution of land cover suggests that the Virunga National Park is a significant reserve of forest and savannah. The extent of forest cover and savannah decreases with increasing distance from the park. Field and fallow land also covers more area in unprotected zones than in protected zones (Figure 3).

3.2. Composition, Stability, and Spatial Pattern Processes of the Northwestern Virunga Landscape

3.2.1. Composition and Stability

The results of the landscape-composition and transition analysis are presented in Table 3. Overall, from 1995 to 2021, this landscape has been largely characterized by two land-cover classes: field and fallow, and forest. These two land-cover classes alone encompass approximately 80% of the landscape. The other 20% is occupied by savannah, bare and built-up land, and water. Field and fallow areas constitute the landscape matrix, covering more than half of the area. Between 1995 and 2001, field and fallow area increased by 13%. Forested area decreased from 33.21% to 25.19% between 1995 and 2005, but then increased after 2005 to cover 29.81% of the total landscape area in 2021. Savannah decreased considerably during the observation period, declining from 24.18% in 1995 to 8.96% in 2021. Significant losses of savannah area were recorded between 1995 and 2001 and again between 2015 and 2021. In contrast, bare and built-up area increased significantly over time, rising from 0.82% in 1995 to 3.34% in 2021, representing a 307.31% increase.
Overall, the transition matrix indicates that the exchange of areas between natural and anthropogenic classes is higher than that between anthropogenic classes alone. Between 1995 and 2005, the conversion of forest to field and fallow area exceeded the conversion of field and fallow area to forest. However, after 2005, more field and fallow area was transformed into forest than forest to field and fallow area. In addition, there was a greater extent of transformation from savannah to field and fallow area than from field and fallow area into savannah.
Table 4 presents a stability index of land cover at the overall landscape level. These findings reveal that none of the five land-cover classes has remained stable over the last 26 years. However, the stability index values for the fields and fallow, forest, and water classes are greater than one. This indicates that, despite transitions between land-cover classes, more than half of the area occupied by these three land-cover classes has remained unchanged at the landscape scale between observation intervals. Conversely, the savannah and bare and built-up land classes have stability index values of less than one. Therefore, during each observation period, more than half of the total area of bare and built-up land and savannah transitioned to and from other land-cover classes.

3.2.2. Landscape Change Processes

Table 5 and Table 6 provide information on the spatial transformation of the landscape. Between 1995 and 2021, three land-cover classes, water, forest, and field and fallow, exhibited high LPI values compared with the two other classes, savannah and bare and built-up land. While the largest patches index values of field and fallow land and bare and built-up land increased over time, the forest LPI value decreased. The savannah LPI value varied significantly over time. The decrease in LPI values of the natural classes compared to the increase in those of the anthropogenic classes highlights the effect of human activity on the landscape. Overall, forest dissection was observed during the first 10 years, followed by forest aggregation between 2005 and 2010 and again between 2015 and 2021. A few forest patches were created between 2010 and 2015. Savannah dissection occurred between 2005 and 2010 and again between 2015 and 2021. Savannah aggregation was observed between 2001 and 2005 and again between 2010 and 2015. Savannah attrition was only observed before 2001. Bare and built-up land attrition was observed between 2005 and 2010, while bare and built-up areas increased between 1995 and 2005 and between 2010 and 2021. Field and fallow land underwent dissection three times and aggregation twice, indicating a pattern that is likely associated with agricultural itinerancy.

3.2.3. Annual Land-Cover Change Overall in the Northwestern Virunga Landscape between 1995 and 2021

Table 7 summarizes the annual rate of change in land cover within the studied landscape. From 1995 to 2005, forests exhibited a net annual loss of area, estimated at over 2%. Subsequently, there was an increase in forested area, ranging between 1.34 and 2.18%, which was observed after 2005 and continued until 2021. The annual loss of savannah from 1995 to 2001, 2005 to 2010, and 2015 to 2021 was considerably greater than the annual gain from 2001 to 2005 and 2010 to 2015. Similarly, field and fallow land showed significant annual increases between 1995 and 2001, followed by low increases from 2005 to 2010 and 2015 to 2021. However, from 2001 to 2005 and 2010 to 2015, field and fallow land experienced a loss in area of 0.10 to 1.48% per year. Except for 2005 to 2010, bare and built-up land area increased. The negative values for water classes are thought to be due to the low discrimination of small watercourses in Landsat images during a certain period.

3.3. Comparative Assessment of Stability and Spatial-Pattern Processes between the Protected and Unprotected Areas in the Northwestern Virunga Landscape

Table 8 and Table 9 offer specific, crucial information regarding the spatial transformation of the protected and unprotected areas in the northwestern Virunga landscape. The protected area constitutes the northern reaches of Virunga National Park, surrounded by a vast area that is not subject to any measure restricting access to resources. The natural land-cover classes, forest and savannah, within the protected area are characterized by high stability-index values, reflecting their low conversion to anthropogenic land-cover classes. Furthermore, the stability of forested area is higher than that of savannah.
Conversely, in the unprotected area of the periphery of the Virunga National Park, the natural land-cover classes are characterized by very low stability-index values. Only the anthropogenic class of field and fallow land showed stability-index values greater than one, with slight variations. However, the conversion of savannah to other land-cover types remains higher than that of forest to other land-cover types. In addition, the bare and built-up land class presented a continuous increase in stability index values, from 0.08 in 1995 to 1.06 in 2021. This continuous increase can be linked to the densification of built-up areas in the landscape, specifically in Beni and Butembo. Finally, the stability-index values for the water class reflect the difficulty of discriminating small waterways in Landsat images in this landscape.
Table 10 and Table 11 present the characteristics of the spatial transformation processes between the protected and unprotected areas in the study landscape. Within the park, forested areas underwent dissection between 1995 and 2001. In contrast, other land-cover classes revealed various processes during the same period: aggregation followed by dissection for field and fallow land, dissection followed by aggregation for savannah, and attrition followed by creation for bare and built-up land. Between 2025 and 2021, a significant decrease in forested and bare and built-up land occurred. Field and fallow land, as well as savannah, underwent creation and dissection, respectively, during this period. The LPI of forested land was estimated at more than 0.70 from 1995 to 2015, indicating low forest fragmentation in the protected area during this period. However, by 2021, the LPI of the forest had decreased to 47%, suggesting ongoing disturbance and increasing fragmentation.
In the unprotected area, between 1995 and 2005, forest and savannah areas underwent patch dissection and attrition, respectively. Field and fallow land underwent patch aggregation from 1995 to 2001, followed by patch creation between 2001 and 2005. The bare and built-up land underwent patch creation between 1995 and 2001, followed by aggregation from 2001 to 2005. From 2005 to 2010, patch aggregation was observed in forested and field and fallow land. During the same period, bare and built-up land experienced attrition, while savannah underwent dissection. From 2010 to 2015, forest patches were created, savannah patches aggregated, and field and fallow land was dissected. The dissection of field and fallow land continued until 2021. Low LPI values indicate disturbance in the forested and savannah areas within the unprotected area. Only field and fallow land recorded LPI values of more than 0.60.

4. Discussion

4.1. Land-Use Dynamics and Deforestation

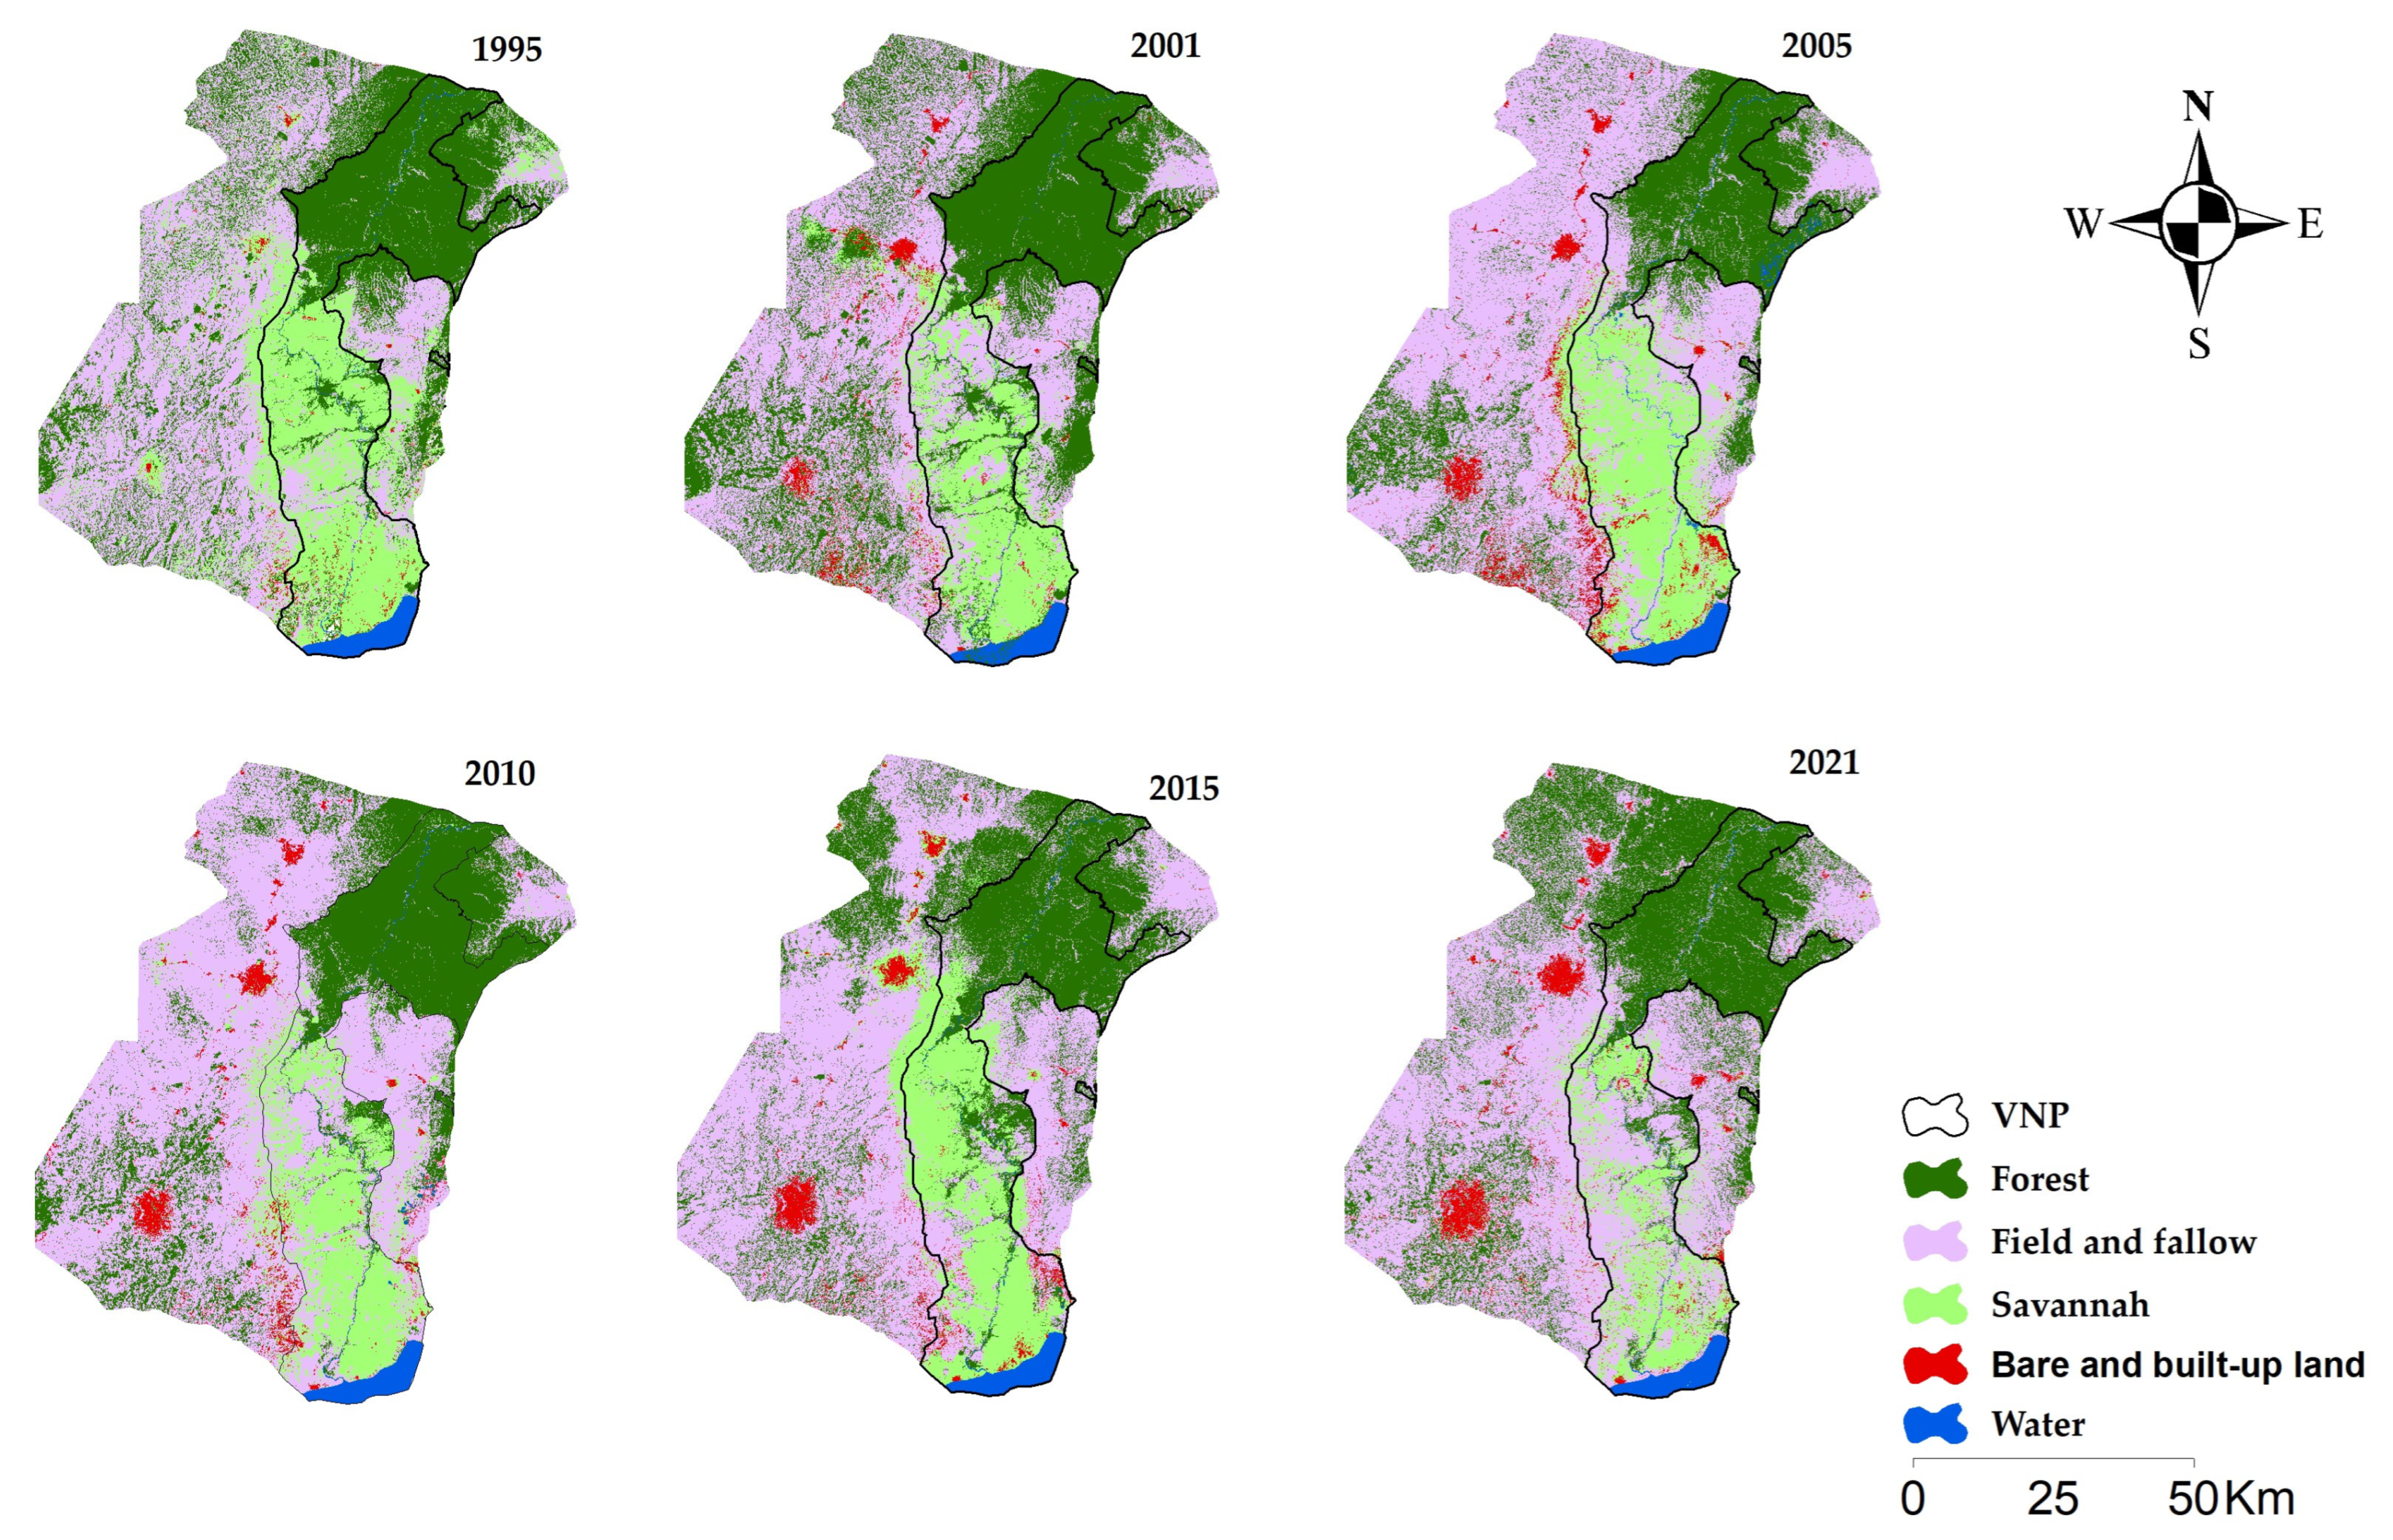
This study defined five land-use types in the northwestern Virunga landscape: forest, savannah, field and fallow, bare and built-up land, and water. A 26-year observation of the northwestern Virunga landscape reveals that, at the landscape scale, field and fallow areas constitute the landscape matrix. Following a 13% spatial increase between 1995 and 2001, the expansion of agricultural areas slowed between 2001 and 2021. As [29] emphasized, in a landscape under heavy human pressure, natural areas are replaced by dominant agricultural activities characterized by fields, fallow land, pastures, and farm buildings. Likewise, [30] indicated that the conversion of forest areas to farmland is a common and increasingly frequent process around Virunga National Park that is resulting in a net loss of natural ecosystems.
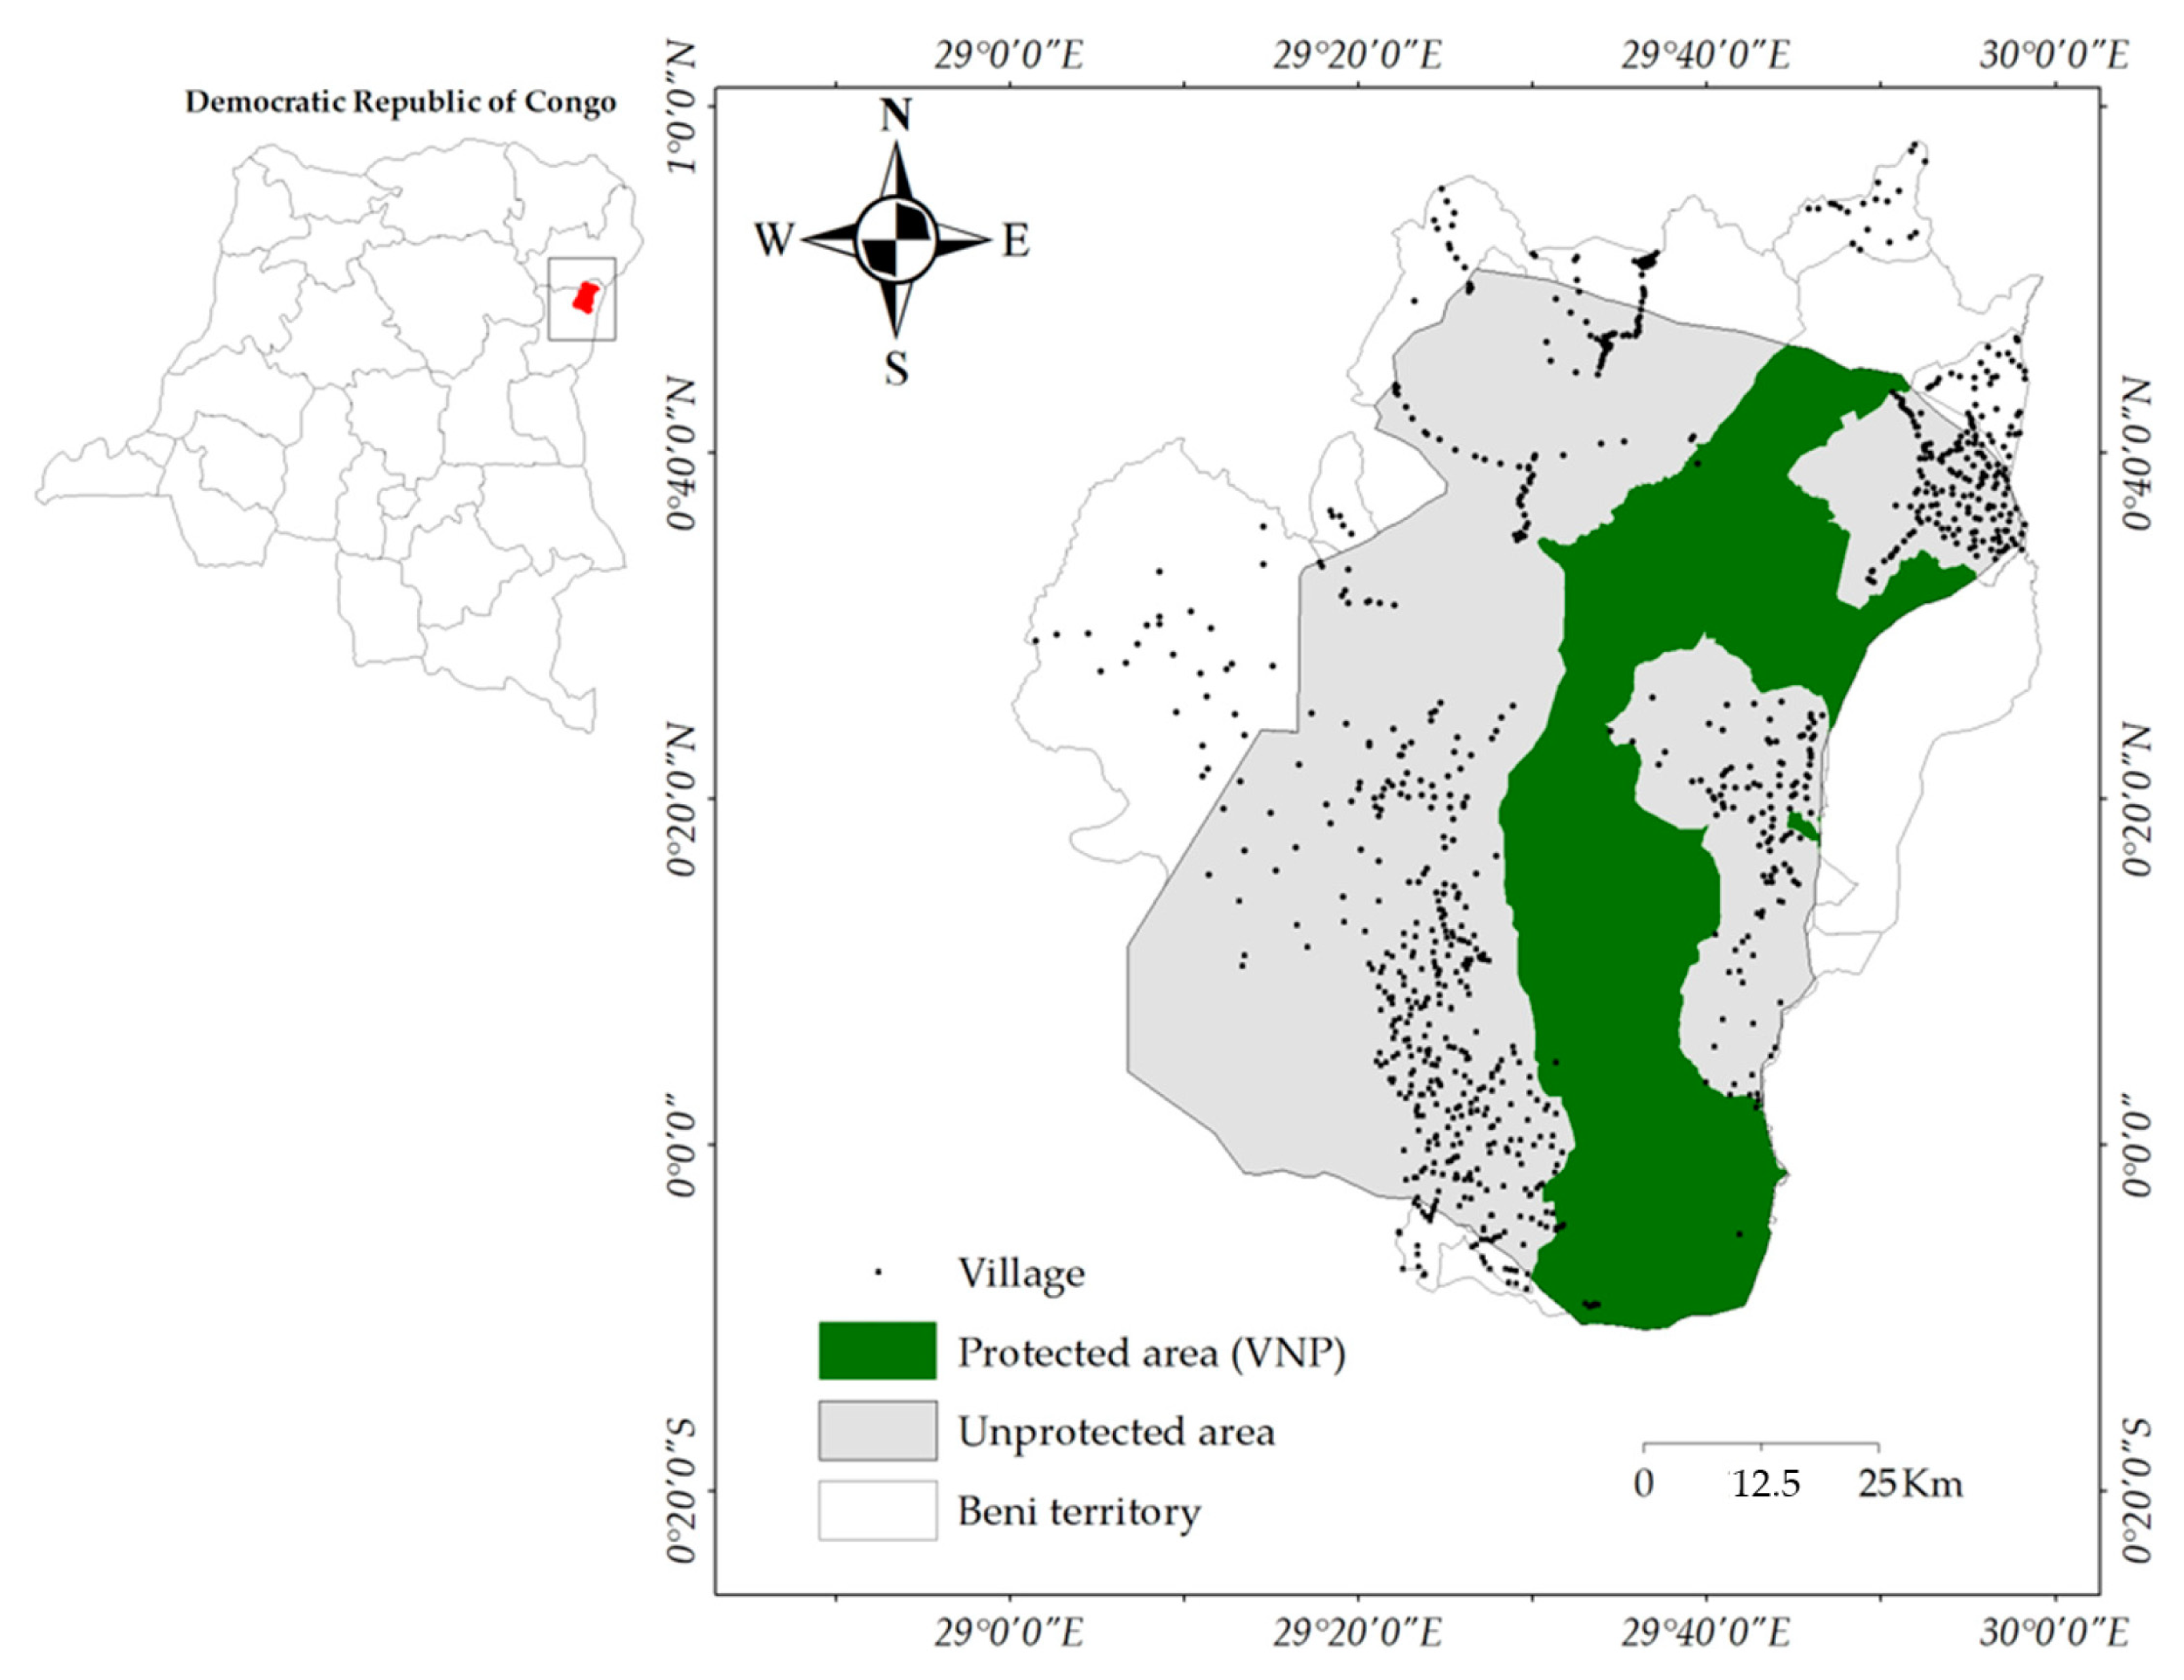
Agricultural practices in the northwestern Virunga landscape, particularly in the Beni lowlands, have historical roots. They are closely linked to the migration of the Nande people starting in the 18th century as they sought new lands to cultivate. This phenomenon was accentuated by the creation of the Virunga National Park, colonial agricultural policies promoting cash crops such as coffee, and the development of urban centers, including Oïcha, Beni, and Butembo [16,31]. Our cartographic analyses support this narrative, revealing that over 40% of the landscape was converted to farmland many years before the major sociopolitical upheavals in the Beni region began in the 1990s. Human migration has also been documented as a factor in the destruction of natural habitats at the Dosso partial wildlife reserve in Niger due to land saturation and climate change [32]. Furthermore, our results partially align with the trends observed by [7], who indicated that by 2018, field and fallow land occupied more than half (66.8%) of the Beni region. However, our estimate of field and fallow land differs from those results by more than 30% in 1995, and by a further 10% after that period. These discrepancies primarily stem from the differing accuracy levels of the random forest classification algorithm used in our study and the maximum likelihood method used in [7]. Furthermore, [20] mentioned that spatial analysis using random forest classification offers better precision when assessing land cover. Therefore, the land-cover trends provided by [7] for the overall Beni landscape should be considered in context. Importantly, ref. [7] focused their analysis on the unprotected area of the Beni landscape that extends into the Mambasa Territory forest between 1995 and 2018 without considering intermediate changes.
Forest constitutes the second-most prominent type of land cover in the landscape studied, followed by savannah. After a decrease between 1995 and 2005, forest cover increased from 2005 to 2021. Meanwhile, savannah experienced a continuous decrease throughout the observation period from 24.18% in 1995 to 8.96% in 2021. Simultaneously, bare and built-up land has increased significantly over the 26-year study period, gaining around 307.31%. The forest loss in the initial decade of observation and continuous savannah loss over the entire 26 study years are closely linked to the expansion of the agricultural frontier and urban areas. Our results support those of [33] and reinforce the trends observed by [5] between 2000 and 2005, which indicate a significant loss of forest near Beni city, primarily due to the cultivation of rice, beans, cassava, coffee, palm, and cocoa, as well as charcoal production, followed by a modest recovery of forests between 2005 and 2010. Agriculture, which employs 80% of the population, remains rudimentary and focused on rice, manioc, and beans, combined with cash crops such as cocoa, palm, and coffee. Lacking institutional support, farmers expand fields in the hope of producing more and earning a higher income [16]. Our results also align with those of [30] concerning the significant loss of savannah areas north of Lake Edward, but they contextualize the projection these authors made of an intense and continuous loss of forest cover in the Virunga landscape at a rate of 4.21% by 2030. Forest transition to other land use is discontinuous, as the annual change shows. Between 1995 and 2005, forested area decreased by slightly more than 2% each year. However, after 2005, the forested area increased, with values varying between 1.30% and 2.07%. Only the savannah experienced significant loss rather than gain, up to 9.06%. Ref. [5] estimated a 2.60% annual rate of forest cover loss across the Virunga landscape between 2000 and 2010, attributing this loss to massive forest clearing in North Kivu. This aligns with our observation of the land-cover pattern between 1995 and 2005, which correlates with the intensification of agricultural activities and the search for wood to use as energy and timber by local populations and refugees from Ituri who were deprived of all means of survival.
From 2002 to 2005, the Beni Territory hosted several thousand refugees fleeing the war in Ituri. Due to a lack of alternatives, these refugees settled in the forested area bordering Virunga National Park, notably in Ngadi, Mavivi, Mbau, and Oïcha [16]. The influx of refugees led to a rapid increase in the population in northwestern Virunga and an increased the demand for natural resources. The arrival of so many people into an area that was unprepared for such pressure, coupled with the endogenous demographic growth, indirectly contributed to deforestation. Population growth, economic growth, and weak institutional structures are leading to increased deforestation in the Democratic Republic of Congo [34,35] and several other developing countries [36,37].
However, contrary to [5], our study reveals a forest cover gain of 2.07% per year between 2005 and 2010 and of more than 1% between 2010 and 2021. This difference may reflect the scale of each study: while [5] focused on analyses at the national and provincial levels, our study focused exclusively on the northern sector of the Virunga landscape. Therefore, the increase in forest area primarily reflects insecurity in the Beni Territory and the neighboring province of Ituri, resulting in almost continuous population movements. Since the security situation in Ituri stabilized in 2005, refugees have vacated occupied land and have cultivated in the Beni Territory, allowing reforestation to occur in degraded areas. After the departure of the Iturian refugees, the Beni Territory experienced the activity of armed factions and terrorism. Since 2010, this insecurity has prompted a massive movement of rural populations toward major urban centers, such as Beni and Butembo, and into Mambasa Territory and the savannah areas in the Virunga National Park, especially north of Lake Edward. Agricultural abandonment due to insecurity has led to the passive reconstitution of forested land. The activities of armed groups often interfere with agricultural activities and prevent farmers from accessing their fields [38]. Therefore, as [39,40] demonstrate, the influx of population from Beni and Butembo into the Mambasa Territory in search of land for cultivation, timber, and charcoal has led to a 12% decline in primary forest in 2019.
The trend of slower deforestation during insecure periods was also reported by [41] in the Yangambi Biosphere Reserve from 1995 to 2003. Ref. [42] noted a forest-restoration rate of more than 4% in the Volcan National Park landscape, another portion of the greater Virunga landscape, in Rwanda during the genocide. Ref. [43] revealed passive forest restoration during periods of armed conflict in Nepal, Sri Lanka, Peru, and the Republic of Côte d’Ivoire. Ref. [38] also documented a decrease in deforestation during armed conflicts. Conversely, ref. [44] noted a decrease in forested area in protected areas, notably in Macaya National Natural Park, La-Visite National Natural Park, and Pine Forest Unit 2 during a period of political instability in the Republic of Haiti. In addition to economic and demographic factors, this study emphasizes that spatial transitions in the northwestern Virunga landscape are heavily influenced by the nature and intensity of insecurity. In areas where armed and terrorist groups are more active, forest passively covers the large agricultural areas left by the retreating population. This contradicts our initial hypothesis that anthropization would be more pronounced during wartime than during peacetime.
According to [41,45], the national annual rate of deforestation in the Democratic Republic of Congo varies from 0.2 to 0.4%. These values are lower than the minimum forest loss rate recorded in our study area (2.57–2.90%). This suggests that, without insecurity or regulatory constraints, annual forest loss in the northwestern Virunga landscape may be 10 times higher than the national average. Insecurity is, therefore, not a factor in the widespread destruction of forest ecosystems in the northwestern Virunga landscape, as insecurity, characterized by terrorist activism, reduces the local people’s ability to extend their activities into the forest. In addition to insecurity, Virunga National Park, as an integral part of the landscape, appears to be significantly slowing the rapid expansion of the human footprint in forested areas. Nevertheless, the savannah remains permanently vulnerable. Farmers and herders surrounding the park can easily enter savannah areas illegally; these areas are vulnerable to anthropogenic pressure [46].

4.2. Landscape Stability Is Enhanced by Protected Areas

The anthropization of protected areas differs from the pattern observed in unprotected areas. The protected area in the northwestern Virunga landscape displayed a greater stability of natural elements than the unprotected area over the study period. This stability confirms our second hypothesis, that regardless of stability or insecurity, the Virunga National Park is less disturbed than its peripheral areas. The LPI values also indicate that natural land cover remains more contiguous in the protected area than in unprotected areas.
Moreover, the loss of forest area within the park is often attributed to dissection and removal, whereas in the peripheral zone, it mainly occurs through dissection. The forest loss of 2.10% per year between 1995 and 2005 is lower than the 3.40% observed by [47] during the same period in Kundelungo National Park. The increase in field and fallow land inside the protected area is attributed to creation, while in the peripheral zone, the increase in field and fallow land occurs through both aggregation and the creation of new patches. These results align with global trends in land-use change, which is greater in the vicinity of the protected areas than within them [1]. As [29] noted, constraints on access to protected areas contribute significantly to the landscape-transformation process. These may include physical or regulatory measures, as in the case of Virunga National Park. Virunga, as a national park and World Heritage Site, is governed by national and international laws prohibiting the exploitation of natural resources in any form. Furthermore, as protected areas cover a large area, the “Institut Congolais de Conservation de la Nature (ICCN)” has developed partnerships with organizations and private partners to manage protected areas. This strategy enabled the protected areas sector to be revitalized both technically and financially. In the Virunga National Park, ICCN has signed a public–private partnership with the “Virunga Foundation” to manage the park. The Virunga National Park is also one of four protected areas in the Democratic Republic of the Congo, which accounts for 90% of investment in protected area management, with 85% provided by international partners. The technical and financial resources available to the Virunga Park manager contribute to the preservation of natural areas despite security challenges [3].
The dissection of forested land within the park can be explained by natural and anthropogenic factors. One natural factor is the local hydrography, which is dominated by the Semuliki River. The primary anthropogenic factor is the rehabilitation of the Beni-Kasindi and Mbau-Kamango roads between Uganda and the Democratic Republic of Congo and the military roads in Virunga National Park. The highly fragmented residual forest in the periphery of the Virunga National Park is typical of a shifting system. These residual forests serve to regulate soil fertility and provide firewood and building materials for the local population [46]. Unlike the proposed theoretical process of spatial landscape transformation, the natural classes are characterized by a certain amount of creation and aggregation within both the protected and unprotected areas. Forest and savannah creation within the protected area may be the result of the healing of anthropized areas after the illegal users of the protected area have been removed. Similarly, the dissection of field and fallow land shows the transient nature of local agriculture, in which field continuity over time is interspersed with passive forest restoration through long-term fallowing.

4.3. The Usefulness of Local Mapping

Today, remote sensing imagery offers significant potential for monitoring changes in land use not only on a local scale but also on a global scale. This is crucial in areas with high conservation value that face threats from armed factions and terrorism [42]. Land-cover maps have been made available to the public for decision-making purposes. However, as [15] highlighted, some of these maps provide an overly general representation of the local dynamics of a landscape. Comparing our land-cover results for 2021 with those extracted from ESA World Cover 2021 [48] reveals some disparities. The map by [48] designates more areas as forest (66.10%) than ours, while our map identified more areas as field and fallow land (53.40%). This variation exists because [48] categorized perennial crops, such as oil palms, as forested land; however, in the context of Virunga, we included multi-annual crops as field and fallow land. Similarly [49] and [50] have used the same definitions of forest and agricultural land classes to monitor world land-cover trends.
In the context of the Virunga landscape, excluding some perennial crop areas from the farming land class diminishes the trend toward landscape anthropization. Conversely, integrating perennially cultivated areas into the farming category increases the visibility of the trend toward anthropization. As [14] noted, the Virunga National Park manager’s use of the ESA World Cover maps necessitates agreement on the definition of land-use classes and comparison with maps produced using local knowledge. Another spatial land-cover framework was proposed by [51], comprising 10 transition classes to monitor forest-cover changes in the humid tropics. The authors considered the absence of tree-foliage cover in a pixel as an indicator of disturbance. However, given the difference in approach and class definition, direct comparison with these results is difficult.

4.4. Management Implications for Virunga National Park

This study highlights the process of anthropization and its spatial effects on the natural habitats of the northwestern Virunga landscape in contexts of insecurity. It identifies an important element in the transformation of the landscape that requires particular monitoring by Virunga National Park managers during and after insecurity: despite the unfortunate human and social toll, armed groups’ violent extremism since 2010 has improved the overall balance of forest cover in the northwestern Virunga landscape. Meanwhile, this study underlines the vulnerability of savannah areas to anthropogenic pressure due to the ease with which farmers and herders access this habitat [52,53]. The restoration of forest cover in degraded areas is only a temporary relationship, as post-conflict development can also threaten restored forests and exert negative pressure on biodiversity [54,55]. The post-conflict development phase in the Beni Territory is a critical period for protected habitats, due to the potential harm development can cause to conservation strategies [56].
This study also affirmed that the regulatory barrier established by the Virunga National Park significantly protects natural forest land against fragmentation. However, effective protection against forest fragmentation does not necessarily indicate that all biodiversity is preserved [56]. The attrition of forest cover in the Virunga National Park, attributed to illegal armed factions and increased militarization to combat the ADF terrorist group, demonstrates why forest cover should be understood as a partial indicator of conservation-management performance. While insecurity contributes to landscape change, political factors also contribute to habitat degradation, often leading to the deterioration of porous savannah areas. In Kasindi and Mwalika, intrusions into vast areas of land are often reported inside the park. As political instability, corruption, and weak law enforcement lead to environmental degradation [9], conservation efforts need reinforcement in the vulnerable savannah zone, which is susceptible to agricultural encroachment.

5. Conclusions

This study focused on land-cover changes in the northwestern Virunga landscape via remote sensing data and spatial patterns. These changes were detected and quantified in an insecure context. The data revealed that agricultural activities dominate the landscape matrix, although they are diminishing over time due to several factors, including the highly insecure situation and restricted access to certain areas in Virunga National Park. Forests’ transition to other land covers is strongly linked to local stability, which naturally affects economic activities that depend on forest resources. Therefore, on a landscape scale, forested areas shrink during peaceful periods and regenerate during wartime. Furthermore, this study found that forests are less fragmented in protected areas than in unprotected ones, suggesting that Virunga National Park plays a significant role in maintaining the stability of natural ecosystems. This emphasizes the importance of reinforcing conservation measures in this protected area. The intact forest in Virunga National Park plays a vital role in biodiversity conservation, supports local rain-fed agriculture, and maintains the hydrological regime of the Nile Basin. In addition, the highly vulnerable savannah area must be regularly and carefully monitored due to its susceptibility to human pressure.

Author Contributions

Conceiving the study: C.M.M., K.R.S., J.-P.M.M., J.-F.B. and J.B.; Design and development of the data analysis: C.M.M.; Data collection and analysis: C.M.M.; Data interpretation: C.M.M. and J.B.; Writing the first draft of the article: C.M.M.; Proofreading the text: C.M.M., J.B.B., T.B.N. and C.S.N. All authors have read and agreed to the published version of the manuscript.

Funding

This study was supported by ERAIFT-AGRINATURA consortium under the project “Capacity building for biodiversity practitioners, scientists, and policymakers for the sustainable management of protected areas and forest ecosystems in Africa” funded by the Development Cooperation Instrument (DCI) N°41928 of the European Union. The authors express their gratitude to the European Union and the ERAIFT-AGRINATURA consortium for their financial support.

Data Availability Statement

The spatial data used in the study are available on https://visioterra.org/VtWeb/ (accessed on 4 November 2023), https://earthengine.google.com/ (accessed on 12 December 2023).

Conflicts of Interest

The authors declare no conflicts of interest.

Appendix A

Table A1. Error matrix determined from 393 validation points.
1995ForestField and FallowSavannahBare and Built-Up LandWaterTotal
Forest791700096
Field and fallow111326130162
Savannah08412253
Bare and built-up land02360267
Water00001515
Total90159507519393
2001ForestField and fallowSavannahBare and built-up landWaterTotal
Forest831300096
Field and fallow7130990155
Savannah09410050
Bare and built-up land07066275
Water00001717
Total90159507519393
2005ForestField and fallowSavannahBare and built-up landWaterTotal
Forest80900089
Field and fallow10137740158
Savannah08390148
Bare and built-up land05470180
Water00011718
Total90159507519393
2010ForestField and fallowSavannahBare and built-up landWaterTotal
Forest8417000101
Field and fallow6126710140
Savannah010400050
Bare and built-up land06373183
Water00011819
Total90159507519393
2015ForestField and fallowSavannahBare and built-up landWaterTotal
Forest851400099
Field and fallow5128010134
Savannah016451062
Bare and built-up land01573079
Water00001919
Total90159507519393
2021ForestField and fallowSavannahBare and built-up landWaterTotal
Forest8119000100
Field and fallow9135730154
Savannah03402045
Bare and built-up land02370176
Water00001818
Total90159507519393

References

  1. Guerra, C.A.; Rosa, I.M.D.; Pereira, H.M. Change versus Stability: Are Protected Areas Particularly Pressured by Global Land Cover Change? Landsc. Ecol. 2019, 34, 2779–2790. [Google Scholar] [CrossRef]
  2. Newbold, T.; Hudson, N.L.; Hill, L.L.S.; Contu, S.; Lysenko, I.; Senior, A.R.; Börger, L.; Bennett, J.D.; Choimes, A.; Collen, B.; et al. Global Effects of Land Use on Local Terrestrial Biodiversity. Nature 2015, 520, 45–50. [Google Scholar] [CrossRef]
  3. Doumenge, C.; Palla, F.; Scholte, P.; Hiol Hiol, F.; Larzillière, A. Aires Protégées d’Afrique Centrale—État 2015; OFAC: Yaoundé, Cameroun, 2015.
  4. Megevand, C. Dynamiques de Déforestation dans le Bassin du Congo: Réconcilier la Croissance Économique et la Protection de la Forêt; Word Bank: Washington, DC, USA, 2013. [Google Scholar]
  5. Potapov, P.V.; Turubanova, S.A.; Hansen, M.C.; Adusei, B.; Broich, M.; Altstatt, A.; Mane, L.; Justice, C.O. Quantifying Forest Cover Loss in Democratic Republic of the Congo, 2000–2010, with Landsat ETM+ Data. Remote Sens. Environ. 2012, 122, 106–116. [Google Scholar] [CrossRef]
  6. Lanjouw, A.; Kayitare, A.; Rainer, H.; Rutagarama, E.; Sivha, M.; Asuma, S.; Kalpers, J. Beyond Boundaries: Transboundary Natural Resource Management for Mountain Gorillas in the Virunga-Bwindi Region; Biodiversity Support Program: Washington, DC, USA, 2001.
  7. Bweya, M.N.; Musavandalo, M.C.; Sahani, M. Analyse de la dynamique spatio-temporelle du paysage forestier de la région de Beni (Nord-Kivu, RDC). Geo-Eco-Trop 2019, 43, 171–184. [Google Scholar]
  8. Liping, C.; Yujun, S.; Saeed, S. Monitoring and Predicting Land Use and Land Cover Changes Using Remote Sensing and GIS Techniques—A Case Study of a Hilly Area, Jiangle, China. PLoS ONE 2018, 13, e0200493. [Google Scholar] [CrossRef] [PubMed]
  9. Muteya, H.K.; Nghonda, D.N.; Kalenda, F.M.; Strammer, H.; Kankumbi, F.M.; Malaisse, F.; Bastin, J.-F.; Sikuzani, Y.U.; Bogaert, J. Mapping and Quantification of Miombo Deforestation in the Lubumbashi Charcoal Production Basin (DR Congo): Spatial Extent and Changes between 1990 and 2022. Land 2023, 12, 1852. [Google Scholar] [CrossRef]
  10. Aslam, R.W.; Shu, H.; Naz, I.; Quddoos, A.; Yaseen, A.; Gulshad, K.; Alarifi, S.S. Machine Learning-Based Wetland Vulnerability Assessment in the Sindh Province Ramsar Site Using Remote Sensing Data. Remote Sens. 2024, 16, 928. [Google Scholar] [CrossRef]
  11. Aslam, R.W.; Shu, H.; Yaseen, A.; Sajjad, A.; Abidin, S.Z.U. Identification of Time-Varying Wetlands Neglected in Pakistan through Remote Sensing Techniques. Environ. Sci. Pollut. Res. 2023, 30, 74031–74044. [Google Scholar] [CrossRef]
  12. Zhang, Z.; Ding, J.; Zhao, W.; Liu, Y.; Pereira, P. The Impact of the Armed Conflict in Afghanistan on Vegetation Dynamics. Sci. Total Environ. 2023, 856, 159138. [Google Scholar] [CrossRef] [PubMed]
  13. Müller, M.F.; Yoon, J.; Gorelick, S.M.; Avisse, N.; Tilmant, A. Impact of the Syrian Refugee Crisis on Land Use and Transboundary Freshwater Resources. Proc. Natl. Acad. Sci. USA 2016, 113, 14932–14937. [Google Scholar] [CrossRef]
  14. Fritz, S.; See, L.; McCallum, I.; Schill, C.; Obersteiner, M.; van der Velde, M.; Boettcher, H.; Havlík, P.; Achard, F. Highlighting Continued Uncertainty in Global Land Cover Maps for the User Community. Environ. Res. Lett. 2011, 6, 044005. [Google Scholar] [CrossRef]
  15. Tropek, R.; Sedláček, O.; Beck, J.; Keil, P.; Musilová, Z.; Šímová, I.; Storch, D. Comment on “High-Resolution Global Maps of 21st-Century Forest Cover Change”. Science 2014, 344, 981. [Google Scholar] [CrossRef] [PubMed]
  16. Vikanza, P.K. Aires Protégées, Espaces Disputés et Développement Au Nord-Est de La R. D. Congo. Ph.D. Thesis, Université Catholique de Louvain, Louvain-la-Neuve, Belgium, 2011. [Google Scholar]
  17. David, P.R.; Junchang, J.; Cheikh, M.; Philip, F.; Tom, L. Accessing Free Landsat Data via Internet: Africa’s Challenge. Remote Sens. Lett. 2010, 1, 111–117. [Google Scholar]
  18. Gorelick, N.; Hancher, M.; Dixon, M.; Ilyushchenko, S.; Thau, D.; Moore, R. Google Earth Engine: Planetary-Scale Geospatial Analysis for Everyone. Remote Sens. Environ. 2017, 202, 18–27. [Google Scholar] [CrossRef]
  19. Al Shogoor, S.; Sahwan, W.; Hazaymeh, K.; Almhadeen, E.; Schütt, B. Evaluating the Impact of the Influx of Syrian Refugees on Land Use/Land Cover Change in Irbid District, Northwestern Jordan. Land 2022, 11, 372. [Google Scholar] [CrossRef]
  20. Talukdar, S.; Singha, P.; Mahato, S.; Shahfahad; Pal, S.; Liou, Y.-A.; Rahman, A. Land-Use Land-Cover Classification by Machine Learning Classifiers for Satellite Observations—A Review. Remote Sens. 2020, 12, 1135. [Google Scholar] [CrossRef]
  21. Olofsson, P.; Foody, G.M.; Herold, M.; Stehman, S.V.; Woodcock, C.E.; Wulder, M.A. Good Practices for Estimating Area and Assessing Accuracy of Land Change. Remote Sens. Environ. 2014, 148, 42–57. [Google Scholar] [CrossRef]
  22. Olofsson, P.; Foody, G.M.; Stehman, S.V.; Woodcock, C.E. Making Better Use of Accuracy Data in Land Change Studies: Estimating Accuracy and Area and Quantifying Uncertainty Using Stratified Estimation. Remote Sens. Environ. 2013, 129, 122–131. [Google Scholar] [CrossRef]
  23. Çakir, G.; Sivrikaya, F.; Keleş, S. Forest Cover Change and Fragmentation Using Landsat Data in Maçka State Forest Enterprise in Turkey. Environ. Monit. Assess. 2008, 137, 51–66. [Google Scholar] [CrossRef]
  24. Sikuzani, Y.U.; Muteya, H.K.; Bogaert, J. Miombo Woodland, an Ecosystem at Risk of Disappearance in the Lufira Biosphere Reserve (Upper Katanga, DR Congo)? A 39-Years Analysis Based on Landsat Images. Glob. Ecol. Conserv. 2020, 24, e01333. [Google Scholar] [CrossRef]
  25. Puyravaud, J.-P. Standardizing the Calculation of the Annual Rate of Deforestation. For. Ecol. Manag. 2003, 177, 593–596. [Google Scholar] [CrossRef]
  26. Kabanyegeye, H.; Sikuzani, Y.U.; Sambieni, K.R.; Masharabu, T.; Havyarimana, F. Trente-trois ans de dynamique spatiale de l’occupation du sol de la ville de Bujumbura, République du Burundi. Afr. Sci. 2020, 18, 203–215. [Google Scholar]
  27. Bogaert, J.; Ceulemans, R.; Salvador-Van Eysenrode, D. Decision Tree Algorithm for Detection of Spatial Processes in Landscape Transformation. Environ. Manag. 2004, 33, 62–73. [Google Scholar] [CrossRef]
  28. Barima, Y.S.S.; Barbier, N.; Bamba, I.; Traoré, D.; Lejoly, J.; Bogaert, J. Dynamique paysagère en milieu de transition forêt-savane ivoirienne. Bois. For. Trop. 2009, 299, 15. [Google Scholar] [CrossRef]
  29. Bogaert, J.; Vranken, I.; André, M. Anthropogenic Effects in Landscapes: Historical Context and Spatial Pattern. In Biocultural Landscapes; Hong, S.-K., Bogaert, J., Min, Q., Eds.; Springer: Dordrecht, The Netherlands, 2014; pp. 89–112. [Google Scholar] [CrossRef]
  30. Christensen, M.; Jokar Arsanjani, J. Stimulating Implementation of Sustainable Development Goals and Conservation Action: Predicting Future Land Use/Cover Change in Virunga National Park, Congo. Sustainability 2020, 12, 1570. [Google Scholar] [CrossRef]
  31. Vyakuno, K. Pression Anthropique et Aménagement Rationnel Des Hautes Terres de Lubero En R.D.C. Rapports Entre Société et Milieu Physique Dans Une Montagne Équatoriale. Ph.D. Thesis, Université Toulouse II, Le Mirail, France, 2006. [Google Scholar]
  32. Abdou, I.K.; Abasse, T.; Massaoudou, M.; Rabiou, H.; Soumana, I.; Bogaert, J. Influence Des Pressions Anthropiques Sur La Dynamique Paysagère de La Reserve Partielle de Faune de Dosso (Niger). Int. J. Biol. Chem. Sci. 2019, 13, 1094–1108. [Google Scholar] [CrossRef]
  33. Molinario, G.; Hansen, M.C.; Potapov, P.V. Forest Cover Dynamics of Shifting Cultivation in the Democratic Republic of Congo: A Remote Sensing-Based Assessment for 2000–2010. Environ. Res. Lett. 2015, 10, 094009. [Google Scholar] [CrossRef]
  34. Aquilas, N.A.; Mukong, A.K.; Kimengsi, J.N.; Ngangnchi, F.H. Economic Activities and Deforestation in the Congo Basin: An Environmental Kuznets Curve Framework Analysis. Environ. Chall. 2022, 8, 100553. [Google Scholar] [CrossRef]
  35. Tegegne, Y.T.; Lindner, M.; Fobissie, K.; Kanninen, M. Evolution of Drivers of Deforestation and Forest Degradation in the Congo Basin Forests: Exploring Possible Policy Options to Address Forest Loss. Land Use Policy 2016, 51, 312–324. [Google Scholar] [CrossRef]
  36. Indarto, J.; Mutaqin, D.J. An Overview of Theoretical and Empirical Studies on Deforestation. J. Int. Dev. Coop. 2016, 22, 107–120. [Google Scholar]
  37. Ajanaku, B.A.; Collins, A.R. Economic Growth and Deforestation in African Countries: Is the Environmental Kuznets Curve Hypothesis Applicable? For. Policy Econ. 2021, 129, 102488. [Google Scholar] [CrossRef]
  38. Stevens, K.; Campbell, L.; Urquhart, G.; Kramer, D.; Qi, J. Examining Complexities of Forest Cover Change during Armed Conflict on Nicaragua’s Atlantic Coast. Biodivers. Conserv. 2011, 20, 2597–2613. [Google Scholar] [CrossRef]
  39. Opelele, O.M.; Fan, W.Y.; Yu, Y.; Kachaka, S.K. Analysis of Land Use/Land Cover Change and Its Prediction in the Mambasa Sector, Democratic Republic of Congo. Appl. Ecol. Environ. Res. 2020, 18, 5627–5644. [Google Scholar] [CrossRef]
  40. Lobanga, E.L.; Bosela, F.B.; Lofumbu, G.L.; Bolila, I.B.; Mwabi, J.N.M. Étude comparée de l’évaluation du taux de déforestation dans les forêts du secteur forestier central de la République Démocratique du Congo. Afr. Sci. 2021, 19, 28–41. [Google Scholar]
  41. Koy, K.; Andrew, D.; Mikwa, J.-F.; Kabuanga, J.M.; Monga Ngonga, M.A.; Oszwald, J.; Doumenge, C. Dynamique de la déforestation dans la Réserve de biosphère de Yangambi. Bois. Forêts Trop. 2019, 341, 15–27. [Google Scholar]
  42. Ordway, E.M. Political Shifts and Changing Forests: Effects of Armed Conflict on Forest Conservation in Rwanda. Glob. Ecol. Conserv. 2015, 3, 448–460. [Google Scholar] [CrossRef]
  43. Grima, N.; Singh, S.J. How the End of Armed Conflicts Influence Forest Cover and Subsequently Ecosystem Services Provision? An Analysis of Four Case Studies in Biodiversity Hotspots. Land Use Policy 2019, 81, 267–275. [Google Scholar] [CrossRef]
  44. Salomon, W.; Sikuzani, Y.U.; Kouakou, A.T.M.; Barima, Y.S.S.; Theodat, J.M.; Bogaert, J. Cartographie et quantification de la perte du couvert forestier dans les parcs nationaux du Sud de la République d’Haïti de 1985 à 2018: Rôle des activités agricoles locales. Int. J. Bio. Chem. Sci. 2021, 15, 477–496. [Google Scholar] [CrossRef]
  45. Kengoum, F.; Pham, T.T.; Moeliono, M.; Dwisatrio, B.; Sonwa, D.J. Le Contexte de la REDD+ en République Démocratique du Congo: Causes, Agents et Institutions, 2nd ed.; Center for International Forestry Research (CIFOR): Bogor, Indonesia, 2020. [Google Scholar] [CrossRef]
  46. Tong, X.; Brandt, M.; Hiernaux, P.; Herrmann, S.; Rasmussen, L.V.; Rasmussen, K.; Tian, F.; Tagesson, T.; Zhang, W.; Fensholt, R. The Forgotten Land Use Class: Mapping of Fallow Fields across the Sahel Using Sentinel-2. Remote Sens. Environ. 2020, 239, 111598. [Google Scholar] [CrossRef]
  47. Useni, Y.S.; Mpanda, M.M.; Malaisse, F.; Kazaba, P.K.; Bogaert, J. The Spatiotemporal Changing Dynamics of Miombo Deforestation and Illegal Human Activities for Forest Fire in Kundelungu National Park, Democratic Republic of the Congo. Fire 2023, 6, 174. [Google Scholar] [CrossRef]
  48. Zanaga, D.; Van, D.K.; De Keersmaecker, W.; Souverijns, N.; Brockmann, C.; Quast, R.; Wevers, J.; Grosu, A.; Paccini, A.; Vergnaud, S.; et al. WorldCover 10 m 2020 V100; European Space Agency: Paris, France, 2021. [Google Scholar]
  49. Potapov, P.; Hansen, M.C.; Pickens, A.; Hernandez-Serna, A.; Tyukavina, A.; Turubanova, S.; Zalles, V.; Li, X.; Khan, A.; Stolle, F.; et al. The Global 2000-2020 Land Cover and Land Use Change Dataset Derived from the Landsat Archive: First Results. Front. Remote Sens. 2022, 3, 856903. [Google Scholar] [CrossRef]
  50. Buchhorn, M.; Lesiv, M.; Tsendbazar, N.-E.; Herold, M.; Bertels, L.; Smets, B. Copernicus Global Land Cover Layers—Collection 2. Remote Sens. 2020, 12, 1044. [Google Scholar] [CrossRef]
  51. Vancutsem, C.; Achard, F.; Pekel, J.-F.; Vieilledent, G.; Carboni, S.; Simonetti, D.; Gallego, J.; Aragão, L.E.O.C.; Nasi, R. Long-Term (1990–2019) Monitoring of Forest Cover Changes in the Humid Tropics. Sci. Adv. 2021, 7, eabe1603. [Google Scholar] [CrossRef]
  52. Ndavaro, K.N.; Dramani, N.; Mulondi, K.G.; Sahani, M.W.; Biaou, S.S.H.; Natta, K.A. Dynamique Spatio-Temporelle de l’occupation Du Sol et Du Couvert Forestier Dans Les Hautes Terres Fraîches de Lubero (R.D. Congo). Geo-Eco-Trop 2021, 45, 641–658. [Google Scholar]
  53. Nagendra, H.; Pareeth, S.; Ghate, R. People within Parks—Forest Villages, Land-Cover Change and Landscape Fragmentation in the Tadoba Andhari Tiger Reserve, India. Appl. Geogr. 2006, 26, 96–112. [Google Scholar] [CrossRef]
  54. IUCN, International Union for Conservation of Nature. Conflict and Conservation, 1st ed.; IUCN, International Union for Conservation of Nature: Gland, Switzerland, 2021. [Google Scholar] [CrossRef]
  55. Garcia Corrales, L.M.; Avila, H.; Gutierrez, R.R. Land-Use and Socioeconomic Changes Related to Armed Conflicts: A Colombian Regional Case Study. Environ. Sci. Policy 2019, 97, 116–124. [Google Scholar] [CrossRef]
  56. Butsic, V.; Baumann, M.; Shortland, A.; Walker, S.; Kuemmerle, T. Conservation and Conflict in the Democratic Republic of Congo: The Impacts of Warfare, Mining, and Protected Areas on Deforestation. Biol. Conserv. 2015, 191, 266–273. [Google Scholar] [CrossRef]
Figure 1. Northwestern Virunga landscape as defined in our study.
Land 13 00566 g001
Figure 2. Decision tree used to analyze the spatial transformation process. a0 = class area at initial period, n0 = number of patches at initial period, and p0 = class perimeter at initial period. A1, n1, and p1 refer to final period [27].
Land 13 00566 g002
Figure 3. Land-cover maps of the northwestern Virunga landscape from 1995 to 2021 (color code: #D20103 = bare and built-up land, #2E7E0D = forest, #3630E1 = water, #E8BFF3 = field and fallow land, #6CFF55 = savannah).
Land 13 00566 g003
Table 1. Land-cover descriptions.
Land Cover ClassDescription
ForestPrimary forest, mature secondary forest, and other forest formations resulting from large-scale afforestation.
Field and fallowCultivated land (food crops such as rice, beans, and cassava), perennial crops (coffee, palm, and cocoa), and fallow land less than 4 years old that is likely to be reconverted to agricultural land [5] or disturbed by other anthropogenic factors, such as bush fires.
SavannahGrassland and shrubland savannah, mainly located within Virunga National Park.
Bare and built-up landResidential areas, roads, or other surfaces not covered by vegetation at the time of image acquisition.
WaterPermanent or seasonal bodies of water (rivers, lakes).
Table 2. Accuracy assessment of land cover based on supervised classification using Random forest classification (UA: User accuracy, PA: Producer accuracy).
ForestField and FallowSavannahBare and Built-Up LandWaterOverall Accuracy
YearUAPAUAPAUAPAUAPAUAPA
19950.820.880.810.830.770.820.900.801.000.800.83
20010.860.920.840.820.820.820.880.881.000.890.85
20050.900.890.870.860.810.780.880.930.940.850.87
20100.830.930.900.790.800.800.880.970.950.970.87
20150.860.940.960.810.730.900.920.971.001.000.89
20210.810.900.880.850.890.800.920.931.000.950.88
Table 3. Transition probability matrix at the landscape scale, illustrating the dynamics of the areas of different land-use classes between 1995–2001, 2001–2005, 2005–2010, 2010–2015, and 2015–2021. Values are given as percentages (%); 1% = 62.8511 km2. The values in the rows correspond to the first year and the values in the columns to the second year given in the date ranges specified. Values in the bold indicate the class stability.
1995–2001ForestField and FallowSavannahBare and Built-Up LandWaterTotal
Forest21.629.831.330.250.1833.21
Field and fallow 4.6532.432.381.030.0240.51
Savannah1.5111.2910.001.040.3424.18
Bare and built-up land0.040.270.230.230.050.82
Water0.090.130.110.000.971.29
Total 27.9153.9514.042.541.55100.00
2001–2005ForestField and fallowSavannahBare and built-up landWaterTotal
Forest18.847.750.970.090.2627.91
Field and fallow 5.6241.205.281.800.0453.95
Savannah0.443.859.030.660.0614.04
Bare and built-up land0.230.880.141.290.002.54
Water0.050.050.040.001.421.55
Total 25.1953.7315.463.841.78100.00
2005–2010ForestField and fallowSavannahBare and built-up landWaterTotal
Forest18.845.910.220.170.0525.19
Field and fallow 8.1541.962.870.740.0353.73
Savannah0.575.469.180.250.0115.46
Bare and built-up land0.071.590.661.520.003.84
Water0.310.030.070.001.381.78
Total 27.9354.9412.992.681.47100.00
2010–2015ForestField and fallowSavannahBare and built-up landWaterTotal
Forest19.987.460.390.050.0527.93
Field and fallow 8.6839.336.100.810.0154.94
Savannah1.013.328.230.410.0212.99
Bare and built-up land0.090.700.391.490.002.68
Water0.040.050.000.001.381.47
Total 29.8150.8615.112.771.46100.00
2015–2021ForestFields and fallowSavannahBare and built-up landWaterTotal
Forest21.967.400.320.120.0129.81
Field and fallow 10.3937.861.810.780.0150.86
Savannah0.417.416.450.830.0115.11
Bare and built-up land0.030.760.371.610.002.77
Water0.010.020.020.001.411.46
Total 32.8053.458.963.341.45100.00
Table 4. Evolution of the stability index of each land-cover class in the northwestern Virunga landscape.
Year ForestField and FallowSavannahBare and Built-Up LandWater
1995–20011.211.390.550.081.06
2001–20051.222.980.790.342.82
2005–20101.223.130.910.442.78
2010–20151.123.270.710.617.93
2015–20211.202.400.580.5516.01
Table 5. Synthesis of spatial-pattern indices in the northwestern Virunga landscape between 1995 and 2021. N = Number of patches, CA = Class area (in km2), LPI = Largest-patch index.
Indices ForestField and FallowSavannahBare and Built-Up LandWater
N199573,50286,291220,98713,1305576
CA19952086.982545.791519.4751.8081.05
LPI19950.570.690.290.040.47
N2001115,12073,82859,07430,3345583
CA20011754.043390.95882.55159.9297.64
LPI20010.520.710.240.100.82
N2005137,520100,00145,61130,8895411
CA20051582.913377.27971.61241.27112.05
LPI20050.570.690.500.110.72
N201091,47477,79456,17715,633929
CA20101755.403453.11816.15168.2092.25
LPI20100.620.850.350.190.86
N2015121,74994,64827,21231,858769
CA20151873.353196.38949.69173.8891.81
LPI20150.490.660.520.270.86
N202183,663107,67875,94134,085671
CA20212061.793359.18563.36209.8490.94
LPI20210.440.780.110.260.88
Table 6. Identification of spatial transformation processes (STPs) of land-cover classes in the northwestern Virunga landscape between 1995 and 2021. Di = Dissection, Ag = Aggregation, Cr = Creation, At = Attrition.
ForestField and FallowSavannahBare and Built-Up LandWater
STP1995–2001DiAgAtCrCr
STP2001–2005DiDiAgCrAg
STP2005–2010AgAgDiAtAt
STP2010–2015CrDiAgCrAt
STP2015–2021AgDiDiCrAt
Table 7. Annual rate of land-cover change (percent) in the northwestern Virunga landscape.
ForestField and Fallow SavannahBare and Built-Up LandWater
1995–2001−2.904.58−9.0618.793.10
2001–2005−2.57−0.102.4010.283.44
2005–20102.070.44−3.49−7.22−3.89
2010–20151.30−1.553.030.66−0.09
2015–20211.600.83−8.703.13−0.16
Table 8. Stability-index values for each land-cover class in the protected area.
ForestField and FallowSavannahBare and Built-Up LandWater
1995–20013.170.171.070.041.20
2001–20052.660.381.170.072.35
2005–20103.320.411.270.103.51
2010–20153.090.271.000.1012.88
2015–20212.950.330.880.0517.88
Table 9. Stability-index values for each land-cover class in the unprotected area.
ForestField and FallowSavannahBare and Built-Up LandWater
1995–20010.671.350.150.080.00
2001–20050.651.950.200.380.00
2005–20100.602.080.230.600.00
2010–20150.571.890.180.690.00
2015–20210.671.730.171.060.00
Table 10. Land-cover pattern dynamics of protected and unprotected areas of the northwestern Virunga landscape from 1995 to 2021. N = Number of patches, CA = Class area (in km2), LPI = Largest-patch index. The protected area covers 2074.65 km2 and the unprotected area, 4210.46 km2.
Protected Area (within Virunga National Park)Unprotected Area (around Virunga National Park)
IndicesForestField and FallowSavannahBare and Built-Up LandWaterForestField and FallowSavannahBare and Built-Up LandWater
N199512,77233,44030,3335907375460,97752,851190,56472231822
CA1995913.27187.00880.7419.3874.261173.712358.94638.8032.426.79
LPI19950.840.210.390.010.600.140.720.090.060.17
N200118,95437,04118,3383022385296,16637,33541,01827,3521736
CA2001805.17488.48670.5015.0095.50948.862902.42212.08144.892.10
LPI20010.850.120.290.160.840.080.760.070.100.05
N200510,36250,00819,17074093535127,51050,67526,77823,5921886
CA2005711.13416.80789.9148.21108.60871.762960.48181.72193.083.45
LPI20050.940.160.570.140.770.150.740.220.140.10
N201014,89740,99721,704277641876,86837,69734,94412,941511
CA2010852.15458.92656.0816.8690.64903.252994.21160.07151.341.70
LPI20100.900.240.420.080.900.130.750.040.210.10
N201518,20642,51212,81810,622633103,86352,83614,65821,341138
C2015854.06350.96740.7437.3791.521019.292845.42208.95138.560.29
LPI20150.770.190.510.100.910.130.710.440.320.10
N202112,82455,34627,10610,20022971,21053,83649,12924,045442
C2021850.76655.22451.3727.1290.181211.032703.98112.00182.710.76
LPI20210.470.450.140.070.920.150.670.060.290.06
Table 11. Spatial transformation processes (STPs) within and around Virunga National Park. Di = Dissection, Cr = Creation, At = Attrition, Ag = Aggregation.
Protected Area (within Virunga National Park)Unprotected Area (around Virunga National Park)
ForestField and FallowSavannahBare and Built-Up LandWaterForestField and FallowSavannahBare and Built-Up LandWater
STP1995–2001DiCrAtAtCrDiAgAtCrAt
STP2001–2005AtDiCrCrAgDiCrAtAgCr
STP2005–2010CrAgDiAtAtAgAgDiAtAt
STP2010–2015CrDiAgCrCrCrDiAtDiAt
SPT2015–2021AtCrDiAtAtAgDiDiCrCr
Disclaimer/Publisher’s Note: The statements, opinions and data contained in all publications are solely those of the individual author(s) and contributor(s) and not of MDPI and/or the editor(s). MDPI and/or the editor(s) disclaim responsibility for any injury to people or property resulting from any ideas, methods, instructions or products referred to in the content.

