
Analysis of Spatial and Temporal Changes and Drivers of Urban Sprawl in Xinjiang Based on Integrated DMSP-OLS and NPP-VIIRS Data
1
Ministry of Education Key Laboratory for Western Arid Region Grassland Resources and Ecology, College of Grassland Science, Xinjiang Agricultural University, Urumqi 830052, China
2
College of Resources and Environment, Xinjiang Agricultural University, Urumqi 830052, China
3
State Key Laboratory of Desert and Oasis Ecology, Xinjiang Institute of Ecology and Geography, Chinese Academy of Sciences, Urumqi 830011, China
*
Author to whom correspondence should be addressed.
†
These authors contributed equally to this work.
Land 2024, 13(5), 567; https://doi.org/10.3390/land13050567
Submission received: 15 March 2024
/
Revised: 17 April 2024
/
Accepted: 20 April 2024
/
Published: 23 April 2024
(This article belongs to the Section Urban Contexts and Urban-Rural Interactions)
Abstract
:The accelerated urbanization taking place across Xinjiang in recent years has vastly improved the quality of life for people living in the region. However, to achieve rational urban growth and sustainable regional development, a deeper understanding of the spatial and temporal patterns, spatial morphology, and driving factors of urban sprawl is crucial. Nighttime light (NTL) data provide a novel approach for studying the spatial and temporal changes in urban expansion. In this study, based on DMSP-OLS and NPP-VIIRS data, we analyze the spatiotemporal characteristics of urban changes using the standard deviation ellipse and employ the geographical detector to analyze the impact of natural environmental and socioeconomic factors on the dynamic rate of urban expansion. The results reveal the following. (1) The overall accuracy of urban area extraction is above 80%, and the urban area of Xinjiang has expanded about 9.1 times over the past 30 years. Further, the growth rate from 2007 to 2017 exceeds the growth rate from 1992 to 1997, with the center of gravity of urban development shifting to the southwest. (2) The 5a sliding average temperature and average annual precipitation in the study area in 1992–2022 are 6.08 °C and 169.72 mm, respectively, showing a decrease in the urbanization rate followed by an increase, due to a rise in temperature and precipitation levels. (3) By combining the results of geographical detector factor detection and interaction detection, precipitation is determined to be the main controlling factor, while air temperature and GDP are secondary factors. This study presents new findings on the correlation between urban spatial and temporal changes and climate in Xinjiang, thus providing a scientific reference for future research on urban expansion and natural environment evolution.
1. Introduction
Cities, the core of politics, economy, society, and culture in a specific region [1], are undergoing transformation in scale and spatial structure as China’s economy enters a new phase of structural adjustment [2,3]. Urbanization describes the process of population concentration and urban spatial change [4], and it is not only a key driver of global change but also leads to an expansion in population size and a transformation of lifestyles [5,6]. The expansion of urban space is the most notable feature of urbanization [7], involving complex dynamics of land use and population growth. Reasonable urban expansion can stimulate sustained economic growth and achieve harmonious coexistence between urban development and the resource environment [8,9,10]. On the contrary, disorderly urban expansion may lead to the waste of land resources, conflicts in the supply and demand of urban land, and serious issues such as extreme climate events, environmental pollution, and resource depletion [11,12,13,14]. Currently, with the occurrence of global warming [15] and extreme precipitation [16], both human society and natural ecosystems are facing serious threats. Therefore, clarifying the impact of temperature and precipitation under climate change on urban development is of significant importance for revealing the mechanisms of interaction between urban expansion and meteorological elements.
Climate change refers to significant alterations in the statistical average state of the climate or climatic variations that persist over an extended period (typically 10 years or longer) [17]. A significant amount of research has delved into the correlation between climate change and various aspects of urban development, such as ecosystems, food security, and population. Bastos et al. [18] analyzed the direct and seasonal negative impacts of extreme summer droughts and high temperatures on ecosystems. Kogo et al. [19] investigated how climate change will continue to negatively affect crop production and food security in the vulnerable regions of arid and semiarid areas in Kenya. Ghaffar et al. [20] analyzed the adaptability of planting systems and patterns for sustainable crop production under climate change scenarios. Li et al. [21] employed both bottom-up and top-down approaches to quantify the impact of climate change on terrestrial water storage in the Qinghai–Tibet Plateau. Lupi et al. [22] explored the bidirectional relationship between population growth and climate change. It can be seen that climate change not only affects the balance of ecosystems in cities but also has the potential to change patterns of agricultural production and crop yields, impacting on changes in urban population dynamics and further affecting the development of urbanization.
Since urban development and climate change are both dynamic processes involving numerous elements, these elements are interrelated and mutually influential. Therefore, in addition to studying the impact of climate change on urban development, the stress effects of urbanization on the climate have also received widespread attention, e.g., urban surface warming [23,24], the urban heat island effect [25,26,27], and the urban rain island effect [28,29], among others. In summary, the relationship between urban development and climate change is one of mutual influence and constraint. The process of urbanization needs to be considered in terms of the risks brought by climate change, and adaptation and mitigation measures for climate change should also be closely integrated with urban development. Therefore, obtaining accurate and continuous dynamic information on urban expansion is key to clarifying research on the correlation between climate and urban expansion dynamics.
Nighttime light (NTL) can source visible and near-infrared electromagnetic wave information emitted from the ground under cloud-free conditions [30]. The acquired radiant brightness value, i.e., luminosity, highlights the urban area as a bright spot on the image, and the eye-catching contrast between the brightness and the surrounding darkness makes it an ideal representation of the frequency of human activities [31]. Nighttime remote sensing data not only play an important role in urban studies, such as urban land expansion studies [32], urban area extraction studies [33], and changes in the representation of urban spatial structures [34], but have also been shown to have strong relevance to socioeconomic factors. These include spatialization of gross domestic product [35], demographic changes [36], and electricity consumption [37]. This study integrates the two most commonly used nighttime light data sources in scientific research (DMSP-OLS and NPP-VIIRS) and utilizes them as the data source for this study to assess urban expansion information over time.
The Xinjiang Uygur Autonomous Region (hereinafter referred to as Xinjiang) is located in the northwest of China and belongs to an extremely arid area with a relatively fragile ecological environment [38]. A region inhabited by multiple ethnic groups, Xinjiang has garnered widespread attention regarding the economic development of its cities and regions, propelled by national strategies such as the Western Development project and the Belt and Road Initiative [39]. However, the region’s characteristics of resource-based water scarcity and extremely fragile ecology lead to prominent contradictions in the use of water for “production–life–ecology”. This not only exacerbates the competition for water between agricultural production and urban living but also poses a threat to the sustainability of the ecosystem. Against this backdrop, urban expansion must be carried out cautiously to ensure the rational allocation and effective management of water resources. Therefore, selecting Xinjiang as the area for studying urban expansion not only has significant guiding importance for the development of the region itself but also offers a reference for other arid, multiethnic regions facing similar challenges.
This study takes Xinjiang as the research area and uses the integrated DMSP-OLS and NPP-VIIRS data as the source dataset. The optimal threshold method is employed to extract urban information, followed by accuracy validation. The study analyzes the spatiotemporal characteristics and scale morphology of urban areas in Xinjiang from both quantitative and qualitative perspectives, utilizing the TDN and the standard deviation ellipse. Finally, the driving factors behind the dynamic changes in the urban expansion rate in Xinjiang are analyzed. The aim of this research is to deepen the understanding of the urbanization process development patterns and climatic element variations in Xinjiang over the past 30 years, providing a basis for urban planning in Xinjiang and promoting its sustainable development.
2. Data and Materials
2.1. Study Area
Xinjiang (73°40′–96°18′ E, 34°25′–48°10′ N) is located in northwestern China, which is situated in the hinterland of the Asia–Europe continent. With an area of 1.66 × 10⁶ km2, Xinjiang is the largest provincial-level administrations in the Asian nation and accounts for about one sixth of its total land area. Typical geomorphological units in the region include the Altai Mountains, Junggar Basin, Tianshan Mountains, Tarim Basin, and Kunlun Mountains, which together form a unique terrain known locally as the “three mountains and two basins”. The topographic relief across the region ranges from −217 m to 8483 m.
Because the high mountains hinder warm and humid air currents from reaching lower altitudes, Xinjiang has a typical temperate continental climate, with an average annual precipitation of 155 mm and an average annual temperature of 10.10 °C. The natural conditions are harsh, so the cities are mainly concentrated in the oases and their distribution is fragmented and dispersed. Therefore, it is important to study the spatial and temporal changes of urban expansion in Xinjiang and explore their relationship with climate change in order to unpack the driving factors of urban expansion dynamic change and provide a scientific basis for future urban development projects in the region (Figure 1).
2.2. Data Sources
The DMSP-OLS (Version 4) 1992–2013 non-radiometrically calibrated nighttime light imagery dataset and the 11 January 2010–31 July 2011 reference imagery acquired by the F16 satellite sensor were obtained from the National Geophysical Data Center (NGDC), USA (https://www.ngdc.noaa.gov/eog/dmsp/downloadV4composites.html; accessed on 8 April 2023). The spatial resolution of the data is 30 arc seconds, and the image values are presented as grayscale values (DN values) in the range of 0–63. This paper utilizes the stable light images from three annual average images as the data source, which are calibrated for nighttime average light intensity and have noise removed.
The annual VIIRS_vcmslcfg dataset for 2012–2021 and month-by-month data for January–November 2022 were obtained from the NCEI National Centers for Environmental Information (https://eogdata.mines.edu/products/vnl/#annual_v2; accessed on 20 April 2023), a division of the National Oceanic and Atmospheric Administration (NOAA), USA. The spatial resolution of the data is 15 arc seconds, and its day–night band (DNB) is panchromatic with a strong capability of detecting weak light sources at night and on-orbit radiometric calibration. The high sensitivity also makes the sensor more susceptible to the noise of reflected light sources such as ice and snow, so there is substantial background noise and numerous outliers in the data. Consequently, the data underwent processing such as noise reduction and outlier removal during the preprocessing stage.
The monthly 2 m air temperature gridded data from 1992 to 2022 originate from the ERA5-Land dataset published by the European Union and the European Center for Medium-Range Weather Forecasts (ECMWF; https://cds.climate.copernicus.eu/cdsapp#!/dataset/reanalysis-era5-land-monthly-means?tab=overview; accessed on 11 May 2023), among other organizations. The spatial resolution of the data is 0.1°, and the data unit has been converted to degrees Celsius (°C).
The average annual temperature and precipitation data for various regions in Xinjiang are derived from the daily meteorological observation station data of the National Centers for Environmental Information (NCEI), which is part of the National Oceanic and Atmospheric Administration (NOAA) of the United States (https://www.ncei.noaa.gov/data/global-summary-of-the-day/archive/; accessed on 15 June 2023). Through the application of the inverse distance weighting (IDW) method to this data, gridded data with a spatial resolution of 1 km are obtained. By conducting statistical calculations on the meteorological data within the boundaries of Xinjiang, the corresponding annual temperature and precipitation data are derived.
The annual average precipitation data for the entire Xinjiang region, as well as various socioeconomic data, are sourced from the Xinjiang Statistical Yearbook, China City Statistical Yearbook, and Xinjiang Water Resources Bulletin published by the Department of Water Resources and statistical data from the National Bureau of Statistics.
The annual land use data are sourced from the China Land Cover Dataset published by Wuhan University, with a spatial resolution of 30 m (https://doi.org/10.5281/zenodo.8176941; accessed on 15 June 2023).
2.3. Research Method
2.3.1. Urban Extraction of Xinjiang Based on the Best Threshold Method
Taking the corrected NTL as the data source (Figure 2), the optimal threshold method [40] was used to extract Xinjiang city information. The extracted city limits were then compared with Landsat data, and the thresholds for each year were adjusted to obtain the city limits from 1992 to 2022. The data indicated an increase of 3354.39 km2 in the city area. Next, the land use data were used as the auxiliary information to assess the overall accuracy of the urban area extraction results. Table 1 presents data pertaining to the accuracy of the calculations for each year. As can be seen, the city limits of Xinjiang expanded about 9.1 times during the 30-year period, and the rate of area growth was 111.813 km2/a. Furthermore, the overall accuracy for all years was higher than 80%, ensuring the accuracy of the results of subsequent studies.
2.3.2. Urban Expansion Scale and Form Indicators
TDN
TDN (total value) is the sum of the values of the bright pixels of the image, calculated as follows [41]:
where is the value of image in the image and is the number of images in the image.
Standard Deviation Ellipse Method
The standard deviation ellipse can intuitively display the spatial distribution characteristics of urban expansion, including the dynamic changes in the spatial scope and centroid of urban agglomerations. It quantitatively explains the spatial distribution of geographic elements in terms of global space, such as centrality, spreading, directionality, spatial morphology, and other characteristics. The orientation angle of the ellipse can identify the main trend of direction of urban development, and the major and minor axes of the standard deviation ellipse can reveal the primary and secondary directions of urban expansion, offering unique advantages in the analysis of urban expansion.
The center of gravity coordinates are used to analyze the spatial extension direction and concentration degree of the size of the luminous city cluster in Xinjiang [42]. The standard deviation is:
The angle of rotation is the angle formed by clockwise rotation in the due-north direction to the long axis, calculated by the formula:
The standard deviation and the standard deviation calculation formulae are, respectively:
where indicates the spatial location of the study subjects, denotes the corresponding weight, and represents the coordinate deviation of the location of each subject to the elliptic center of gravity .
Center-of-Gravity Migration Distance
The calculation formula of the moving distance of the center of gravity in the area is:
where is the distance between the center of gravity in years and of the study area, km is the unit, and R = 111.111 is the constant coefficient converting geographic coordinates to plane distance [43].
2.3.3. Analysis of Urbanization Indicators and Meteorological Data
Urbanization Rate
The urbanization rate is the proportion of the urban population of an area in relation to the resident population of that area. It is calculated as [44]:
where is the urbanization rate in , and and are the urban population and permanent resident population in period, respectively.
Urban Expansion Dynamic Change Rate
The dynamic change rate of urban expansion is an important metric for studying the spatiotemporal changes in cities. It provides a quantitative indicator to measure and analyze the rate and pattern of urban expansion over time and space, which can be used to monitor the trends of urbanization. The calculation formula is [45]:
where is the urban expansion dynamic change rate, is the urban area at the beginning of the study period, is the urban area at the end of the study period, and T is the time interval.
5a for the Sliding Average Algorithm
The sliding average method can eliminate the unstable fluctuation in the mean temperature change and is formulated as follows [46]:
where is the sliding average temperature of 5a in a year; is the temperature of a year; is the temperature value of 2a before a year; is the temperature value of 1a before a year; is the temperature value of 1a after a year; and is the temperature value of 2a after a year.
Mann–Kendall Trend Test
The Mann–Kendall trend test is a nonparametric statistical method that does not require any assumptions to be made about the distribution of the data [47,48]. This means that even when the data do not conform to a normal distribution, this method can be used to analyze trends and change points in the data. Given that meteorological data often exhibit characteristics of abnormal distribution, it is necessary to employ this method to analyze the trends and points of change within the data.
where and represent the values of years and , respectively, and .
where is the trend change equation and Q is the slope.
When n values are available, slope estimated values [49] can be obtained.
2.3.4. Analysis of the Driving Force of Urban Expansion Dynamic Change Rate
Existing analyses of the mechanism of the driving force of urban expansion dynamic change rate mostly use mathematical and statistical methods in the traditional sense, such as correlation analysis, regression analysis, etc. As an emerging statistical method, geographical detectors can quantify the degree of spatial differentiation, provide significance tests, and conduct attribution analysis, thereby revealing the spatial regularities behind urban expansion. This method has no linear assumption, and its computational process and results will not be affected by the covariance of multiple independent variables. It also has a clear physical meaning [50,51]. The model is capable not only of detecting the impact of a single factor on the dynamic change rate of urban expansion but also of identifying the combined effects of two or more factors on urban expansion, which helps to reveal the potential complex relationships that may exist among different factors.
This study primarily employs methods such as factor detection and interaction detection to analyze the driving forces affecting the dynamic expansion rate of cities in Xinjiang. Divergence and factor detection can measure the degree of explanation of the independent variable on the spatial divergence phenomenon of the dependent variable, while interaction detection analyzes the degree of influence on the distribution of the dependent variable after the superimposed effect of different factors. According to the actual development situation in the study region, two types of factors are selected for discretization. These are: (1) natural environment factors, which include elevation (X1), slope (X2), average annual precipitation (X3), and average annual temperature (X4); and (2) socioeconomic factors, which include population density (X5), GDP (X6), government revenue (X7), electricity consumption (X8), proportion of secondary industry (X9), and proportion of tertiary industry (X10).
We employ a discretization method to explore the impact of various factors on the urban dynamic expansion rate (Y) with the formula [52]:
where is the explanatory power index of the factors affecting urban change, is the number of samples of the whole region, is the number of secondary regions, is the number of samples of the sub-level region, is the variance in the change of urban area in the whole region, and denotes the variance in the sub-primary region. Assuming a model is established with a value interval in [0, 1], means that the urban dynamic expansion is randomly distributed, but not driven by influencing factors. As such, the more tends toward 1, the greater the explanatory power of the driver for urban dynamic expansion.
2.4. Research Framework
To better study the spatiotemporal patterns of dynamic urban expansion in Xinjiang and the driving factors affecting the rate of urban dynamic expansion, we carried out four key steps (Figure 3). Firstly, this paper corrects and integrates two types of nighttime light data. Then, the urban areas are extracted using the optimal threshold method, and the temporal and spatial changes in Xinjiang’s cities are analyzed using the TDN and the standard deviation ellipse.
The impact of climate change on urban expansion is becoming increasingly significant. Global warming may lead to rising sea levels, extreme precipitation, and the greenhouse effect, all of which can affect urban infrastructure and residents’ lives to varying degrees. Therefore, in the third part of this paper, linear regression and Mann–Kendall tests are used to analyze the interannual and spatial variations in temperature and precipitation in Xinjiang.
Finally, to explore the driving forces behind the dynamic changes in urban expansion, in terms of the natural environment, we have selected four environmental factors (elevation, slope, annual average precipitation, and annual average temperature). Suitable elevation and slope can promote the development of agriculture and urban construction; adequate water resources provide the foundation for urban living and industrial activities; and climate change may lead to an increase in extreme weather events, posing threats to urban safety and thereby affecting the pace and speed of urban expansion. Therefore, for the aforementioned reasons, we have chosen to analyze these four factors. In the realm of socioeconomic factors, we have chosen six indicators (population density, GDP, government fiscal revenue, electricity consumption, the proportion of the secondary industry, and the proportion of the tertiary industry) for analysis. These factors are directly related to the quality of life of urban residents and the attractiveness of the city. For instance, job opportunities created by economic development can attract population influx, which in turn promotes urban expansion; an increase in income levels may lead to the pursuit of a higher quality of life, thereby affecting the adjustment of urban spatial structure and functional layout. Therefore, this paper selects the 10 aforementioned factors and employs the geographical detector model to explore the driving forces behind the dynamic changes in urban expansion.
Through the aforementioned steps, this paper hopes to clarify the direction of urban development in Xinjiang and the driving factors that influence urban expansion, providing a basis for urban planning in Xinjiang and promoting its sustainable development.
3. Results and Analysis
3.1. Monitoring the Total NTL Value in Xinjiang
3.1.1. Interannual Variations in Total NTL Values in Xinjiang Cities
The TDN was used to quantitatively analyze changes in NTL values of Xinjiang cities from 1992 to 2022 (Figure 4). The cities are divided into three levels based on their brightness value. The total TDN value of the first-level cities (Urumqi City and Karamay City) range from 150,000 to 180,000, which is significantly higher than those of the other cities. The second-level cities include Korla City, Changji City, Hami City, Aksu City, Tacheng City, Turpan City, and Bole City, and the third-level cities include tertiary cities such as Altay City, Kashgar City, Yining City, Artux City, and Hotan City. Tertiary cities tend to be geographically more complex, which restricts the development of the city limits, so their total TDN value is generally lower than 40,000.
The number of cities in Xinjiang and their grades differ between the southern and northern regions, with the degree of urban development in the north being notably higher than that in the south. The calculation results show that there was no significant change in the overall urban pattern of Xinjiang from 1992 to 2022.
Furthermore, the study shows that the total nighttime luminous values of primary cities from 1992 to 2022 increased from below 20,000 to above 180,000, with the growth rate of TDN in Urumqi City reaching 332.89% and that in Karamay City reaching 770.89%. In secondary cities, the TDN of Korla City and Changji City increased from below 7000 to above 70,000, with growth rates reaching 1012.59% and 735.38%, respectively. Tacheng City showed the largest growth rate among secondary cities, reaching 3706.70%. For tertiary cities, Altay City jumped from below 2000 to above 30,000, with a growth rate of 2053.53%, and Artux City had the largest increase in TDN, showing a growth rate of 6494.52%. The rest of the cities also showed high growth rates of minimum 600%.
Figure 4 illustrates the change in total nighttime brightness value across Xinjiang for four different periods during 1992–1997. As can be seen, all of the cities showed a significant increase, indicating high growth. Karamay City had a growth rate of 186.99%, while second-level cities had growth rates exceeding 100%. Notably, the growth rates of Turpan City and Bole City were 258.51% and 235.90%, respectively. Of the tertiary cities, Artux City showed the highest growth rate (230.68%).
During 1997–2007, Xinjiang cities as a whole experienced medium-speed growth, with the exception of Turpan City, Bole City, Kashgar City, Artux City, and Hotan City, whose growth rates topped 100%. The growth of the rest of the cities decelerated. Between 2007–2017, most cities saw a new round of growth, with Urumqi City, for instance, expanding 93.77%. During 2017–2022, the cities showed more moderate growth rates of between 10% and 30%.
3.1.2. Spatial Changes in NTL in Xinjiang Cities
Standard Deviation Ellipses and Changes in the Center of Gravity of Light at Night
In order to understand the spatial change characteristics of nighttime light in Xinjiang’s urban zones, this study constructed a standard deviation ellipse (Figure 5). The results, which included observed changes in the ellipse flatness, center-of-gravity coordinates, and center-of-gravity moving distance, showed that the long axis of the ellipse was distributed in the northeast–southwest direction, indicating that the changes in nighttime light mainly occurred in a northeast–southwest direction. In contrast, the changes in the other directions were relatively balanced.
Furthermore, by calculating each parameter in different time periods (Table 2), the results show that the flatness fluctuated between 0.53 and 0.54 in 2002–2022 and that the spatial location of each urban point was extremely dispersed. There was also an overall trend of increase. Specifically, the total moving distance of the center of gravity of the city was 209.471 km in 1992–2022, of which the farthest moving distance was 50.563 km in 2017–2022, accounting for 24.14% of the total moving distance, followed by 22.22% in 1992–1997. It is worth noting that the center-of-gravity displacement is larger in each successive time period, and that the overall movement of urban development is southwesterly, reflecting the relatively unbalanced development of Xinjiang cities in various stages.
Spatial and Temporal Variations in NTL in Major Cities
Figure 6 depicts the changes in the NTL range of five major cities in Xinjiang from 1992 to 2022. As shown, the TDN of Urumqi City increased by 140,000, with an annual growth rate of 11.10%. The city layout is in the shape of a “T” (i.e., narrow in the south and wide in the north) due to limitations imposed by mountain slopes and water protection in the southern part of the city and the river valley in the central portion. In Karamay City, the TDN increased by 110,000, with an annual growth rate of 25.70%. However, unlike Urumqi City, Karamay’s urban development shows a radial expansion centered on the energy source to a “bead” spatial pattern. The urban space has thus developed in the direction of agglomeration. In Korla City, urban construction entered a period of rapid expansion after the arrival of the Tarim Petroleum Exploration and Development Command in the early 1990s. The TDN has since increased by 70,000 and the annual growth rate is 33.75%.
Yining City is located in the northwestern border of Xinjiang, in the center of the Yili River Valley basin. Because of its favorable location, Yining City is an important international gateway to the west. The annual growth rate of the city’s development from 1992 to 2012 was 16.29%. However, the TDN has since increased by 22,000, with an annual growth rate of 20.64%, thanks to the implementation of the Belt and Road Initiative strategy in 2013. Yining City has established strong connections with surrounding ports, becoming an important bridge for linking and interacting with the economic growth areas of the East Coast and the Caspian Sea. Because the old town is located in the southern part of the city and the northern part can meet the expansion needs of the city, the city limits have a northwest–southeast direction, with a more obvious northwest expansion.
Kashgar City, situated on the far western border of China, is also an important gateway to the west. It serves as a crucial pivot point in the core area of the Silk Road Economic Belt, connecting Central Asia, West Asia, and South Asia. The launching of Counterpart Aid to Xinjiang and Western China 1999 Development Strategy in 1996 led to an increase in TDN of 7100 by 2002 compared to 1992, with an annual growth rate of 29.55%. In 2010, Kashgar City was designated a special economic zone, and a few years later the China–Pakistan Economic Corridor project was proposed, both of which provided the city with a unique advantage in terms of development. Reflecting these changes, Kashgar’s TDN increased by 18,000 from 2002 to 2022, at an annual growth rate of 9.66%. Overall, the past 30 years of development in Kashgar City have increased its TDN by 25,000, at an annual growth rate of 35.32%. It is worth noting that for expansion purposes, the city can only grow in an eastward direction towards the Tarim Basin, as the region is surrounded by mountains to the west, south, and north.
The NTL ranges of the major cities in Xinjiang, as shown in Figure 6, are all expanding in the periphery of the original area. Although the direction and scope of the expansion differs from city to city, demonstrating the uniqueness of urban development in the study region, a certain degree of similarity is also evident. For instance, expansion mainly occurs at the periphery of the original urban areas, and the socioeconomic situation is also gradually strengthening to the periphery.
3.2. Analysis of the Driving Factors of Urban Expansion in Xinjiang
3.2.1. Characteristics and Influence of Temperature Factors in Xinjiang
Temperature Factor Changes in Xinjiang
The interdecadal climate leap refers to the phenomenon of significant differences in statistical characteristics between two stable climate stages. In this study, the sliding average method and the Mann–Kendall test were used to analyze interdecadal changes in temperature in Xinjiang, to identify the years of temperature leap [53], and to determine the degree of influence of temperature elements on urban development. Additionally, mean raster calculation was performed on month-by-month temperature raster data to obtain the corresponding year-by-year temperature data, along with the 5a sliding average temperature. In order to ensure the coherence of the data and to reduce the uncertainty between the datasets, any missing data from 2021 and 2022 were calculated by linear interpolation to obtain the 5a sliding average temperature data for that year.
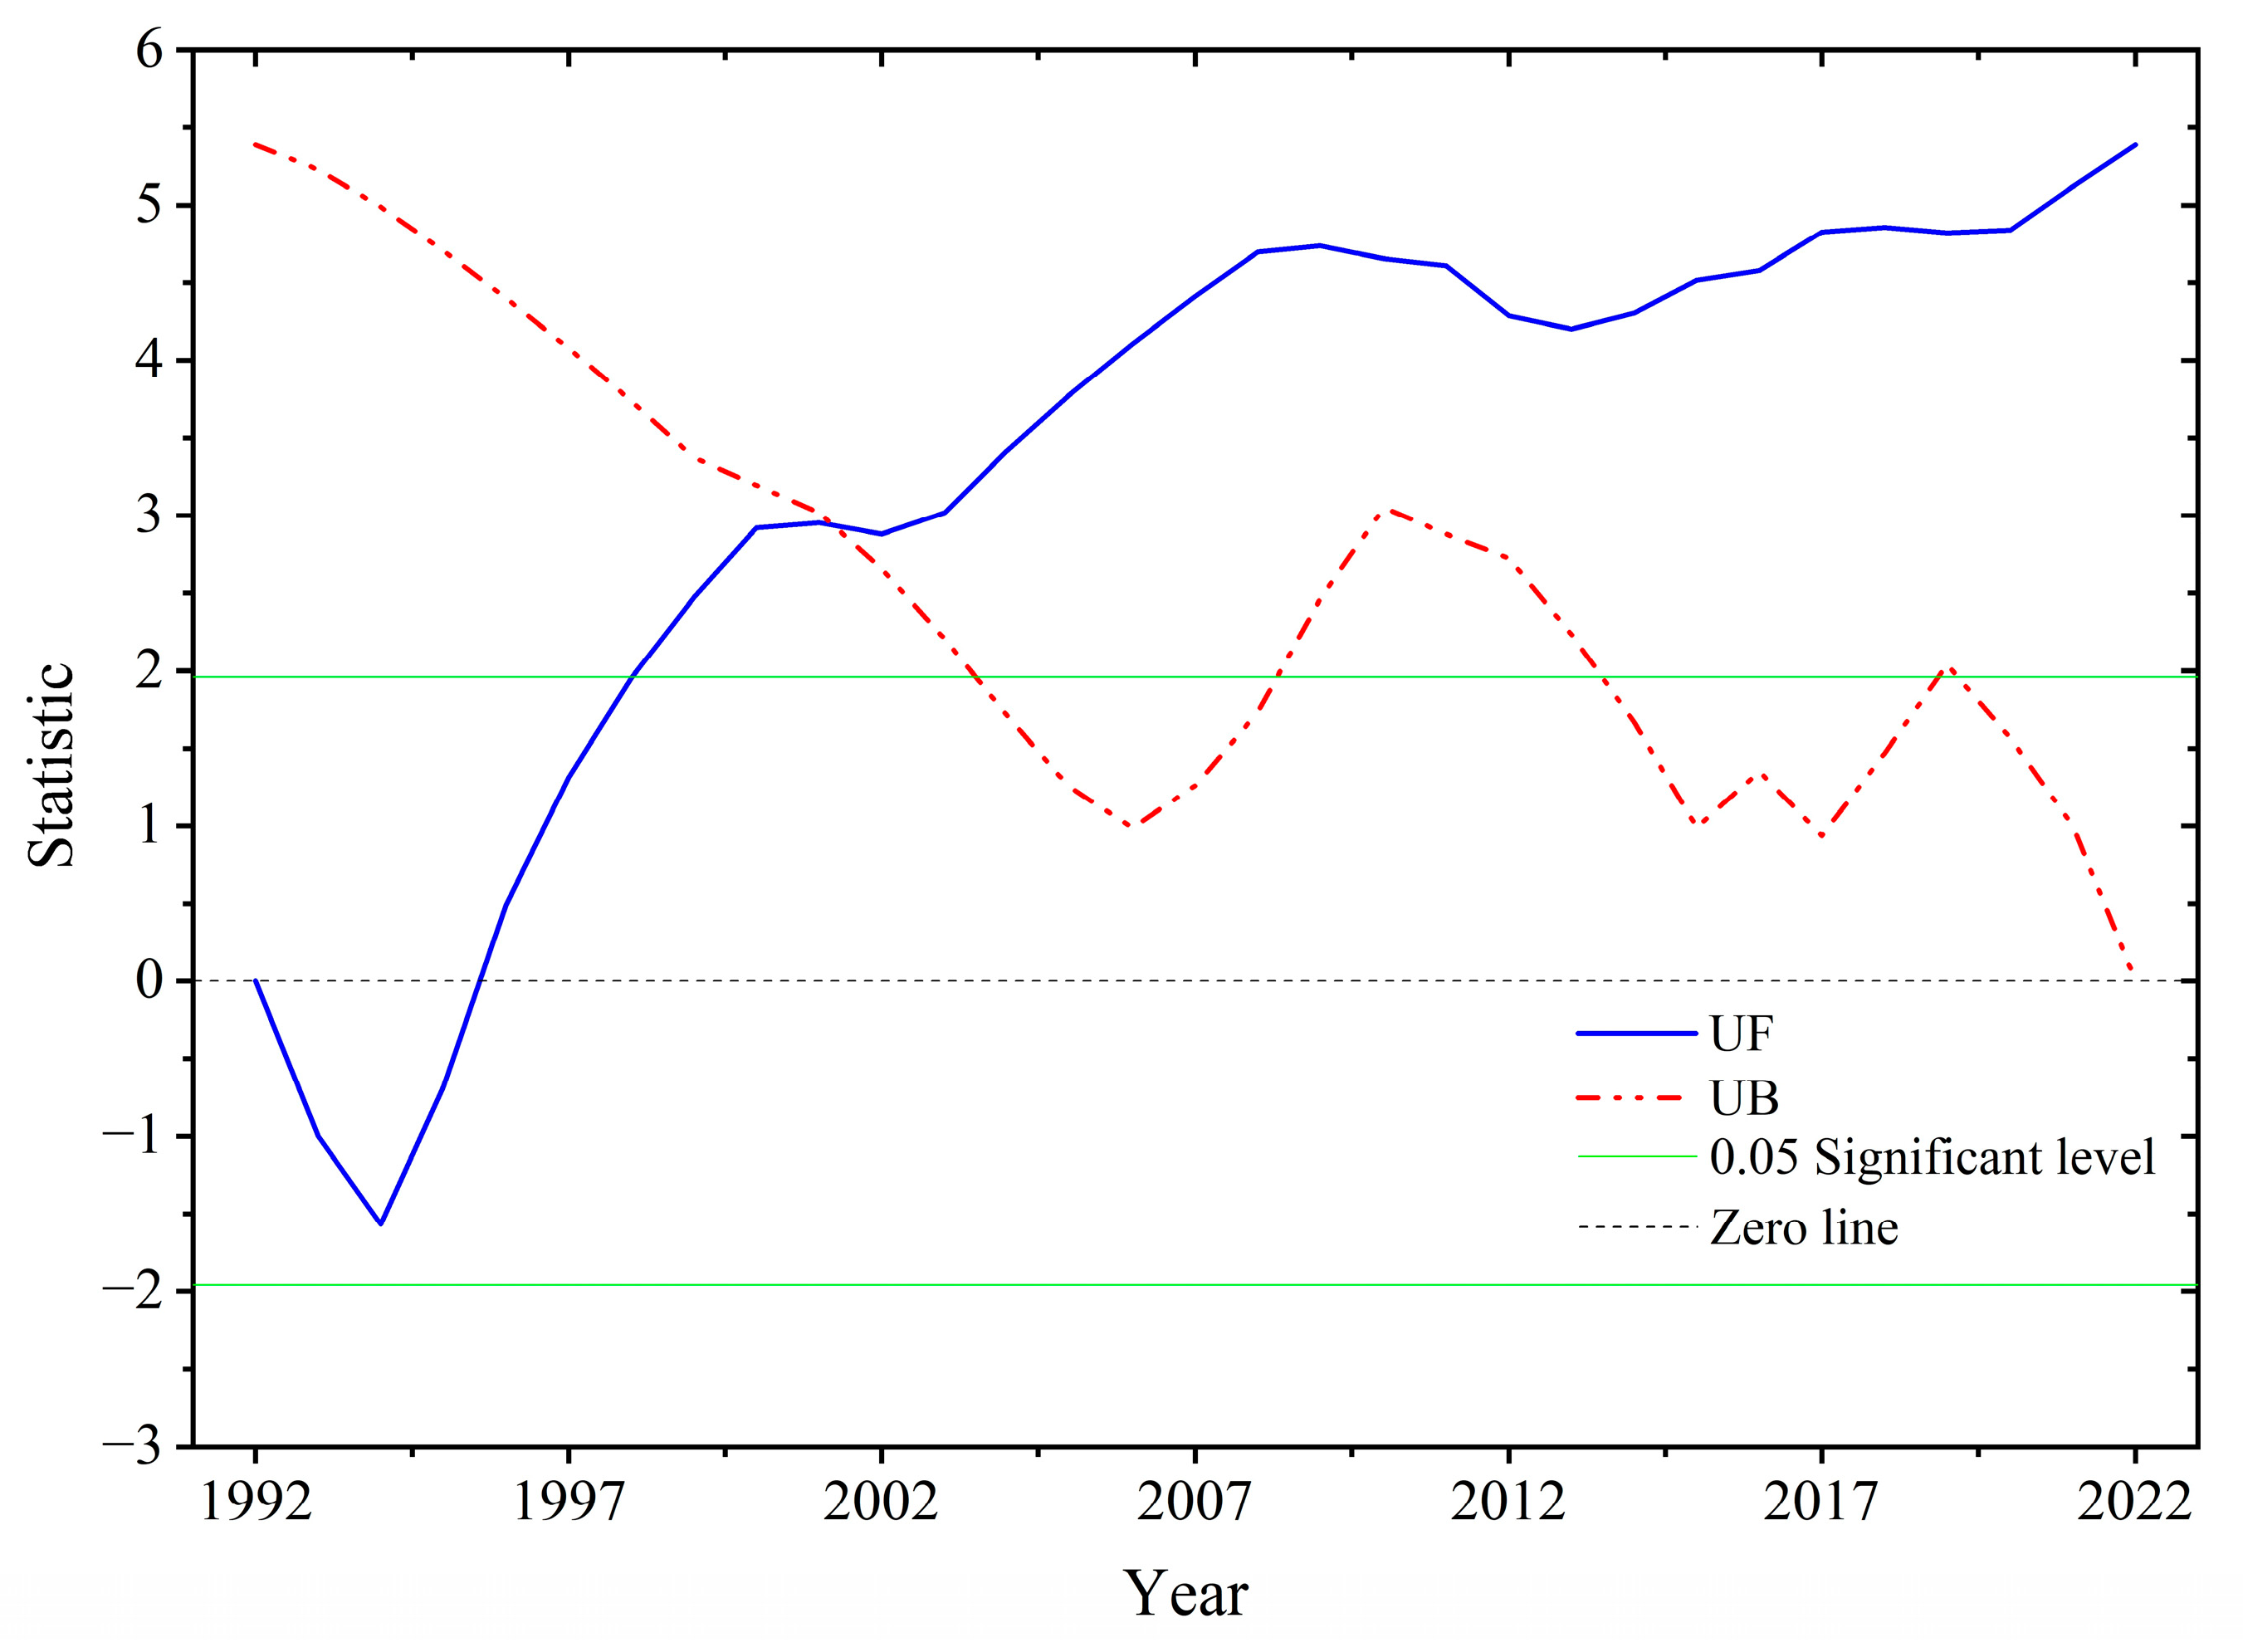
The 5a sliding mean temperature change in Xinjiang (Figure 7) shows an overall fluctuating increase, with an annual mean temperature of 6.08 °C. The difference in temperature change between time periods is more obvious, with an upward trend in 1994–2007 and a downward trend in 2007–2012, after which the temperature rebounds. By observing the changes in the UF curve, it can be seen that the 5a sliding mean temperature traces an upward trajectory from 1997 onward that is particularly significant after 1999.
Furthermore, at the 0.05 confidence level, the intersection of the UF statistical curve and the UB statistical curve shows that the 5a sliding mean temperature in Xinjiang did not have a sudden moment of change and was not abrupt. This indicates that the temperature has been relatively stable over the past 30 years (Figure 8). During this entire period, the temperature has increased by 1.07 °C, at a rate of 0.036 °C/a. More specifically, from 1992 to 2008, the warming rate was 0.062 °C/a, and from 2013 to 2022, the rate was 0.058 °C/a. The lowest temperature of the study period was 5.03 °C, which occurred in 1994. From 1994 to 2008, the temperature was in a warming state, followed in 2009–2012 by a temperature drop of 0.42 °C and a cooling rate of 0.14 °C/a. After that, the temperature gradually recovered, but the warming rate was lower than during 1992–2008.
Spatial Variation in Temperature Elements in Xinjiang
An analysis of the average annual temperature in Xinjiang from 1992 to 2022 (Figure 9a) reveals that, overall, the average temperature in the northern part of Xinjiang is lower than that in the southern part. This is primarily due to the influence of topography, with the northern region exhibiting distinct mountain climate characteristics where temperature decreases with increasing altitude. In contrast, the southern region, with its basin topography, experiences a pronounced heat-retention effect, resulting in generally higher temperatures, among which the Kashgar Administrative Offices and Hotan Administrative Offices areas have relatively higher average temperatures. This study calculates the annual average temperature change rate to measure the speed of temperature change over time, thereby assessing the trend of climate warming or cooling. As can be seen from Figure 9b, Hami City has the highest temperature change rate over the 30 years, at 0.119 °C/a. This is closely related to the increased frequency and significantly enhanced intensity of extreme high-temperature events in Hami City. By analyzing Figure 9c, it is observed that the urban expansion rates in Urumqi City and Changji Hui Autonomous Prefecture in the northern part of Xinjiang are the fastest, at 41.967 km2/a and 39.367 km2/a, respectively. In the southern part of Xinjiang, the Aksu Administrative Offices has the fastest urban expansion rate, reaching 59.167 km2/a. By analyzing the relationship between the annual average temperature change rate and the annual urban expansion speed (Figure 9d) across various regions in Xinjiang, it is noted that regions with higher and lower temperature changes tend to have slower urban expansion. This suggests to some extent that areas with moderate temperatures are more conducive to urban development.
Urbanization Rate and Temperature Change
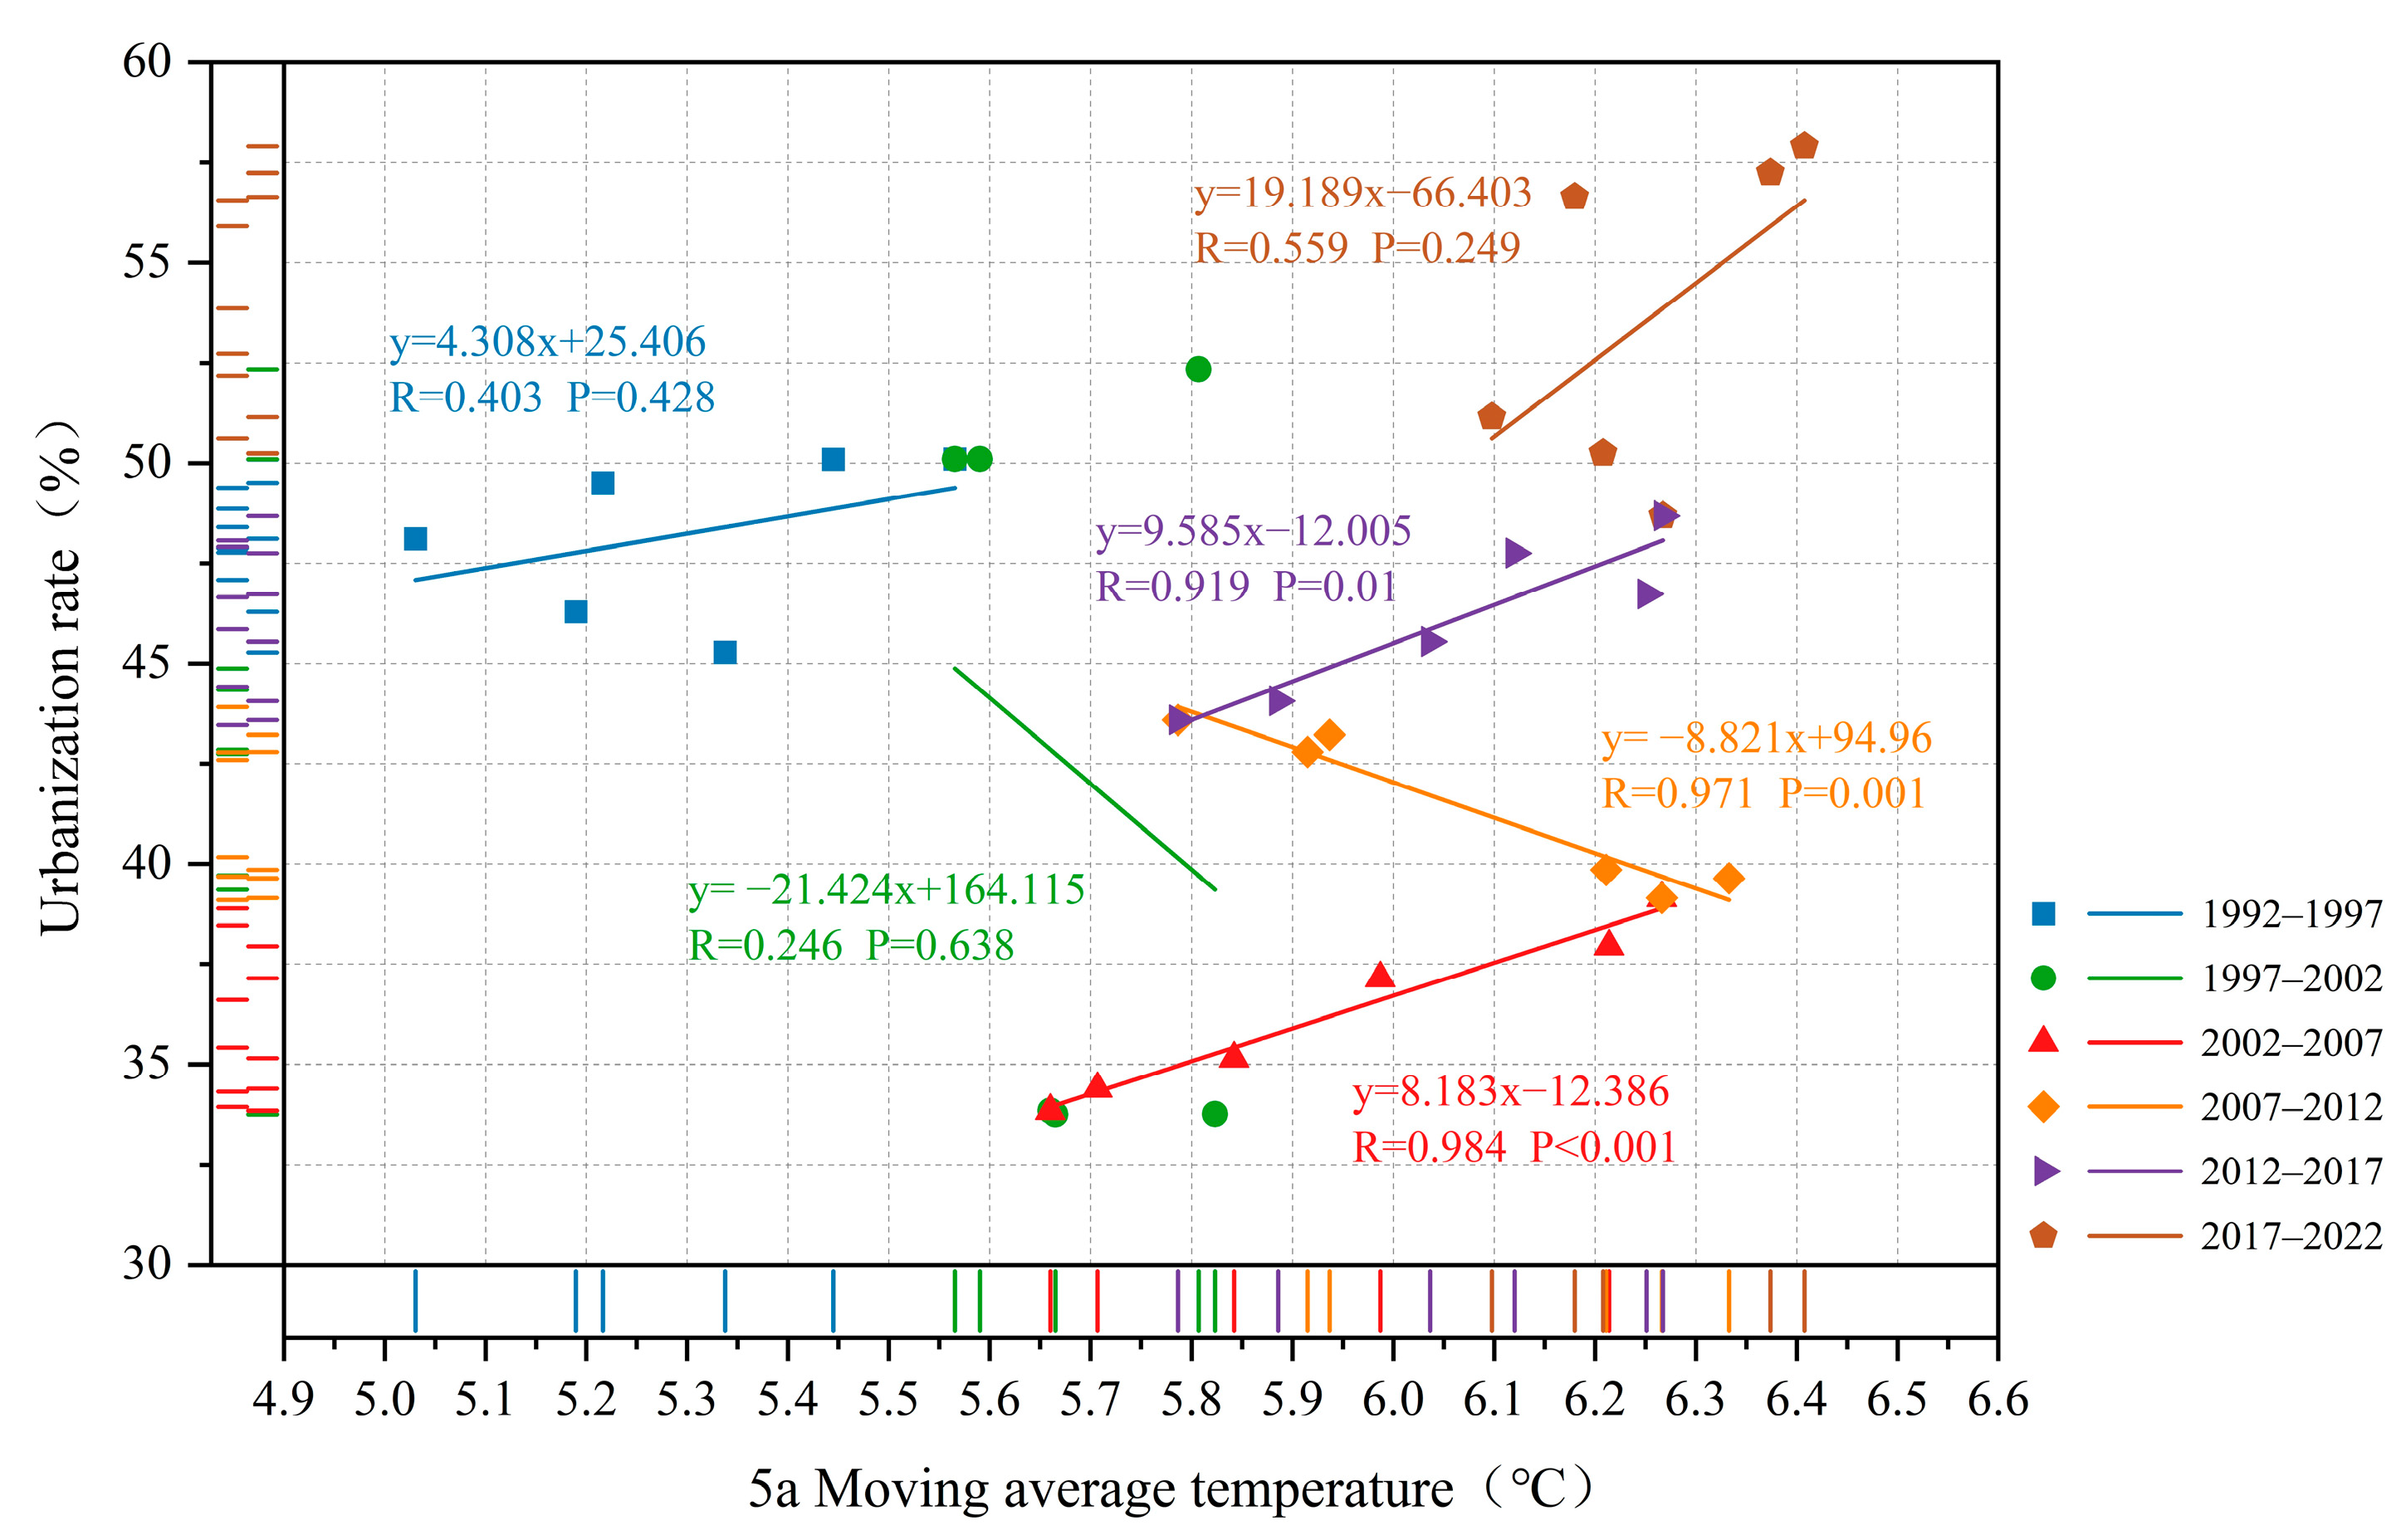
The urbanization rate, a measure of urbanization, can directly reflect the development process of cities. The segmented linear regression method is used to analyze the urbanization rate and 5a sliding average air temperature in Xinjiang (Figure 10), with the results showing that except for 1997–2002 and 2007–2012, there is a positive correlation between the urbanization rate and the 5a sliding average air temperature in other time periods. Furthermore, the two have a high degree of correlation in 2002–2007 and 2012–2017, with the correlation coefficients reaching 0.984 and 0.919, respectively. These two time periods represent a stage of rapid urban development, with correlation coefficients as high as 0.984 and 0.919 and urbanization rate increases of 8.183% and 9.585% for every 1 °C increase in temperature. From this, it is evident that changes in temperature have a significant impact on urbanization rates.
During 1992–1997 and 2017–2022, urbanization rates in Xinjiang have a low correlation with the 5a sliding average temperature, showing correlation coefficients of 0.403 and 0.559, respectively. These rates indicate that changes in temperature during the two time periods have some impact on the increase of urbanization rate. In addition, there is a weak negative correlation between the urbanization rate and the 5a sliding average air temperature in 1997–2002, when the influence of temperature changes on the urbanization rate is weak. However, there is a strong negative correlation in 2007–2012, with a correlation coefficient as high as 0.971. This obviously has a greater influence on changes in the urbanization rate. Overall, temperatures showed a downward trend from 1992 to 2002.
It is worth noting that as temperatures rise, agricultural production and water resources are affected to varying degrees, leading to a decrease in farmers’ income and water resources and an increase in the cost of living in cities. These changes tend to weaken farmers’ incentive to migrate to urban centers. Rising temperatures may also lead to an increase in the number of extreme weather events in a region, with serious impacts on infrastructure and the economy. In 2012, the Chinese government drew an ecological protection “red line” program nationwide, aiming to highlight the importance of environmental management. Since the implementation and promotion of the program in Xinjiang, vegetation coverage has increased, the trend of temperature rise has slowed down, and urban development and the rate of urbanization have increased accordingly.
3.2.2. Characteristics and Influence of Precipitation Factors in Xinjiang
Change Characteristics of Precipitation
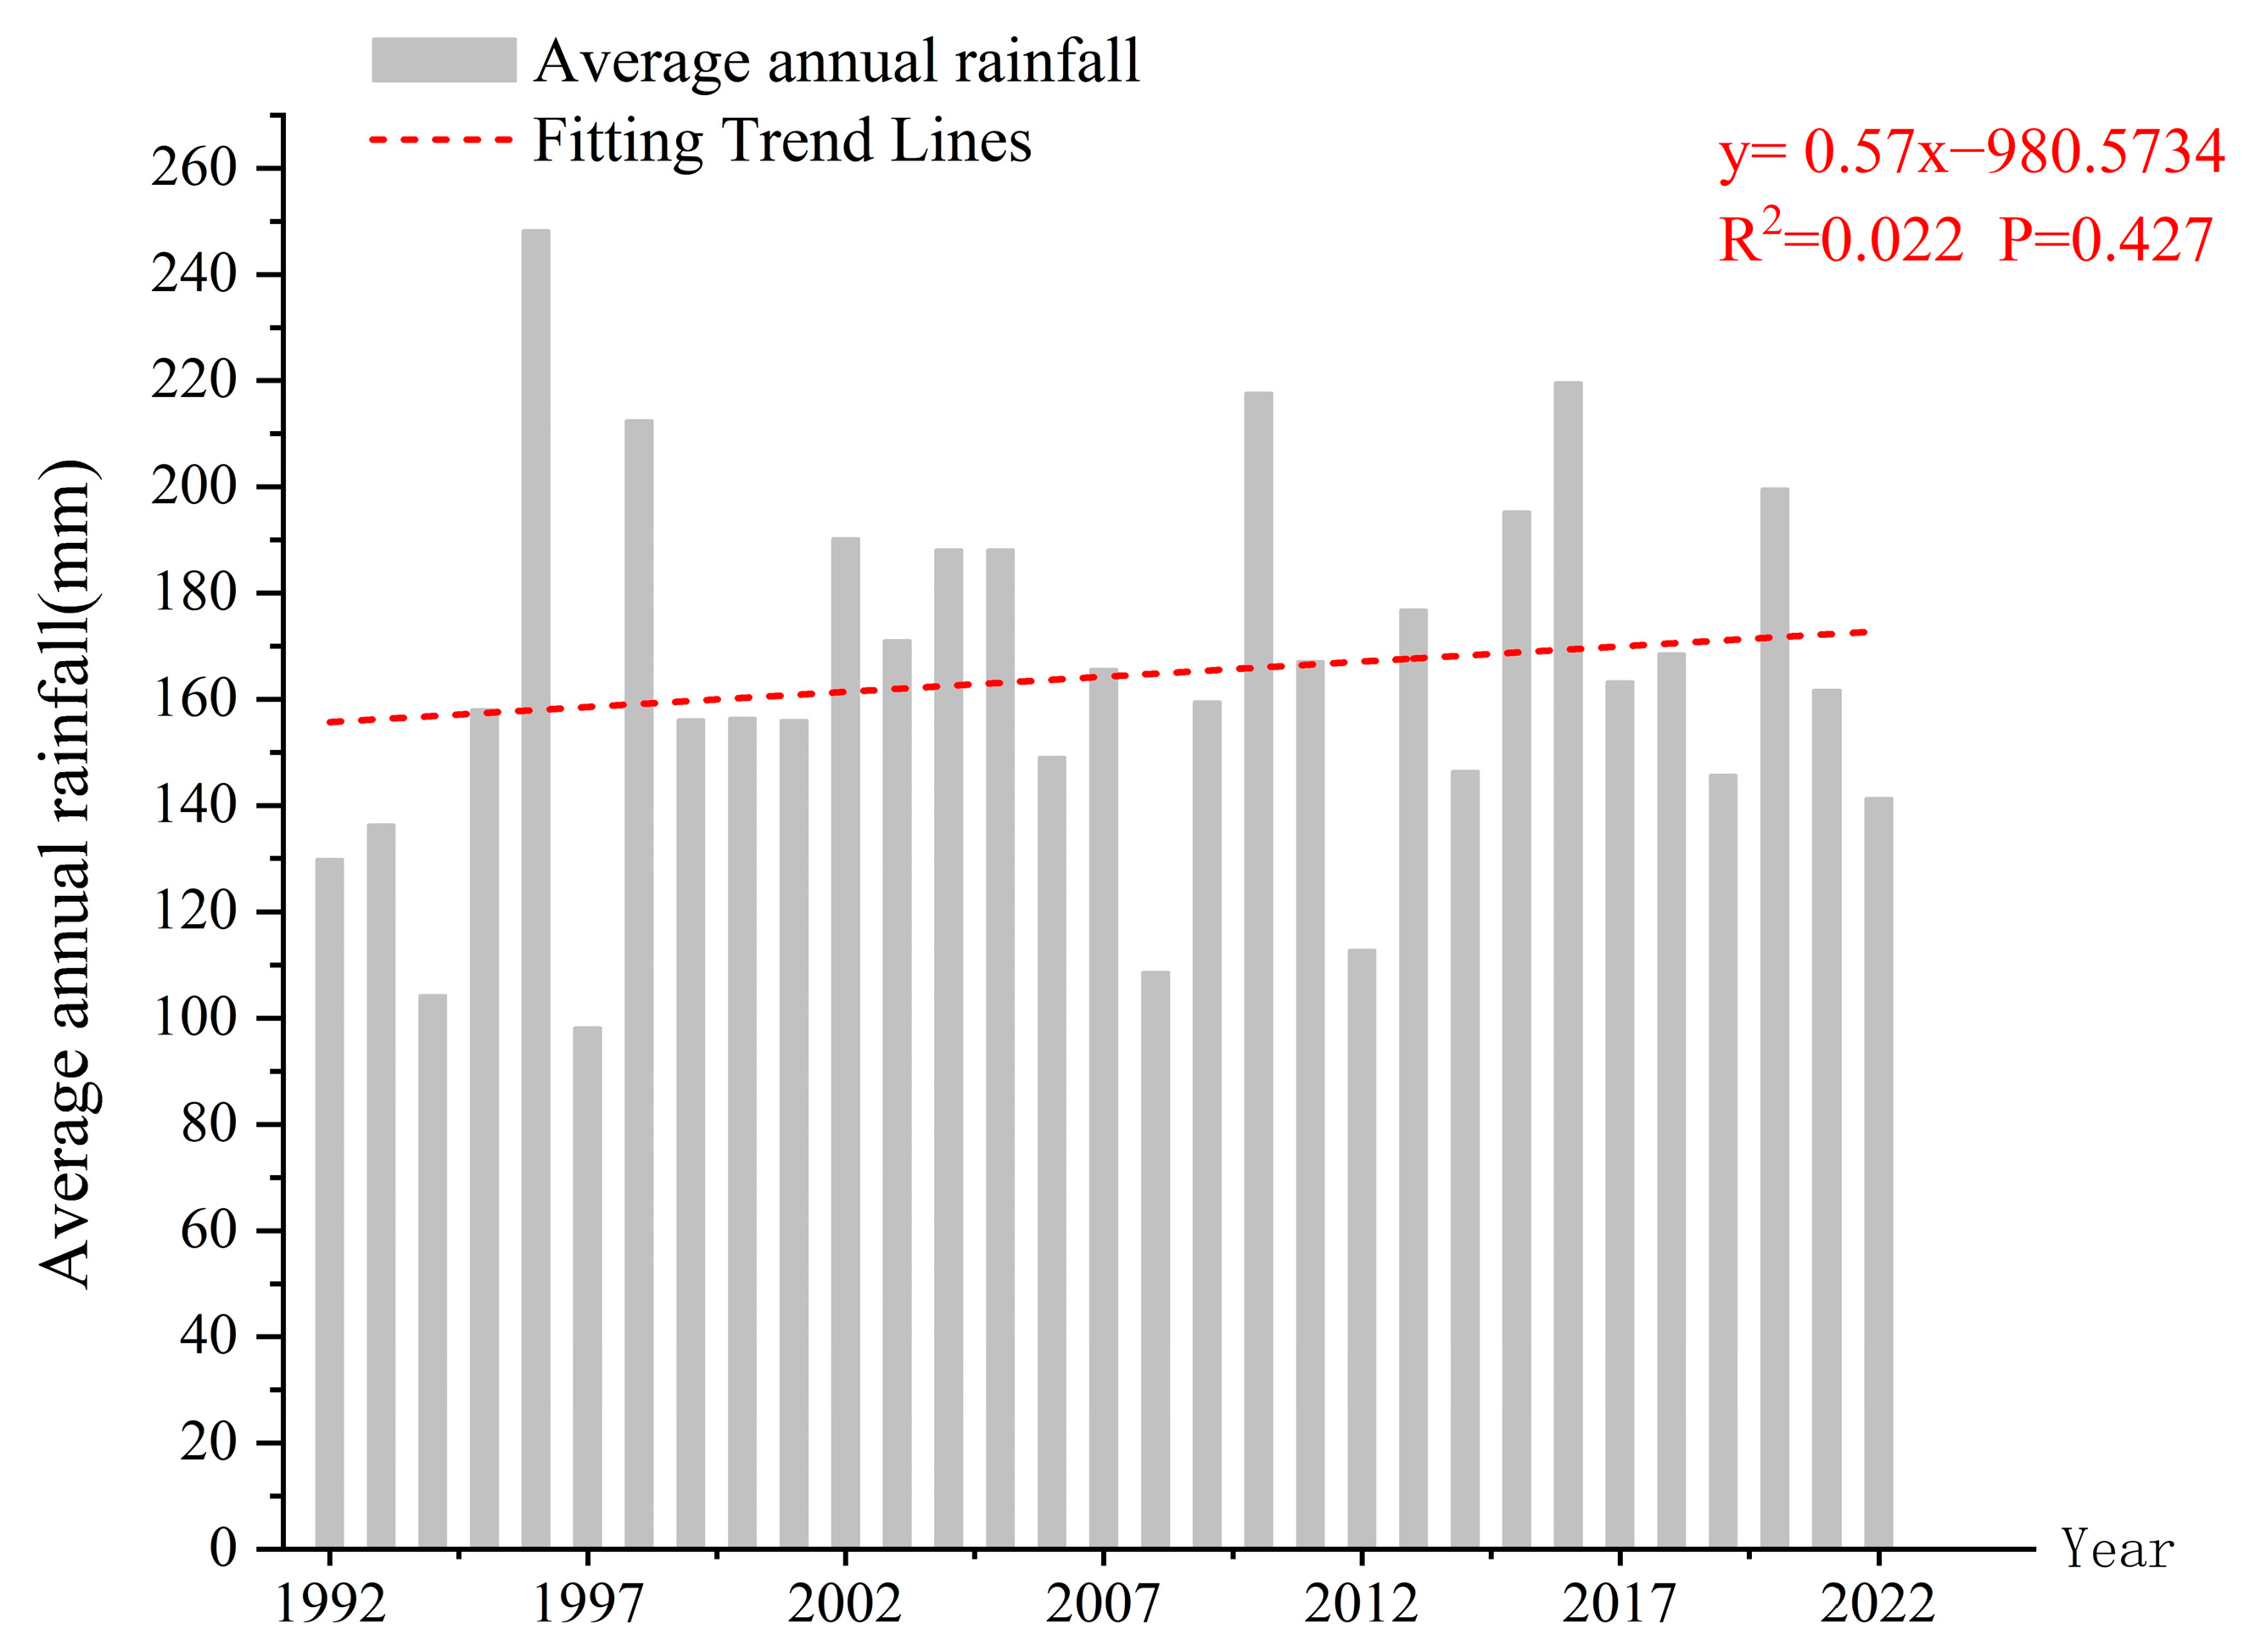
The average annual precipitation in Xinjiang from 1992 to 2022 was 169.72 mm, with an overall fluctuating upward trend and an annual incremental rate of 0.57 mm/a (Figure 11). The changes in the UF curve show a decreasing trend in the average annual precipitation in 1994–1995 as well as an increasing trend both before and after this period. At the 0.05 confidence level, the intersection of the UF and the UB statistical curves clearly indicates that Xinjiang’s average annual precipitation experienced continuous mutation during 1992–1995 (Figure 12). Specifically, the maximum annual average precipitation was 248.22 mm in 1996 and the minimum was 98.2 mm in 1997, with a difference of 150.02 mm between the two years.
Spatial Variation Characteristics of Precipitation Elements
An analysis of the average precipitation in Xinjiang from 1992 to 2022 (Figure 13a) reveals that the northern region of Xinjiang receives more precipitation than the southern region. Within the northern region, the central and western areas receive more rainfall than the eastern part. This is due to the presence of tall mountain ranges such as the Tianshan Mountains in the northern part of Xinjiang. These mountain ranges act as barriers and lift air currents, resulting in higher precipitation levels in the northern areas. The annual mean precipitation change rate refers to the degree or trend of change in annual mean precipitation over a certain time scale. As can be seen from Figure 13b, the annual mean precipitation change rate is generally high in the northwestern region of Xinjiang, with significant variations in precipitation, particularly in the Tacheng Administrative Offices and surrounding areas, where the change is as much as 16.365 mm/a. This is due to the increased intensity of extreme precipitation in the mountainous areas of northern Xinjiang, and the increased frequency of extreme precipitation in the plain areas. The Yili River Valley is a region prone to frequent extreme precipitation events, hence the higher annual precipitation change rate in the northwestern region. By analyzing Figure 13c, the annual precipitation in Urumqi, a city in northern Xinjiang, is relatively sufficient, but the annual precipitation change rate is −6.889 mm/a. This indicates that with the rapid development of the city, the increase in impervious surfaces has affected the retention and evaporation of precipitation. The annual precipitation change rate in the Aksu Administrative Offices of southern Xinjiang is relatively high at 4.877 mm/a. The increase in precipitation has met water resource demands for urban development, thereby promoting urban growth to a certain extent. By analyzing the relationship between the annual precipitation change rate and the annual urban expansion speed (Figure 13d) across various regions in Xinjiang, it is observed that in areas where precipitation has increased, the speed of urban expansion has also tended to increase. The increase in precipitation has, to some extent, improved the water resource supply in the Xinjiang region, providing conditions for urban development.
Urbanization Rates and Changes in Precipitation
During the study period, there are differences in the effects of average annual precipitation on urbanization rates in Xinjiang for different time periods (Figure 14). For example, in 1997–2002 and 2002–2007, the urbanization rates and average annual precipitation were negatively correlated, whereas during other time periods they were positively correlated. The highest degree of correlation occurred in 2012–2017, with a correlation coefficient of 0.589. During that period, the urbanization rate increased by 0.0319% for every 1 mm increase in precipitation, which indicates that changes in precipitation have had an impact on Xinjiang’s urbanization rate. For the two time periods with negative correlation, the correlation reached 0.59 in 2002–2007, indicating that the urbanization rate decreased by 0.0761% for every 1 mm increase in rainfall during this period.
From Figure 14, it is clear that the distribution of data points is messy. The messiness of these data is caused by major fluctuations in precipitation in Xinjiang from year to year. Moreover, extreme drought and heavy rainfall events occurred more frequently, leading to issues such as restrictions on water resource utilization, the deterioration in living conditions in cities, and the obstruction of urban infrastructure construction. All of these challenges affected the development of cities in the region. However, with the promotion and implementation of an ecosystem restoration and protection program, along with water resources management and scheduling and water conservation and management, the efficiency of urban water use has improved, which to a certain extent has facilitated urban development and increased the urbanization rate accordingly.
3.2.3. Analysis of the Driving Force of Urban Expansion Dynamic Change Rate
Factor Detection
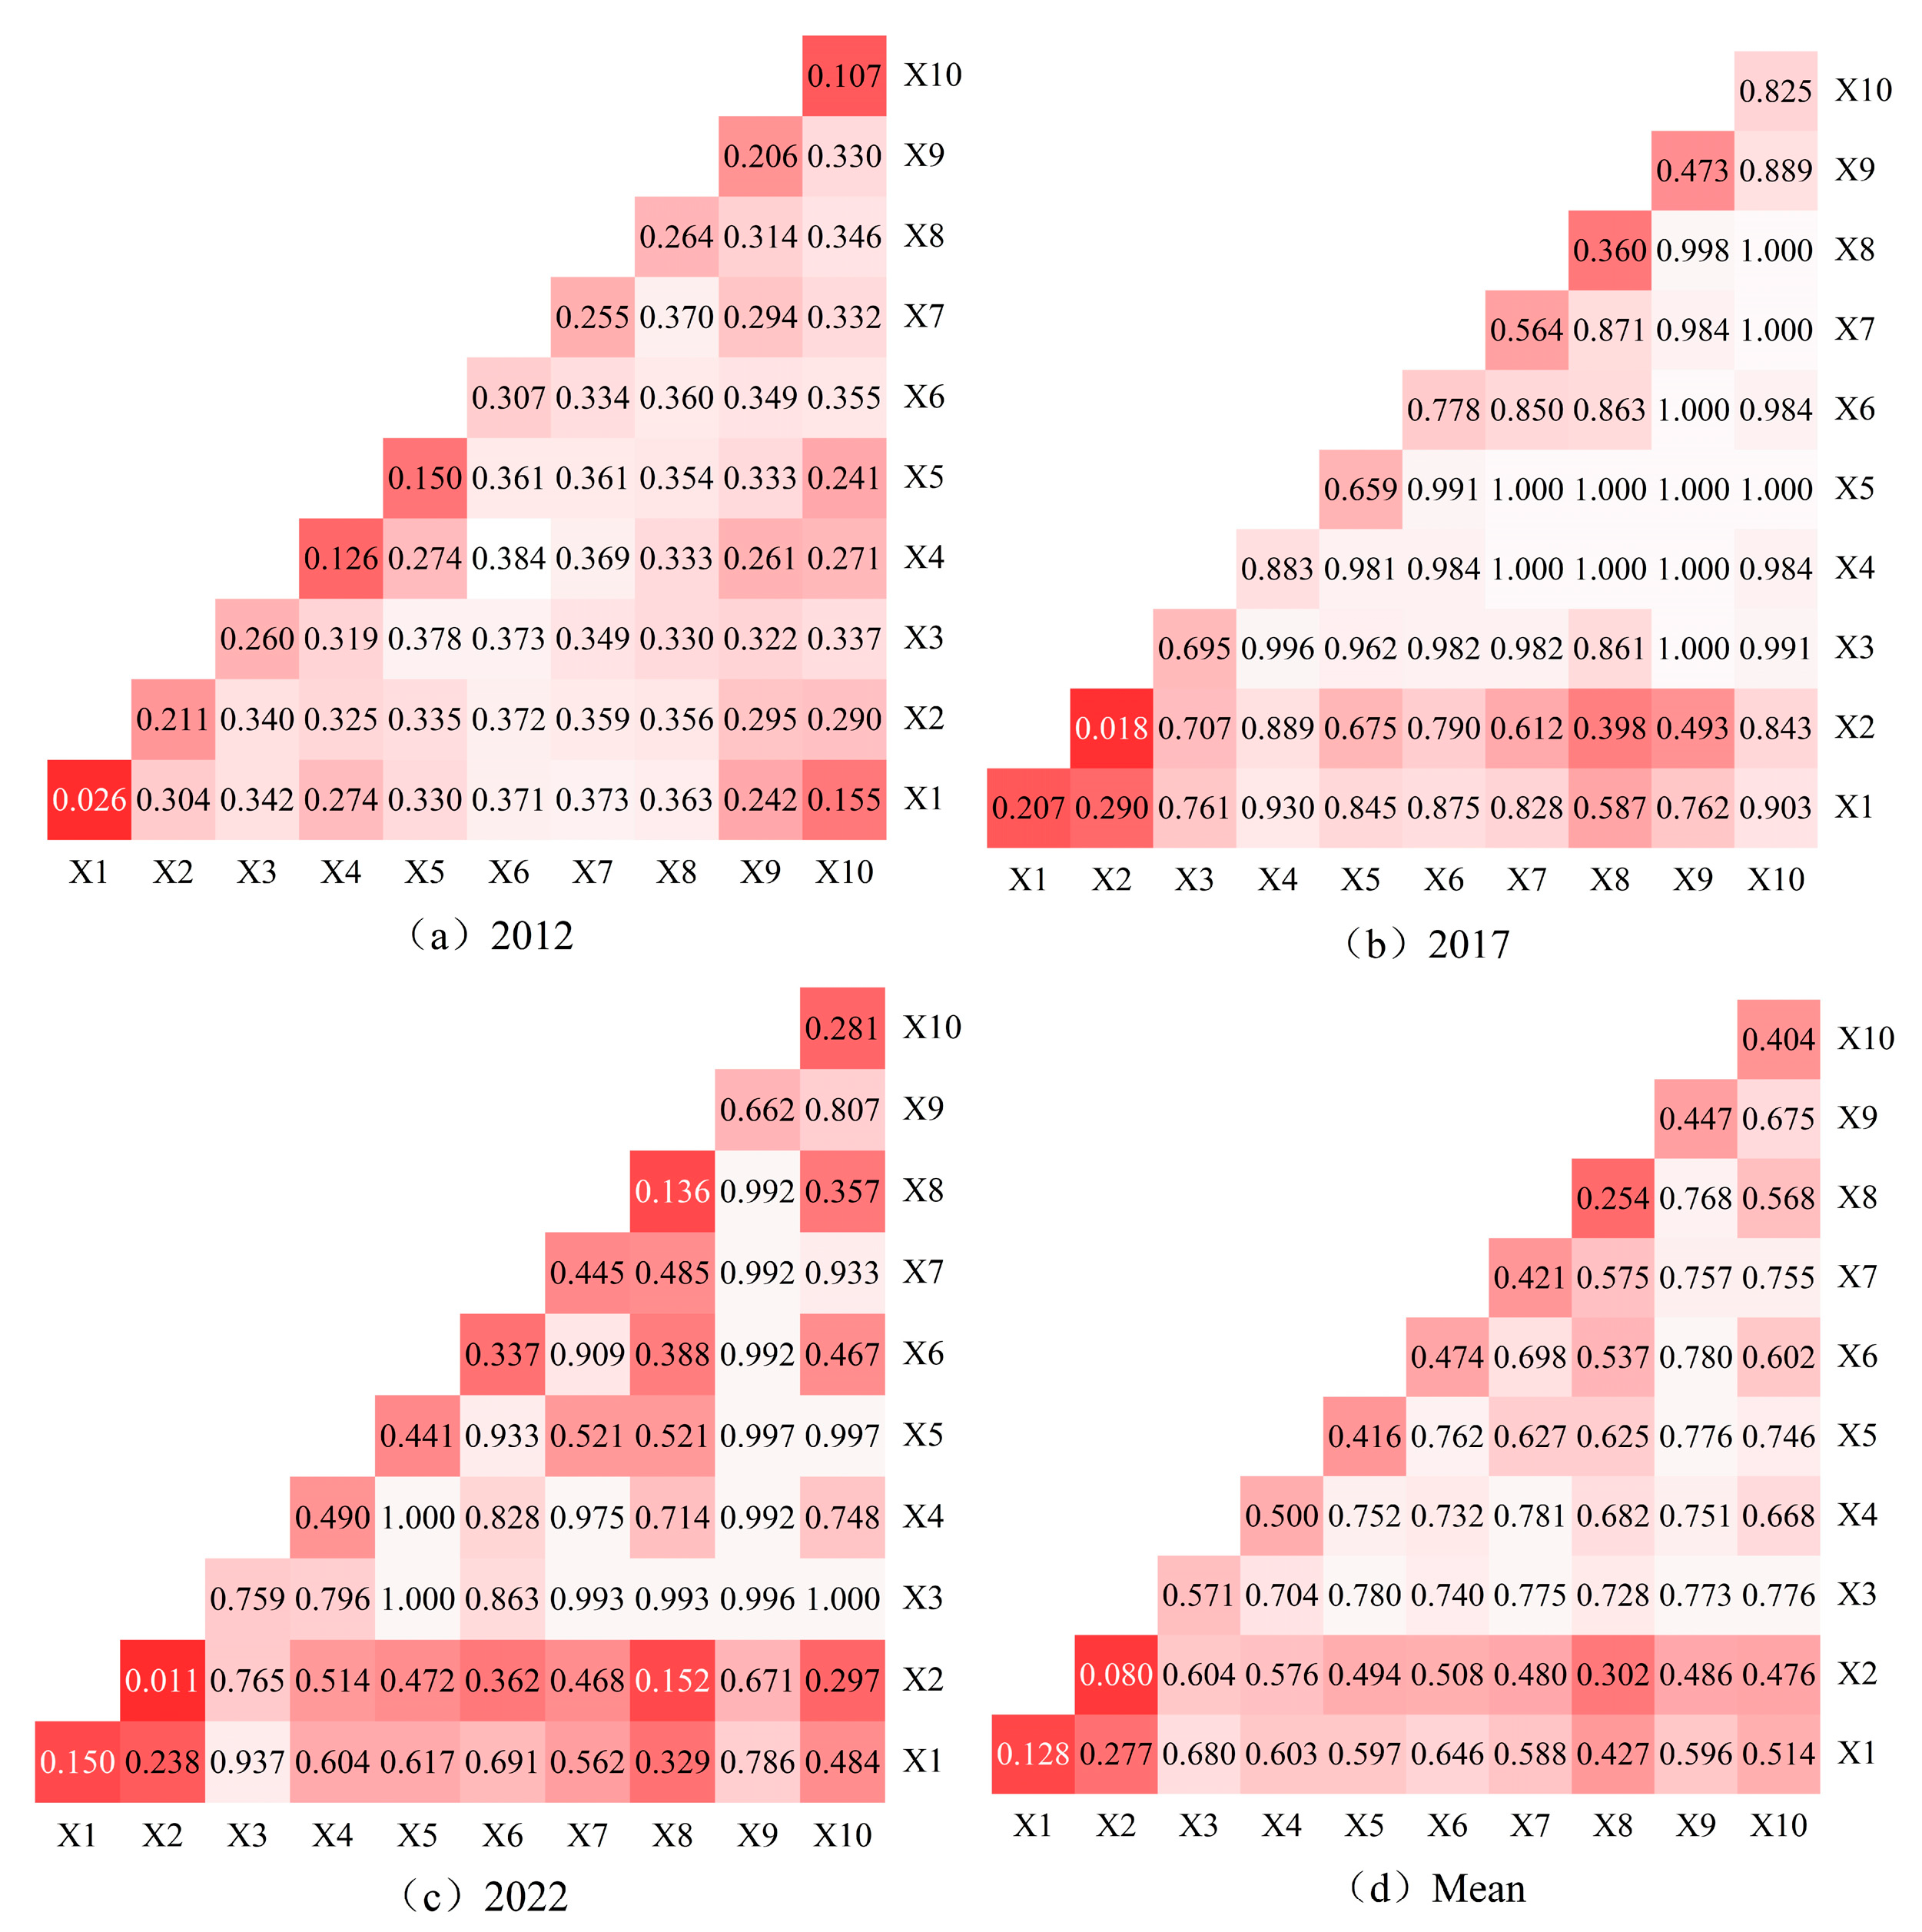
In addition to analyzing the urbanization rate, the study of urban development also needs to explore the temporal and spatial characteristics of urban geospatial changes. To that end, this study analyzes data from 2012, 2017, and 2022 for Xinjiang using a geographical detector to obtain the degree of explanation of the relative magnitude of changes in the urban expansion dynamic change rate by each driving factor in the temporal dimension (Figure 15). The results show that the P-values of all factors is 0, indicating that the results passed the significance test at the 0.05 level and the models are all plausible.
By measuring data from three years (2012, 2017, and 2022), this study found that the selected driving factors have varying degrees of influence on the urban dynamic expansion rate. Xinjiang is a large area with a diversified development pattern over different stages, which means that the influence of each driving factor varies from place to place and year to year. To determine the influence of the factors, the q-statistics for each of the three mentioned years are summed and averaged and then ranked in descending order, as follows: average annual precipitation (X3) > average annual temperature (X4) > GDP (X6) > proportion of secondary industry (X9) > government revenue (X7) > population density (X5) > proportion of tertiary industry (X10) > electricity consumption (X8) > elevation (X1) > slope (X2).
The average values of the q-value statistics of average annual precipitation, average annual temperature, GDP, and the proportion of the secondary industry account for 0.155, 0.135, 0.128, and 0.121 of the total average value of the total influence factors, respectively. These values indicate that precipitation has the greatest impact on the dynamic expansion rate of cities in the study area. The reason for this phenomenon is closely related to the fact that Xinjiang is located in an arid region where water resources are scarce and urban development and expansion scale are limited by water resources. Changes in temperature also play a role in urban expansion. Furthermore, with the implementation of the Western Development and Belt and Road Initiative, Xinjiang, as an important region for exchange and cooperation with neighboring countries, has seen rapid development of its GDP and secondary industry, which further affects the scale of urban expansion in the region.
Interactive Detection
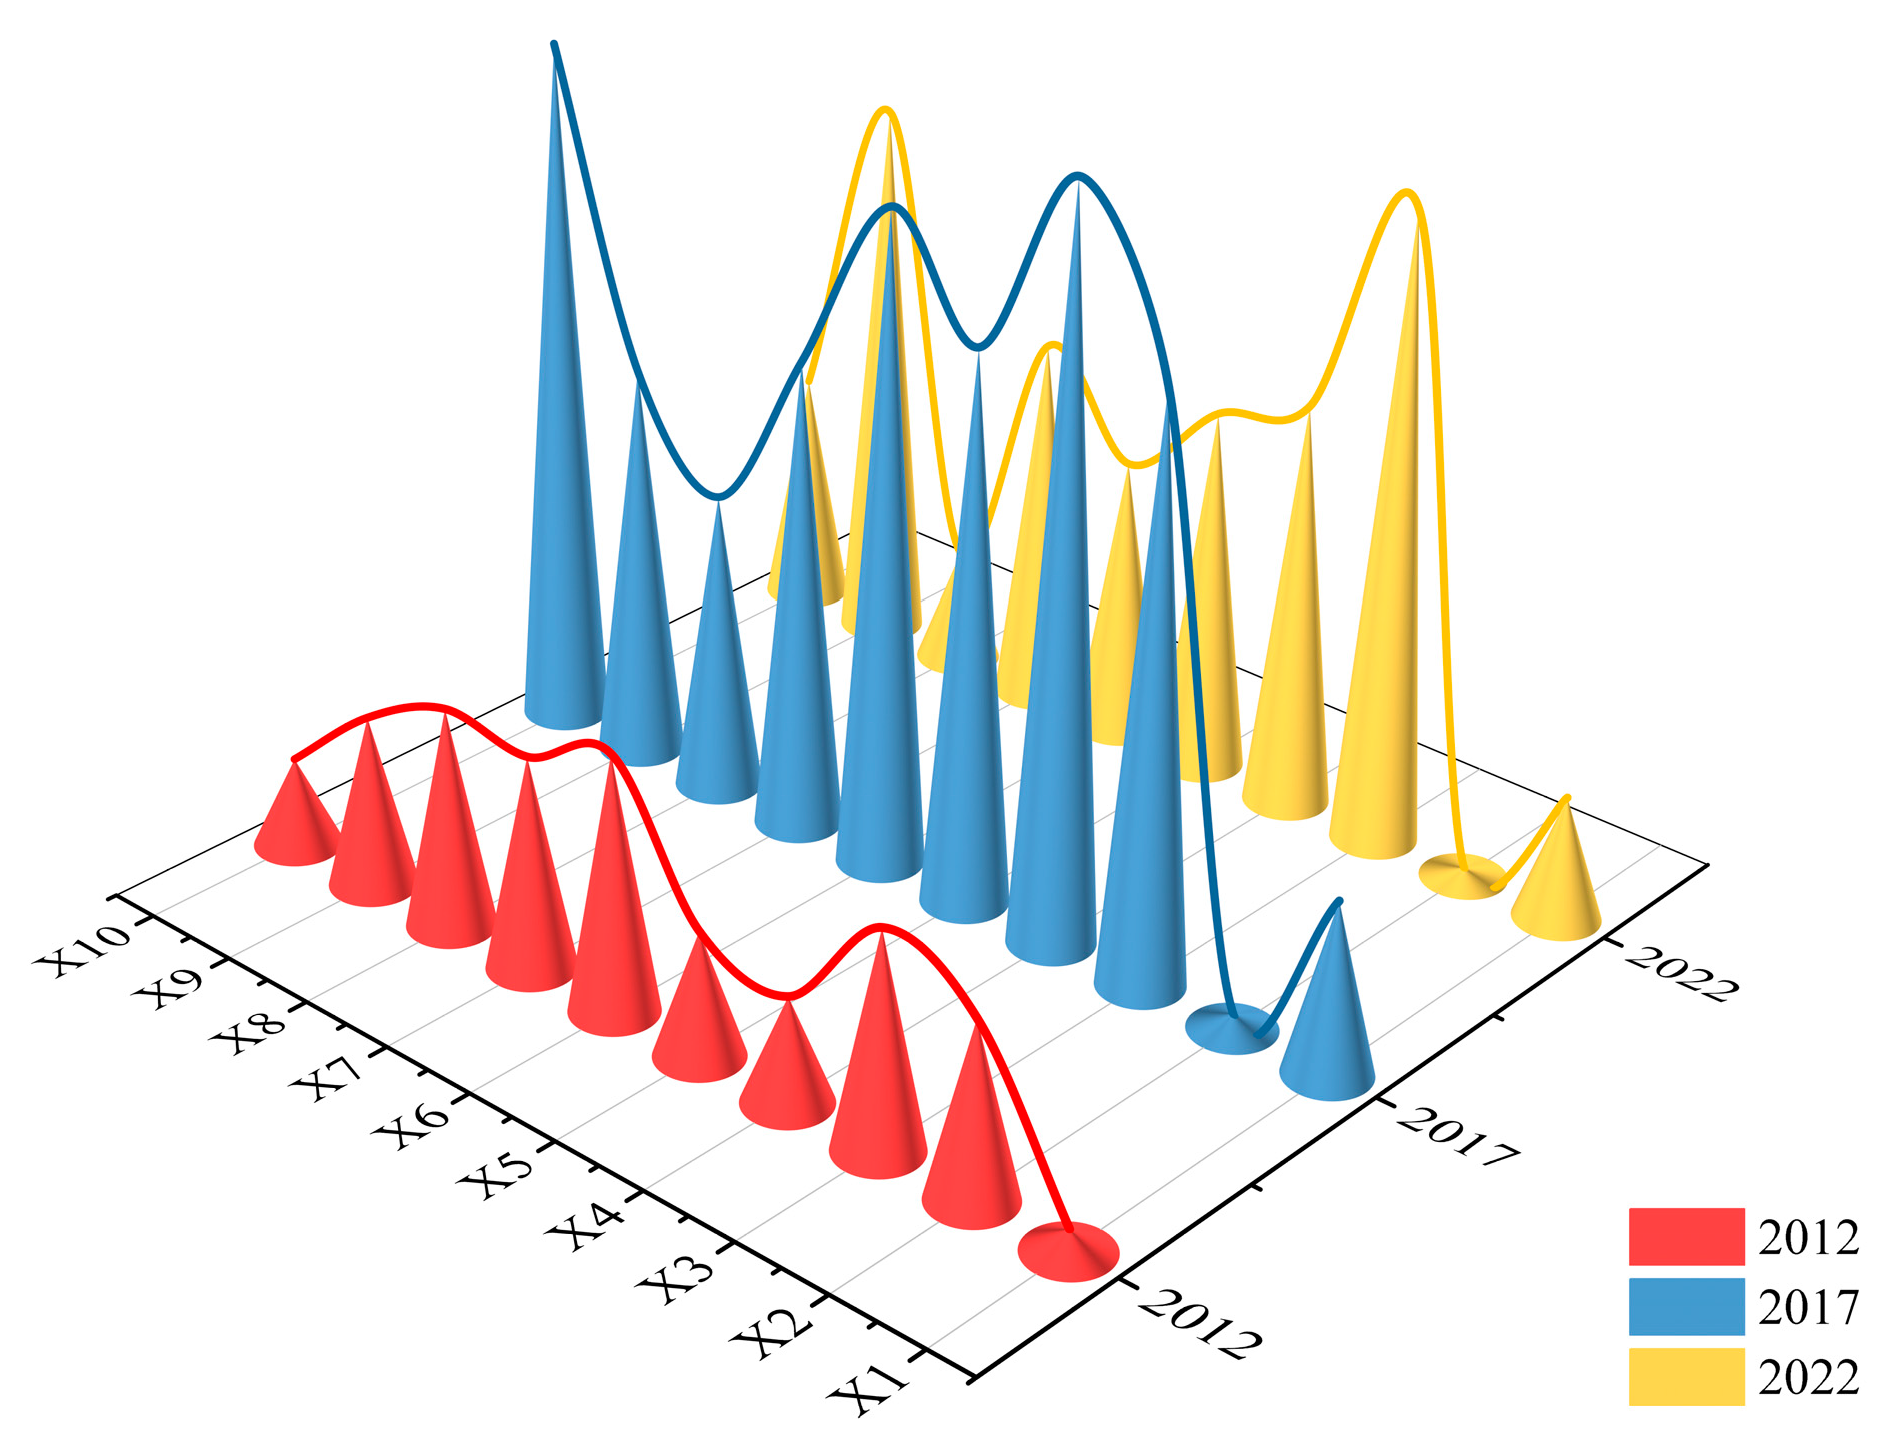
The analysis of the interaction detection results for the driving factors of the urban dynamic expansion rate within the study area indicates that the interactions among the driving factors selected in this paper are primarily characterized by nonlinear enhancement. This indicates that urban expansion is the result of complex coupling between multiple factors, rather than a single factor (Figure 16). From the figure, it can be seen that the interaction between the natural environment factor and the socioeconomic factor is the strongest, but there is also a certain degree of fluctuation in the strength of the interaction between the factors. Overall, the interaction between average annual precipitation (X3) and other factors is generally larger than that of others affecting urban expansion from 2012 to 2022. The strongest interaction, which occurs between average annual precipitation (X3) and GDP (X6), contributes more than the largest single factor (X3), demonstrating that the combined effect of multiple factors has a larger influence than factors in isolation.
Secondly, the interaction between average annual precipitation (X3) and proportion of tertiary industry (X10) and population density (X5) is stronger. Moreover, the contribution rate of the interaction between these factors is higher than that of either factor alone, which indicates that the two sets of interacting factors play a more important role in the expansion of cities in Xinjiang. In addition, the interaction between the natural environment factors and the socioeconomic environment is weaker, but the synergistic enhancement between the two factors also influences the degree of expansion.
4. Discussion
4.1. Advantages and Limitations of NTL in Urban Extraction Studies
Satellite-acquired NTL data are currently being used in a range of urban sprawl correlation studies with socioeconomic variables to identify the developmental relationship between human activities and urban sprawl [54]. Numerous studies have been conducted on relevant anthropogenic or socioeconomic activity aspects affecting urbanization using a single data source, i.e., DMSP-OLS or NPP-VIIRS, within a time series, while the study of urbanization using multiple-source NTL data has yet to be carried out. Whole and two types of luminous remote sensing data provide an effective method for monitoring large-scale dynamic urban expansion, as the extent of a city can be directly discerned by the lighted areas of the image, providing objectivity and consistency in the study data [55].
In the present study, the optimal threshold method is used to extract city limits. During the extraction process, it was found that in the peripheral areas of large cities, due to the influence of the light saturation effect, there exists a certain degree of expansion of the scope of the extracted city compared with the actual city area. Secondly, it was found that the use of satellite imagery for the extraction of city limits produces uncertainty, and the main reasons for this phenomenon are the low spatial resolution, the saturation halo effect caused by lighting, and the lack of an on-board calibration system in both types of data [55,56].
4.2. Characteristics of Urban Development in Xinjiang
China has experienced rapid and large-scale urban expansion since the commencement of its reform and opening-up period [57]. As a frontier region of China, Xinjiang occupies a unique geographic location as the meeting point of different cultures and economic systems, providing a broad space and ample opportunity for urban development. Compared with China’s concentrated urban expansion in the east-central region, the urban spatial and temporal characteristics of urban expansion in Xinjiang are mainly reflected in its increasing scope and is mainly concentrated in the urban agglomeration area.
During the study period, urban expansion in Xinjiang was primarily led by cities with a large base of construction land, with more noticeable expansion in the northern regions, while the southern regions and some border small and medium-sized cities still experienced relatively slow expansion. Because Xinjiang is a typical arid region, the natural environment tends to limit urban expansion to oasis areas scattered throughout the region. According to the results of this study, the northern region of Xinjiang has relatively suitable temperatures and precipitation, which are conducive to the development of agriculture and animal husbandry. These conditions provide a stable supply of materials and a foundation for economic development for urban growth, and hence the development of cities is faster and more concentrated. With the impact of global warming, temperatures in the southern region of Xinjiang have risen to some extent, accelerating the water cycle process and leading to glacier melting, which has increased the region’s water resources. Agricultural resources have also developed accordingly, providing conditions for rapid urban development. Therefore, in the 21st century, the overall trend of urban development in Xinjiang has been expanding towards the southwest direction.
4.3. Relationship between Urban Development and Climate
The relationship between urban development and climate change is a complex and multidimensional issue that not only relates to the sustainable development of cities but also significantly impacts global climate governance. As areas of high concentration of human activities, the patterns and pace of urban expansion directly or indirectly affect the climate system. At the same time, the impacts of climate change on cities are becoming increasingly evident, such as the increase in extreme weather events [58], the rise in sea levels, and the urban heat island effect. These changes pose new challenges to urban planning, infrastructure, and the lives of residents, thereby influencing the development and expansion of cities.
Firstly, the impact of climate on cities is multifaceted. The rise in temperature, changes in precipitation patterns, and the increasing frequency of extreme weather events such as floods, droughts, and heatwaves pose threats to the health of city dwellers, public services, and the urban environment. For instance, Ebi et al. [59] have studied how hot environmental conditions and associated heat stress increase mortality and morbidity rates, with higher levels of global warming posing greater risks. Burrillo et al. [60] focused on Los Angeles County and investigated the impacts of long-term climate warming on extreme high temperatures and their effects on electric power infrastructure. Knapp et al. [61] examined the spatiotemporal dynamics of vegetation in ecologically fragile and climate-sensitive areas in the Hexi Corridor, finding that extreme climates significantly influence vegetation dynamics. To address these challenges, urban planning and management departments need to implement a series of adaptation and mitigation measures to enhance the city’s resilience and recovery capabilities against extreme climate events.
Additionally, the relationship between urban development and climate change also involves socioeconomic factors [62]. The process of urbanization can promote the efficient use of resources and diversification of the economy, thereby enhancing the city’s adaptive capacity. However, rapid urbanization can also lead to spatial inequality, resulting in peripheral urban areas and informal settlements lacking the infrastructure and services to cope with climate change, which to some extent slows down the scale of urban expansion.
Precisely because urban development and climate change influence and constrain each other, this study inherently possesses a certain degree of uncertainty. Secondly, the accuracy, completeness, and temporal span of urban development and climate data will affect the reliability of the research results, and the statistical models employed in this study cannot fully capture the complex interactions between urban systems and climate. Finally, with the increasing frequency of extreme weather events in Xinjiang in recent years, short-term climate events may mask long-term trends, leading to biases in research results. Therefore, in subsequent studies, a variety of climate models and statistical methods will be used to analyze the data, incorporating more climate impact factors. This will enable a more accurate understanding and prediction of the relationship between urban development and climate change in the Xinjiang region, thereby facilitating the development of more effective response strategies.
5. Conclusions and Outlook
5.1. Conclusions
This study analyzes the nighttime light remote sensing data from DMSP-OLS (1992–2013) and NPP-VIIRS (2012–2022) to explore the spatial distribution characteristics of urban dynamic development in Xinjiang, as well as the relationship between climate factors and urban expansion, using various indicators of urban expansion and climate change. The main conclusions are as follows.
- (1)
- Changes in the total nighttime light value: The total nighttime light value of cities in Xinjiang has been increasing year by year, with significant growth rates during the periods of 1992–1997 and 2007–2017. Influenced by the development of cities in southern Xinjiang such as Kashgar City and Korla City, as well as the rapid development of areas in the east like Yining City, the regional center of gravity in Xinjiang has noticeably shifted towards the southwest direction from 2012 to 2022.
- (2)
- Relationship between climate factors and urban development: From 1992 to 2022, the 5-year moving average of annual temperature and annual precipitation in Xinjiang showed an upward trend, with growth rates of 0.036 °C per year and 0.57 mm per year, respectively. With the increase in temperature and precipitation, the urbanization rate in Xinjiang exhibited an upward trend after experiencing fluctuations.
- (3)
- Analysis of influencing factors on urban expansion dynamics: Through the geographic detector model, it was found that both socioeconomic factors and natural environmental factors jointly influence the dynamic changes in urban expansion. In the single-factor detection, precipitation is the main influencing factor, followed by temperature and GDP, with the least impact from slope. In the interaction factor detection, the interactive effect between precipitation and GDP has the greatest influence.
In summary, the increase in economic activities and climate change have, to some extent, influenced the dynamic expansion of cities in Xinjiang. These findings provide an important perspective for understanding the dynamic changes in urban expansion in Xinjiang and offer a basis for the formulation of urban planning and climate adaptation strategies.
5.2. Outlook
Urban dynamic expansion is a development process involving multiple dimensions and levels. For Xinjiang, its unique geographical location, abundant natural resources, diverse cultural heritage, and distinctive socioeconomic structure collectively shape the uniqueness of urban development in this region.
Leveraging the unique geographical advantages as the core area of the Silk Road Economic Belt, there are increased demands for the high-quality development of urbanization in Xinjiang with an open-door approach. The high-quality development of urbanization in Xinjiang faces numerous international complexities. This paper’s analysis of the external driving factors of Xinjiang’s urbanization dynamic expansion is insufficient, and with the influence of the international environment, the uncertainty of the impact of external driving factors on the high-quality development of urbanization in Xinjiang is increasing. This represents the existing challenges in current research and also points to the direction for our future research.
Additionally, Xinjiang has a relatively fragile ecological environment and faces unique challenges in ecological conservation. The balance between urban expansion and the utilization of natural resources requires more attention and research. Therefore, in future research, it is necessary to continuously improve relevant methodologies, expand research perspectives, and conduct further refinement of the driving factors in different prefectures.
Finally, based on the characteristics of urban distribution in Xinjiang, sustainable urban planning strategies should be developed and promoted, encouraging compact urban development models to reduce the encroachment on farmland and natural ecosystems. On this basis, efforts should be gradually directed towards more sustainable and balanced development. Considering the potential impact of climate change on urban dynamic expansion to some extent, the region needs to formulate corresponding adaptive planning measures to enhance the resilience and sustainability of cities.
Author Contributions
Y.W. and Z.L. contributed to the formulation of the research questions; L.W. and W.X. performed the data analysis and writing of the paper; X.X. and H.W. were responsible for data processing and interpretation of the results. Y.W. managed the project and funded this paper. All authors have read and agreed to the published version of the manuscript.
Funding
This research was funded by the Investigation and Research Project on the Current Situation of Terrestrial Ecological Environment of Typical Reservoirs in Xinjiang (grant 2023XJSK06).
Data Availability Statement
The data presented in this study are available on request from the corresponding author. The data are not publicly available due to author privacy.
Conflicts of Interest
The authors declare no conflicts of interest.
References
- Li, L.; Zhan, W.; Hu, L.; Chakraborty, T.; Wang, Z.; Fu, P.; Wang, D.; Liao, W.; Huang, F.; Fu, H.; et al. Divergent urbanization-induced impacts on global surface urban heat island trends since 1980s. Remote Sens. Environ. 2023, 295, 113650. [Google Scholar] [CrossRef]
- Das, M.; Das, A. Dynamics of Urbanization and Its Impact on Urban Ecosystem Services (UESs): A study of a medium-size town in West Bengal, Eastern India. J. Urban Manag. 2019, 8, 420–434. [Google Scholar] [CrossRef]
- Zhang, M.; Du, H.; Zhou, G.; Mao, F.; Li, X.; Zhou, L.; Zhu, D.; Xu, Y.; Huang, Z. Spatiotemporal Patterns and Driving Force of Urbanization and Its Impact on Urban Ecology. Remote Sens. 2022, 14, 1160. [Google Scholar] [CrossRef]
- Li, L.; Zhao, K.; Wang, X.; Zhao, S.; Liu, X.; Li, W. Spatio-temporal evolution and driving mechanism of urbanization in small cities: Case study from Guangxi. Land 2022, 11, 415. [Google Scholar] [CrossRef]
- Fu, S.; Zhang, X.; Kuang, W.; Guo, C. Characteristics of Changes in Urban Land Use and Efficiency Evaluation in the Qinghai-Tibet Plateau from 1990 to 2020. Land 2022, 11, 757. [Google Scholar] [CrossRef]
- Mokhtari, Z.; Amani-Beni, M.; Asgarian, A.; Russo, A.; Qureshi, S.; Karami, A. Spatial prediction of the urban inter-annual land surface temperature variability: An integrated modeling approach in a rapidly urbanizing semi-arid region. Sustain. Cities Soc. 2023, 93, 104523. [Google Scholar] [CrossRef]
- Chu, M.; Lu, J.; Sun, D. Influence of urban agglomeration expansion on fragmentation of green space: A case study of Beijing-Tianjin-Hebei urban agglomeration. Land 2022, 11, 275. [Google Scholar] [CrossRef]
- Vasenev, V.; Stoorvogel, J.; Leemans, R.; Valentini, R.; Hajiaghayeva, R. Projection of urban expansion and related changes in soil carbon stocks in the Moscow Region. J. Clean. Prod. 2018, 170, 902–914. [Google Scholar] [CrossRef]
- Zari, M.P.; MacKinnon, M.; Varshney, K.; Bakshi, N. Regenerative living cities and the urban climate-biodiversity-wellbeing nexus. Nat. Clim. Chang. 2022, 12, 601–604. [Google Scholar] [CrossRef]
- Hao, L.; Chen, X.; Min, C. The impact of urban sprawl and smart city construction on regional coordination. Sci. Program. 2021, 2021, 5589571. [Google Scholar] [CrossRef]
- Krayenhoff, E.S.; Moustaoui, M.; Broadbent, A.M.; Gupta, V.; Georgescu, M. Diurnal interaction between urban expansion, climate change and adaptation in US cities. Nat. Clim. Chang. 2018, 8, 1097–1103. [Google Scholar] [CrossRef]
- Ozturk, U.; Bozzolan, E.; Holcombe, E.A.; Shukla, R.; Pianosi, F.; Wagener, T. How climate change and unplanned urban sprawl bring more landslides. Nature 2022, 608, 262–265. [Google Scholar] [CrossRef]
- Ren, Q.; He, C.; Huang, Q.; Shi, P.; Zhang, D.; Güneralp, B. Impacts of urban expansion on natural habitats in global dry lands. Nat. Sustain. 2022, 5, 869–878. [Google Scholar] [CrossRef]
- Van, V.J. Direct and indirect loss of natural area from urban expansion. Nat. Sustain. 2019, 2, 755–763. [Google Scholar] [CrossRef]
- Wang, X.; Jiang, D.; Lang, X. Future extreme climate changes linked to global warming intensity. Sci. Bull. 2017, 62, 1673–1680. [Google Scholar] [CrossRef]
- Fowler, H.J.; Blenkinsop, S.; Green, A.; Davies, P.A. Precipitation extremes in 2023. Nat. Rev. Earth Environ. 2024, 5, 250–252. [Google Scholar] [CrossRef]
- Yin, Y.Y.; Wang, G.X. Global Climate Change Assessment Methods and Their Applications; Higher Education Press: Beijing, China, 2004. (In Chinese) [Google Scholar]
- Bastos, A.; Ciais, P.; Friedlingstein, P.; Sitch, S.; Pongratz, J.; Fan, L.; Wigneron, J.P.; Weber, U.; Reichstein, M.; Fu, Z.; et al. Direct and seasonal legacy effects of the 2018 heat wave and drought on European ecosystem productivity. Sci. Adv. 2020, 6, eaba2724. [Google Scholar] [CrossRef]
- Kogo, B.K.; Kumar, L.; Koech, R. Climate change and variability in Kenya: A review of impacts on agriculture and food security. Environ. Dev. Sustain. 2020, 23, 23–43. [Google Scholar] [CrossRef]
- Ghaffar, A.; Rahman, M.H.U.; Ahmed, S.; Haider, G.; Ahmad, I.; Khan, M.A.; Afzaal, M.; Ahmed, S.; Fahad, S.; Hussain, J.; et al. Adaptations in Cropping System and Pattern for Sustainable Crops Production under Climate Change Scenarios; CRC Press: Boca Raton, FL, USA, 2022; Volume 10. [Google Scholar] [CrossRef]
- Li, X.; Long, D.; Scanlon, B.R.; Mann, M.E.; Li, X.; Tian, F.; Sun, Z.; Wang, G. Climate change threatens terrestrial water storage over the Tibetan Plateau. Nat. Clim. Chang. 2022, 12, 801–807. [Google Scholar] [CrossRef]
- Lupi, V.; Marsiglio, S. Population growth and climate change: A dynamic integrated climate-economy-demography model. Ecol. Econ. 2021, 184, 107011. [Google Scholar] [CrossRef]
- Ge, S.; Zhan, W.; Wang, S.; Du, H.; Liu, Z.; Wang, C.; Wang, C.; Jiang, S.; Dong, P. Spatiotemporal heterogeneity in global urban surface warming. Remote Sens. Environ. 2024, 305, 114081. [Google Scholar] [CrossRef]
- Shen, P.; Zhao, S.; Ma, Y.; Liu, S. Urbanization-induced Earth’s surface energy alteration and warming: A global spatiotemporal analysis. Remote Sens. Environ. 2023, 284, 113361. [Google Scholar] [CrossRef]
- Wenqian, J.; Guoyu, R.; Fengjun, J.; Jiajun, H.; Panfeng, Z. Spatial-temporal characteristics of the urban heat island effect in Xiamen, China. Urban Clim. 2023, 52, 101725. [Google Scholar] [CrossRef]
- Mathew, A.; Khandelwal, S.; Kaul, N. Analysis of diurnal surface temperature variations for the assessment of surface urban heat island effect over Indian cities. Energy Build. 2018, 159, 271–295. [Google Scholar] [CrossRef]
- Yuan, S.; Ren, Z.; Shan, X.; Deng, Q.; Zhou, Z. Seasonal different effects of land cover on urban heat island in Wuhan’s metropolitan area. Urban Clim. 2023, 49, 101547. [Google Scholar] [CrossRef]
- Liang, P.; Ding, Y. The long-term variation of extreme heavy precipitation and its link to urbanization effects in Shanghai during 1916–2014. Adv. Atmos. Sci. 2017, 34, 321–334. [Google Scholar] [CrossRef]
- Kong, F.; Wang, Y.F.; Fang, J. Spatial Pattern of Extreme Precipitation in China during Summer and Its Response to Urbanization (1961–2010). Resour. Environ. Yangtze Basin 2018, 27, 996–1010. (In Chinese) [Google Scholar]
- Hu, S.; Huang, S.; Hu, Q.; Wang, S.; Chen, Q. An commercial area extraction approach using time series nighttime light remote sensing data—Take Wuhan City as a case. Sustain. Cities Soc. 2023, 100, 105032. [Google Scholar] [CrossRef]
- Stokes, E.C.; Roman, M.O.; Wang, Z.; Kyba, C.C.M.; Miller, S.D.; Storch, T.; Gurney, K.R. Retired satellites: A chance to shed light. Science 2021, 373, 1451–1452. [Google Scholar] [CrossRef]
- Wang, J.; Qiu, S.; Du, J.; Meng, S.; Wang, C.; Teng, F.; Liu, Y. Spatial and temporal changes of urban built-up area in the Yellow River Basin from nighttime light data. Land 2022, 11, 1067. [Google Scholar] [CrossRef]
- Li, Y.; Song, Z.; Wu, B.; Yu, B.; Wu, Q.; Hong, Y.; Liu, S.; Wu, J. Evaluating the Ability of NOAA-20 Monthly Composite Data for Socioeconomic Indicators Estimation and Urban Area Extraction. IEEE J. Sel. Top. Appl. Earth Obs. Remote Sens. 2022, 15, 1837–1845. [Google Scholar] [CrossRef]
- Wu, B.; Yu, B.; Yao, S.; Wu, Q.; Chen, Z.; Wu, J. A surface network-based method for studying urban hierarchies by night-time light remote sensing data. Int. J. Geogr. Inf. Sci. 2019, 33, 1377–1398. [Google Scholar] [CrossRef]
- Ustaoglu, E.; Bovkır, R.; Aydınoglu, A.C. Spatial distribution of GDP based on integrated NPS-VIIRS nighttime light and MODIS EVI data: A case study of Turkey. Environ. Dev. Sustain. 2021, 23, 10309–10343. [Google Scholar] [CrossRef]
- Avtar, R.; Tripathi, S.; Aggarwal, A.K. Assessment of energy-population-urbanization nexus with changing energy industry scenario in India. Land 2019, 8, 124. [Google Scholar] [CrossRef]
- Sahoo, S.; Gupta, P.K.; Srivastav, S.K. Comparative analysis between VIIRS-DNB and DMSP-OLS night-time light data to estimate electric power consumption in Uttar Pradesh, India. Int. J. Remote Sens. 2020, 41, 2565–2580. [Google Scholar] [CrossRef]
- Zhang, S.; Wang, Y.; Xu, W.; Sheng, Z.; Zhu, Z.; Hou, Y. Analysis of Spatial and Temporal Variability of Ecosystem Service Values and Their Spatial Correlation in Xinjiang, China. Remote Sens. 2023, 15, 4861. [Google Scholar] [CrossRef]
- Kang, L.; Xia, S. Study on Urbanization Sustainability of Xinjiang in China: Connotation, Indicators and Measurement. Int. J. Environ. Res. Public Health 2023, 20, 2535. [Google Scholar] [CrossRef]
- Dong, H.; Li, R.; Li, J.; Li, S. Study on urban spatiotemporal expansion pattern of three first-class urban agglomerations in China derived from integrated DMSP-OLS and NPP-VIIRS nighttime light data. J. Geo-Inf. Sci. 2020, 22, 1161–1174. (In Chinese) [Google Scholar]
- Zhang, B.F.; Miao, C.H.; Song, Y.N.; Wang, J.J. Correction of DMSP/OLS stable night light images in China. J. Geo-Inf. Sci. 2020, 22, 1679–1691. (In Chinese) [Google Scholar]
- Li, D.R.; Yu, H.R.; Li, X. The Spatial-Temporal Pattern Analysis of City Development in Countries along the Belt and Road Initiative Based on Nighttime Light Data. Geomat. Inf. Sci. Wuhan Univ 2017, 42, 711–720. (In Chinese) [Google Scholar]
- Zhang, H.T. Research on the Coordinated Development of Xinjiang Military Based on the Three Spaces; Xinjiang University: Urumqi, China, 2022. (In Chinese) [Google Scholar]
- Yang, S.Q.; Wang, J.; Dou, Y.Y.; Luan, Q.; Kuang, W. Spatio-temporal evolution of urbanization and its relationship with regional climate change in Beijing over the past century. Acta Geogr. Sin. 2023, 78, 620–639. (In Chinese) [Google Scholar]
- Zhao, Z.Q.; Luo, H. Analysis of the Evolution of Urban Expansion Patterns in Kunming City Based on Nighttime Light Data. Surv. Spat. Geoinf. 2024, 47, 81–84+88. (In Chinese) [Google Scholar]
- Miao, Q.L.; Ding, Y.Y.; Wang, Y. Impact of climate warming on the distribution of China’s thermal resources. J. Nat. Resour. 2009, 24, 934–944. (In Chinese) [Google Scholar]
- Shi, H.Y.; Wang, G.Q. Impacts of climate change and hydraulic structures on runoff and sediment discharge in the middle Yellow River. Hydrol. Process. 2015, 29, 3236–3246. [Google Scholar] [CrossRef]
- Sen, P.K. Estimates of the regression coefficient based on Kendall’s tau. J. Am. Stat. Assoc. 1968, 63, 1379–1389. [Google Scholar] [CrossRef]
- Zhai, J.; Shao, Q.Q.; Liu, J.Y. Impact analysis of climate change from land use/cover change in Inner Mongolia Plateau. J. Nat. Resour. 2014, 29, 967–978. (In Chinese) [Google Scholar]
- Hu, D.; Meng, Q.; Zhang, L.; Zhang, Y. Spatial quantitative analysis of the potential driving factors of land surface temperature in different “Centers” of polycentric cities: A case study in Tianjin, China. Sci. Total Environ. 2020, 706, 135244. [Google Scholar] [CrossRef] [PubMed]
- Feng, R.; Wang, F.; Wang, K.; Wang, H.; Li, L. Urban ecological land and natural-anthropogenic environment interactively drive surface urban heat island: An urban agglomeration-level study in China. Environ. Int. 2021, 157, 106857. [Google Scholar] [CrossRef]
- Wang, J.F.; Xu, C.D. Geodetector: Principle and prospective. Acta Geogr. Sin. 2017, 72, 116–134. (In Chinese) [Google Scholar]
- Cao, A.L.; Zhang, H.; Zhang, Y.; Ma, W.C. Decadal changes of air temperature in Shanghai in recent 50 years and its relation to urbanization. Chin. J. Geophys. 2008, 51, 1663–1669. (In Chinese) [Google Scholar]
- Fu, H.; Shao, Z.; Fu, P.; Cheng, Q. The Dynamic Analysis between Urban Nighttime Economy and Urbanization Using the DMSP/OLS Nighttime Light Data in China from 1992 to 2012. Remote Sens. 2017, 9, 416. [Google Scholar] [CrossRef]
- Zou, Y.; Peng, H.; Liu, G.; Yang, K.; Xie, Y.; Weng, Q. Monitoring urban clusters expansion in the middle reaches of the Yangtze River, China, using time-series nighttime light images. Remote Sens. 2017, 9, 1007. [Google Scholar] [CrossRef]
- Ghosh, S.; Das, A. Exploring the lateral expansion dynamics of four metropolitan cities of India using DMSP-OLS night-time image. Spat. Inf. Res. 2017, 25, 779–789. [Google Scholar] [CrossRef]
- Fang, C.L. In the past 40 years of reform and opening up, China’s urbanization and urban agglomerations have made important progress and prospects. Econ. Geogr. 2018, 38, 1–9. (In Chinese) [Google Scholar]
- Otto, F.E. Attribution of Extreme Events to Climate Change. Annu. Rev. Environ. Resour. 2023, 48, 813–828. [Google Scholar] [CrossRef]
- Ebi, K.L.; Capon, A.; Berry, P.; Broderick, C.; de Dear, R.; Havenith, G.; Honda, Y.; Kovats, R.S.; Ma, W.; Malik, A.; et al. Hot weather and heat extremes: Health risks. Lancet 2021, 398, 698–708. [Google Scholar] [CrossRef] [PubMed]
- Burillo, D.; Chester, M.V.; Pincetl, S.; Fournier, E. Electricity infrastructure vulnerabilities due to long-term growth and extreme heat from climate change in Los Angeles County. Energy Policy 2019, 128, 943–953. [Google Scholar] [CrossRef]
- Knapp, A.K.; Beier, C.; Briske, D.D.; Classen, A.T.; Luo, Y.; Reichstein, M.; Smith, M.D.; Smith, S.D.; Bell, J.E.; Fay, P.A.; et al. Consequences of more extreme precipitation regimes for terrestrial ecosystems. Bioscience 2008, 58, 811–821. [Google Scholar] [CrossRef]
- Brelsford, C.; Lobo, J.; Hand, J.; Bettencourt, L.M.A. Heterogeneity and scale of sustainable development in cities. Proc. Natl. Acad. Sci. USA 2017, 114, 8963–8968. [Google Scholar] [CrossRef]
Figure 1.
Study area map of Xinjiang (a); DEM elevation map of Xinjiang (b); administrative division map of Xinjiang in 2023 (c) (revision GS (2023) 2767).
Figure 1.
Study area map of Xinjiang (a); DEM elevation map of Xinjiang (b); administrative division map of Xinjiang in 2023 (c) (revision GS (2023) 2767).
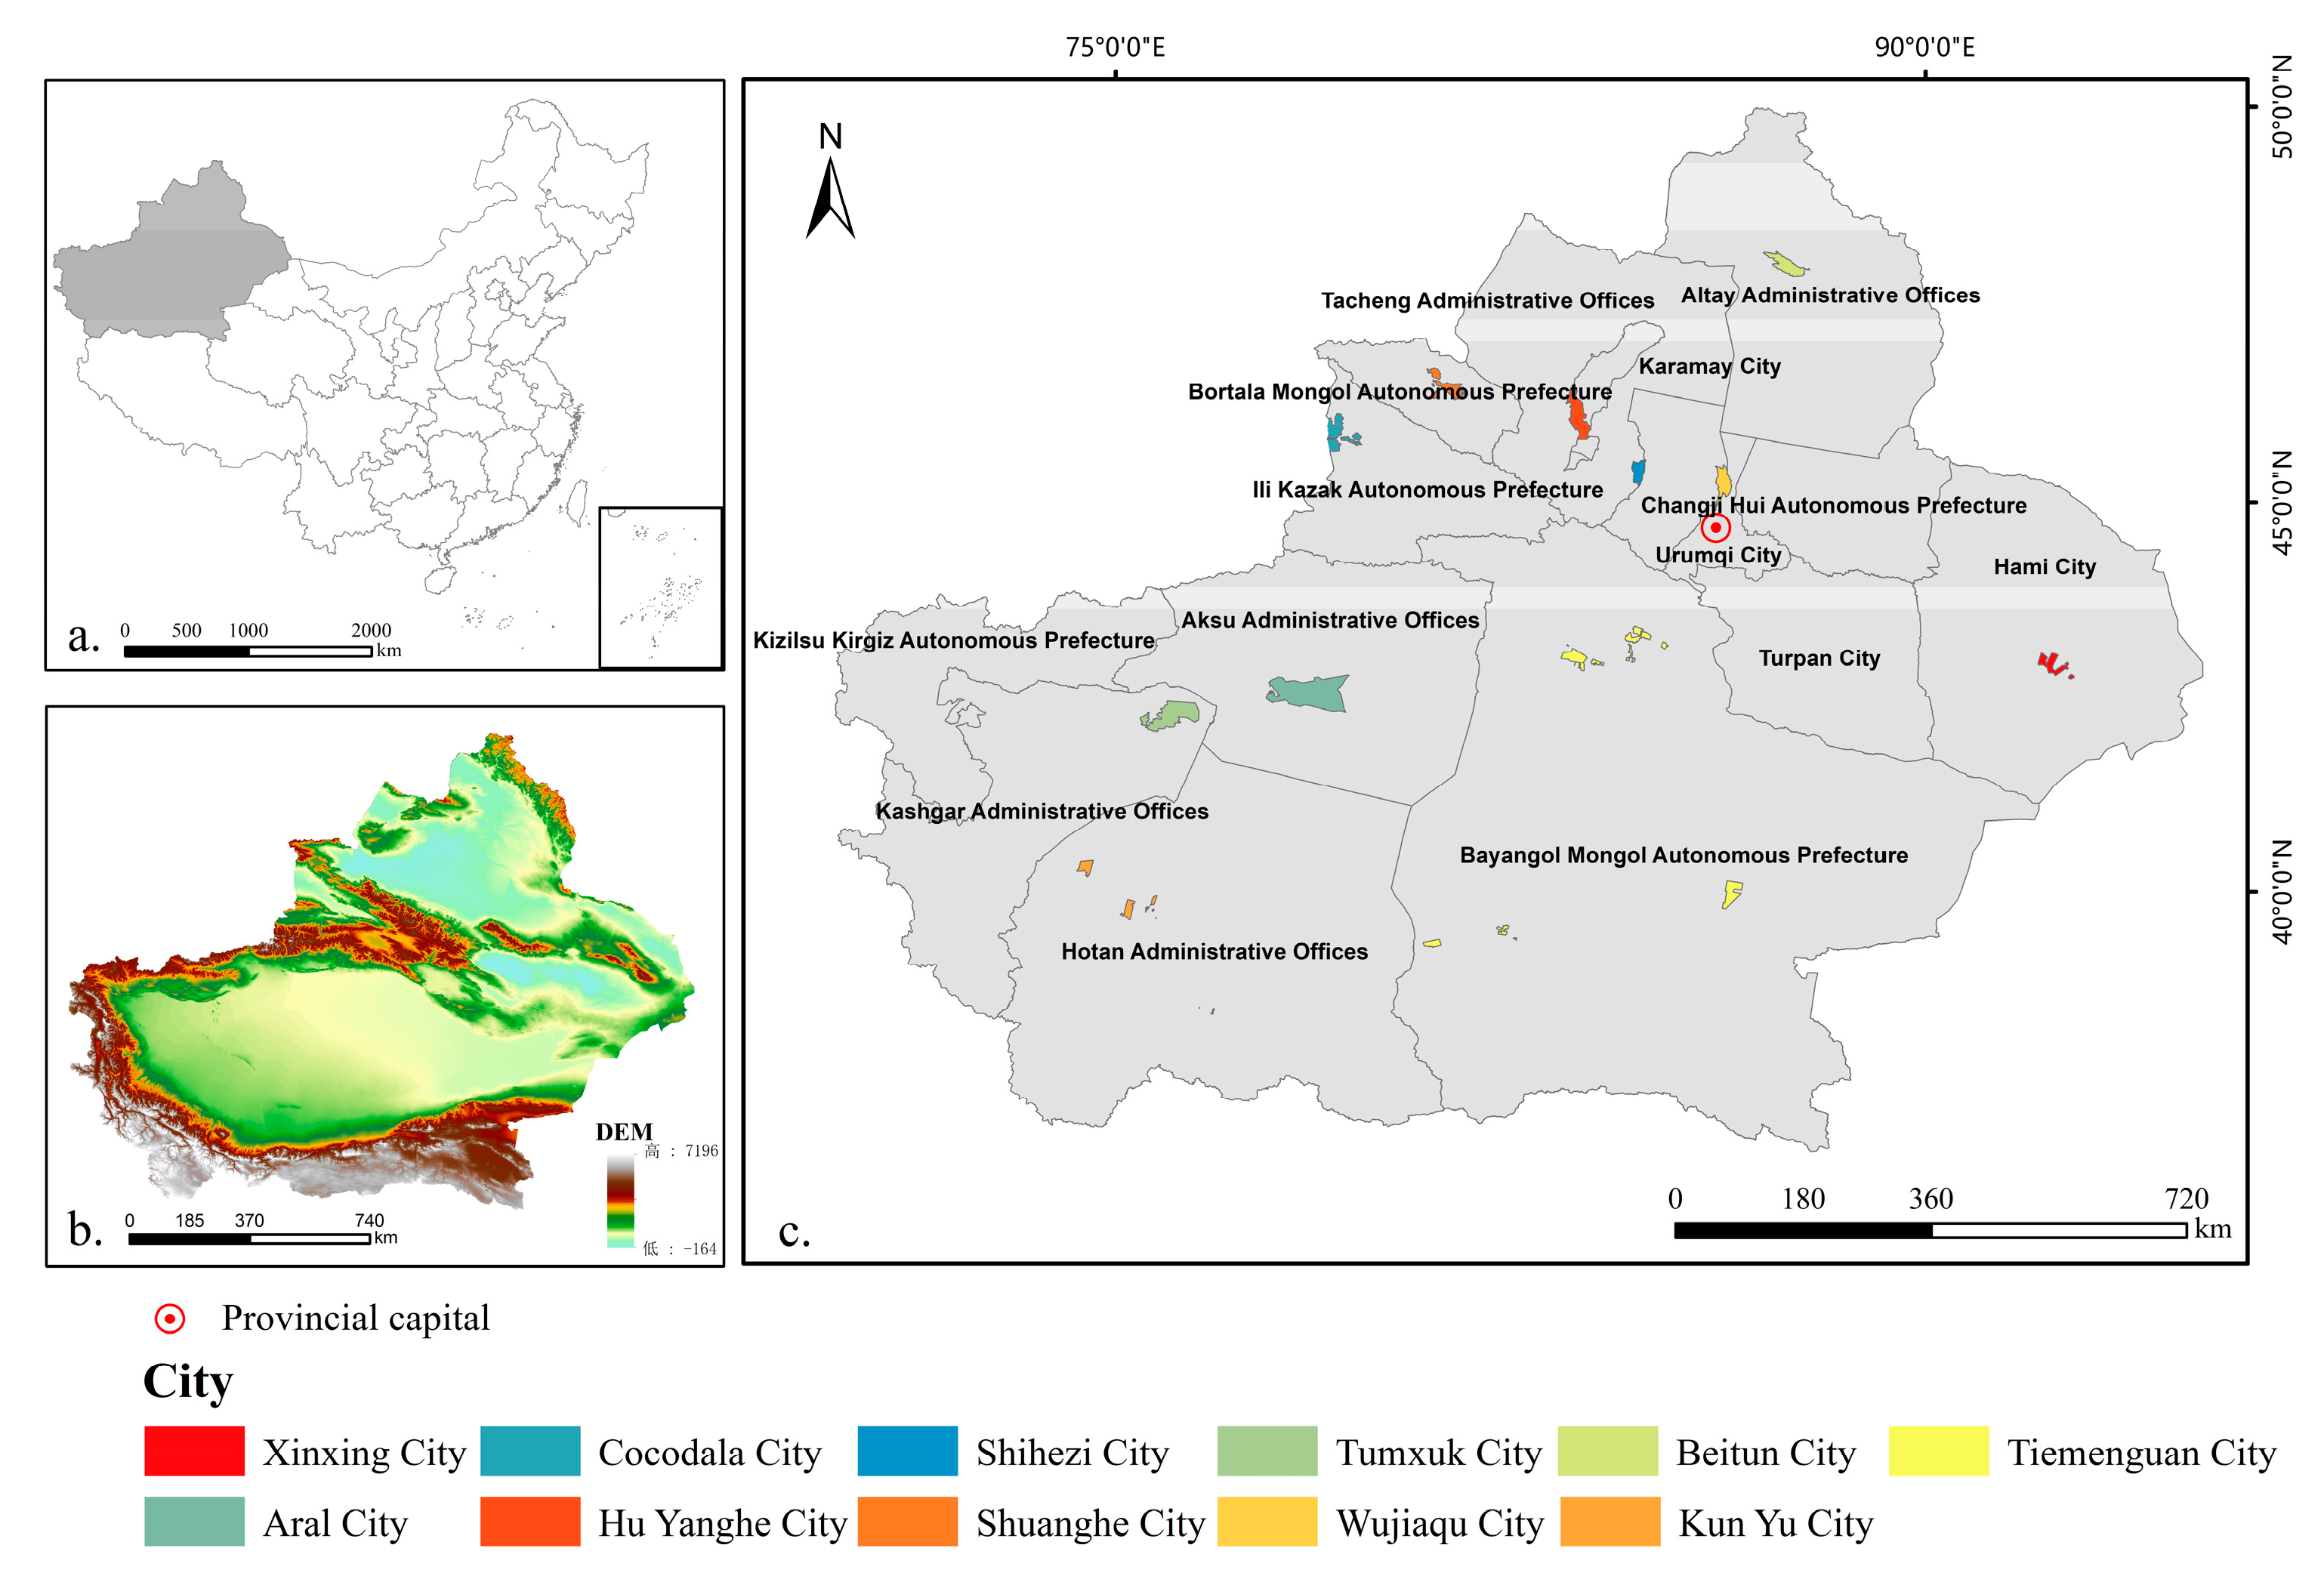
Figure 2.
Long-sequence NTL integration data in Xinjiang from 1992–2022.

Figure 3.
Technical roadmap.
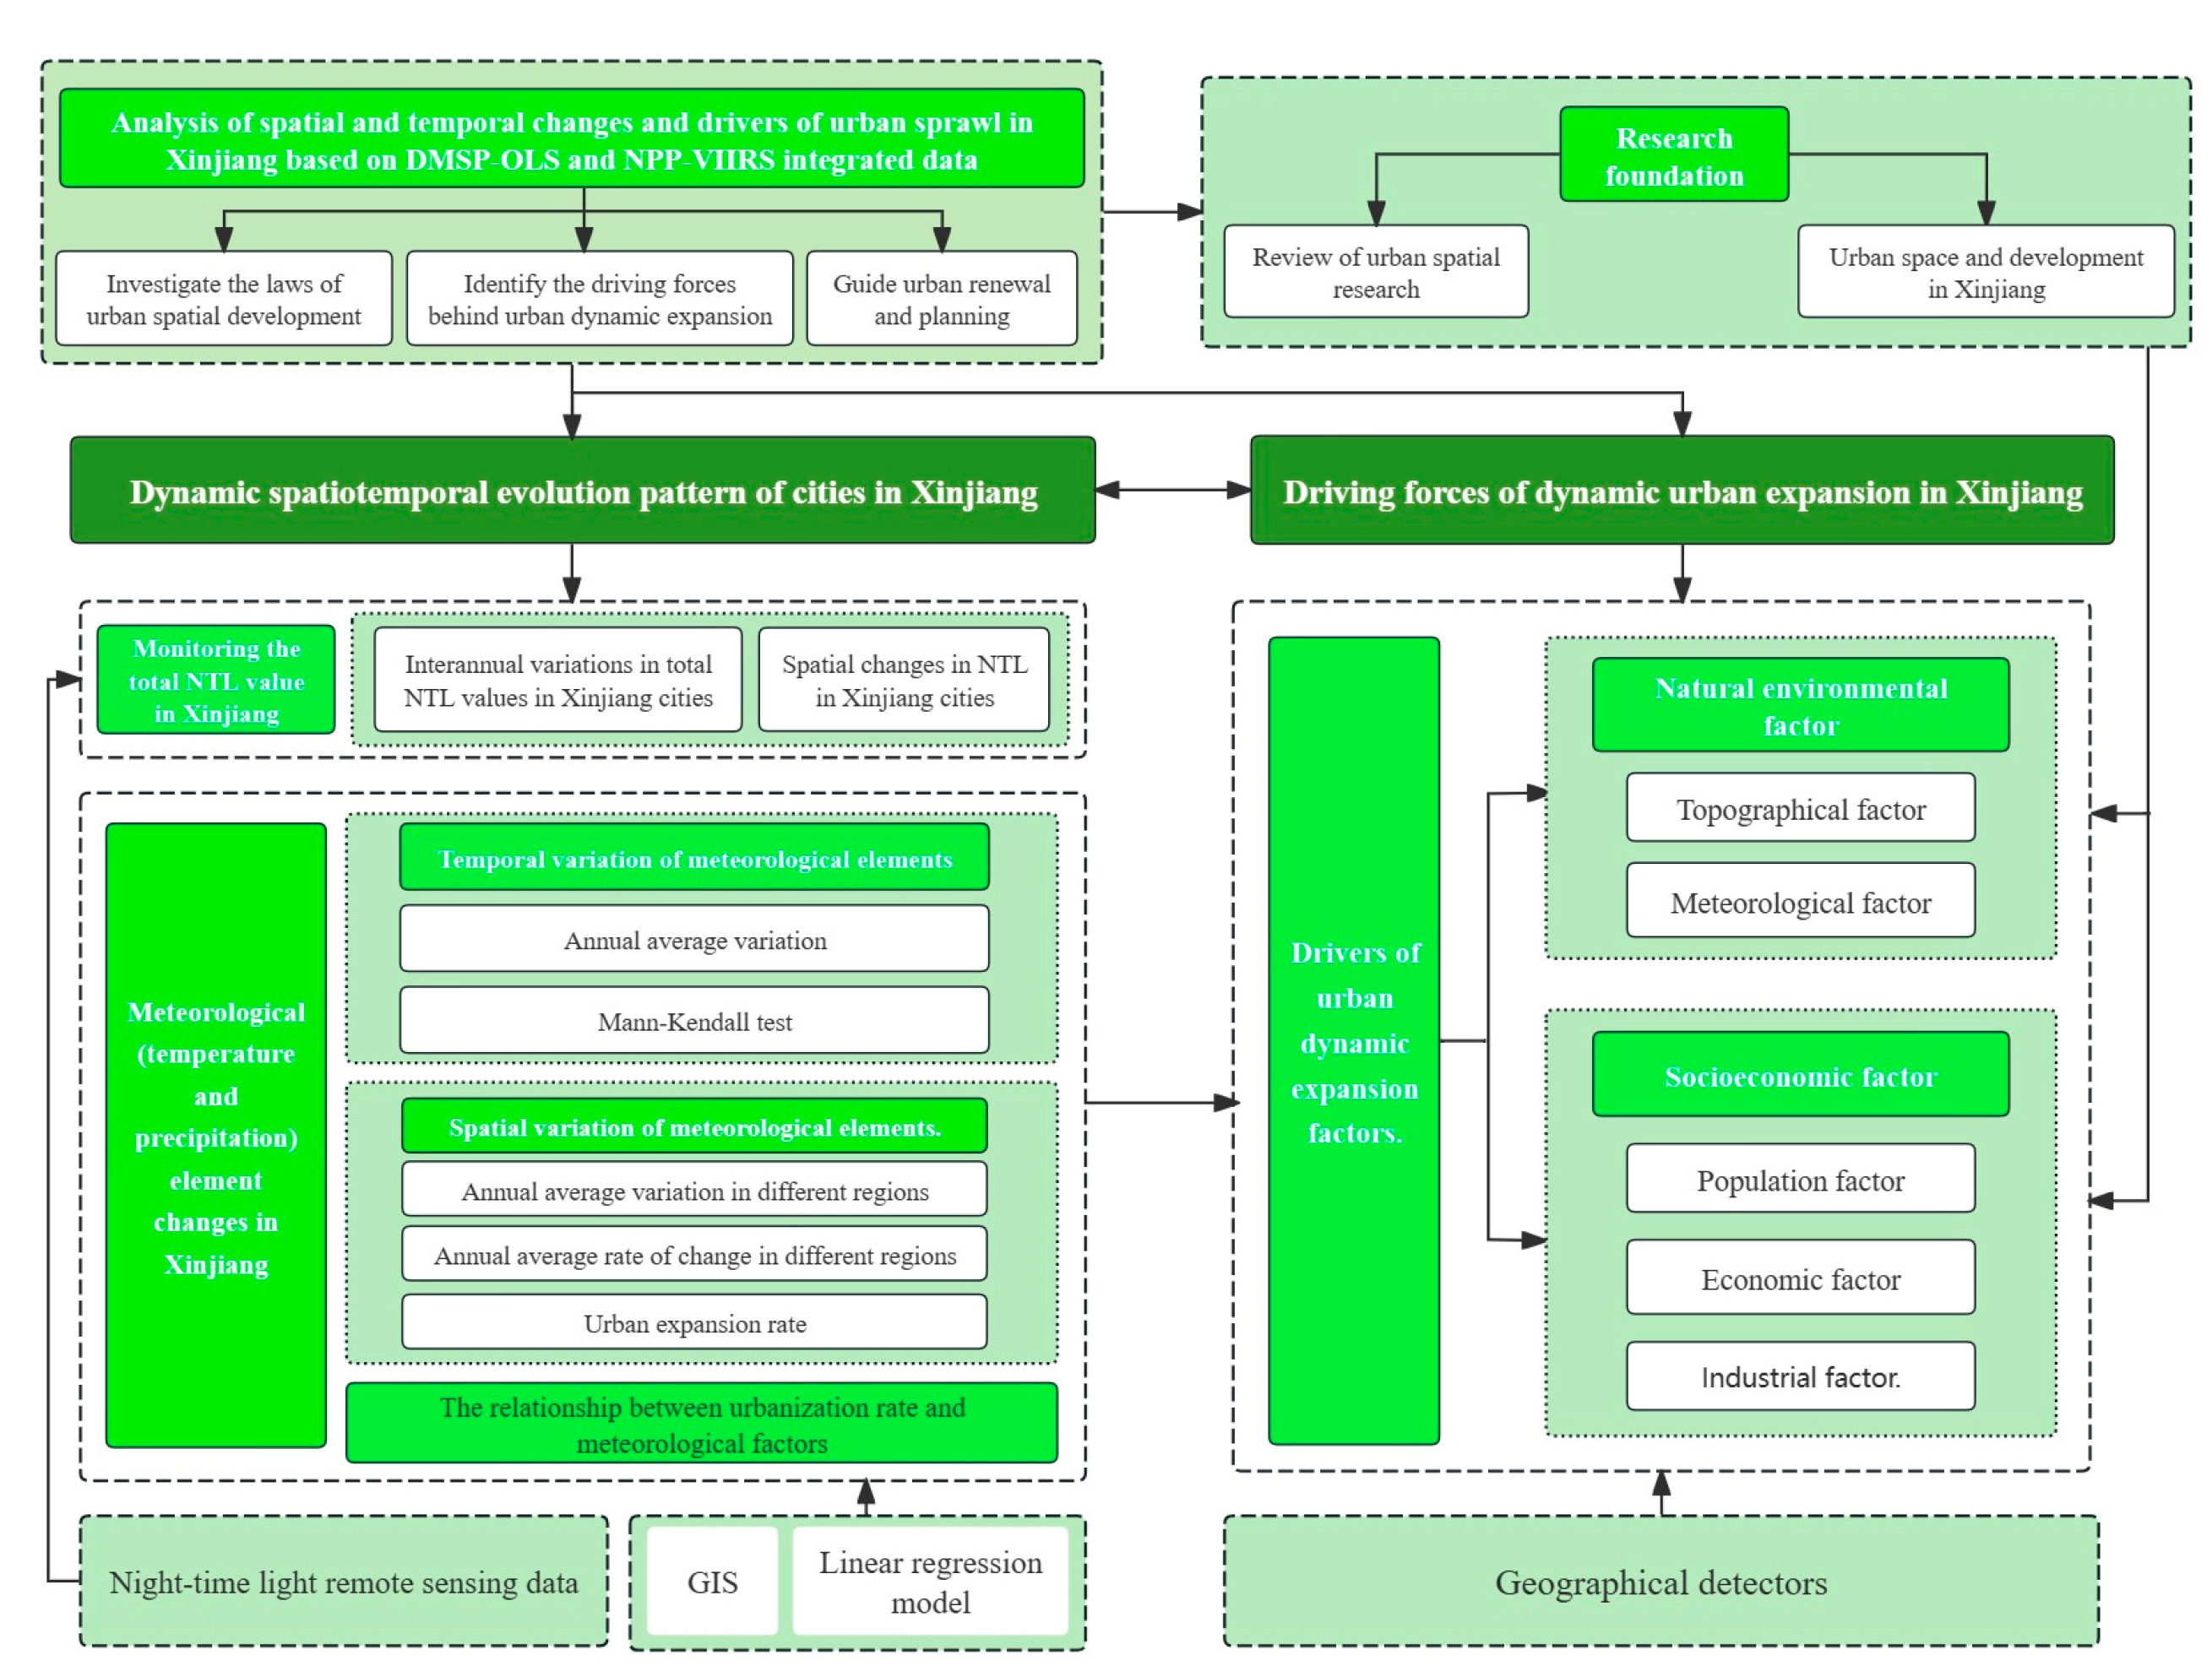
Figure 4.
Total value of TDN of night lighting in major cities in Xinjiang.

Figure 5.
Dynamic expansion of standard deviation ellipse and center of gravity in Xinjiang cities, 1992–2022.
Figure 5.
Dynamic expansion of standard deviation ellipse and center of gravity in Xinjiang cities, 1992–2022.

Figure 6.
Spatial and temporal variation in NTL in major cities of Xinjiang (a–c) Urumqi City; (d–f) Karamay City; (g–i) Korla City; (j–l) Yining City; (m–o) Kashgar City.
Figure 6.
Spatial and temporal variation in NTL in major cities of Xinjiang (a–c) Urumqi City; (d–f) Karamay City; (g–i) Korla City; (j–l) Yining City; (m–o) Kashgar City.
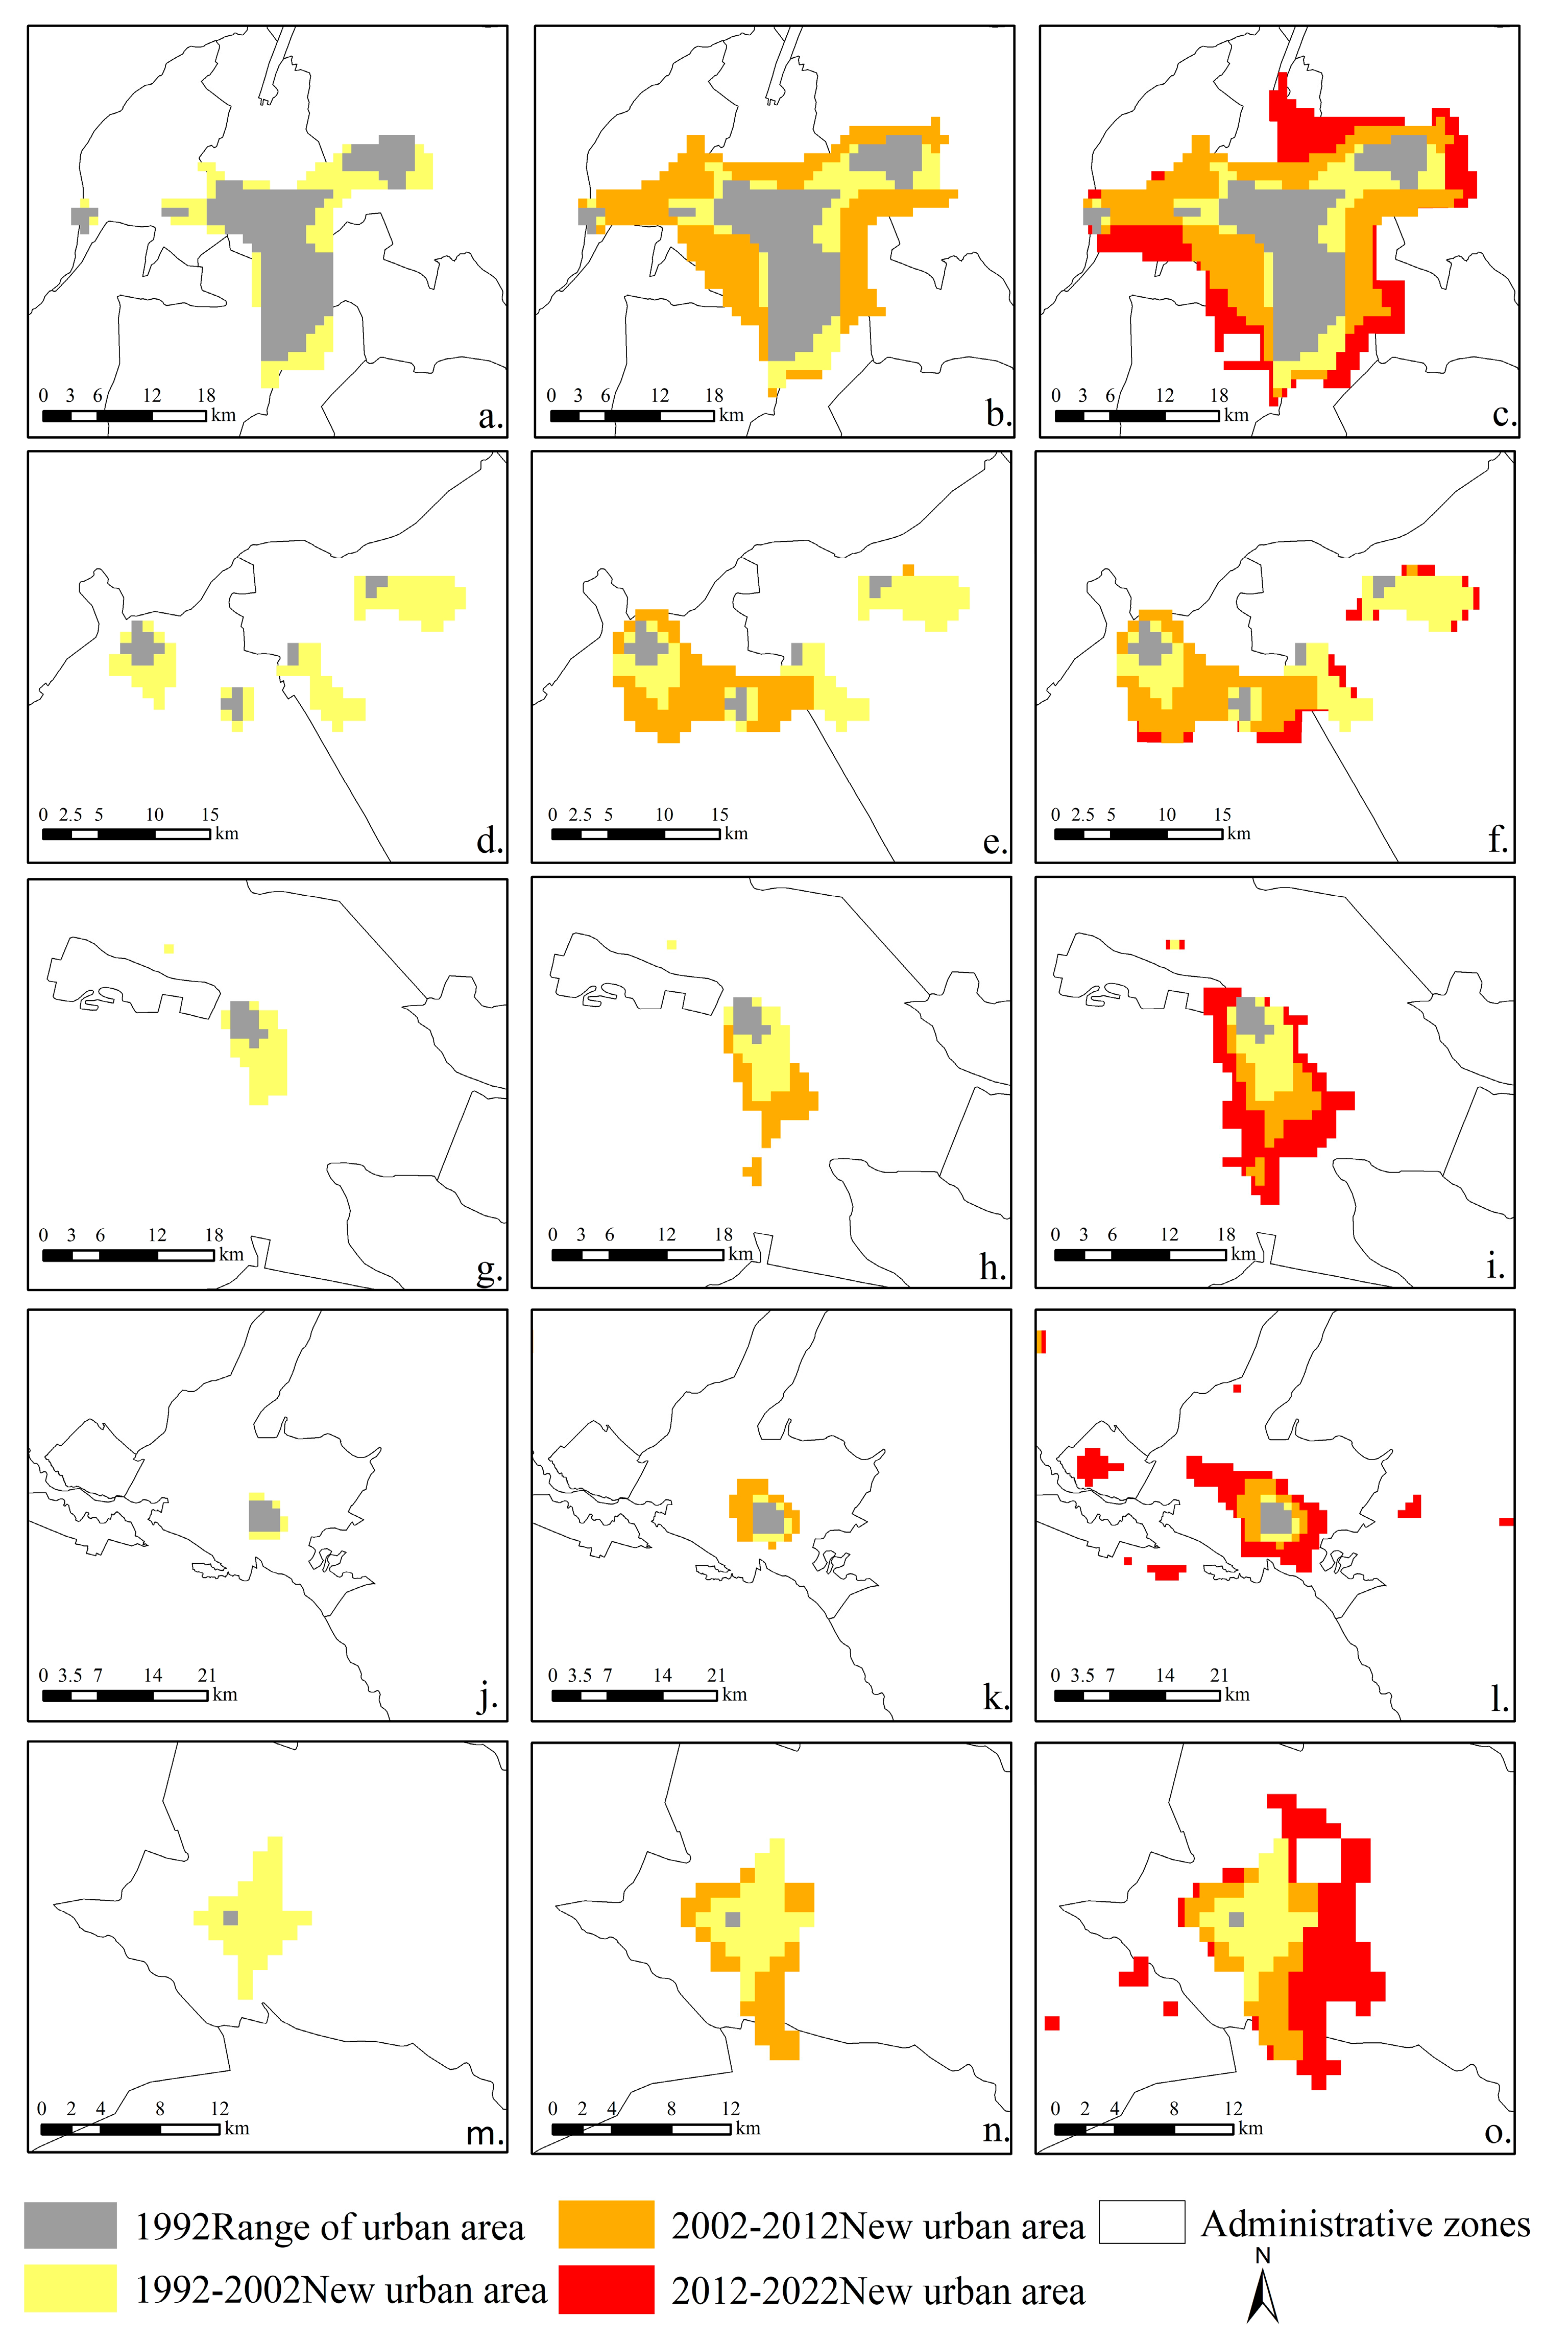
Figure 7.
The sliding mean temperature change in 5a in Xinjiang from 1992 to 2022.
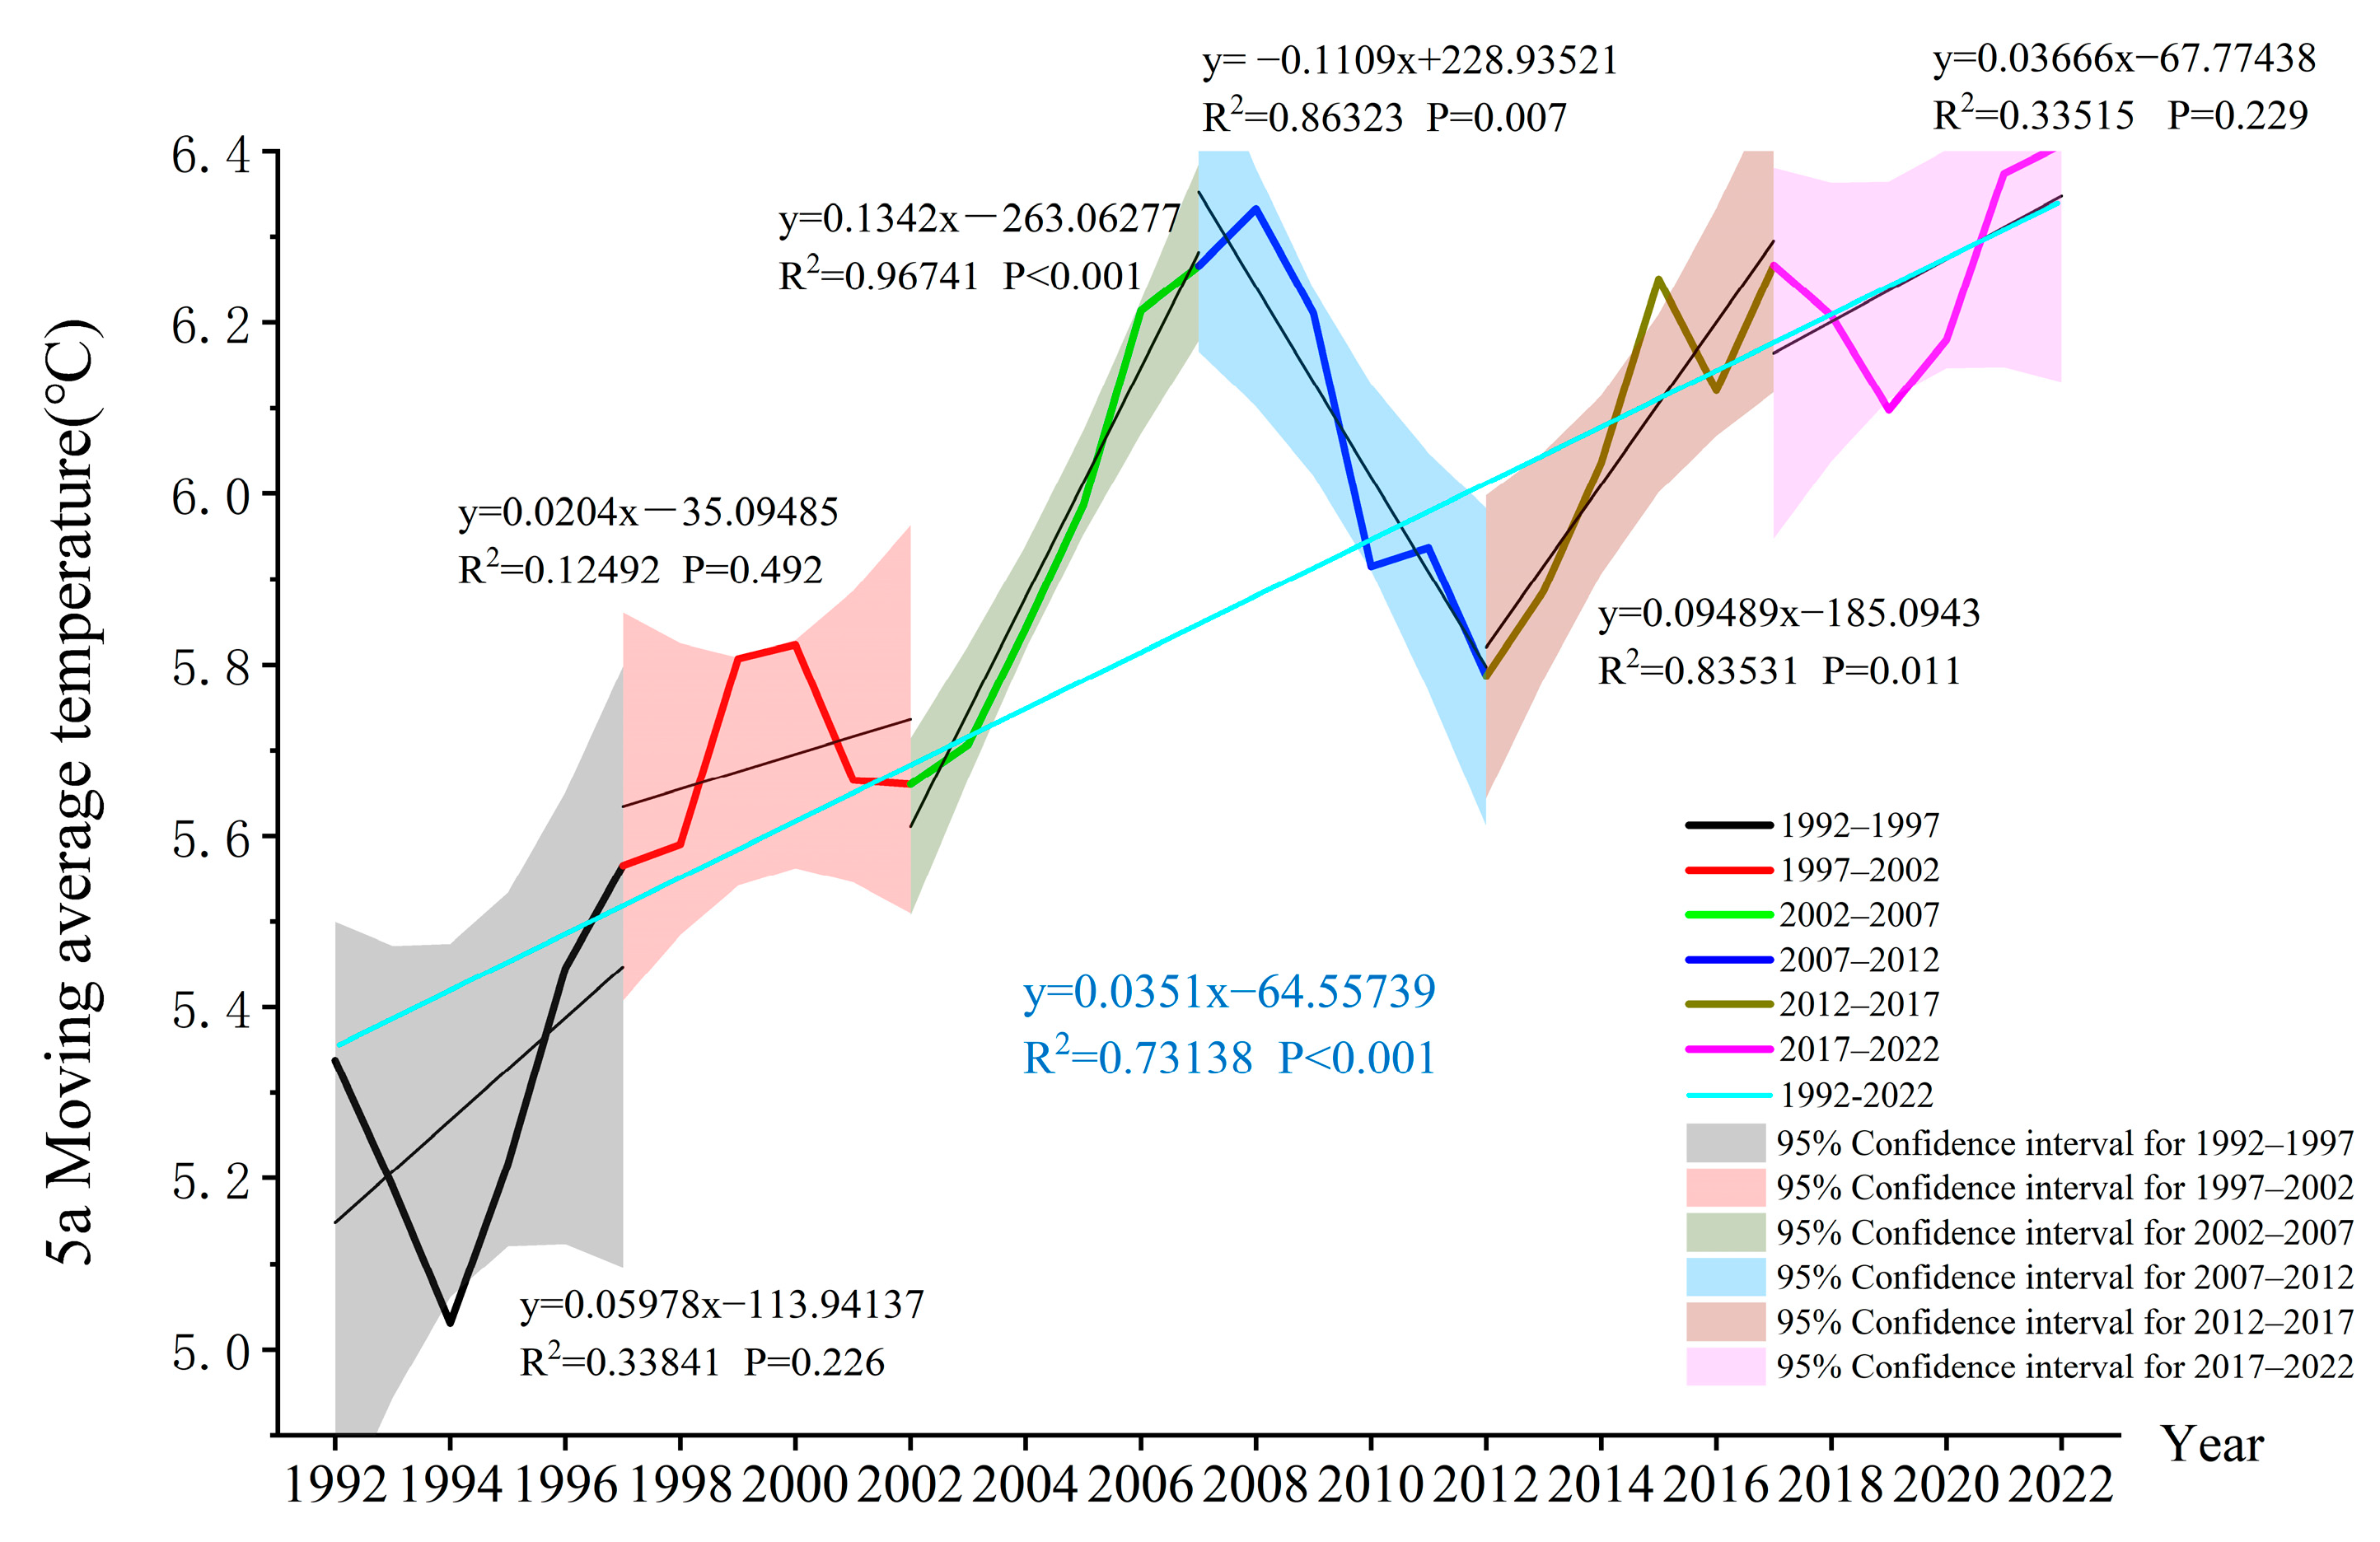
Figure 8.
Mann–Kendall test results for the sliding mean air temperature of 5a in Xinjiang.

Figure 9.
Spatial and temporal distribution map of average annual temperature and urban expansion speed in Xinjiang from 1992 to 2022. (a) Average annual temperature; (b) annual average temperature change rate; (c) annual average urban expansion speed; (d) annual average temperature change rates and annual average urban expansion speeds in various regions of Xinjiang.

Figure 10.
Correlation between urbanization rate and sliding temperature of 5a in different periods.
Figure 10.
Correlation between urbanization rate and sliding temperature of 5a in different periods.

Figure 11.
The average precipitation in Xinjiang from 1992 to 2022.

Figure 12.
Mann–Kendall test results for annual average precipitation in Xinjiang.
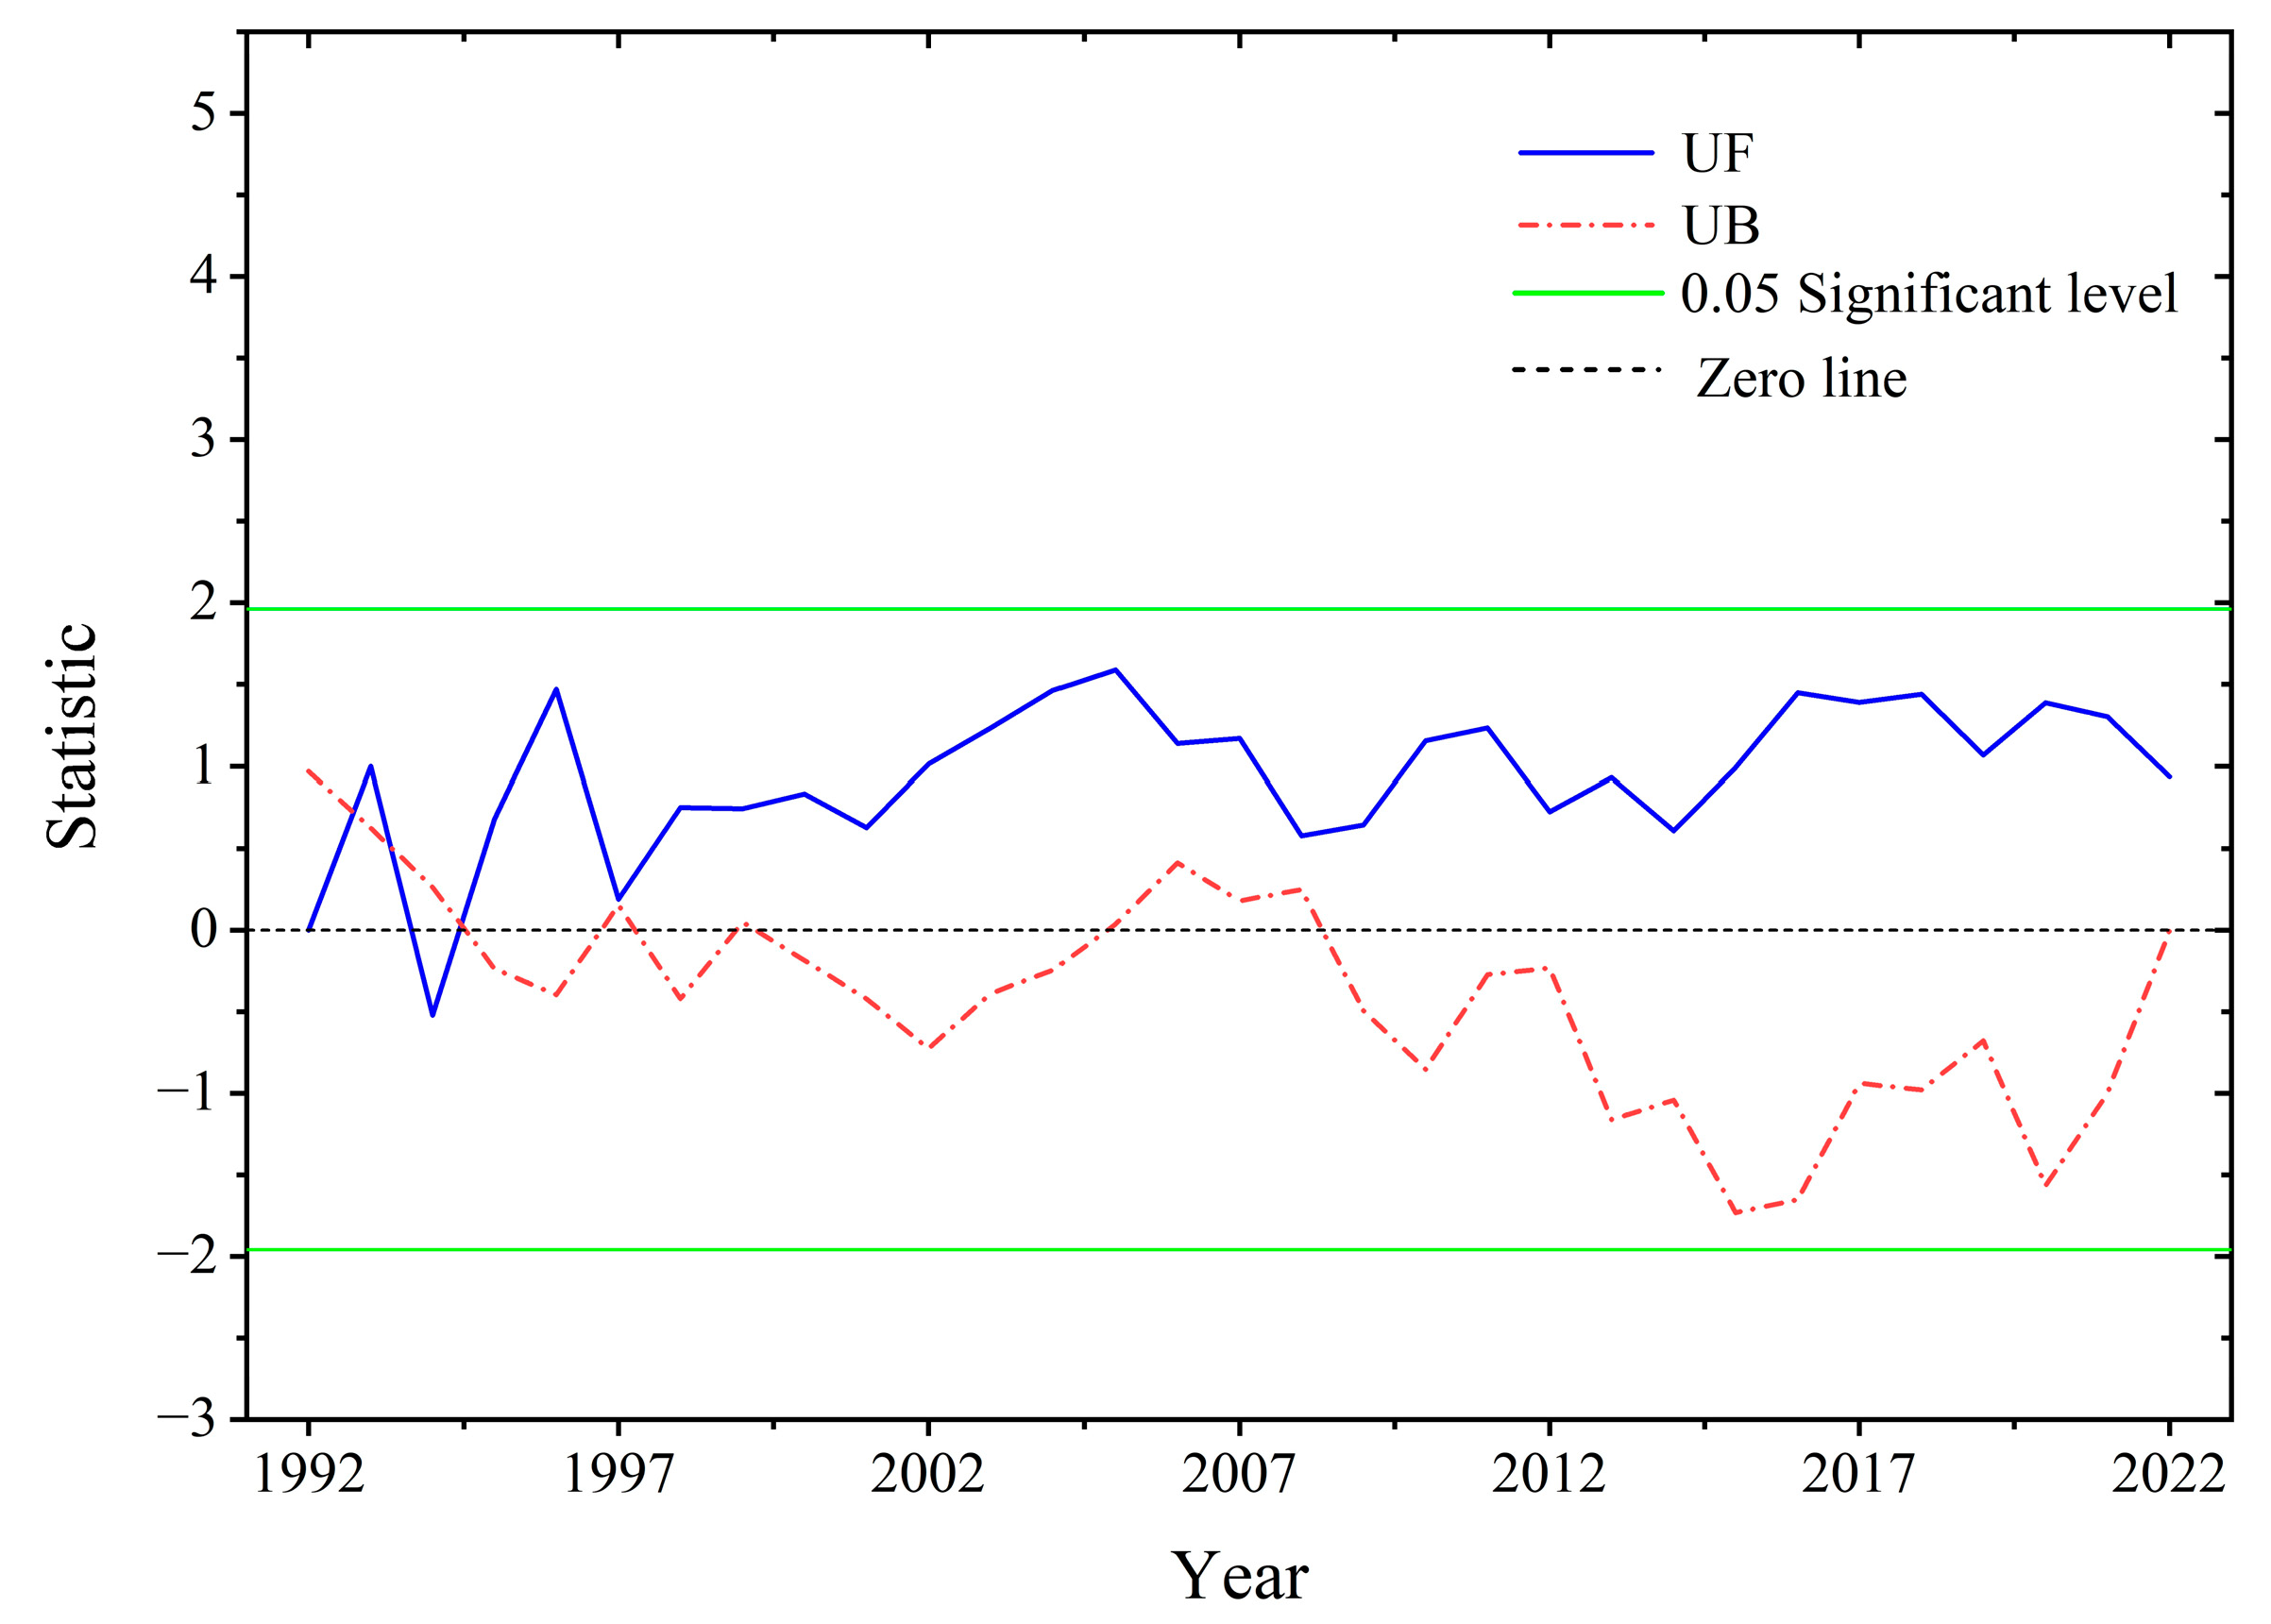
Figure 13.
Spatial and temporal distribution map of average precipitation and urban expansion speed in Xinjiang from 1992 to 2022. (a) Annual average precipitation; (b) annual precipitation change rate; (c) annual average urban expansion speed; (d) annual precipitation change rates and annual urban expansion speeds in various regions of Xinjiang.
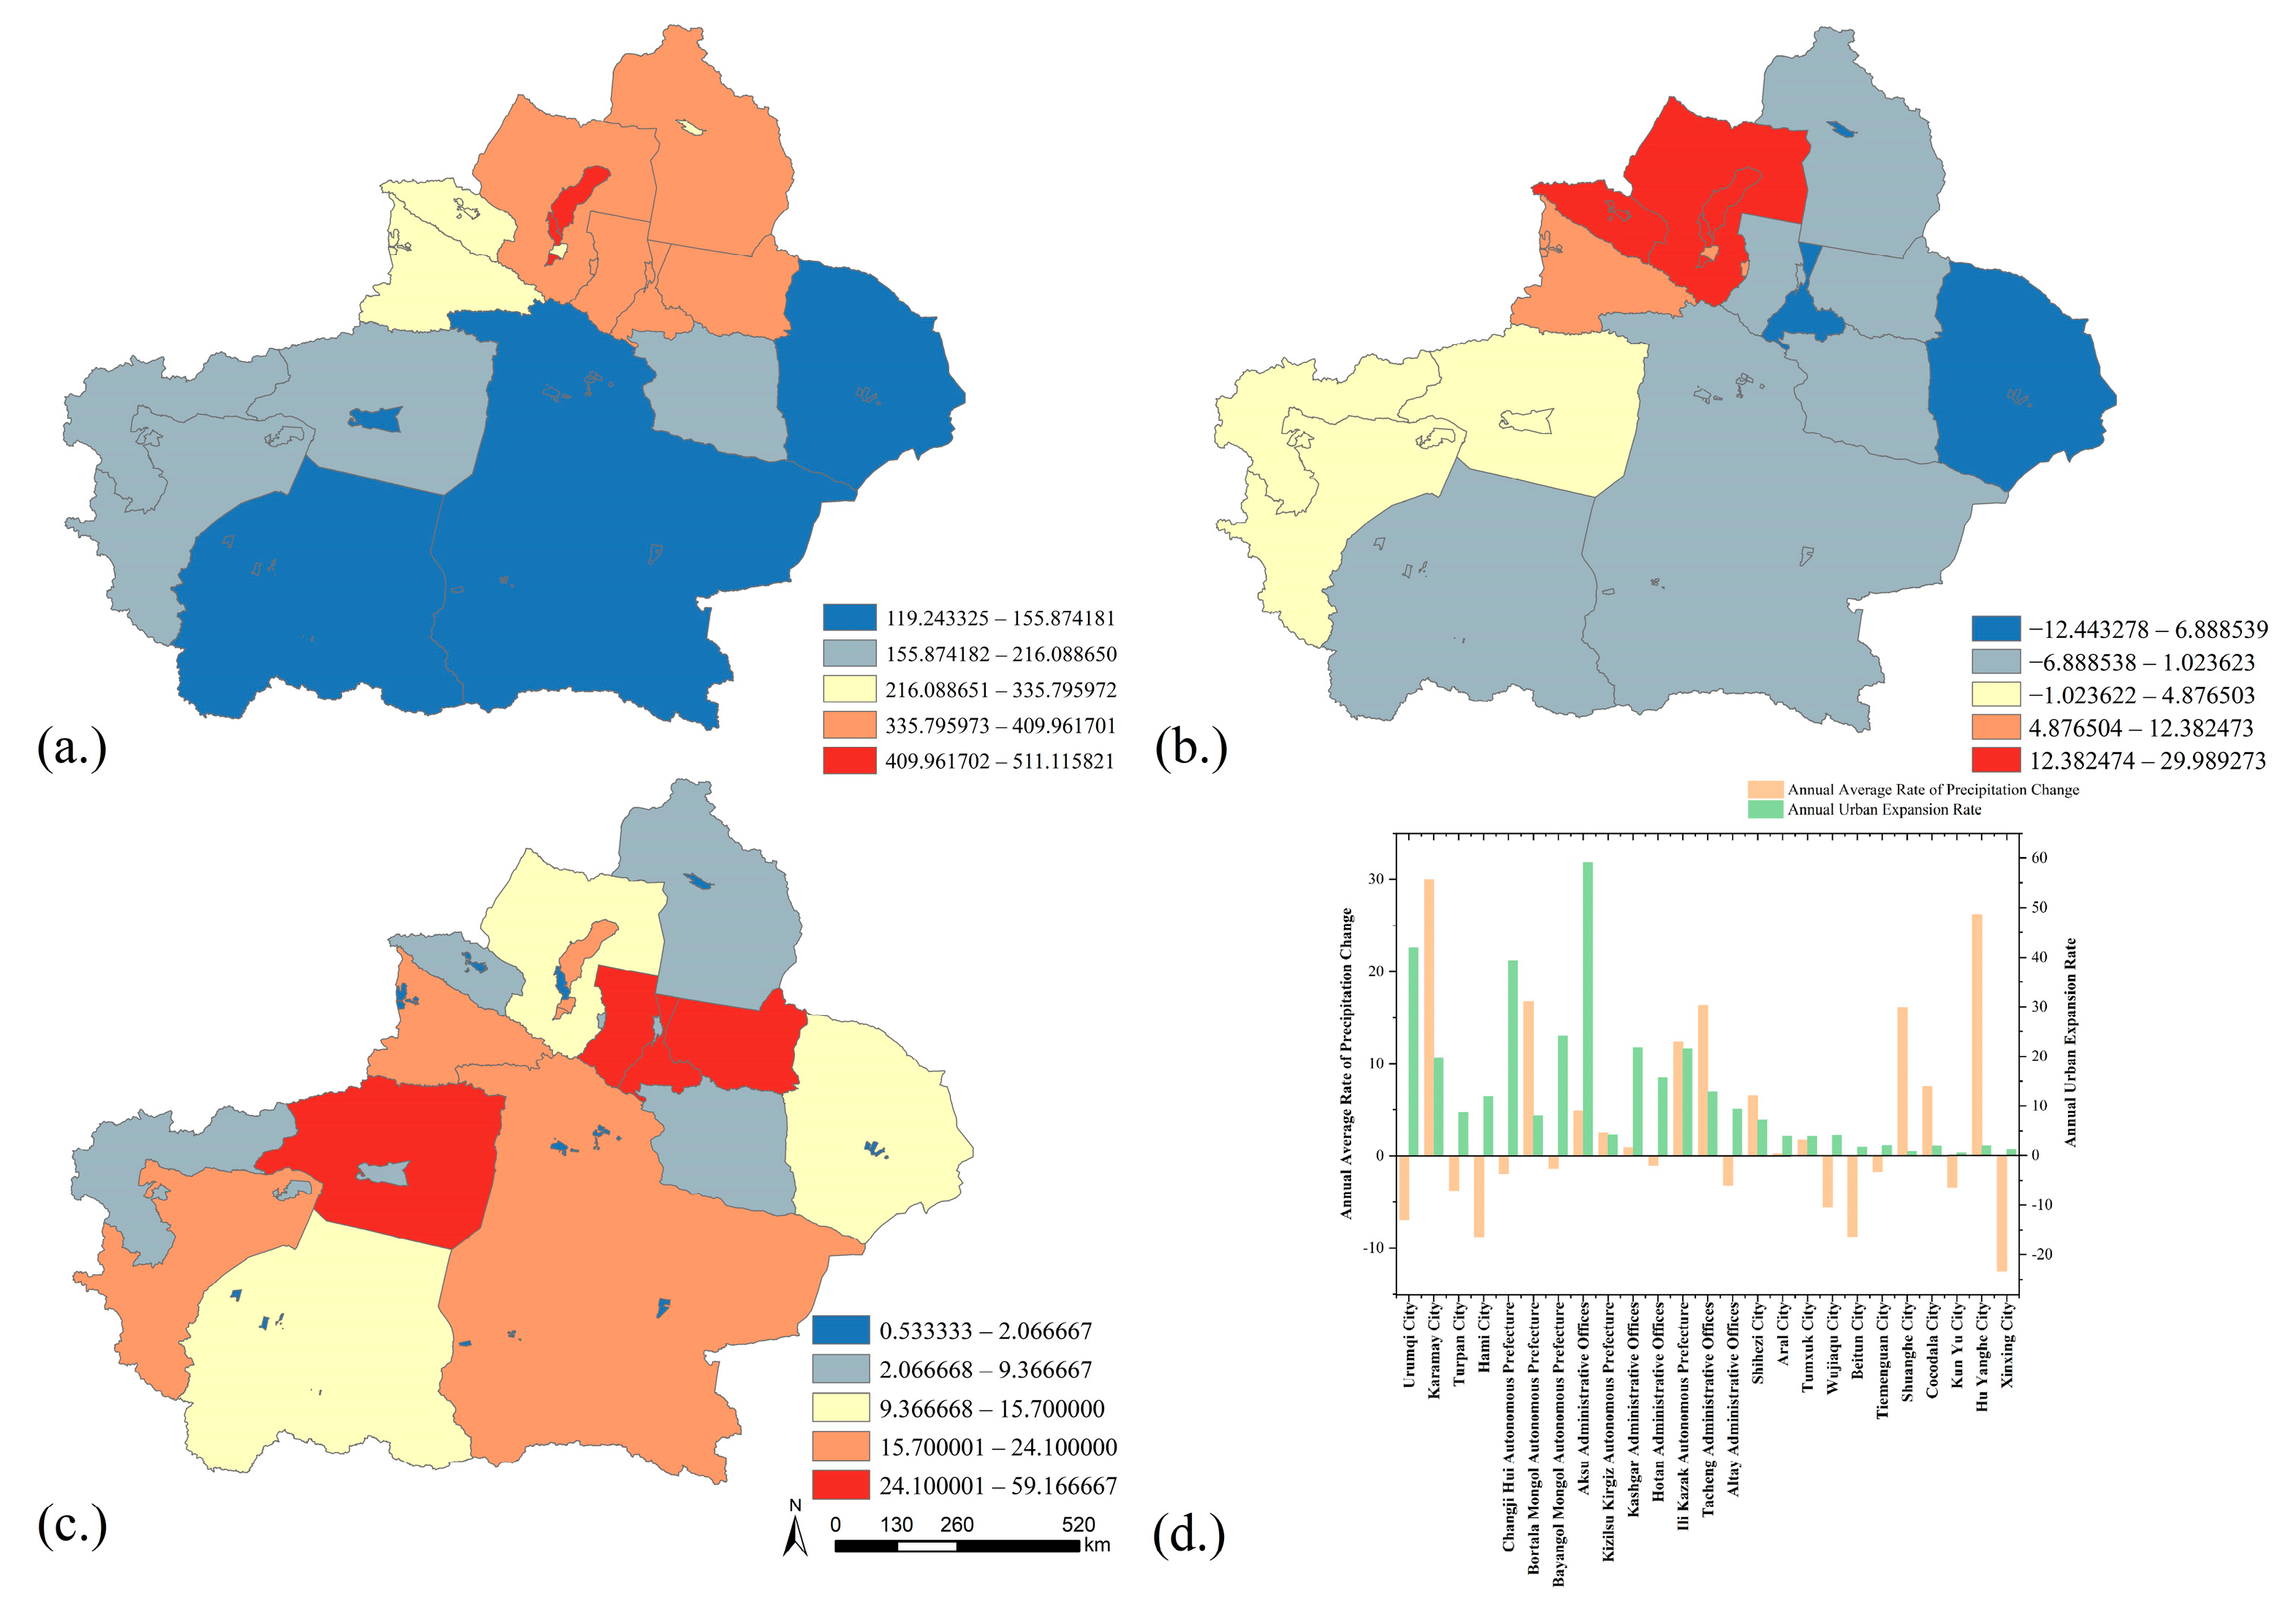
Figure 14.
Correlation between urbanization rate and annual average precipitation in different periods.
Figure 14.
Correlation between urbanization rate and annual average precipitation in different periods.
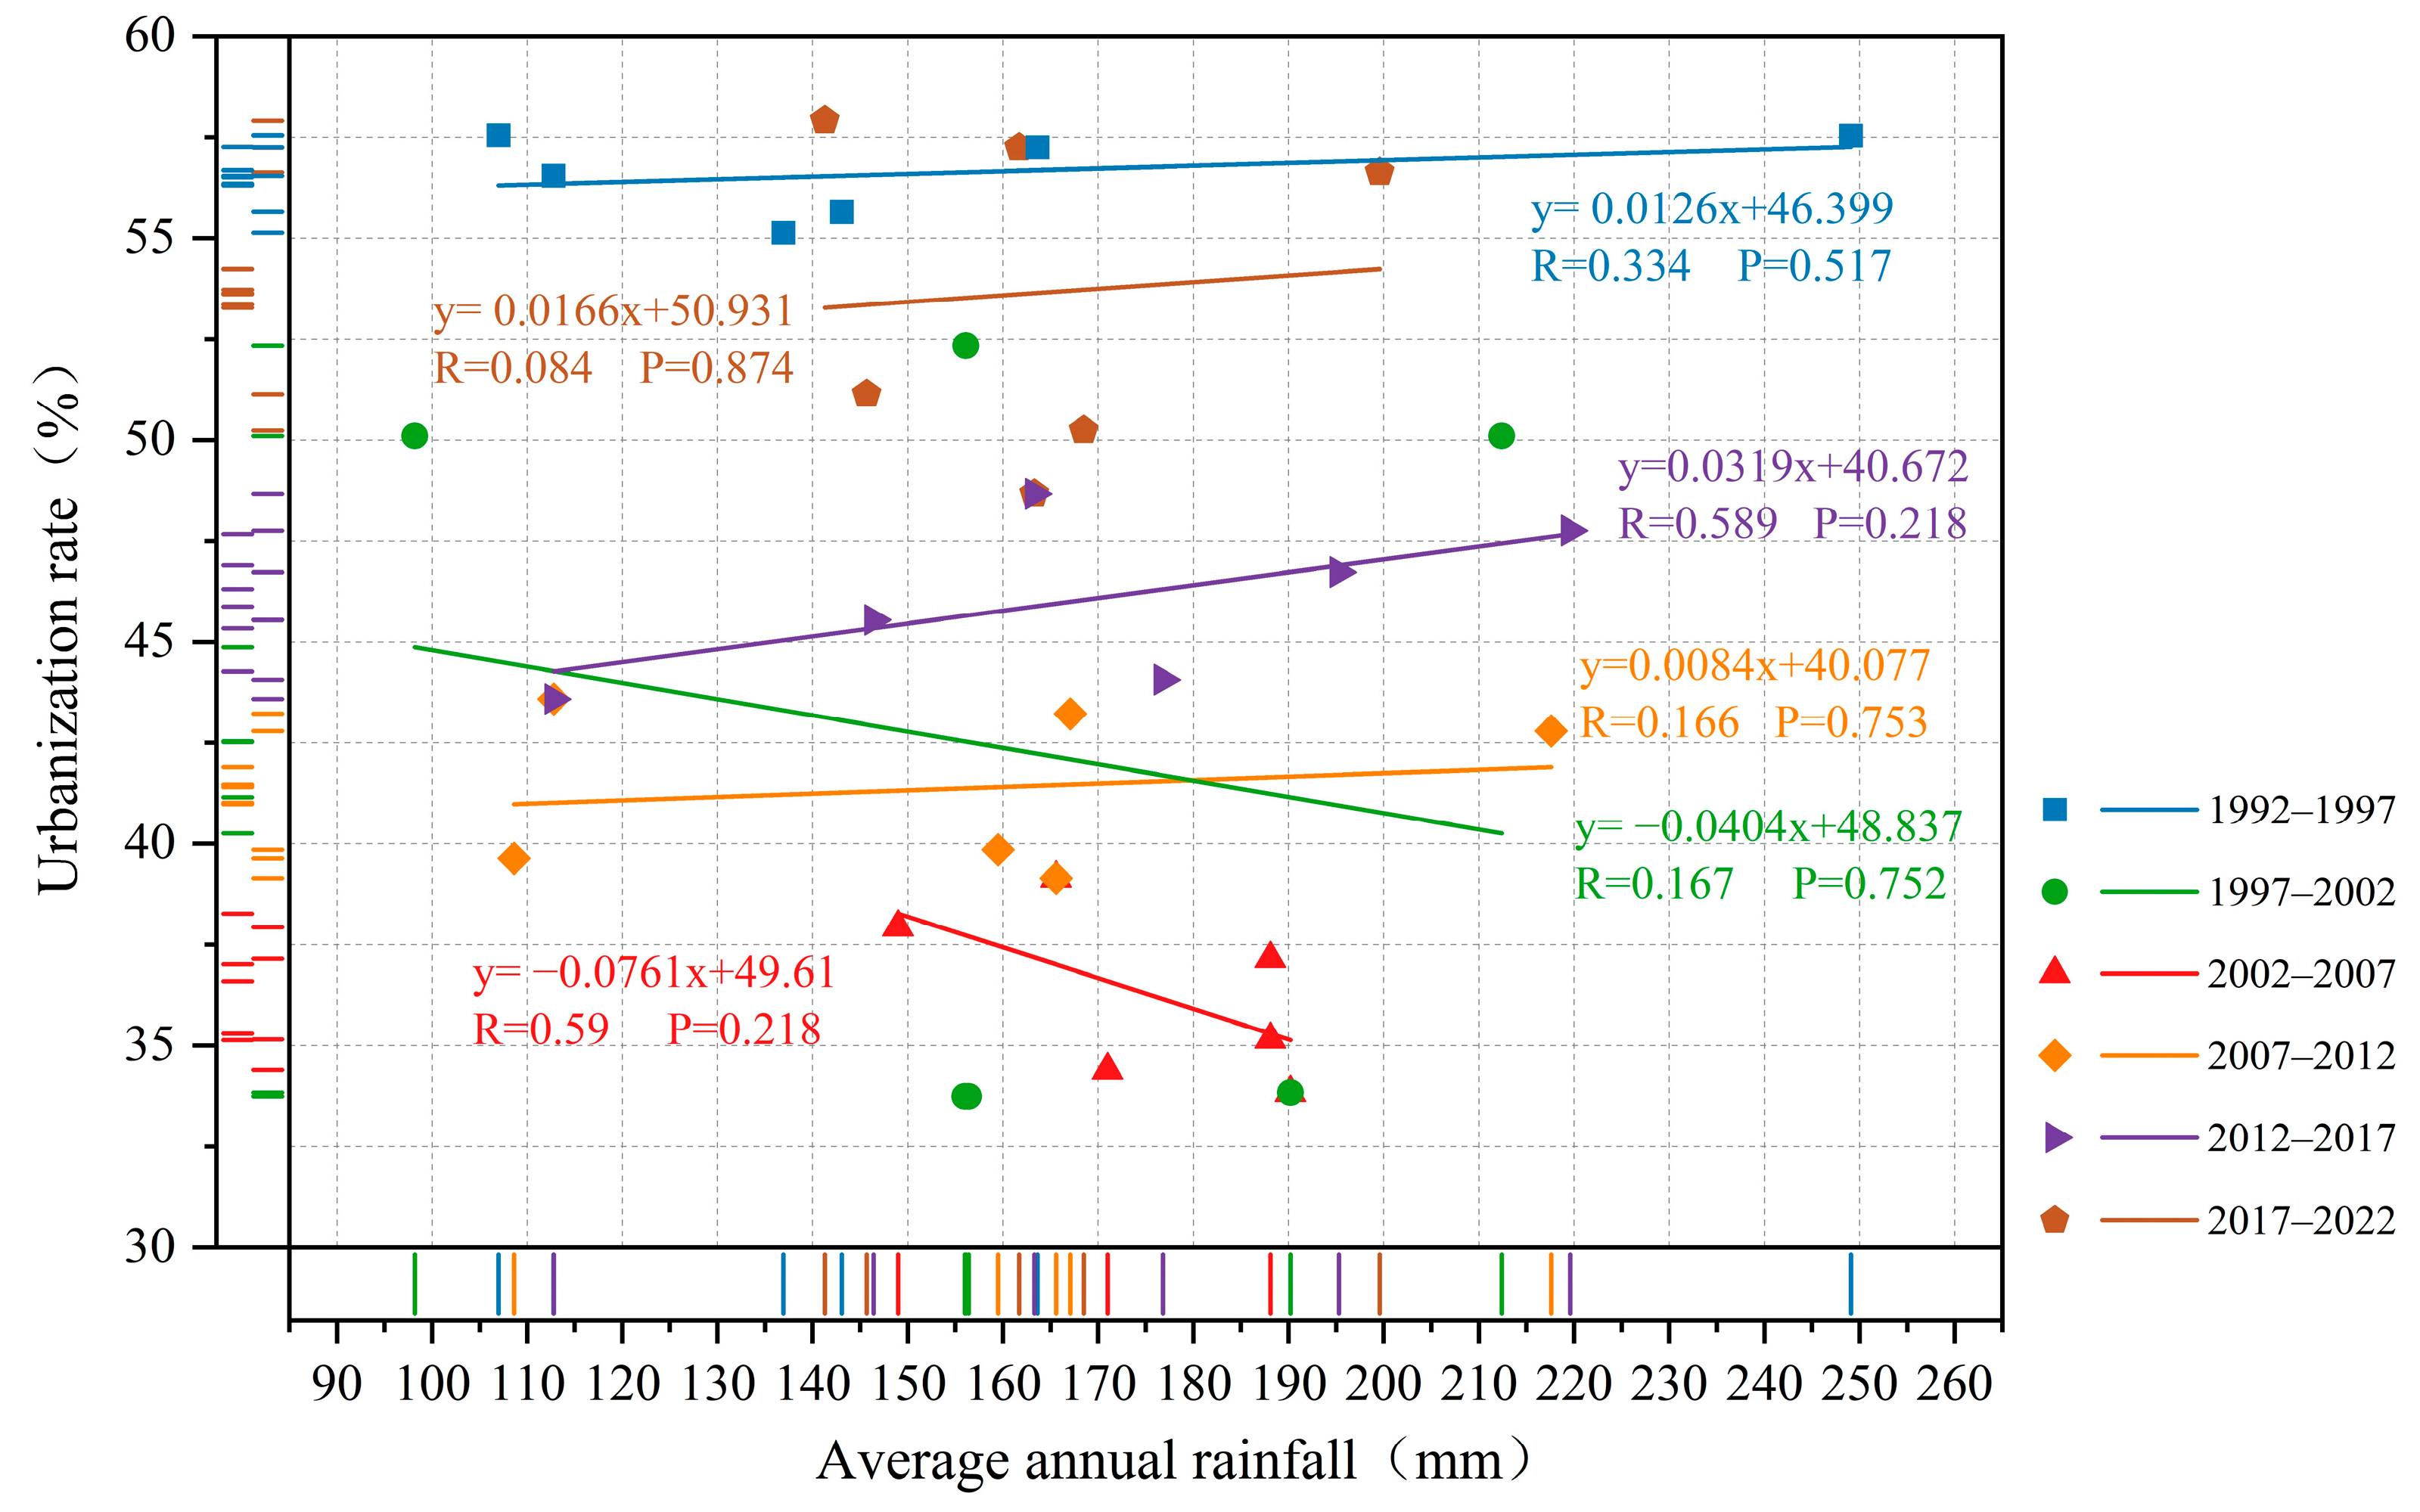
Figure 15.
Contribution rate of each influence factor.

Figure 16.
2012–2022 interaction detector results.

Table 1.
Extraction accuracy test results in Xinjiang urban area.
| Year | Circumference (km) | Area (km2) | Overall Accuracy (%) |
|---|---|---|---|
| 1992 | 375.17 | 368.61 | 83.21 |
| 1997 | 613.91 | 726.18 | 84.71 |
| 2002 | 792.02 | 898.01 | 80.74 |
| 2007 | 1050.00 | 1286.00 | 86.93 |
| 2012 | 1262.02 | 1692.00 | 81.38 |
| 2017 | 1746.01 | 2142.99 | 84.83 |
| 2022 | 3076.00 | 3723.00 | 85.40 |
Table 2.
Statistical table of urban center of gravity in Xinjiang cities from 1992 to 2022.
| Year | Oblateness | Azimuth (°) | Center-of-Gravity Coordinates | Center-of-Gravity Traveled Distance (km) | Center-of-Gravity Shift Direction |
|---|---|---|---|---|---|
| 1992 | 0.487 | 70.106 | (86°10′01″ E, 43°27′59″ N) | ||
| 46.5433 | Northwest | ||||
| 1997 | 0.479 | 72.689 | (85°44′57″ E, 43°26′07″ N) | ||
| 32.4862 | Northwest | ||||
| 2002 | 0.533 | 73.523 | (85°27′35″ E, 43°23′37″ N) | ||
| 24.0594 | Southwest | ||||
| 2007 | 0.547 | 70.223 | (85°15′11″ E, 43°19′45″ N) | ||
| 26.7808 | Northeast | ||||
| 2012 | 0.534 | 73.152 | (85°28′60″ E, 43°24′02″ N) | ||
| 29.0383 | Southwest | ||||
| 2017 | 0.535 | 71.622 | (85°14′43″ E, 43°17′34″ N) | ||
| 50.5630 | Southwest | ||||
| 2022 | 0.542 | 70.030 | (84°50′16″ E, 43°05′25″ N) |
Disclaimer/Publisher’s Note: The statements, opinions and data contained in all publications are solely those of the individual author(s) and contributor(s) and not of MDPI and/or the editor(s). MDPI and/or the editor(s) disclaim responsibility for any injury to people or property resulting from any ideas, methods, instructions or products referred to in the content. |
© 2024 by the authors. Licensee MDPI, Basel, Switzerland. This article is an open access article distributed under the terms and conditions of the Creative Commons Attribution (CC BY) license (https://creativecommons.org/licenses/by/4.0/).
Share and Cite
MDPI and ACS Style
Wang, L.; Xu, W.; Xue, X.; Wang, H.; Li, Z.; Wang, Y. Analysis of Spatial and Temporal Changes and Drivers of Urban Sprawl in Xinjiang Based on Integrated DMSP-OLS and NPP-VIIRS Data. Land 2024, 13, 567. https://doi.org/10.3390/land13050567
AMA Style
Wang L, Xu W, Xue X, Wang H, Li Z, Wang Y. Analysis of Spatial and Temporal Changes and Drivers of Urban Sprawl in Xinjiang Based on Integrated DMSP-OLS and NPP-VIIRS Data. Land. 2024; 13(5):567. https://doi.org/10.3390/land13050567
Chicago/Turabian StyleWang, Luwei, Wenzhe Xu, Xuan Xue, Haowei Wang, Zhi Li, and Yang Wang. 2024. "Analysis of Spatial and Temporal Changes and Drivers of Urban Sprawl in Xinjiang Based on Integrated DMSP-OLS and NPP-VIIRS Data" Land 13, no. 5: 567. https://doi.org/10.3390/land13050567
Note that from the first issue of 2016, this journal uses article numbers instead of page numbers. See further details here.