
The Temporal and Spatial Characteristics of Ecological Security Pattern in the Loess Plateau, China
by
 ,
,
Manya Luo
1,2,3,
Xia Jia
1,2,3,
Yonghua Zhao
1,2,3,*,
Huanyuan Wang
4,
Chunyang Chen
1,2,3,
Dongqian Li
1,2,3,
Shuyuan Yang
1,2,3 and
Juan Li
4 1
The School of Land Engineering, Chang’an University, Xi’an 710054, China
2
Key Laboratory of Degraded and Unused Land Consolidation Engineering of the Ministry of Natural Resources, Chang’an University, Xi’an 710054, China
3
Shaanxi Key Laboratory of Land Consolidation, Chang’an University, Xi’an 710054, China
4
Shaanxi Provincial Land Engineering Construction Group Co., Ltd., Xi’an 710075, China
*
Author to whom correspondence should be addressed.
Land 2024, 13(5), 570; https://doi.org/10.3390/land13050570
Submission received: 1 March 2024
/
Revised: 13 April 2024
/
Accepted: 19 April 2024
/
Published: 24 April 2024
(This article belongs to the Section Landscape Ecology)
Abstract
:As a typical ecologically fragile area, the ecological security of the Loess Plateau has been seriously threatened. Ecological security patterns (ESP) have gradually become an effective method for protecting ecological security and supporting the management and sustainable development of ecosystems. Therefore, this study constructed a novel ESP based on ecological “function–structure”, utilizing minimum cumulative resistance (MCR) to identify ecological source areas and corridors. Additionally, time scales were introduced into the ESP, allowing for a comprehensive analysis of the spatiotemporal heterogeneity of ecological security in the Loess Plateau. The study revealed that the number of ecological sources decreased from southeast to northwest, with 27, 41, and 77 sources covering total areas of 4263.810 km2, 18,566.034 km2, and 113,209.595 km2 from 2000 to 2020, respectively. Similarly, the number and complexity of ecological corridors increased over the same time period, with 64, 85, and 105 corridors totaling lengths of 4579.326 km, 6526.996 km, and 7015.174 km, respectively. The expansion of ecological security zones was mainly observed in the southeast part of the Loess Plateau. Overall, the ESP of the Loess Plateau saw an improvement, with the southeastern part showing better ecological security than the northwestern part. These findings hold great significance for regional ecological security evaluations and are crucial for promoting ecological management and healthy development in the Loess Plateau.
1. Introduction
The global ecological crisis, stemming from imbalances in natural, social, and economic systems, poses a substantial threat to ecological security [1]. Ecological security is essential for safeguarding and managing ecological processes, which in turn reflect the health of the ecosystem [2,3,4,5]. Ecological security patterns (ESPs) are established through the rational arrangement of natural resources, creating a spatial pattern consisting of points, lines, and polygons. They aim to protect and restore the diversity and integrity of ecosystems, ultimately enhancing ecological security [6]. ESPs have provided an efficient spatial pathway to achieving ecological security. Therefore, it is essential to perform quantitative and dynamic analysis of the current status and spatial distribution of ESPs. This is crucial for developing policies concerning regional sustainable development and ecological management.
Recent studies have significantly contributed to our understanding of ESPs [7,8]. The minimal cumulative resistance (MCR) model has become the main method for constructing ESPs. This method involves visual analysis and is easy to calculate. The process of this model includes the identification of ecological source areas, the determination of ecological corridors, and ultimately, the creation of a security pattern. For example, Liu et al. identified ecological sources and potential ecological corridors using morphological spatial pattern analysis (MSPA) and minimum cumulative resistance models (MCR) in Qingdao, China [9]. Similarly, in another study, an MCR model was established based on landscape ecological risk, and a comprehensive network system for the ecological source–corridor–node system was designed in the Yellow River Basin, China [10]. In addition, research on ESP has primarily centered on urban areas, focusing on various perspectives such as ecological sensitivity [11,12], ecosystem services [13,14], and various ecological models [15,16,17]. These approaches provide a scientific foundation for ESP; however, they may not be suitable for ecologically fragile regions. Therefore, this paper proposed a new approach, focusing on ecological structure and function, to construct an ESP in the Loess Plateau.
The Loess Plateau, known for its unstable ecosystem structure and harsh natural conditions, is recognized as one of the most severely eroded regions on Earth [18]. Over the past few decades, environmental issues in this region have aroused extensive concern from the Chinese government and academics. National environmental protection policies, such as the Natural Forest Protection Project, the Grain for Green Policy, and the Yellow River Basin’s Ecological Protection and High-quality Development Plan, have played a crucial role in safeguarding the ecosystem of the Loess Plateau. Several studies about landscape ecology in the Loess Plateau have deeply explored ecological vulnerabilities [19], ecological risk [20], and ecosystem service functions [21,22], revealing substantial changes in both the ecological structure and function of the Loess Plateau over time. Moreover, previous studies have examined the ESP of the loess Plateau, but have solely concentrated on nature reserves and croplands [23,24], or have discussed the security pattern for a particular year [25]. These results are not sufficient to capture the overall situation of the entire plateau, and ignore the dynamics and evolution of the ESP. Therefore, there is an urgent need to construct an ESP across the whole Loess Plateau, revealing its spatial and temporal changes. The main scientific questions in this study are: (1) What is the ESP of the Loess Plateau, and does it exhibit spatial-temporal variations? (2) How can ecological security be optimized in this region? Taking into account the limitations of previous research and the unique characteristics of the Loess Plateau, this study offers an ecological structural and functional perspective and utilizes the MCR model to construct the ESP. Moreover, time scale data are incorporated into ESP analysis for the first time, enabling the examination of spatial and temporal characteristics from 2000 to 2020 in the Loess Plateau. This study offers a creative and scientific approach for the dynamic monitoring of ecological security, with potential applications in arid regions and areas of significant soil erosion. The results provide a scientific foundation for ecological environmental management in the Loess Plateau.
2. Study Area and Methods
2.1. Study Area
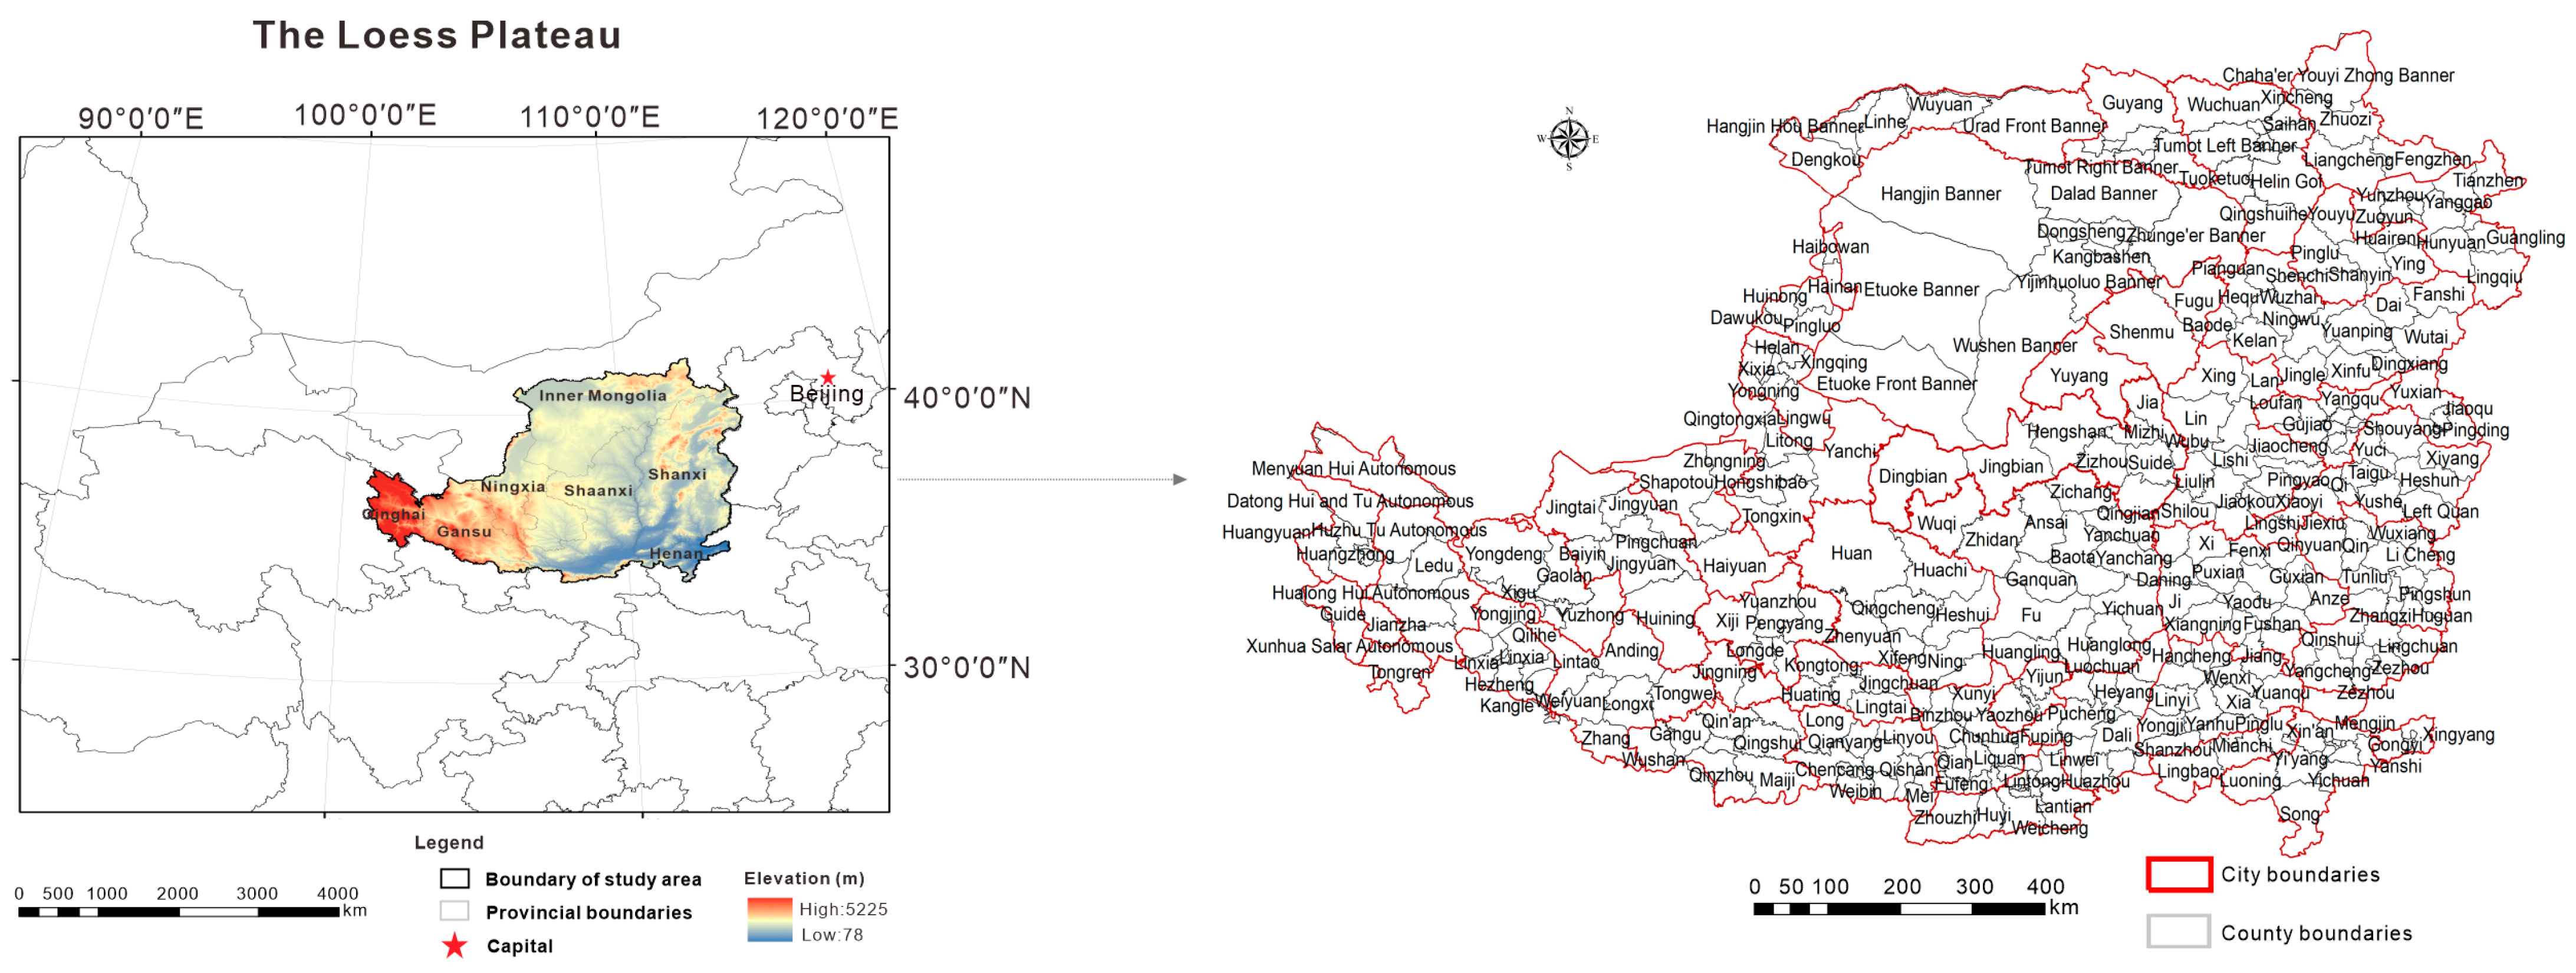
The Loess Plateau (33°45′–41°16′ N, 100°54′–114°33′ E) is located in northwest China, spanning approximately 640,000 km2 and encompassing seven provinces, including Shanxi, Ningxia, northern Shaanxi, middle and eastern Gansu, northeastern Qinghai, the Hetao Plain and Ordos Plateau of Inner Mongolia, and the western hilly areas of Henan (Figure 1). The primary landforms consist of tablelands, ridges, hillocks, and valleys with different levels of erosion. Loess tablelands are large, flat platform areas with weak erosion, whereas loess ridges and loess hillocks are the result of runoff erosion and slope cutting. Hillocks develop from ridges under further erosion, and the slope is up to 15–25°. The majority of the plateau lies in the semi-humid and semi-arid transitional zone, with an average annual temperature ranging from 4.3 °C to 14.3 °C. Rainfall is highly uneven, mainly concentrated in the months of July to September, with 200 mm in the northwest and 750 mm in the southeast over this period. Six major soil types have been identified in the plateau: cultivated loessial soils, cinnamon soils, loessial soils, dark loessial soils, cumulated irrigated soils, and aeolian soils. Their properties are influenced by climate, topography, and other environmental factors [18].
2.2. Data Sources
The land use data for the years 2000, 2010, and 2020 were obtained from the GlobeLand30 dataset, which utilizes an integrated approach based on pixel and object-based methods combined with computer classification and expert knowledge [26]. The land use types were extracted by combining Landsat TM5/ETM + data and HJ-1. The data from 2020 used GF-1 images at a 16 m resolution [27]. The overall accuracy of the data was 83.51% (kappa = 0.82 m) [28]. The land use data were corrected using Google Earth. The DEM dataset used in the study, developed from SRTM and with a resolution of 30 m, was made available by the Resource and Environmental Science and Data Center (https://www.resdc.cn/, accessed on 10 April 2024), and the degree of relief factor was calculated using DEM via focal statistics. The soil texture data, with a spatial resolution of 30 m, were supplied by the Harmonized World Soil Database (https://iiasa.ac.at, accessed on 10 April 2024). Meteorological sites data covering the study area were derived from the China Meteorological Data Service Center (http://data.cma.cn/, accessed on 10 April 2024). The precipitation and temperature data were interpolated using ANUSPLIN with latitude and longitude as independent variables and elevation as a covariate to convert point data into raster data with a spatial resolution of 30 m. Monthly 500 m resolution NDVI MODND1M products for the same years were acquired from the Geospatial Data Cloud Gateway (https://www.gscloud.cn/sources, accessed on 10 April 2024).
2.3. Research Framework
The basic and common structure of ESPs created from an MCR model comprises “sources–resistance surface–corridors”. Ecological sources play a crucial role in enhancing ecological security by serving as the foundation of ESPs. These sources should meet the following requirements: maintaining the integrity of the ecological process; ensuring the sustainability of ecosystem functions; and preventing various ecological problems [29]. The resistance surface should simulate the challenges faced by species during migration in the real environment. Corridors act as pathways for energy and material transfer, which are a key component in guaranteeing ecological flow processes and functions [30]. The framework for constructing and optimizing the ESP in this study involved three steps (Figure 2): identifying ecological sources based on ecological “structure–function” relationships and revising the resistance surface using disturbance and sensitivity indices, then determining potential corridors via MCR modeling using Linkage Mapper. Finally, the ESP was optimized using the Gravity model. This framework was developed through comprehensive studies (Table 1) [31,32,33,34].
2.4. Identifying Ecological Sources with Ecological “Structure–Function”
Given the distinctive natural landscape features and intricate ecological processes of the Loess Plateau, we identified the ecological sources from ecological structure and function. The common landscape indicators are shown in Table 2 [35,36].
Ecological structure refers to the internal rules of the ecosystem characteristics, constricting the mechanism of action between the various features (including size, perimeter, shape, number, richness, spatial arrangement, and configuration) of a landscape patch. The most serious problems of ecological structure in the Loess Plateau are landscape fragmentation and poor connectivity between patches, which has further impacted on ecological diversity [37]. Guaranteeing suitable habitats and enabling organism dispersal in the landscape are key factors in ecosystem structure [18]. Therefore, fragmentation, connectivity, and SHDI were selected to describe ecosystem structure. Fragmentation is characterized by an increased number of patches, irregular shape, and reduced habitat area, which are often considered to have negative effects on ecological structure. Connectivity measures the degree of species movement and dispersal among patches, with a more connected ecological network facilitating more frequent exchanges. SHDI reflects landscape heterogeneity and richness, which is more sensitive to the distribution of different patch types.
The degradation of ecological function in the Loess Plateau is primarily influenced by climatic and biological factors. To quantify ecological functions, the NDVI, precipitation, temperature, and habitat quality were measured. Vegetation plays a significant role in soil and water conservation, with increased vegetation cover promoting organism migration, optimizing spatial patterns, and preventing soil erosion [38]. Habitat quality reflects the biodiversity function from the spatial distribution [39]. Climate is crucial for plant growth, land erosion, and landscape structure in the Loess Plateau [40].
The formula of each index was defined as follows:
where represents the ecological fragmentation index, is the number of patches, and and are the total edge length and area, respectively. Fragmentation was calculated as a value between 0 and 1.
where is the connectivity index, is the critical distance among patches , and , and is the patch number of each type in the landscape. The value of the index is between 0 and 1.
where is the diversity index, and indicates the area ratio of the patch.
Habitat quality, as one of the most vital ecosystem service functions, is often used to assess the effectiveness of biodiversity conservation. We calculated habitat quality using the InVEST model.
The framework system was calculated as follows:
where and indicate ecological structure and function, respectively, FW is , denotes the connectivity index and fragmentation index, respectively, and , , and are the habitat quality, mean annual precipitation, and temperature, respectively. The is the weight. The weight is determined by AHP. The importance of each index was assigned using a 1–9 scale method, referring to the related literature [41,42] and expert opinions. Then, a judgment matrix was built using SPSS (the weight determination methods in this paper were the same), where , , , , , , and . Ecological sources were identified with > 0.6.
2.5. Revising Ecological Resistance Surface Using Disturbance and Sensitivity
Ecological disturbance and sensitivity in the Loess Plateau are the most prominent factors acting as resistance surfaces. Human construction activity represents a major and severe form of disturbance in this region, impeding organism migration, material circulation, energy flow, and diminishing natural purity. This directly impacts the ecological security pattern [43]. Ecological sensitivity denotes the likelihood and potential for regional ecological issues, with regions of higher sensitivity being more prone to ecological environmental problems. The essence of ecological sensitivity assessment is to clearly identify the potential ecological risks within the current natural environment. The Loess Plateau faces serious soil erosion and desertification, negatively affecting its natural ecosystems and social economy [44]. Therefore, the ecological resistance surface was revised using disturbance and sensitivity indices. The resistance coefficients were assigned values as shown in Table 3, based on a previous study [45].
A disturbance index was established using the following formula:
where is the disturbance index, is the area of construction land, and is total area.
The ecological sensitivity index is expressed as follows:
where , , and represent soil erosion sensitivity, desertification sensitivity, and ecological sensitivity index, respectively. Si is the sensitivity index of , including soil texture, slope, and vegetation, Ck is the land use type, and is the weight. Therefore, the ecological resistance surface is expressed as:
where , , and represent the ecological resistance surface, disturbance index, and ecological sensitivity index, respectively.
2.6. Extracting Potential Corridors Using the MCR Model
MCR refers to the cost of movement from a source to a destination [46,47], and was revised by Yu (1999) [48]. The model considers three factors: ecological sources, distances, and landscape features. It is mathematically expressed as follows:
where is the spatial distance of a species from source to patch , and represents the resistance coefficient of matrix .
2.7. Optimizing ESP via the Gravity Model
The Gravity model was used to distinguish ordinary corridors and primary corridors and construct a hierarchy of ecological corridor networks, which in turn calculated the interactions between nodes. The equation of the Gravity model can be calculated as follows:
where denotes the interaction between sources a and b; and represent corresponding weights; is the standardized cumulative resistance of the corridor between these nodes; is the cumulative resistance of the corridor between sources a and b; refers to the maximum value of cumulative resistance; and are the standardized sizes of these sources; and and indicate the corresponding source weights.
2.8. Ecological Security Zone
The ecological security zone was established by creating a 10 km buffer zone around ecological sources and primary corridors. These zones were further divided into a high-security zone (distance cost < 1000) and a medium-security zone (1000 < distance cost < 3000).
3. Results
3.1. Ecological Sources in the Loess Plateau from 2000 to 2020
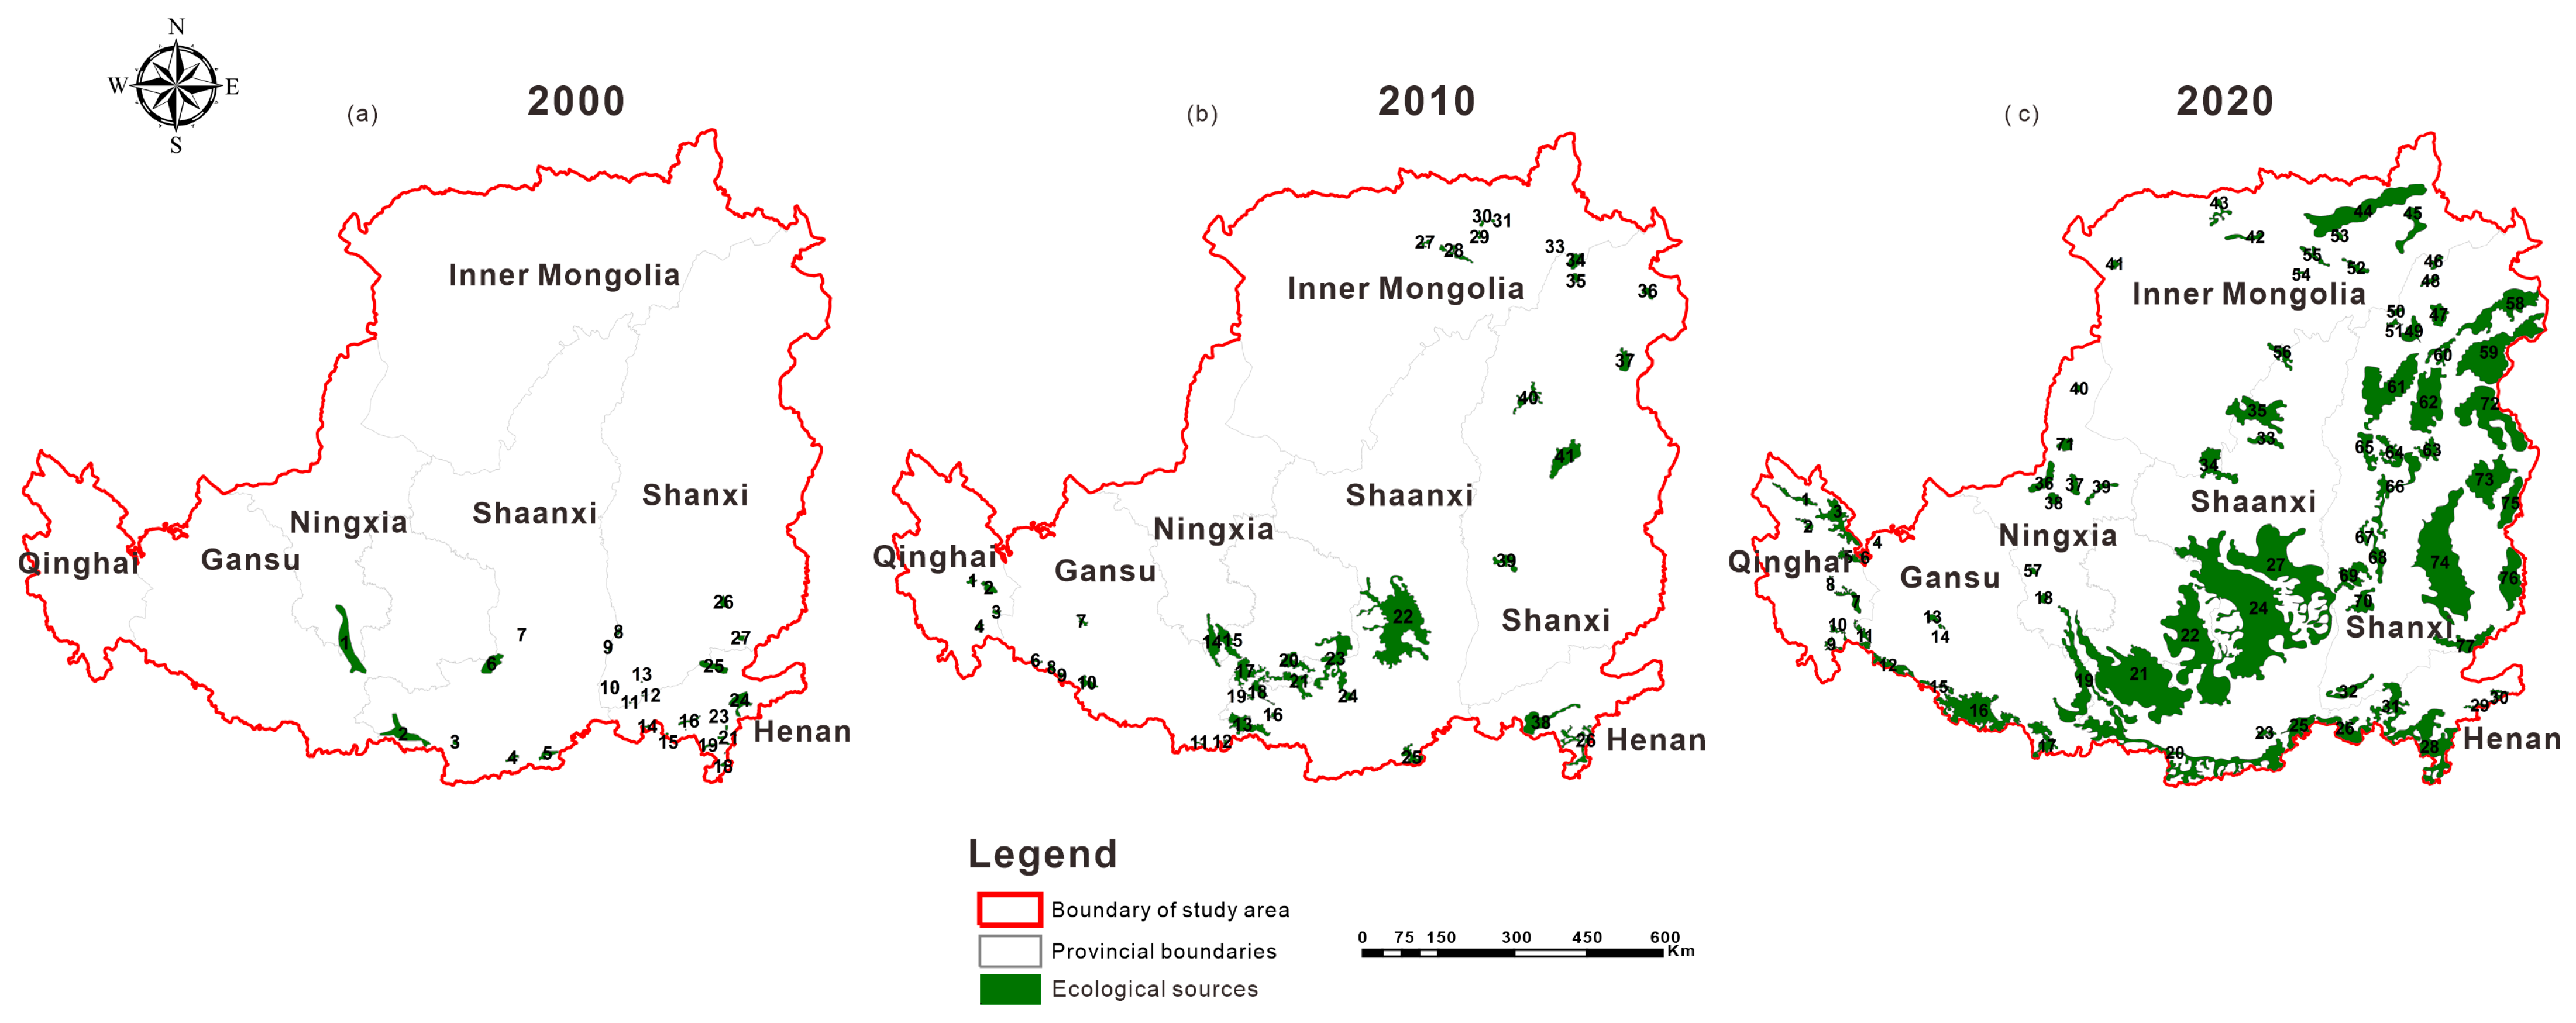
The study identified a total of 27, 41, and 77 ecological sources, covering areas of 4263.810 km2, 18,566.034 km2, and 113,209.595 km2 from 2000 to 2020, respectively. The number and area of ecological sources decreased from southeast to northwest, with the maximum areas covering 1334.332 km2, 5766.378 km2, and 13,162.947 km2 in 2000, 2010, and 2020, respectively (Figure 3 and Table 4). In 2000, ecological sources were primarily distributed in the southern Loess Plateau, with the largest number found in Henan, while Shaanxi had the maximum total area of ecological sources (1573.262 km2) (Figure 3a). In 2010, 17 ecological sources were distributed across Gansu, covering a total area of 12,547.432 km2. Ningxia and Henan each had two ecological sources, of which the total areas were 1341.986 km2 and 1679.187 km2, respectively. In Qinghai, four ecological sources were identified; the areas of these were the smallest at 464.522 km2 (Figure 3b). In 2020, there was a significant increase in ecological sources in Shanxi, with 28 ecological sources identified, covering a total area of 42,236.743 km2. A few ecological sources were identified in Qinghai and Ningxia, covering areas of 2715.901 km2 and 2979.969 km2, respectively (Figure 3c).
3.2. The Ecological Resistance Surface in the Loess Plateau from 2000 to 2020
The average ecological resistance coefficients in the Loess Plateau were 0.156, 0.140, and 0.136 in 2000, 2010, and 2020, respectively, exhibiting a decreasing trend (Figure 4). In 2000, the ecological resistance coefficient ranged from 0.050 to 0.313, with high resistance areas scattered in the northwestern (west, north of inner Mongolia), southwestern (Gansu and Ningxia), and southern (south of the junction of Shaanxi and Henan) parts of the Loess Plateau (Figure 4a). In 2010, ecological resistance reductions were observed, mainly in Ningxia, northwestern Shanxi, and inner Mongolia, with values ranging from 0.048 to 0.277. Regions of low resistance were found in middle Shaanxi and Shanxi. Moreover, in 2020, the minimum and maximum values were 0.046 and 0.241, respectively (Figure 4b). The highest values were concentrated in central Shanxi, northern inner Mongolia, and southern Shaanxi, with the ecological resistance coefficient being significantly reduced in the western region (Figure 4c).
3.3. Potential Ecological Corridors in the Loess Plateau from 2000 to 2020
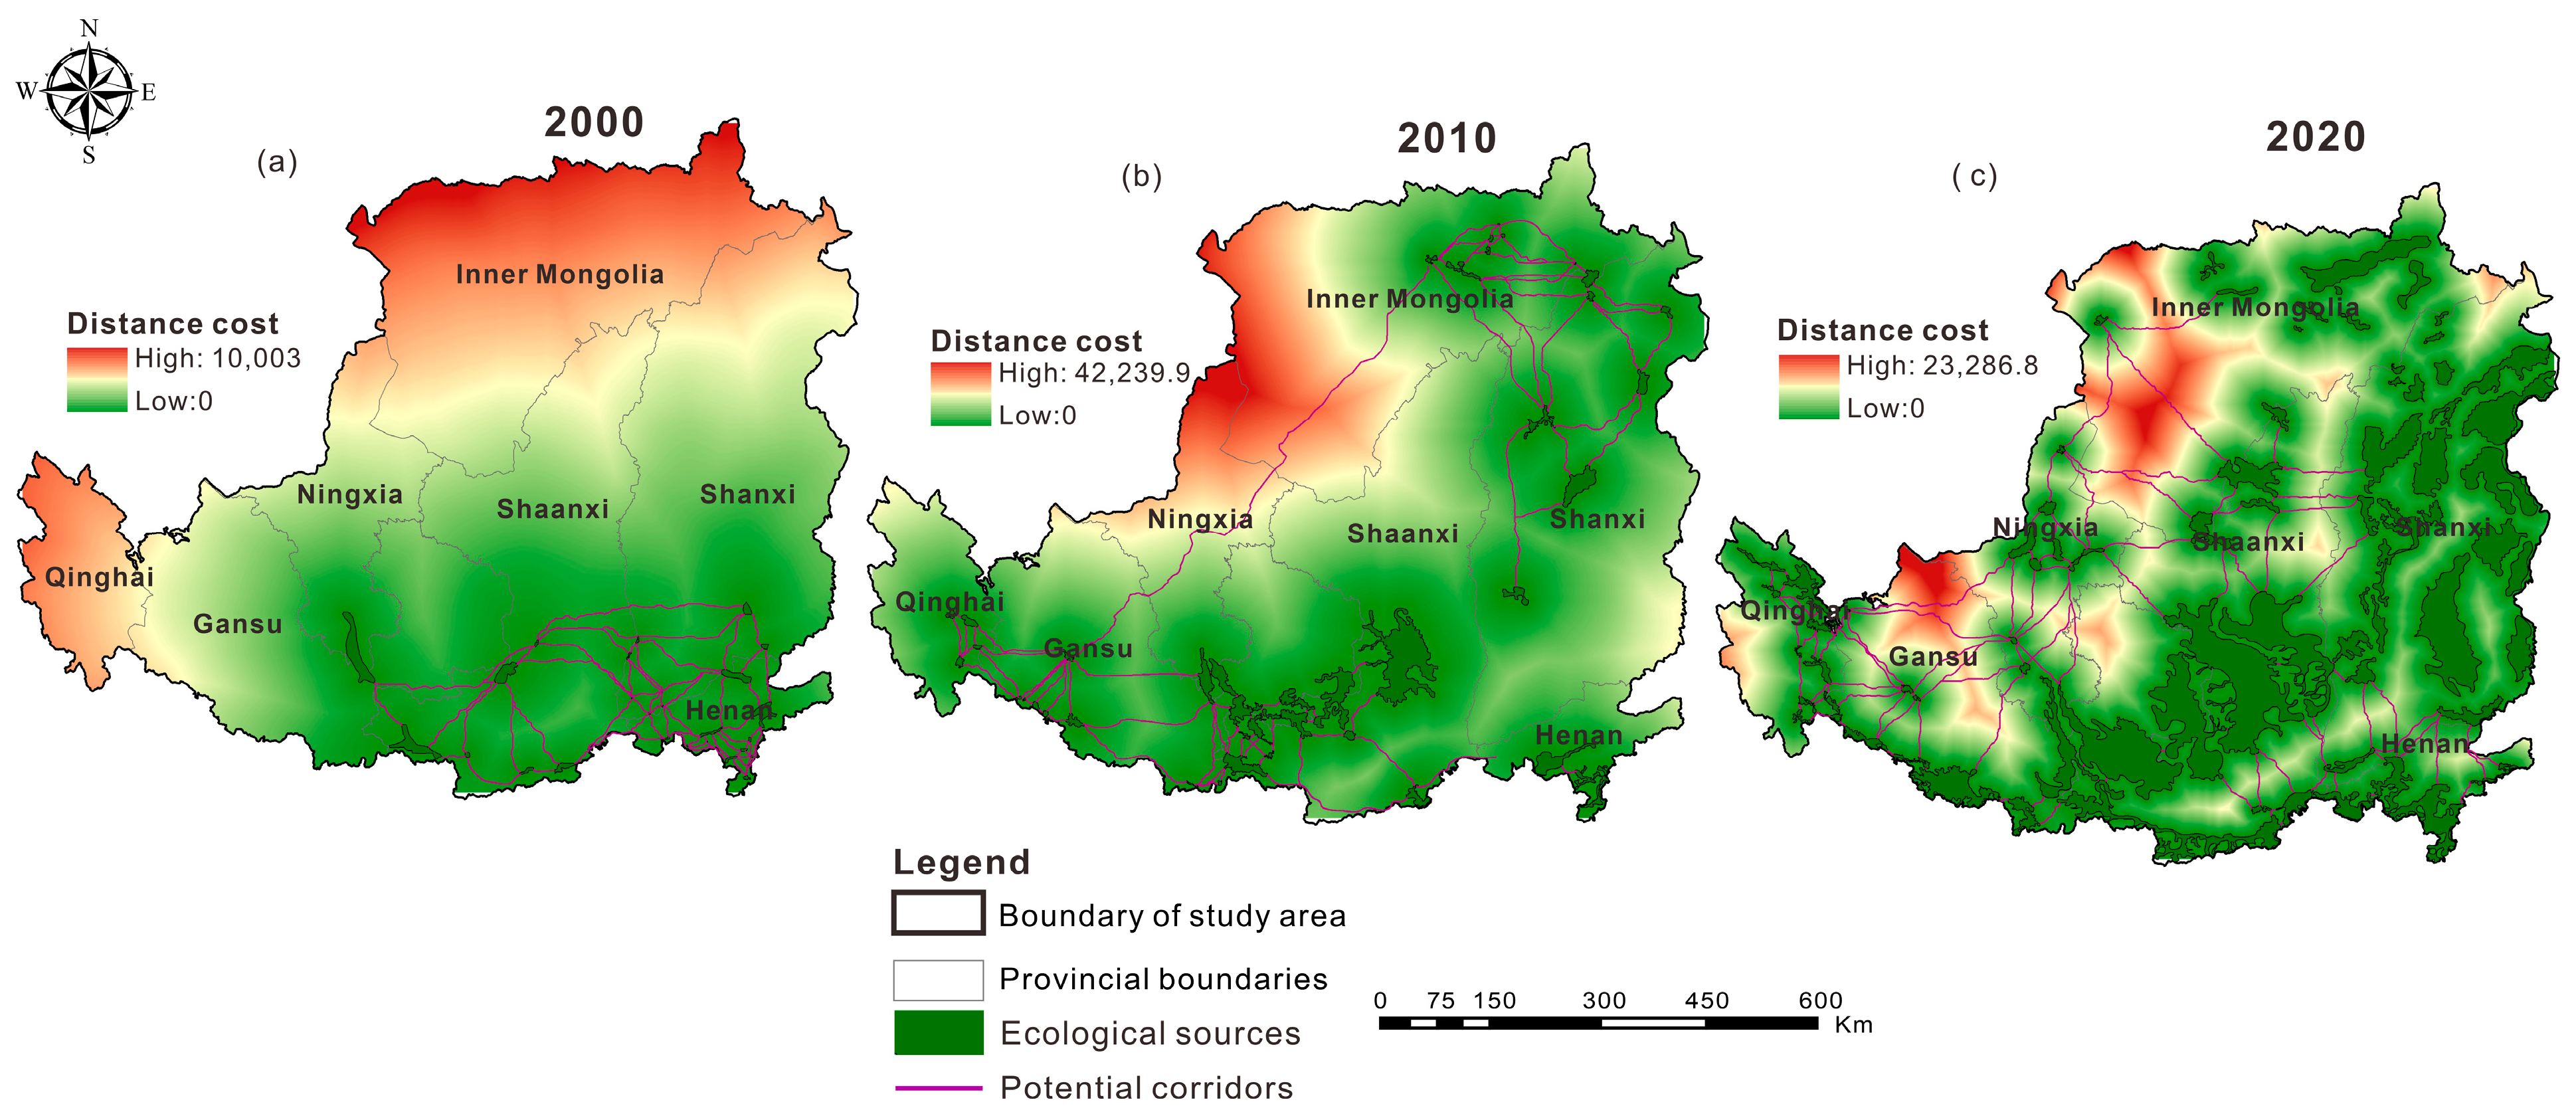
The number of corridors significantly increased from 2000 to 2020 (Figure 5 and Table 5). In 2000, there were 64 potential corridors, with a total length of 4579.326 km. The length of each corridor varied from 8.783 km to 304.375 km, with an average length of 71.552 km (Table 5). The spatial pattern of the ecological corridors was clustered in the southern part of the study area, spanning through Gansu, Shaanxi, Shanxi, and Henan (Figure 5a). The distance cost ranged from 0 to 100,003, declining from north to south and from west to east. Furthermore, 95 potential corridors were extracted in 2010, totaling 6526.996 km in length, and with an average length of 76.788 km. The longest corridor was 747.333 km, while the shortest was 1.174 km (Table 5). One vertical corridor extended from southwest to northeast, and the other corridors were mostly clustered together around the study regions, which resembled reticulation. The maximum distance cost was 42,239.9, which was found in the northwest region (Figure 5b). In 2020, the number of potential corridors increased to 105, with a total length of 7015.174 km, ranging from 1.624 km to 258.197 km (Table 5). The spatial pattern in 2020 exhibited a network-like structure, with vertical corridors intersecting due to enhanced ecological connectivity in the central and northwestern regions, resulting in shorter average corridor lengths. The highest distance cost was 23,286.8, and two high-cost regions were located in east inner Mongolia and north Gansu (Figure 5c).
3.4. The Temporal and Spatial Characteristics of ESP in the Loess Plateau
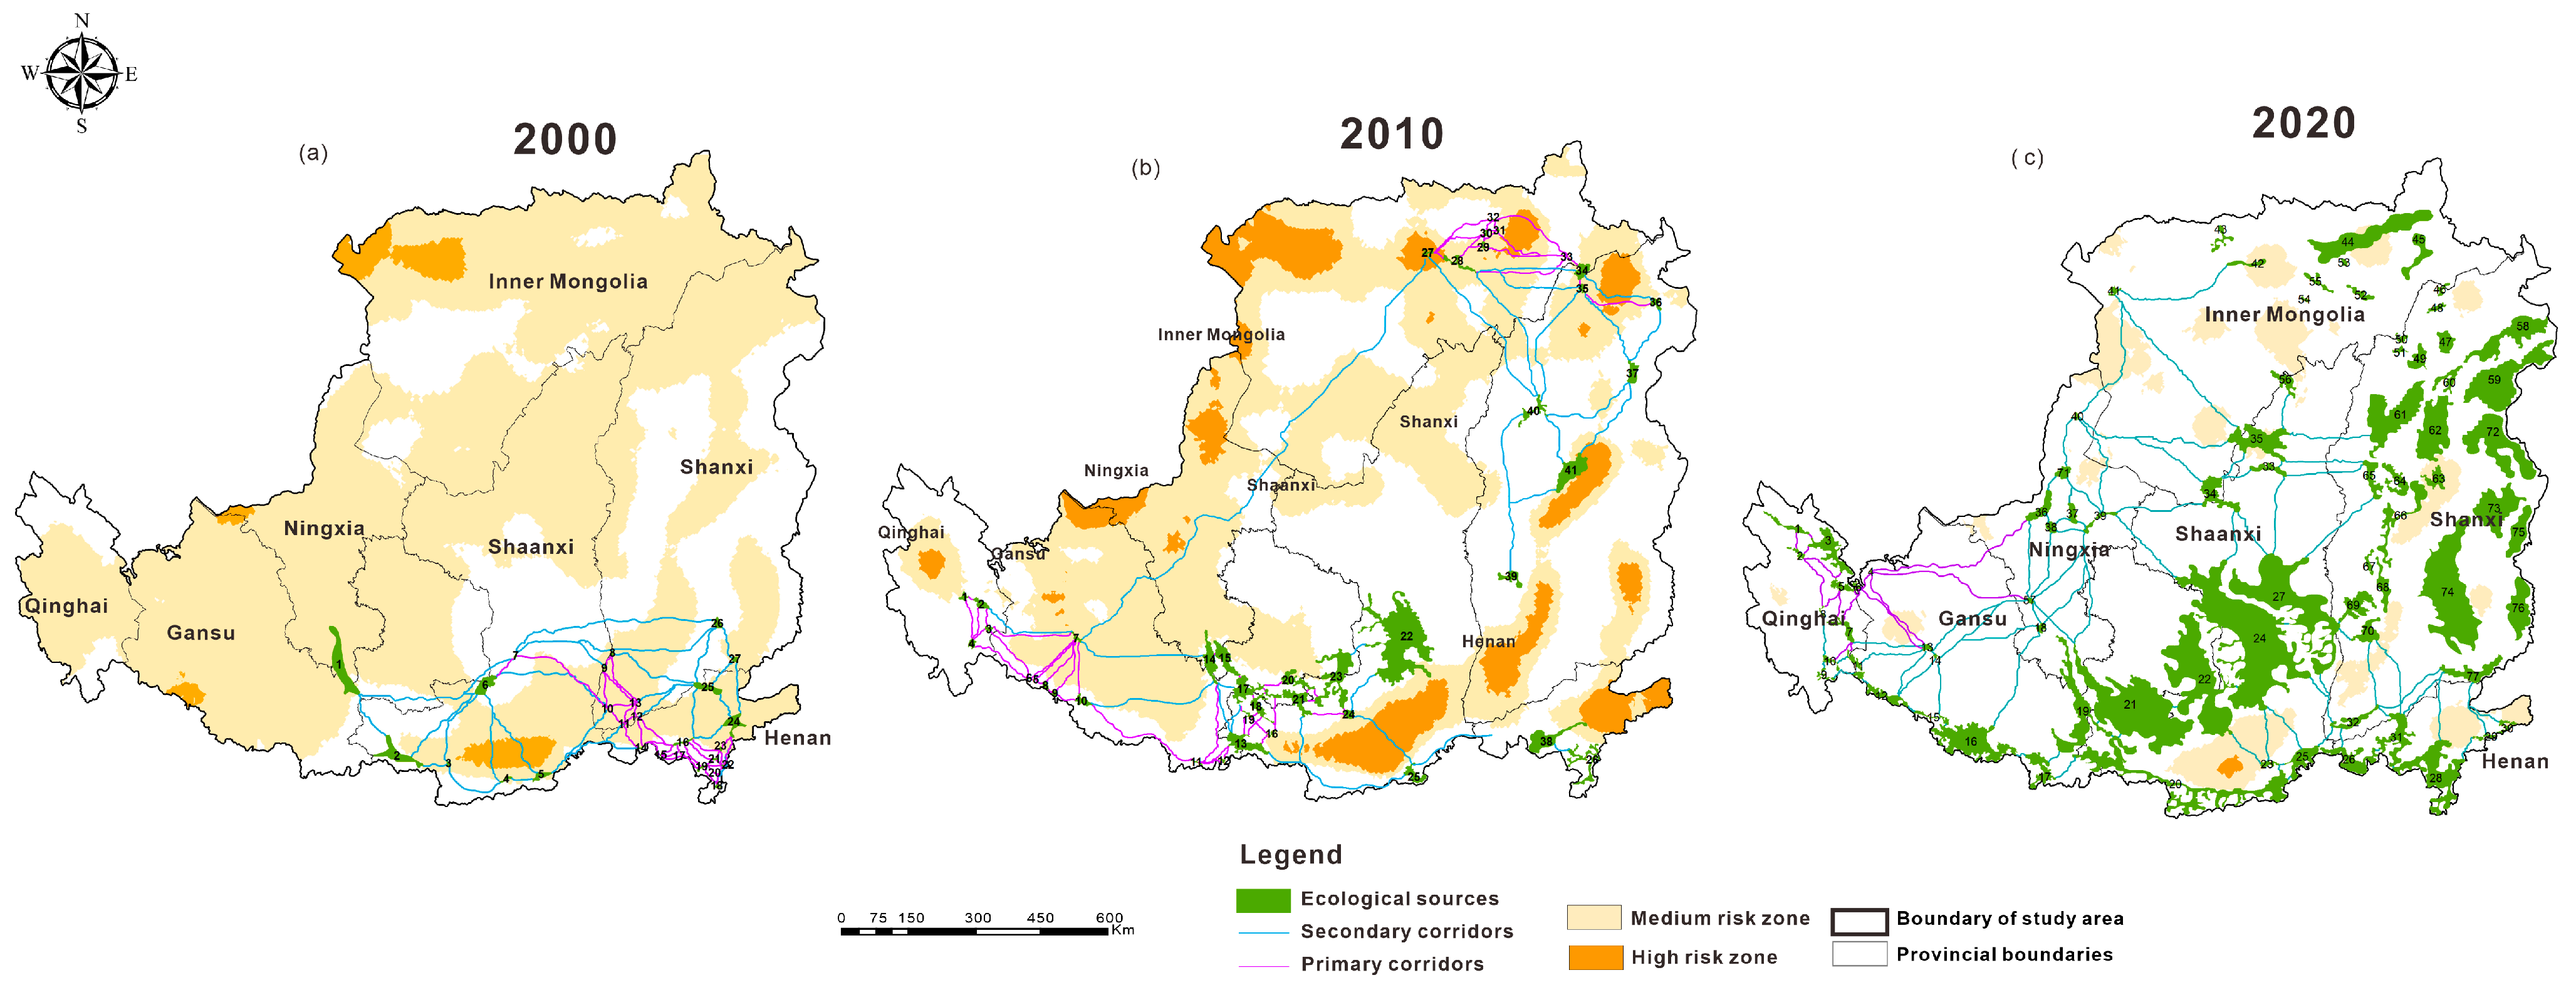
The number and length of primary ecological corridors increased from 2000 to 2020, and then decreased (Figure 6 and Figure 7). In 2000, there were 35 primary ecological corridors and 29 secondary ecological corridors. The primary corridors covered a total length of 1261.513 km and were distributed in the center of corridor network, running from southeast to northwest (Figure 6a). In 2020, the number of primary ecological corridors was 58, with a total length of 2495.551 km. These corridors were clustered in the southwest (Qinghai and the junction between Gansu and Shaanxi) and northeast (inner Mongolia and north Shanxi) regions (Figure 6b). In contrast, there were only 18 primary corridors in 2020, covering a length of 1120.536 km. These were concentrated in the southwest region (Qinghai, Gansu, and Ningxia) (Figure 6c). In addition, the risk zone area, as identified by ecological resistance coefficient, declined from 2000 to 2020.
3.5. Ecological Security Zone in the Loess Plateau from 2000 to 2020
The ecological security zone exhibited an expanding trend, encompassing a total area of 5048.6355 km2, 162,579.375 km2, and 360,882.5625 km2 in 2000, 2010, and 2020, respectively (Figure 8). From 2000 to 2010, the high security zone had a smaller area compared to the medium security zone. Specifically, the areas of high and medium security zones in 2000 were 1783.20 km2 and 3265.44 km2, respectively (Figure 8a). In 2021, these areas had expanded significantly to cover 74,832.36 km2 and 87,747.01 km2, respectively (Figure 8b). Notably, in 2020, the area of the high security zone was 1.82 times larger than that of the medium security zone (Figure 8c).
4. Discussion
4.1. Ecological Security Pattern in the Loess Plateau
The ESP in the Loess Plateau showed significant improvement from 2000 to 2020, with an observed increase in ecological sources, corridors, and security zones (Figure 3, Figure 5, Figure 6 and Figure 8). These findings are in line with previous studies by Sun et al., 2015, Su et al., 2022, and Shi et al., 2023 [49,50,51], suggesting an overall enhancement in the ecological environment in the region over the past two decades. This improvement can be attributed to initiatives such as the ‘Grain to Green’ restoration program, the 3-North Shelter Forest Program, and the ecological conservation and high-quality development strategy in the Yellow River Basin, which have led to notable achievements on the Loess Plateau. For example, the soil conservation rate in the area has increased to 63.44%, and the forest coverage rate has risen to 19.55% [52,53]. These significant enhancements in agricultural productivity and vegetation coverage may have further affected the ESP [54].
The high and medium security zones are primarily located in the southeastern part of the Loess Plateau, corresponding closely to the landscape distribution in the Loess Plateau. The northwest region features a desert steppe landscape, primarily caused by wind erosion, transportation, and accumulation processes. The central part is composed of temperate semi-arid grassland and forest grassland landscapes, which are mainly affected by fluviatile erosion. In the southeast area of the Loess Plateau, there is a warm temperate semi-humid deciduous broad-leaved forest landscape. The landscape differentiation gradient in the Loess Plateau extends from southeast to northwest [55,56]. Additionally, the ecological security pattern is intricately linked to the ecological zoning of the region. These ecological zones were established based on ‘The Comprehensive Management Plan Outlined for the Loess Plateau’ (https://www.gov.cn/zwgk/2011-01/17/content_1786454.htm, accessed on 10 April 2024) [57]. Previous studies have indicated that the eastern river valley plain region and earth-rocky mountainous areas exhibit the lowest ecological vulnerability, followed by the loess hilly and gully region in the center, while the agricultural irrigation region and sandy desert region in the west display the highest vulnerability. This further supports our initial conclusion.
The ecological sources in 2000 were mainly distributed across the junction of Guyuan city and Pingliang city, including Jingyuan county, Zhuanglang county, Longde county, Yuanzhou county, and Huating county (Figure 3a). This region is situated in the eastern part of Liupan mountain and boasts numerous national forest parks, nature reserves, abundant water resources, and favorable climatic conditions. The relatively pristine original environment and the protection of natural forests contributed to the initial accumulation of ecological sources. Furthermore, in 2010, the ecological sources were predominantly concentrated in Tongchuan city (Yijun county), Xianyang city (Xunyi county), and Southern Yan’an city (Luochuan county, Huangling county, and Fuxian county), all located in the loess hilly-gully area. Previous studies have revealed that the land use structure of Huangling county and Fuxian county mainly comprises forest land, and the southern part of Yan’an city has the lowest ecological risk [58]. The ecological security of Tongchuan city has been gradually improving [6], which aligns with our findings. In addition, some studies have suggested that forest land in the northern and central parts of Yan’an experienced rapid growth after 2010, leading to a significant decrease in soil erosion rates in the Beiluohe basin [59,60]. Moreover, the implementation of desertification control projects and comprehensive management of sloping croplands in the Shaanxi Loess Plateau has optimized the quality of the ecological security barrier, leading to the sustained and positive transformation of the ecosystem. This has resulted in the expansion of ecological sources in Yan’an from south to north between 2010 and 2020. Likewise, significant improvements in ecological sources have been observed in Shanxi, particularly in south-central Changzhi city and northeast Xinzhou county. In 2020, the largest ecological sources were identified in Qinyuan county and Anze county of Changzhi city. These were characterized by abundant water resources, a forest coverage rate of 57%, and designation as a national ecological demonstration area and provincial forest park [61]. Notably, some ecological sources have also accumulated in the central and southern parts of inner Mongolia, especially in Wuchuan county, Tumd Left Banner, and Tumd Right Banner. These areas are flat with fertile soil, which is the main producing unit of grains and crops [62]. In addition, the shape and structure of ecological corridors became more complex from 2000 to 2020, impacting ecosystem functionality and stability (Figure 5 and Figure 6). A dense ecological corridor network promotes species interactions and energy flow, ensuring the continuity of ecological processes and services [63]. The increased connectivity and closure of ecological corridors has facilitated species migration and diffusion in the Loess Plateau.
4.2. Optimizing ESP in the Loess Plateau
ESP could speculate on the regularity of environmental changes, strengthen the sustainable utilization of regional natural resources, and promote high-quality ecosystem development. While the ecological security of the Loess Plateau has shown improvement, it is crucial to recognize that regional ecological construction is a dynamic and continuous process. Therefore, forward-thinking ecological management is essential. Considering current landscape characteristics, urban development, and ecological construction in the Loess Plateau, it is essential to establish a long-term optimization plan for the ESP. Specifically, the optimization of the ESP should prioritize the construction of ecological sources. This involves safeguarding existing ecological sources, creating new ecological land, and expanding the reach of ecological sources. In the Beiluohe basin, ecological sources were concentrated, necessitating the protection of existing sources and the enhancement of water resource utilization and flood control facilities. In the northwest of the Loess Plateau, where ecological sources are scarce, the focus of landscape ecological construction should be on establishing shelter belts to restore the grassland landscape. Furthermore, drought monitoring should be conducted in a timely manner to mitigate climate factor-related damage to the ecological environment. The mineral development process in the Loess Plateau has caused surface stripping and ground collapse. The coal fields in this area are mainly located in Qinshui county, Hexi county, Xishan county, Hedong county, Weibei county, and Huanglong county. It is essential to restore vegetation in mining areas, and in some cases, ecosystem reconstruction may be necessary based on specific circumstances. When constructing corridor networks, it is important to enhance the protection of existing corridors and optimize the ecological green space along them, while minimizing construction on agricultural land. It is advisable to establish appropriate buffer zones along the potential ecological corridors to reduce human intervention. In the process of urbanization, the increasing environmental needs of urban residents should be addressed by leveraging the various functions of green spaces, including cultural, aesthetic, and recreational aspects.
4.3. Limitation
Our study considered climate, soil, vegetation, topography, and biodiversity to construct ESP. This approach is well-suited for regions sharing ecological characteristics with the Loess Plateau. Nevertheless, due to the vast expanse of the Loess Plateau, this method may encounter limitations in smaller-scale areas, which can be addressed by adjusting index types and weights based on specific conditions. In cases of significantly high or low disturbance levels, adaptations must be made to the method to ensure applicability. For example, in forested regions with high ecological quality, greater emphasis should be placed on biodiversity, vegetation functions, and climate impacts on security patterns. Conversely, in mining areas with delicate ecosystems, priority should be given to human activities and geological factors. In future research, it is imperative to comprehensively consider various factors such as social, economic, ecological, natural, and biological aspects in order to fully grasp the complexity of the ecosystem and the effects of human activities on the ecological security pattern. Furthermore, by conducting field surveys and analyzing data, scientific ecological protection policies and measures can be developed to promote sustainable development of the ecological environment and foster a harmonious coexistence between humanity and nature.
5. Conclusions
Overall, this study constructed a novel and comprehensive ESP based on ecological “function–structure”, taking into account key factors influencing the ecological environment of the Loess Plateau, such as climate, soil, vegetation, topography, and biodiversity. The MCR model was utilized to identify ecological sources and corridors, integrating a time scale into the ESP to examine the spatiotemporal heterogeneity of ecological security. Targeted recommendations for enhancing ecological security in the Loess Plateau were proposed based on spatial patterns. Results indicated overall improvement in the ESP, with the southeastern region showing better ecological security compared to the northwestern region. These findings offer a creative and scientific framework for dynamic monitoring and evolution of ecological security, contributing to the advancement of ecological management in the Loess Plateau.
Author Contributions
Conceptualization, Y.Z. and X.J.; methodology, Y.Z., M.L. and X.J.; validation, M.L., X.J., Y.Z., and S.Y.; formal analysis, M.L., H.W. and C.C.; data curation, M.L., H.W., D.L. and J.L.; writing—original draft preparation, Y.Z. and M.L.; writing—review and editing, Y.Z., M.L. and X.J.; visualization, M.L.; supervision, Y.Z. and X.J. project administration and funding acquisition, Y.Z. and X.J. All authors have read and agreed to the published version of the manuscript.
Funding
This work was supported by the Innovation Capability Support Program of Shaanxi (2024RS-CXTD-55).
Data Availability Statement
The original contributions presented in the study are included in the article, further inquiries can be directed to the corresponding author.
Conflicts of Interest
Author Huanyuan Wang, Juan Li were employed by the company Shaanxi Provincial Land Engineering Construction Group Co., Ltd. The remaining authors declare that the research was conducted in the absence of any commercial or financial relationships that could be construed as a potential conflict of interest.
References
- Chen, X.; Zhou, C.H. Review of the studies on ecological security. Prog. Geogr. 2005, 24, 8–20. [Google Scholar]
- Yu, K. Security patterns and surface model in landscape ecological planning. Landsc. Urban Plan. 1996, 36, 1–17. [Google Scholar] [CrossRef]
- Ma, K.M.; Fu, B.J.; Li, X.Y.; Guan, W.B. The regional pattern for ecological security (RPES): The concept and theoretical basis. Acta Ecol. Sin. 2004, 4, 761–768. [Google Scholar]
- Peng, J.; Zhao, H.J.; Liu, Y.X.; Wu, J.S. Research progress and prospect on regional ecological security pattern construction. Geogr. Res. 2017, 36, 407–419. [Google Scholar]
- Chen, L.D.; Jing, Y.C.; Sun, R.H. Urban eco-security pattern construction: Targets, principles and basic framework. Acta Ecol. Sin. 2018, 38, 4101–4108. [Google Scholar]
- Zhang, A.Q.; Li, P.H.; Xu, L.P. Valuation and analysis of ecological security based on the improved three-dimensional ecological footprint in Shaanxi Province, China. Ecol. Indic. 2022, 144, 109483. [Google Scholar] [CrossRef]
- Ke, S.; Pan, H.; Jin, B.W. Identification of Priority Areas for Ecological Restoration Based on Human Disturbance and Ecological Security Patterns: A Case Study of Fuzhou City, China. Sustainability 2023, 15, 2842. [Google Scholar] [CrossRef]
- Li, Y.Y.; Zhang, Y.Z.; Jiang, Z.Y.; Guo, C.X.; Zhao, M.Y.; Yang, Z.G.; Guo, M.Y.; Wu, B.Y.; Chen, Q.L. Integrating morphological spatial pattern analysis and the minimal cumulative resistance model to optimize urban ecological networks: A case study in Shenzhen city, China. Ecol. Process. 2021, 10, 63. [Google Scholar] [CrossRef]
- Liu, Q.Q.; Sun, Y.J.; Mei, Y.; Jian, Z.; Pan, F.; Zhang, L.G. Construction and Analysis of Ecological Security Pattern of Qingdao Based on MSPA and MCR Models. Pol. J. Environ. Stud. 2022, 32, 155–169. [Google Scholar] [CrossRef]
- Yang, L.A.; Li, Y.L.; Jia, L.J.; Ji, Y.F.; Hu, G.G. Ecological risk assessment and ecological security pattern optimization in the middle reaches of the Yellow River based on ERI+MCR model. J. Geogr. Sci. 2023, 33, 823–844. [Google Scholar] [CrossRef]
- Li, Z.T.; Li, M.; Xia, B.C. Spatio-temporal dynamics of ecological security pattern of the Pearl River Delta urban agglomeration based on LUCC simulation. Ecol. Indic. 2020, 114, 106319. [Google Scholar] [CrossRef]
- Peng, J.; Pan, Y.J.; Liu, Y.X.; Zhao, H.J.; Wang, Y.L. Linking ecological degradation risk to identify ecological security patterns in a rapidly urbanizing landscape. Habitat Int. 2018, 71, 110–124. [Google Scholar] [CrossRef]
- Li, Q.; Zhou, Y.; Yi, S.Q. An integrated approach to constructing ecological security patterns and identifying ecological restoration and protection areas: A case study of Jingmen, China. Ecol. Indic. 2022, 114, 106319. [Google Scholar] [CrossRef]
- Liu, X.Y.; Su, Y.X.; Li, Z.G.; Zhang, S. Constructing ecological security patterns based on ecosystem services trade-offs and ecological sensitivity: A case study of Shenzhen metropolitan area, China. Ecol. Indic. 2023, 154, 110626. [Google Scholar] [CrossRef]
- Lai, S.H.; Sha, J.M.; Eladawy, A.; Li, X.M.; Wang, J.L.; Kurbanov, E.; Lin, Z.J.; Wu, L.; Han, R.; Su, Y.C. Evaluation of ecological security and ecological maintenance based on pressure-state-response (PSR) model, case study: Fuzhou city, China. Hum. Ecol. Risk Assess. 2022, 28, 734–761. [Google Scholar] [CrossRef]
- Li, L.; Huang, X.J.; Wu, D.F.; Yang, H. Construction of ecological security pattern adapting to future land use change in Pearl River Delta, China. Appl. Geogr. 2023, 154, 102946. [Google Scholar] [CrossRef]
- Jin, L.J.; Xu, Q.L.; Yi, J.H.; Zhong, X.C. Integrating CVOR-GWLR-Circuit model into construction of ecological security pattern in Yunnan Province, China. Environ. Sci. Pollut. Res. 2022, 29, 81520–81545. [Google Scholar] [CrossRef]
- Fu, B.J.; Wang, S.; Liu, Y.; Liu, J.B.; Liang, W.; Miao, C.Y. Hydrogeomorphic ecosystem responses to natural and anthropogenic changes in the Loess Plateau of China. Annu. Rev. Earth Planet. Sci. 2017, 45, 223–243. [Google Scholar] [CrossRef]
- Zhang, X.Y.; Liu, K.; Wang, S.D.; Wu, T.X.; Li, X.K.; Wang, J.N.; Wang, D.C.; Zhu, H.T.; Tan, C.; Ji, Y.H. Spatiotemporal evolution of ecological vulnerability in the Yellow River Basin under ecological restoration initiatives. Ecol. Indic. 2022, 135, 108586. [Google Scholar] [CrossRef]
- Shen, W.C.; Zhang, J.J.; Wang, K.; Zhang, Z.F. Identifying the spatio-temporal dynamics of regional ecological risk based on Google Earth Engine: A case study from Loess Plateau, China. Sci. Total Environ. 2023, 873, 162346. [Google Scholar] [CrossRef]
- Li, Y.; Zhang, P.J.; Qin, Y.C. Ecological Service Evaluation: An Empirical Study on the Central Loess Plateau, China. Pol. J. Environ. Stud. 2020, 29, 1691–1701. [Google Scholar] [CrossRef]
- Xiong, M.Q.; Li, F.J.; Liu, X.H.; Liu, J.F.; Luo, X.P.; Xing, L.Y.; Wang, R.; Li, H.Y.; Guo, F.Y. Characterization of Ecosystem Services and Their Trade-Off and Synergistic Relationships under Different Land-Use Scenarios on the Loess Plateau. Land 2023, 12, 2087. [Google Scholar] [CrossRef]
- Liu, S.L.; Guo, X.D.; Lian, G.; Wang, J. Multi-scale ecological security evaluation of fragile areas of the Loess Plateau. Chin. J. Appl. Ecol. 2007, 7, 1554–1559. [Google Scholar]
- Fu, Y.; Shi, X.; He, J.; Yuan, Y.; Qu, L. Identification and optimization strategy of county ecological security pattern: A case study in the Loess plateau, China. Ecol. Indic. 2020, 112, 106030. [Google Scholar] [CrossRef]
- Wen, J.F.; Hou, K.; Li, H.H.; Zhang, Y.; He, D.; Mei, R.C. Study on the spatial-temporal differences and evolution of ecological security in the typical area of the Loess Plateau. Environ. Sci. Pollut. Res. 2021, 28, 23521–23533. [Google Scholar] [CrossRef]
- Jun, C.; Ban, Y.F.; Li, S.N. Open access to Earth land-cover map. Nature 2014, 514, 434. [Google Scholar] [CrossRef]
- Dong, J.W.; Kuang, W.H.; Liu, J.Y. Continuous land cover change monitoring in the remote sensing big data era. Sci. China Earth Sci. 2017, 60, 2223–2224. [Google Scholar] [CrossRef]
- Brovelli, M.A.; Molinari, M.E.; Hussein, E.; Chen, J.; Li, R. The first comprehensive accuracy assessment of GlobeLand30 at a national level: Methodology and results. Remote Sens. 2015, 7, 4191–4212. [Google Scholar] [CrossRef]
- Wu, J.S.; Zhang, L.Q.; Peng, J.; Feng, Z.; Liu, H.M.; He, S.B. The integrated recognition of the source area of the urban ecological security pattern in Shenzhen. Acta Ecol. Sin. 2013, 33, 4125–4133. [Google Scholar]
- Wei, H.; Zhu, H.; Chen, J.; Jiao, H.Y.; Li, P.H.; Xiong, L.Y. Construction and Optimization of Ecological Security Pattern in the Loess Plateau of China Based on the Minimum Cumulative Resistance (MCR) Model. Remote Sens. 2022, 14, 5906. [Google Scholar] [CrossRef]
- Filatova, T.; Verburg, P.H.; Parker, D.C.; Stannard, C.A. Spatial agent-based models for socio-ecological systems: Challenges and prospects. Environ. Model. Softw. 2013, 45, 1–7. [Google Scholar] [CrossRef]
- Zhuang, J.Q.; Peng, J.B.; Wang, G.H.; Javed, I.; Wang, Y.; Li, W. Distribution and characteristics of landslide in Loess Plateau: A case study in Shaanxi province. Eng. Geol. 2018, 236, 89–96. [Google Scholar] [CrossRef]
- Fan, J.; Shao, M.A.; Wang, Q.J.; Jones, S.B.; Reichardt, K.; Cheng, X.R.; Fu, X.L. Toward sustainable soil and water resources use in China’s highly erodible semi-arid loess plateau. Geoderma 2009, 155, 93–100. [Google Scholar]
- Qu, L.L.; Huang, Y.X.; Yang, L.F.; Liu, Y.R. Vegetation restoration in response to climatic and anthropogenic changes in the Loess Plateau, China. Chin. Geogr. 2020, 30, 89–100. [Google Scholar] [CrossRef]
- Risser, P.G.; Iverson, L.R. 30 years later—Landscape ecology: Directions and approaches. Landsc. Ecol. 2013, 28, 367–369. [Google Scholar] [CrossRef]
- Meurant, G. The Ecology of Natural Disturbance and Patch Dynamics; Academic Press: Cambridge, MA, USA, 2012. [Google Scholar]
- Zhang, L.X.; Fan, J.W.; Zhang, H.Y.; Zhou, D.C. Spatial-temporal Variations and Their Driving Forces of the Ecological Vulnerability in the Loess Plateau. Environ. Sci. 2022, 43, 4902–4910. [Google Scholar]
- Guo, M.J. Responses of Vegetation Coverage to Climate Change on the Loess Plateau Based on AVHRR/NDVI and Its Quantitative Analysis; Research Center of Soil and Water Conservation and Ecological Environment: Xi’an, China, 2014. [Google Scholar]
- Terrado, M.; Sabater, S.; Chaplin-Kramer, B.; Mandle, L.; Ziv, G.; Acuna, V. Model development for the assessment of terrestrial and aquatic habitat quality in conservation planning. Sci. Total Environ. 2016, 540, 63–70. [Google Scholar] [CrossRef]
- Shi, S.Y.; Yu, J.J.; Wang, F.; Wang, P.; Zhang, Y.C.; Jin, K. Quantitative contributions of climate change and human activities to vegetation changes over multiple time scales on the Loess Plateau. J. Clean. Prod. 2021, 755, 142419. [Google Scholar] [CrossRef] [PubMed]
- Wang, H. The Spatial-Temporal Analysis of Landscape Ecological Risk in Yulin. Master’s Thesis, Chang’an University, Xi’an, China, 2015. [Google Scholar]
- Shi, Y.Q.; Wang, N.L.; Li, T.S.; Wang, H. Landscape ecological risk and its spatiotemporal variation in Yulin. Arid Zone Res. 2019, 36, 494–504. [Google Scholar]
- Hu, X.J.; Ma, C.M.; Huang, P.; Guo, X. Ecological vulnerability assessment based on AHP-PSR method and analysis of its single parameter sensitivity and spatial autocorrelation for ecological protection? A case of Weifang City, China. Ecol. Indic. 2021, 125, 107464. [Google Scholar] [CrossRef]
- Luo, M.Y.; Zhao, Y.H.; Jia, X.; Zhang, P.; Zhao, M. Ecological vulnerability assessment and its driving force based on ecological zoning in the Loess Plateau, China. Ecol. Indic. 2024, 159, 111658. [Google Scholar] [CrossRef]
- Luo, M.Y.; Li, T.S. Spatial and temporal analysis of landscape ecological quality in Yulin. Environ. Technol. Innov. 2021, 23, 101700. [Google Scholar] [CrossRef]
- Knaapen, J.P.; Scheffer, M.; Harms, B. Estimating habitat isolation in landscape planning. Landsc. Urban Plan. 1992, 23, 1–16. [Google Scholar] [CrossRef]
- Li, Z.Y.; Yang, G.S.; Dong, Y.W. Establishing the ecological security pattern in rapidly developing regions: A case in the AYRAP. Nat. Resour J. 2007, 1, 106–113. [Google Scholar]
- Yu, K.J. Landscape ecological security patterns in biological conservation. Acta Ecol. Sin. 1999, 19, 8–15. [Google Scholar]
- Sun, W.Y.; Song, X.Y.; Mu, X.M.; Gao, P.; Wang, F.; Zhao, G.J. Spatiotemporal vegetation cover variations associated with climate change and ecological restoration in the Loess Plateau. Agric. For. Meteorol. 2015, 209, 87–99. [Google Scholar] [CrossRef]
- Su, K.; Liu, H.J.; Wang, H.Y. Spatial–Temporal Changes and Driving Force Analysis of Ecosystems in the Loess Plateau Ecological Screen. Forests 2022, 13, 54. [Google Scholar] [CrossRef]
- Shi, M.; Lin, F.; Jing, X.; Li, B.Y.; Shi, Y.; Hu, Y.M. Ecological Environment Quality Assessment of Arid Areas Based on Improved Remote Sensing Ecological Index—A Case Study of the Loess Plateau. Sustainability 2023, 15, 13881. [Google Scholar] [CrossRef]
- Fu, W.; Lv, Y.H.; Fu, B.J.; Hu, W.Y. Landscape ecological risk assessment under the influence of typical human activities in the Loess Plateau, Northern Shaanxi. J. Ecol. Rural. Environ. 2019, 35, 290–299. [Google Scholar]
- Cao, Y.; Li, H.W.; Liu, Y.L.; Zhang, Y.F.; Jiang, Y.K.; Dai, W.T.; Shen, M.X.; Guo, X.; Qi, W.N.; Li, L.; et al. Regional Contribution and Attribution of the Interannual Variation of Net Primary Production in the Yellow River Basin, China. Remote Sens. 2023, 15, 5212. [Google Scholar] [CrossRef]
- Yang, S.T. The Effect of Vegetation Restoration on Ecosystem Services Trade-Off and Synergy in the Typical Watershed of the Loess Plateau of China. Master’s Thesis, Xi’an University of Technology, Xianyang, China, 2020. [Google Scholar]
- Zhu, Y. Study on Spatial Distribution of Land Use Landscape Pattern under Human Activity Intensity Gradient in Loess Plateau. Master’s Thesis, Chengdu University of Technology, Chengdu, China, 2018. [Google Scholar]
- Lu, Y.H.; Fu, B.J.; Feng, X.M.; Zeng, Y.; Liu, Y.; Chang, R.Y.; Sun, G.; Wu, B.F. A policy-driven large scale ecological restoration: Quantifying ecosystem services changes in the Loess Plateau of China. PLoS ONE 2012, 7, e31782. [Google Scholar]
- Yang, Y.F.; Wang, B.; Wang, G.L.; Li, Z.S. Ecological regionalization and overview of the Loess Plateau. Acta Ecol. Sin. 2019, 39, 20. [Google Scholar]
- Zhou, X. Analysis of Land Use Change and Land Ecological Risk in Yan’an City. Master’s Thesis, Shaanxi Normal University, Xi’an, China, 2018. [Google Scholar]
- Chen, H. Spatial and Temporal Changes of Soil Erosion and Its Driving Factors before and after the “Grain for Green” Project in the Loess Plateau. Ph.D. Thesis, Northwest A&F University, Xianyang, China, 2019. [Google Scholar]
- Jiao, C.M.; Xie, M.Y.; Jiao, F.; Li, T.S. Spatial and temporal shifts in land use structure and changes of ecosystem service values in Yan’an city from 1990 to 2020. Bull. Soil Water Conserv. 2022, 41, 274–281. [Google Scholar]
- Liu, L.T.; Yu, S.C.; Zhang, H.J.; Wang, Y.; Liang, C. Analysis of Land Use Change Drivers and Simulation of Different Future Scenarios: Taking Shanxi Province of China as an Example. Int. J. Environ. Res. Public Health 2023, 20, 1626. [Google Scholar] [CrossRef] [PubMed]
- Song, R.Y.; Zhao, X.F.; Jing, Y.C.; Li, X.X.; Su, J.W.; Wang, X.; Zhao, D.D. Analysis of ecosystem protection and sustainable development strategies—Evidence based on the RWEQ model on the Loess Plateau, China. Sustainability 2022, 14, 11502. [Google Scholar] [CrossRef]
- Gregory, A.; Spence, E.; Beier, P.; Garding, E. Toward Best Management Practices for Ecological Corridors. Land 2021, 10, 140. [Google Scholar] [CrossRef]
Figure 1.
Geographical location and elevation of the Loess Plateau.

Figure 2.
The framework used to construct and optimize the ESP.

Figure 3.
The spatial pattern of the ecological sources in the Loess Plateau from 2000 to 2020.

Figure 4.
The spatial and temporal characteristics of ecological resistance surfaces in the Loess Plateau.
Figure 4.
The spatial and temporal characteristics of ecological resistance surfaces in the Loess Plateau.

Figure 5.
The spatial distribution of potential corridors in the Loess Plateau.

Figure 6.
The temporal and spatial characteristics of ESP in the Loess Plateau.

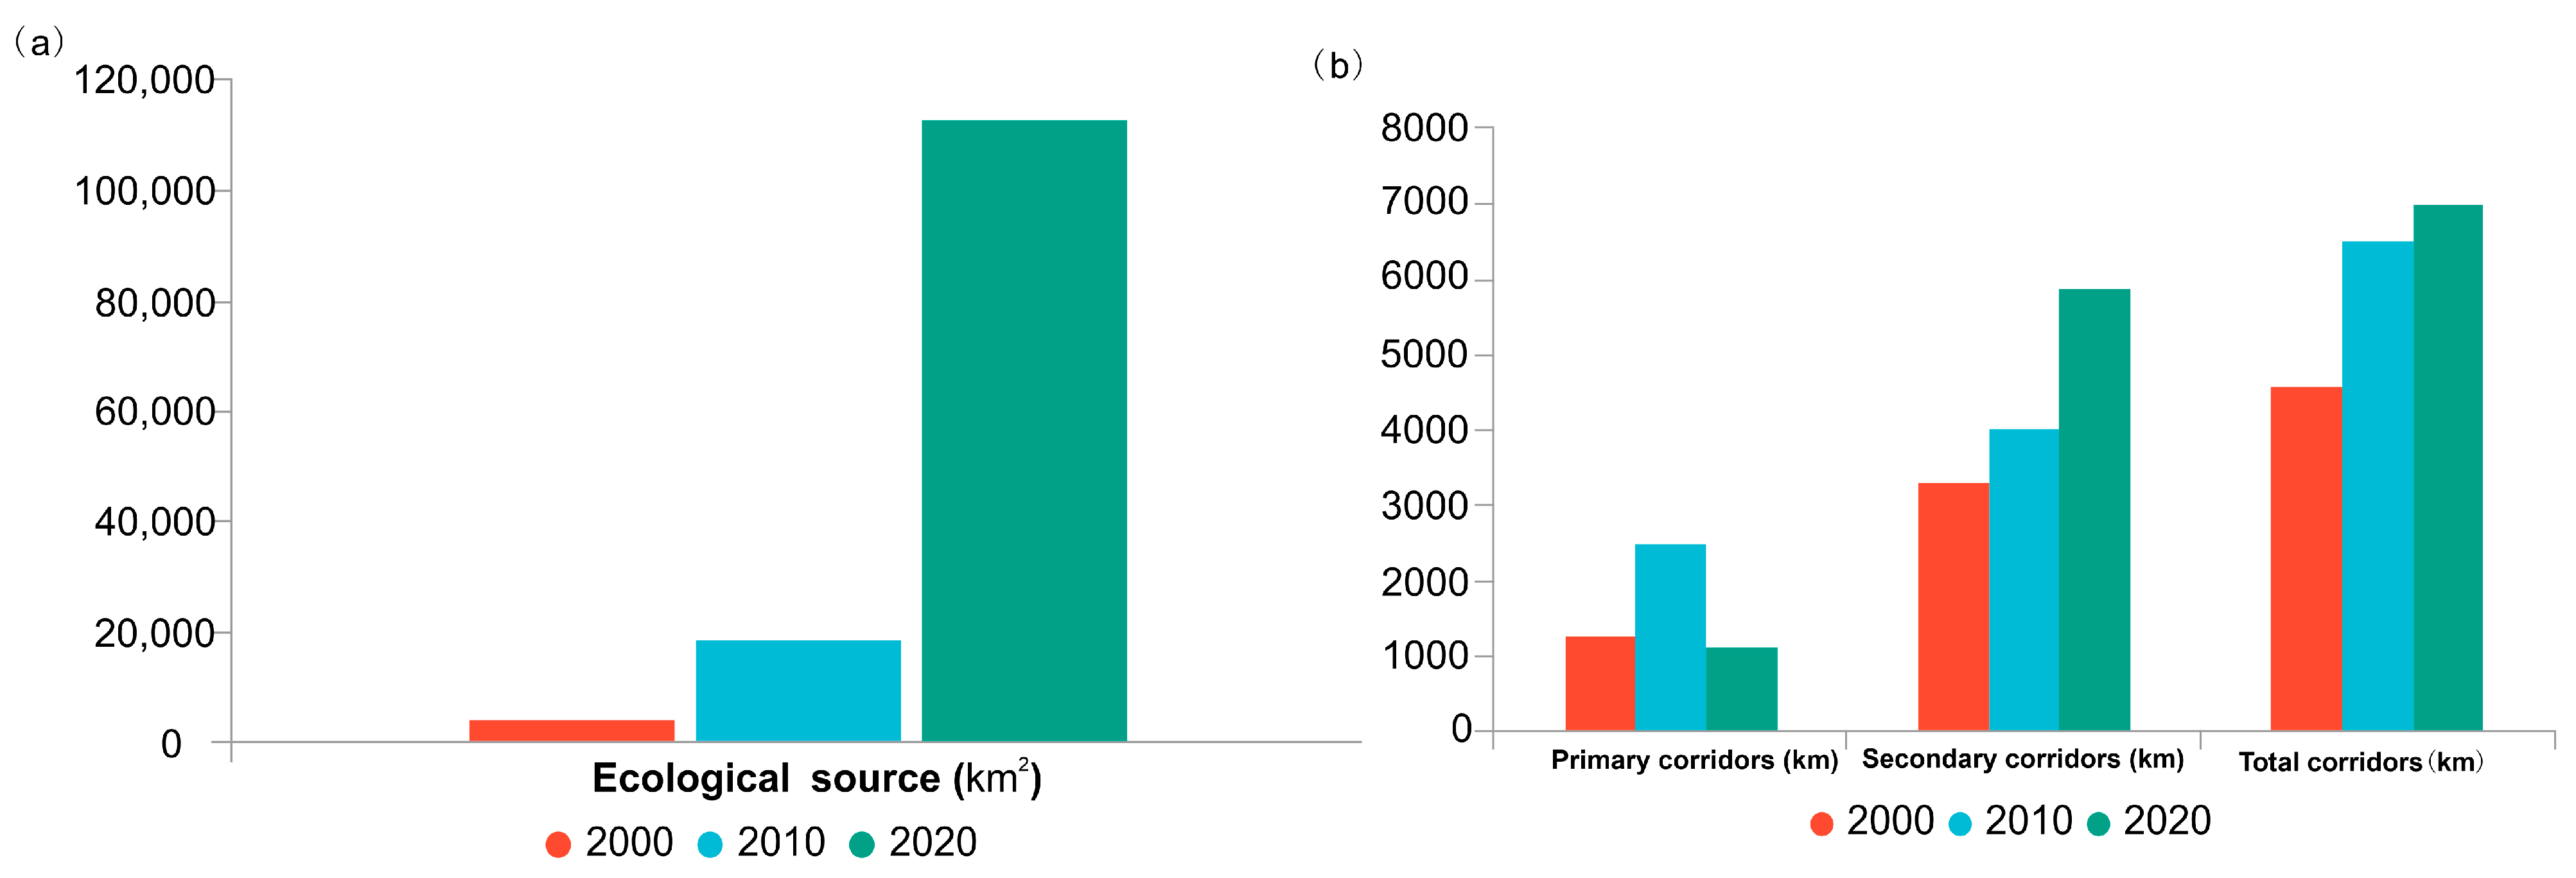
Figure 7.
The ecological sources and corridors in the Loess Plateau from 2000 to 2020. (a): The area of ecological source, (b): The length of corridors.
Figure 7.
The ecological sources and corridors in the Loess Plateau from 2000 to 2020. (a): The area of ecological source, (b): The length of corridors.

Figure 8.
The ecological security zone from 2000 to 2020 in the Loess Plateau.


Table 1.
Evaluation index system for the ESP and weight.
| Identification | Dimension | Criteria Layer | Index Layer | Weight | Tendency | |
|---|---|---|---|---|---|---|
| ESP | Ecological source | Ecological structure | Diversity | SHDI | 0.4 | + |
| Landscape fragmentation | Fragmentation index | 0.2 | − | |||
| Connectivity | Integral index of Connectivity | 0.4 | + | |||
| Ecological function | Vegetation index | NDVI | 0.4 | + | ||
| Precipitation | Annual total precipitation | 0.1 | + | |||
| Temperature | Annual average temperature | 0.1 | + | |||
| Ecosystem services | Habitat quality | 0.4 | + | |||
| Resistance surface | Assigned by land use type, DEM, soil texture | Disturbance | Construction land disturbance | 0.4 | − | |
| Ecological sensitivity | Soil erosion sensitivity | 0.5 | − | |||
| Desertification sensitivity | 0.5 | − |
Table 2.
The common landscape indicators for structure and function.
| Indicators | ||
|---|---|---|
| Structure | Function | |
| Regional Landscape | Heterogeneity; connectivity; patchiness; porosity; fragmentation; configuration; juxtaposition; contrast; patch size; frequency distribution; perimeter-area ratio; pattern of habitat layer distribution; grain size; spatial linkage | Disturbance processes (frequency, period, predictability, intensity; sensitivity); nutrient cycling rates; energy flow rates; rates of erosion and geomorphic; hydrologic processes; human disturbance |
Table 3.
The index system of the ecological resistance coefficients.
| Resistance Surface | Dimension | Index System | Resistance Coefficients (Weight) | Weight | ||||
|---|---|---|---|---|---|---|---|---|
| 1 (0.05) | 2 (0.1) | 3 (0.2) | 4 (0.25) | 5 (0.4) | ||||
| Ecological sensitivity | Soil erosion sensitivity | Soil texture | Clay | Clay loam Silty clay | Loam | Sandy loam Sandy clay Sandy clay loam | Sand Loamy sand Silt loam | 0.4 |
| Slope (m) | 0–20 | 21–50 | 51–100 | 101–300 | >300 | 0.2 | ||
| Vegetation | Water bodies Wetland Glacier | Forest land | Bush land Grass land | Cultivated land | Bare land Artificial surface | 0.4 | ||
| Desertification sensitivity | Land use type | Forest land Water bodies Wetland Glacier | Bush land Artificial surface | Grass land | Cultivated land | Bare land | 0.5 | |
| Disturbance | Construction land disturbance | Artificial surface | / | / | / | / | / | 0.4 |
Table 4.
The number and area of ecological sources in the Loess Plateau from 2000 to 2020.
| Province | 2000 | 2010 | 2020 | |||
|---|---|---|---|---|---|---|
| Number | Total Area (km2) | Number | Total Area (km2) | Number | Total Area (km2) | |
| Shanxi | 9 | 344.892 | 7 | 2787.956 | 28 | 42,236.743 |
| Shaanxi | 7 | 1573.262 | 11 | 1312.133 | 13 | 34,891.863 |
| Qinghai | 0 | / | 4 | 464.522 | 9 | 2715.901 |
| Ningxia | 1 | 1015.665 | 2 | 1341.986 | 10 | 2979.969 |
| Inner Mongolia | 0 | / | 8 | 792.578 | 14 | 7506.349 |
| Henan | 14 | 973.902 | 2 | 1679.187 | 6 | 5854.184 |
| Gansu | 2 | 356.088 | 17 | 12,547.432 | 14 | 17,562.792 |
| Total | 27 | 4263.810 | 41 | 18,566.034 | 77 | 113,209.595 |
Table 5.
The number and length of potential corridors in the Loess Plateau.
| Potential Corridors (km) | |||||
|---|---|---|---|---|---|
| Year | Number | Min | Max | Sum | Average |
| 2000 | 64 | 8.783 | 304.374 | 4579.326 | 71.552 |
| 2010 | 85 | 1.174 | 747.333 | 6526.996 | 76.788 |
| 2020 | 105 | 1.624 | 258.197 | 7015.174 | 66.811 |
Disclaimer/Publisher’s Note: The statements, opinions and data contained in all publications are solely those of the individual author(s) and contributor(s) and not of MDPI and/or the editor(s). MDPI and/or the editor(s) disclaim responsibility for any injury to people or property resulting from any ideas, methods, instructions or products referred to in the content. |
© 2024 by the authors. Licensee MDPI, Basel, Switzerland. This article is an open access article distributed under the terms and conditions of the Creative Commons Attribution (CC BY) license (https://creativecommons.org/licenses/by/4.0/).
Share and Cite
MDPI and ACS Style
Luo, M.; Jia, X.; Zhao, Y.; Wang, H.; Chen, C.; Li, D.; Yang, S.; Li, J. The Temporal and Spatial Characteristics of Ecological Security Pattern in the Loess Plateau, China. Land 2024, 13, 570. https://doi.org/10.3390/land13050570
AMA Style
Luo M, Jia X, Zhao Y, Wang H, Chen C, Li D, Yang S, Li J. The Temporal and Spatial Characteristics of Ecological Security Pattern in the Loess Plateau, China. Land. 2024; 13(5):570. https://doi.org/10.3390/land13050570
Chicago/Turabian StyleLuo, Manya, Xia Jia, Yonghua Zhao, Huanyuan Wang, Chunyang Chen, Dongqian Li, Shuyuan Yang, and Juan Li. 2024. "The Temporal and Spatial Characteristics of Ecological Security Pattern in the Loess Plateau, China" Land 13, no. 5: 570. https://doi.org/10.3390/land13050570
Note that from the first issue of 2016, this journal uses article numbers instead of page numbers. See further details here.