
Early Identification and Dynamic Stability Evaluation of High-Locality Landslides in Yezhi Site Area, China by the InSAR Method


1
State Key Laboratory of Continental Dynamics, Department of Geology, Northwest University, Xi’an 710069, China
2
College of Geological Engineering and Surveying, Chang’an University, Xi’an 710054, China
*
Author to whom correspondence should be addressed.
Land 2024, 13(5), 569; https://doi.org/10.3390/land13050569
Submission received: 18 March 2024
/
Revised: 11 April 2024
/
Accepted: 18 April 2024
/
Published: 24 April 2024
Abstract
:In mountainous regions, high-locality landslides have the characteristics of a latent disaster process with a wide disaster range, which can easily cause large casualties. Therefore, early landslide identification and dynamic stability evaluation are significant. We first used multi-temporal synthetic aperture radar data to detect potential landslides at Yezhi Site Area during the 2015–2020 period, identifying and mapping a total of 18 active landslides. The study area was found to have an average deformation rate between −15 and 10 mm/y during the period. Then, time series and spatiotemporal deformation characteristics of landslides were examined using interferogram stacking and small baseline interferometry techniques. The results show that the majority of the landslide deformations detected exhibit a periodic variation trend, and the study area was in a slow deformation state before 2017. Finally, combined with detection results, Google Earth optical images, and field investigations, it is concluded that the main factors affecting the time series deformation and spatial distribution of landslides in the study area are rainfall, geological factors, and engineering activities. The results of this study provide valuable technical references and support for early identification and dynamic stability evaluation of regional active landslides in complex terrain, especially for high-locality landslides.
1. Introduction
In recent years, landslide disasters that cause economic losses and much damage have increased in complex terrain areas as a result of an increase in human engineering activities and extreme weather conditions [1,2,3,4]. In the alpine-valley regions, high-locality landslides have the characteristics of a latent disaster process and a wide disaster range, which can easily cause large casualties and property damage [5,6,7]. Therefore, early identification and dynamic stability evaluation are crucial to minimizing landslide disasters [8,9,10,11]. Yezhi Town Planning, located in the southwest of Diqing Prefecture, Yunnan Province, China, is the core hinterland of the natural landscape of “Three rivers (Jinsha River, Lancang River, and Nujiang River) flowing together” (Figure 1). The study area is frequently subjected to landslides and other geological hazards due to the intense tectonic activity and strong river erosion [12]. Currently, many researchers have investigated the disaster-causing mechanism and distribution characteristics of geohazards in the study area. However, previous research mainly focuses on small-scale areas because of the constraints of currently available technology and the complexity of regional terrain conditions. Therefore, there are few studies on automatic identification and evaluation of regional geological hazards [13,14]. Thus, generating an accurate evolution map of landslides is crucial to understanding their evolution and providing early warning of landslides [2,15,16]. Furthermore, studying landslide deformation patterns in time and space can help reduce the risk of landslide disasters [11,17,18].
It has been recognized that traditional disaster identification methods are hard to implement because some disaster sites have a wide range of study areas, complex and varied terrain, and high altitude [17,19]. Once triggered on mountain slopes, landslides can move even considerably away from their sites of origin, and propagate at high speed until they impact infrastructure or urbanized areas. In order to analyze these aspects, it is necessary to combine evolutionary modeling techniques [20] with susceptibility analyses [21], in order to assess the overall hazard (and thus also the risk). In the last few years, the Unmanned Aerial Systems [22] and the advancement of the Interferometric Synthetic Aperture Radar (InSAR) technique has enabled the detection of slope deformation with high accuracy, which can also be facilitated by the use of new techniques. Especially, the InSAR technique has been widely employed in the landslide field and plays an essential role in landslide disaster evaluation [23,24,25,26,27,28]. The advantage of InSAR is its wide spatial coverage and high accuracy, breaking through the limitation that traditional manual investigation and inspection cannot identify potential landslides from small deformation, thereby improving the landslide monitoring and identification accuracy [29,30,31,32,33]. The InSAR technique not only identifies spatial and temporal movements but also identifies the moments when landslide deformation accelerates and generates a time series of ground deformation to assess the degree of risk [27,34,35,36,37,38,39]. Moreover, with the progress of algorithm development, many researchers have utilized multi-source monitoring technologies and InSAR together to investigate landslide movements, which overcame the shortcomings of using only a single type of information in large-scale active landslide mapping and provided important support for the general survey and research of landslide hazards [40,41,42]. SBAS-InSAR technology allows for an increase in the number of interferograms by a main image and reduces the influence of spatio-temporal decoherence on the quality of interferograms by creating short baseline SAR image pairs to generate interferogram sets [42,43]. To ensure the effectiveness of D-InSAR in the short-baseline combination, images within a specific time baseline and vertical baseline threshold are usually selected to form temporal image pairs for interference. The selection principle is to ensure that the baseline distance within the same set is small, while the baseline distance between sets is large. Then, the terrain phase was removed by utilizing the external DEM data and thus obtaining the differential phase. Finally, the discrete high-quality coherent point target selected according to the coherence coefficient is unwrapped to form the final deformation result [41,44,45].
In this study, multi-active landslides were mapped throughout the Yashi Town planning. Active landslides in topographically complex areas were detected and mapped based on the SBAS (Small Baseline Subsets)-InSAR deformation analysis technique by combining surface deformation and topographic features. Finally, based on the catalog results (the catalog of geological hazards identified from three different orbital SAR data), we inspected the spatial distribution and major contributing factors of landslides. The findings in this work provide a basis for studying geological hazards such as landslides in Yezhi Town planning, and the results are beneficial to the early identification and dynamic stability evaluation of landslides, especially for high-altitude landslides.
2. Datasets and Methods
2.1. Study Region
The study region of this investigation (Yezhi Town) is located in the southwestern part of Diqing Tibetan Autonomous Prefecture, between longitude 98°54′~99°34′ E and latitude 26°53′~28°02′ N. The main types of landforms in the region are tectonic erosion landscapes and depositional terrace landforms with relatively complex geomorphology [13], of which the tectonic erosion landforms are distributed in the area of the three rivers, Lancang River, Jinsha River, and Nujiang River canyon slopes in the upper part of the nearby watershed; depositional terraces are distributed intermittently along the banks of the Lancang River and show asymmetrical erosion or accretion terraces, and in the confluence of the various tributaries of the main river, show flood terraces. Yezhi Town is located on river terraces and floodplain (fan) terraces. The Lancang River valley lies at an altitude of approximately 1710.0 m, which is the lowest area, and the valley is cut at a depth of between 800 and 1500 m. Additionally, the peaks on either side of the valley range in elevation from 3200 to 3400 m above sea level (Figure 1). The Lancang River runs through the whole area, and the study area comprises complex geological structures, where folds and faults are well developed [12].
Generally, the study region is characterized by the subtropical and temperate monsoon plateau mountain climate. The annual average temperature is 15.3 °C. The study area has extremely rich forest resources, and ecological status is very important, serving as an important ecological barrier in the upper reaches of Lancang River. Unfortunately, human activities and deforestation have greatly impacted the ecological environment, which has been identified as one of the essential factors that affect geological disaster occurrence. The average annual precipitation is about 938.1 mm, and there is a pronounced rainy season (May to September) in the study area, with heavy rains and rainstorms occurring. In addition, most precipitation falls between June and August. In particular, extreme rains often lead to geological disasters such as mudslides, landslides, etc. [13,14].
Field investigations have shown the presence of groundwater seepage at the foot of some landslides, which may affect local slope stability (Figure 2a). Furthermore, photographs taken at the scene reveal that the toe of the landslide crosses the ditch bed and that the slope eroded under the influence of seasonal flooding in the channel, which accelerated the rate of landslide deformation (Figure 2b). In addition, exposed rocks and slopes are fragmented due to many years’ weathering and are, therefore, easily infiltrated by rainwater (Figure 2c). Also, numerous fissures and cracks in the landslide body can increase permeability and thus water infiltration, reducing soil layers and causing slope failure [21,46]. Prolonged rainfall can saturate, soften, and collapse soil, enhancing landslide movements. The new engineering activities also aggravated movements in time series [47]. Figure 2d shows that HP11 and HP13 were relatively stable before May 2018 and moved significantly after May 2018 due to human activities and road engineering.
2.2. Datasets
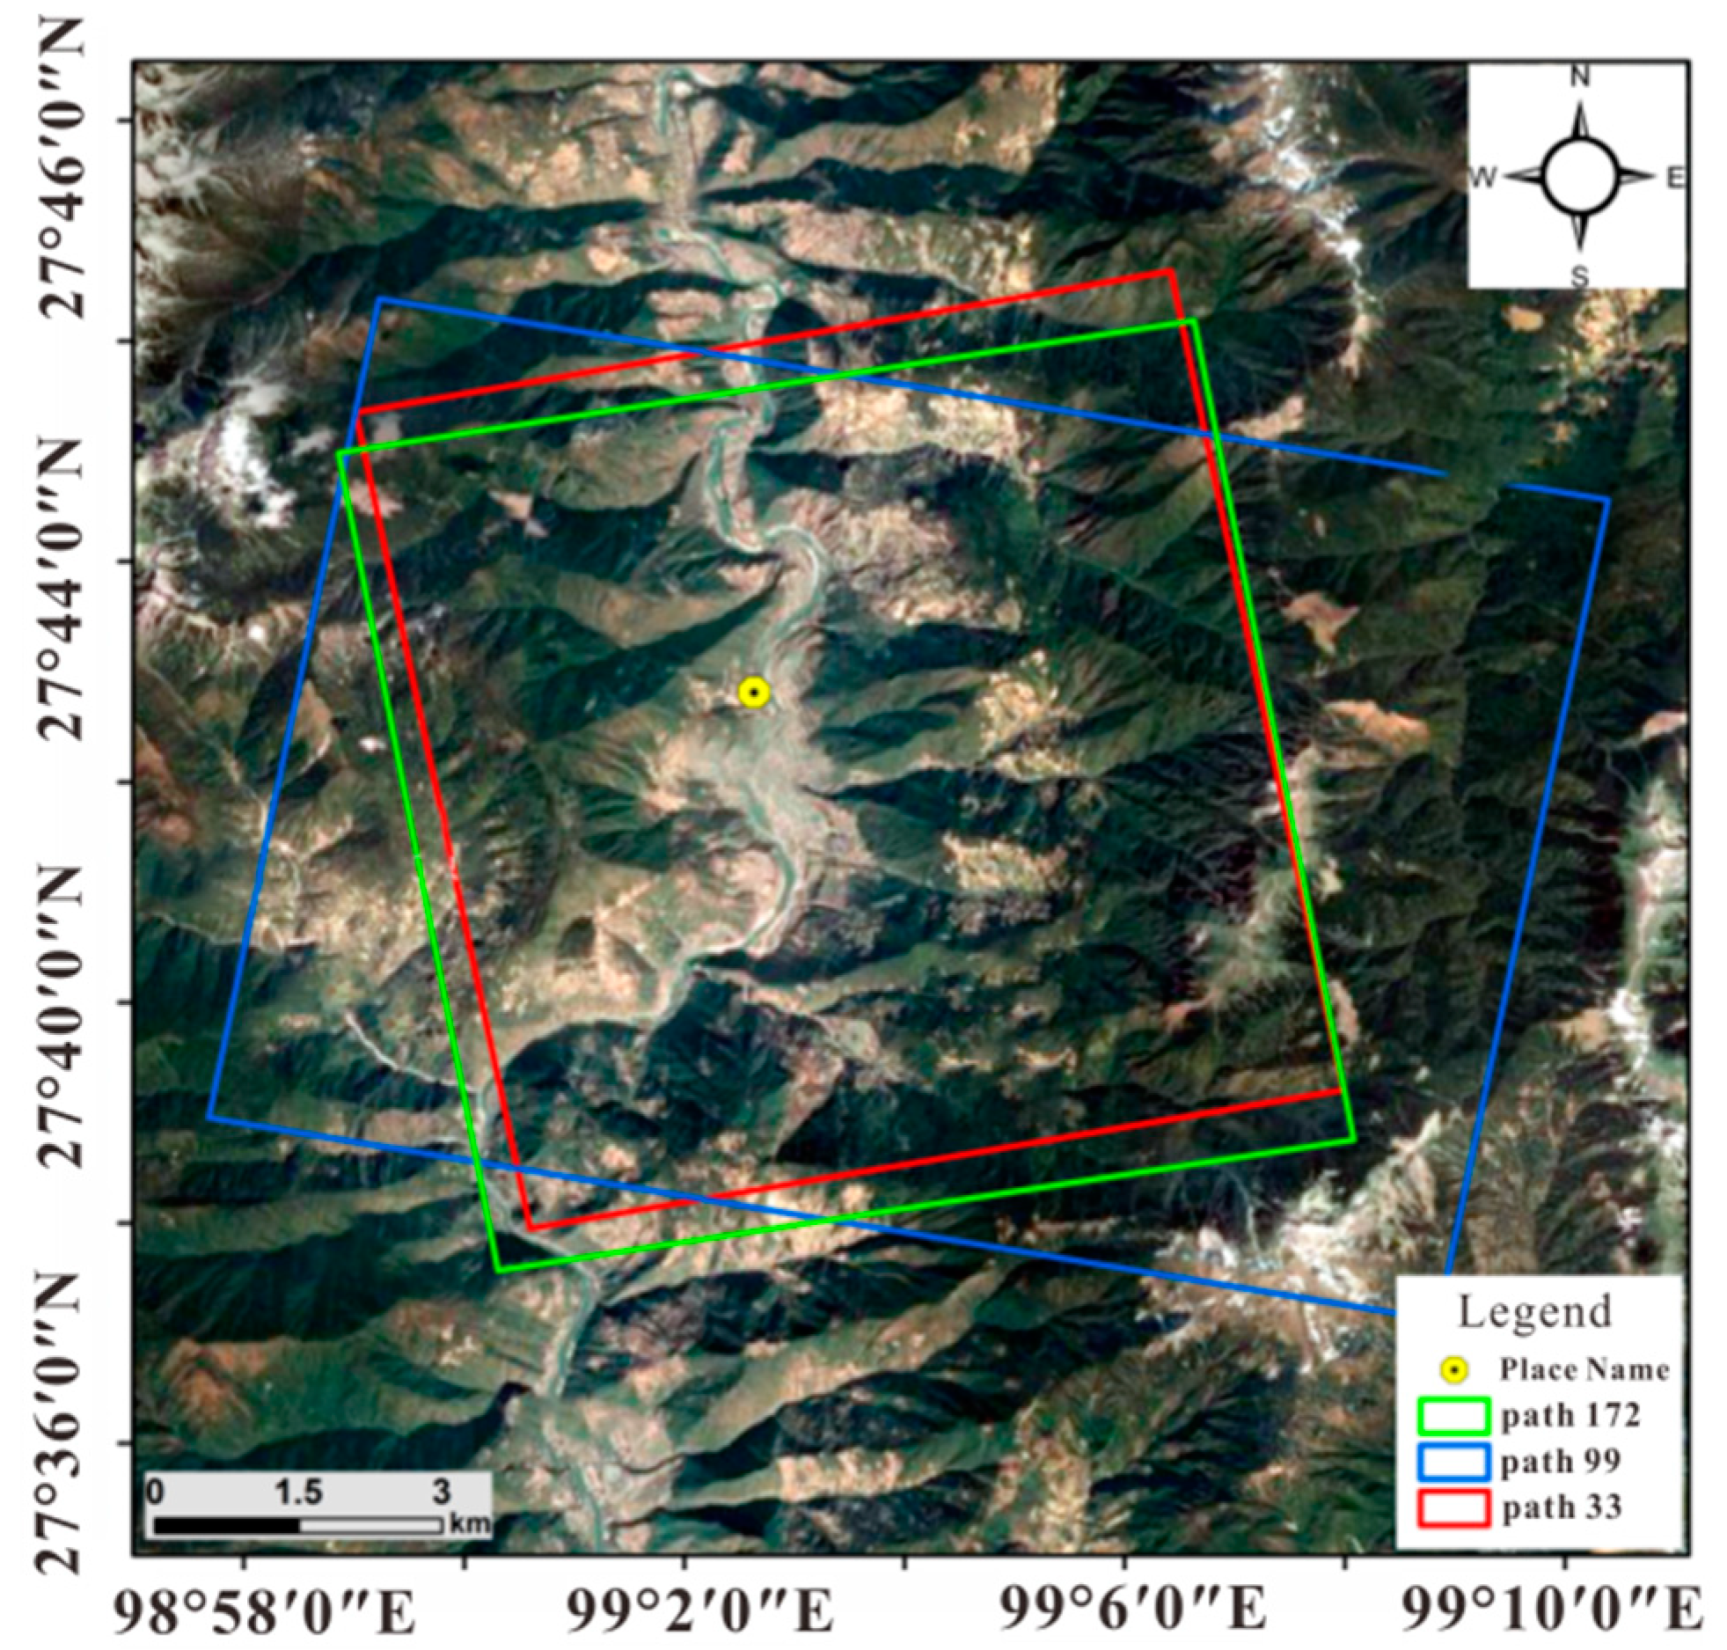
To effectively deal with the decoherence resulting from the existence of vegetation and ice–snow cover in the study area, and to prevent landslides from being overlooked and misclassified at various times [43,48,49], we use 290 Sentinel-1A SAR images, including 121 Sentinel-1A images over descending Track 33 from 7 October 2014 to 7 July 2020, 56 Sentinel-1A images over ascending Track 172 from 29 October 2014 to 11 March 2017, and 113 images along ascending Track 99 from 9 June 2015 to 30 June 2020. With these data, it is possible to determine deformation of the research region between October 2014 and July 2020 from different angles. Figure 3 depicts the SAR scene in the ascending and descending paths covering Yezhi Town and the Sentinel-1 data parameters are listed in Table 1. In order to separate surface deformation, topographic phase contribution needs to be removed. Therefore, DEM data at 30 m resolution in the study area are collected for InSAR data processing and result expression [50,51,52,53,54].
Based on the sensor type of Sentinel-1A satellite, the Sentinel-1A Track 99 ascending data were assigned a time baseline of 36 days and the spatial baseline of 100 m, forming 254 interference pairs for time series deformation calculation (Figure 4a). For the Sentinel-1A Track 33 descending data, the time baseline of 24 days and the space baseline of 100 m was utilized, forming 177 interference pairs for time series deformation calculation (Figure 4b). For the ascending data from Sentinel-1A Track 172, the time baseline was defined as 36 days and the space baseline was defined as 100 m, resulting in 111 interference pairs to calculate time series deformation (Figure 4c).
2.3. Methods
The deformation of landslides could be registered using the InSAR technology, which allows for landslide investigation and monitoring. The existing InSAR technologies mainly include conventional Differential Interferometry SAR (D-InSAR), Stacking (Stacking) technology, and Small Baseline Subsets (SBAS) technology [55,56]. To efficiently and appropriately obtain the active landslide distribution in the study area, a preliminary inventory was initially compiled using InSAR (SBAS-InSAR) technology to acquire deformation rates with high accuracy and DEM, and then four kinds of data products of time series deformation map, coherence map, intensity map, and overlay shadow map were comprehensively analyzed to determine the disaster point [42,44,57,58]. The deformation map indicates that the activity of the geological disaster points was detected, and the coherence map and intensity map mean that the deformation monitored by InSAR meets certain accuracy and reliability. Overlapped shadow map is used to eliminate disasters in areas that cannot be monitored by InSAR. In order to make a preliminary selection of geological hazard locations, the yearly average deformation rate of the research region was calculated using the InSAR technology and coupled with data on the elevation, slope, and azimuth of the survey area [59]. The main processing steps are listed below:
Step 1. In SAR imaging, due to the geometric relationship between radar and ground scene as well as its side-view imaging mechanism, mountains with large fluctuations in the scene are prone to form overlapping, shadow phenomena when imaging. When the radar’s downward viewing angle α is less than the slope angle β, it is the overlapping area, and when β is less than π/2-α, it is the shadow area. Consequently, the overlapping and shadow areas of the study area were obtained according to DEM and SAR side perspectives, and the mask processing was performed on the deformation map.
Step 2. The masked deformation map is combined with the SAR intensity map and InSAR coherence map to screen the deformation area, and the false deformation area caused by low coherence and water area is eliminated (the coherence threshold is set to 0.6, and the intensity threshold is −1 dB) [41].
Step 3. By combining SAR geometry, DEM, optical remote sensing images, and high-resolution optical UAV images, the position and the boundary of the suspected landslides were revealed and mapped based on the deformation patterns. In addition, to further investigate the deformation time series of landslides, the time series deformation results of three different tracks were determined based on short baseline InSAR technology [45].
3. Results
3.1. Deformation Identification Results
Combining InSAR results with DEM data, the deformation map can be obtained to identify potential landslides [60]. Based on the InSAR annual deformation rate map, the deformation identification results of the study area were obtained (Figure 4). It displays 11 deformed areas (named HP01, HP02, HP03, HP04, HP07, HP08, HP09, HP11, HP13, HP14, and HP17) (Figure 5a), 9 deformed areas (named HP01, HP02, HP03, HP04, HP06, HP08, HP10, HP12, and HP13) (Figure 5b), and 10 deformed areas (named HP01, HP02, HP03, HP04, HP05, HP06, HP09, HP15, HP16, and HP18) (Figure 5c) which were identified based on Sentinel-1A Track 99 ascending data, Sentinel-1A Track 33 descending data, and Sentinel-1A Track 172 ascending data, respectively (Table 2). Notably, six deformed areas (named HP01, HP02, HP03, HP04, HP08, and HP13) were identified jointly by Sentinel-1A Track 99 ascending data and Sentinel-1A Track 33 descending data, and the other different regions are mainly caused by different observation angles of the lifting track [43]. In addition, due to the similar imaging geometry with Track 99, most of the identified areas by Sentinel-1A Track172 ascending data coincide with Track 99. However, due to the different imaging times, four more deformed areas (HP05, HP15, HP16, and HP18) were found than in the Sentinel-1A Track 99 ascending data and Sentinel-1A Track 33 descending data results (Figure 5c). The results reveal that the average deformation rate for the potential landslides varies from −15 to 10 mm/y during the monitoring period (both in Sentinel-1A ascending orbit and descending orbit), and the deformation areas mainly extend on both banks of the Lancang River, particularly in the eastern part.
The deformed areas identified from three different orbital SAR data were combined to acquire a geological hazard catalog in the present study area (Figure 5d). The four deformed areas delineated in yellow in Figure 5d are jointly identified by three types of data, five deformed areas delineated in red are jointly identified by two types of data, and nine deformed areas delineated by green are identified by one type of data, for a total of 18 deformed areas.
3.2. Time Series Deformation Characteristics
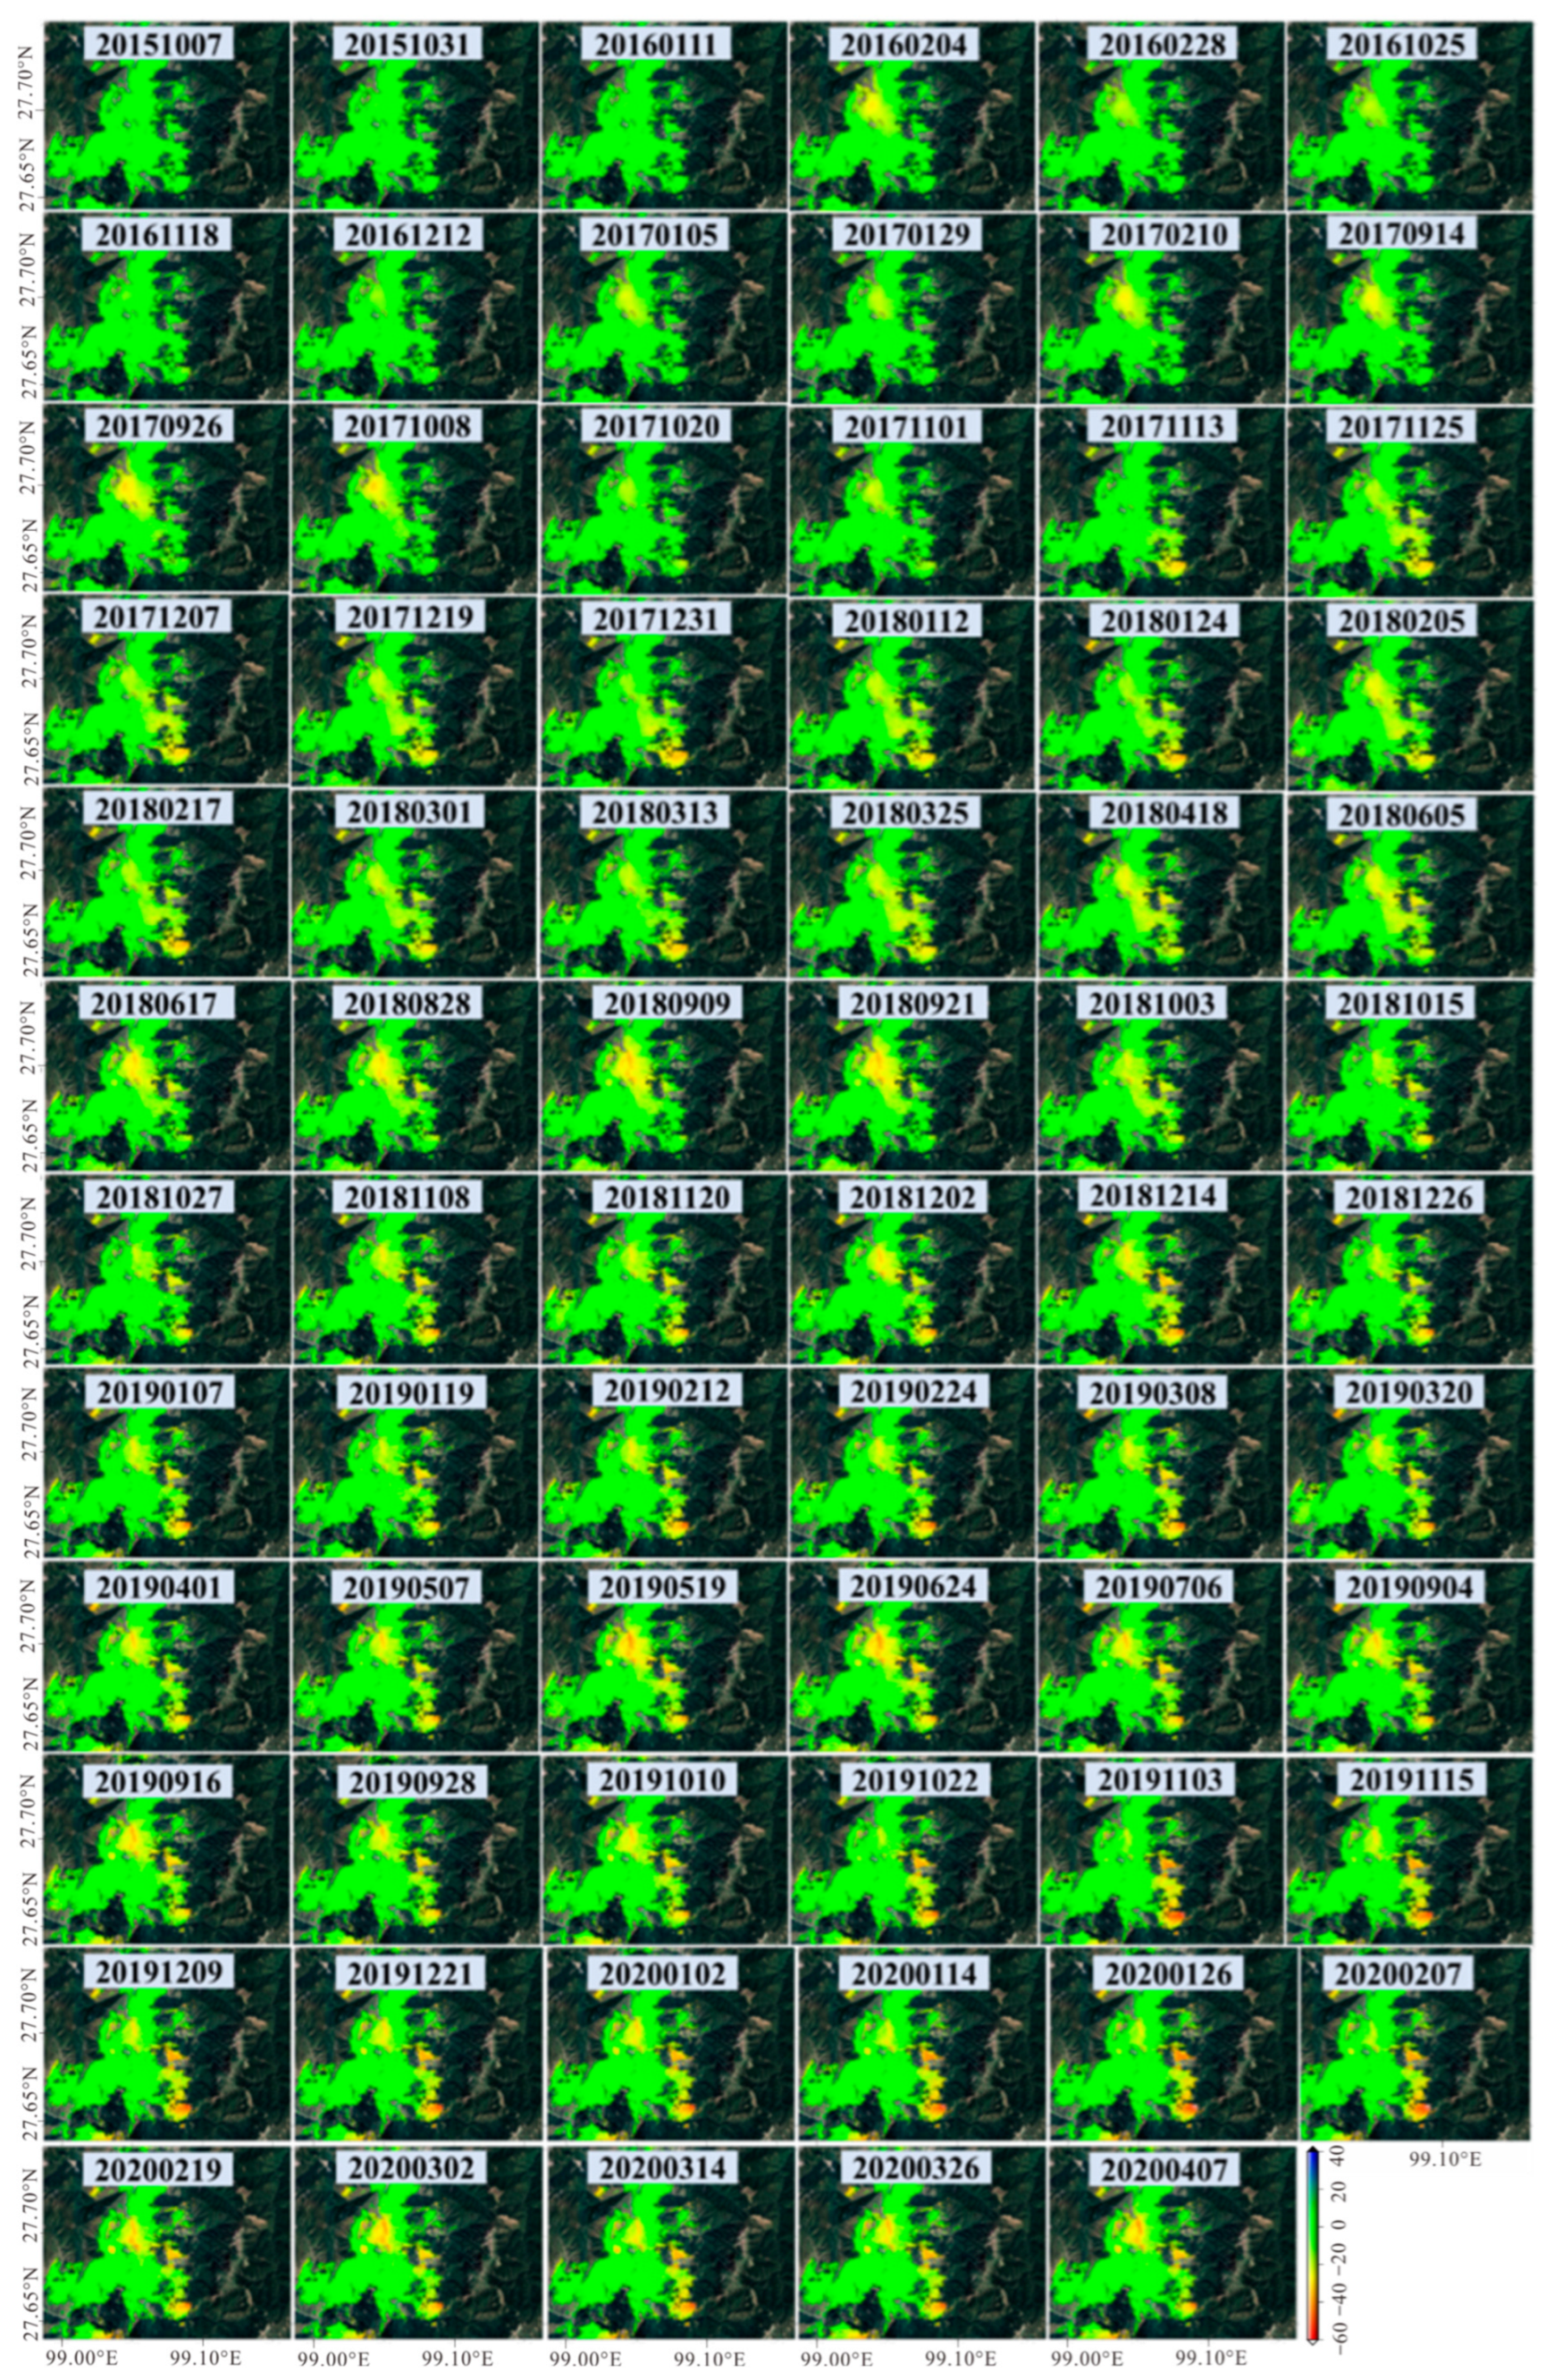
When using SBAS measurements for relative positioning, SBAS satellite errors must be appropriately considered to obtain a less biased positioning solution. Based on the identification results, the deformation characteristics of landslide disasters within the research region can be monitored using time series deformation. The time series deformation results of different orbits are obtained and plotted in Figure 6, Figure 7 and Figure 8. As displayed in Figure 6, it is found that the study area remained in a state of slow deformation until November 2017 according to Sentinel-1A ascending Track 99 data, and cumulative deformation is only 3.6 mm (Figure 6). The difference is that large deformation occurred between December 2017 and February 2020, with a maximum deformation of 39 mm. Later deformation magnitude is small and tends to be stable. However, in the monitored period, based on the observation acquired from Sentinel-1A descending Track 33, the study area may remain relatively stable until April 2018, with only slow deformation of 1.2 mm cumulative deformation (Figure 7). The deformation of most slopes was noticeable after October 2018, but deformation results were not as obvious as Track 99 ascending data monitoring. In addition, deformation derived from the Sentinel-1A Track 172 ascending data demonstrates that a large deformation occurred prior to February 2017, with the deformation rate mostly in the range of −11–10 mm/a (Figure 8), which may be mainly caused by different observation angles and imaging times [61].
3.3. Dynamic Stability Evaluation of Landslides
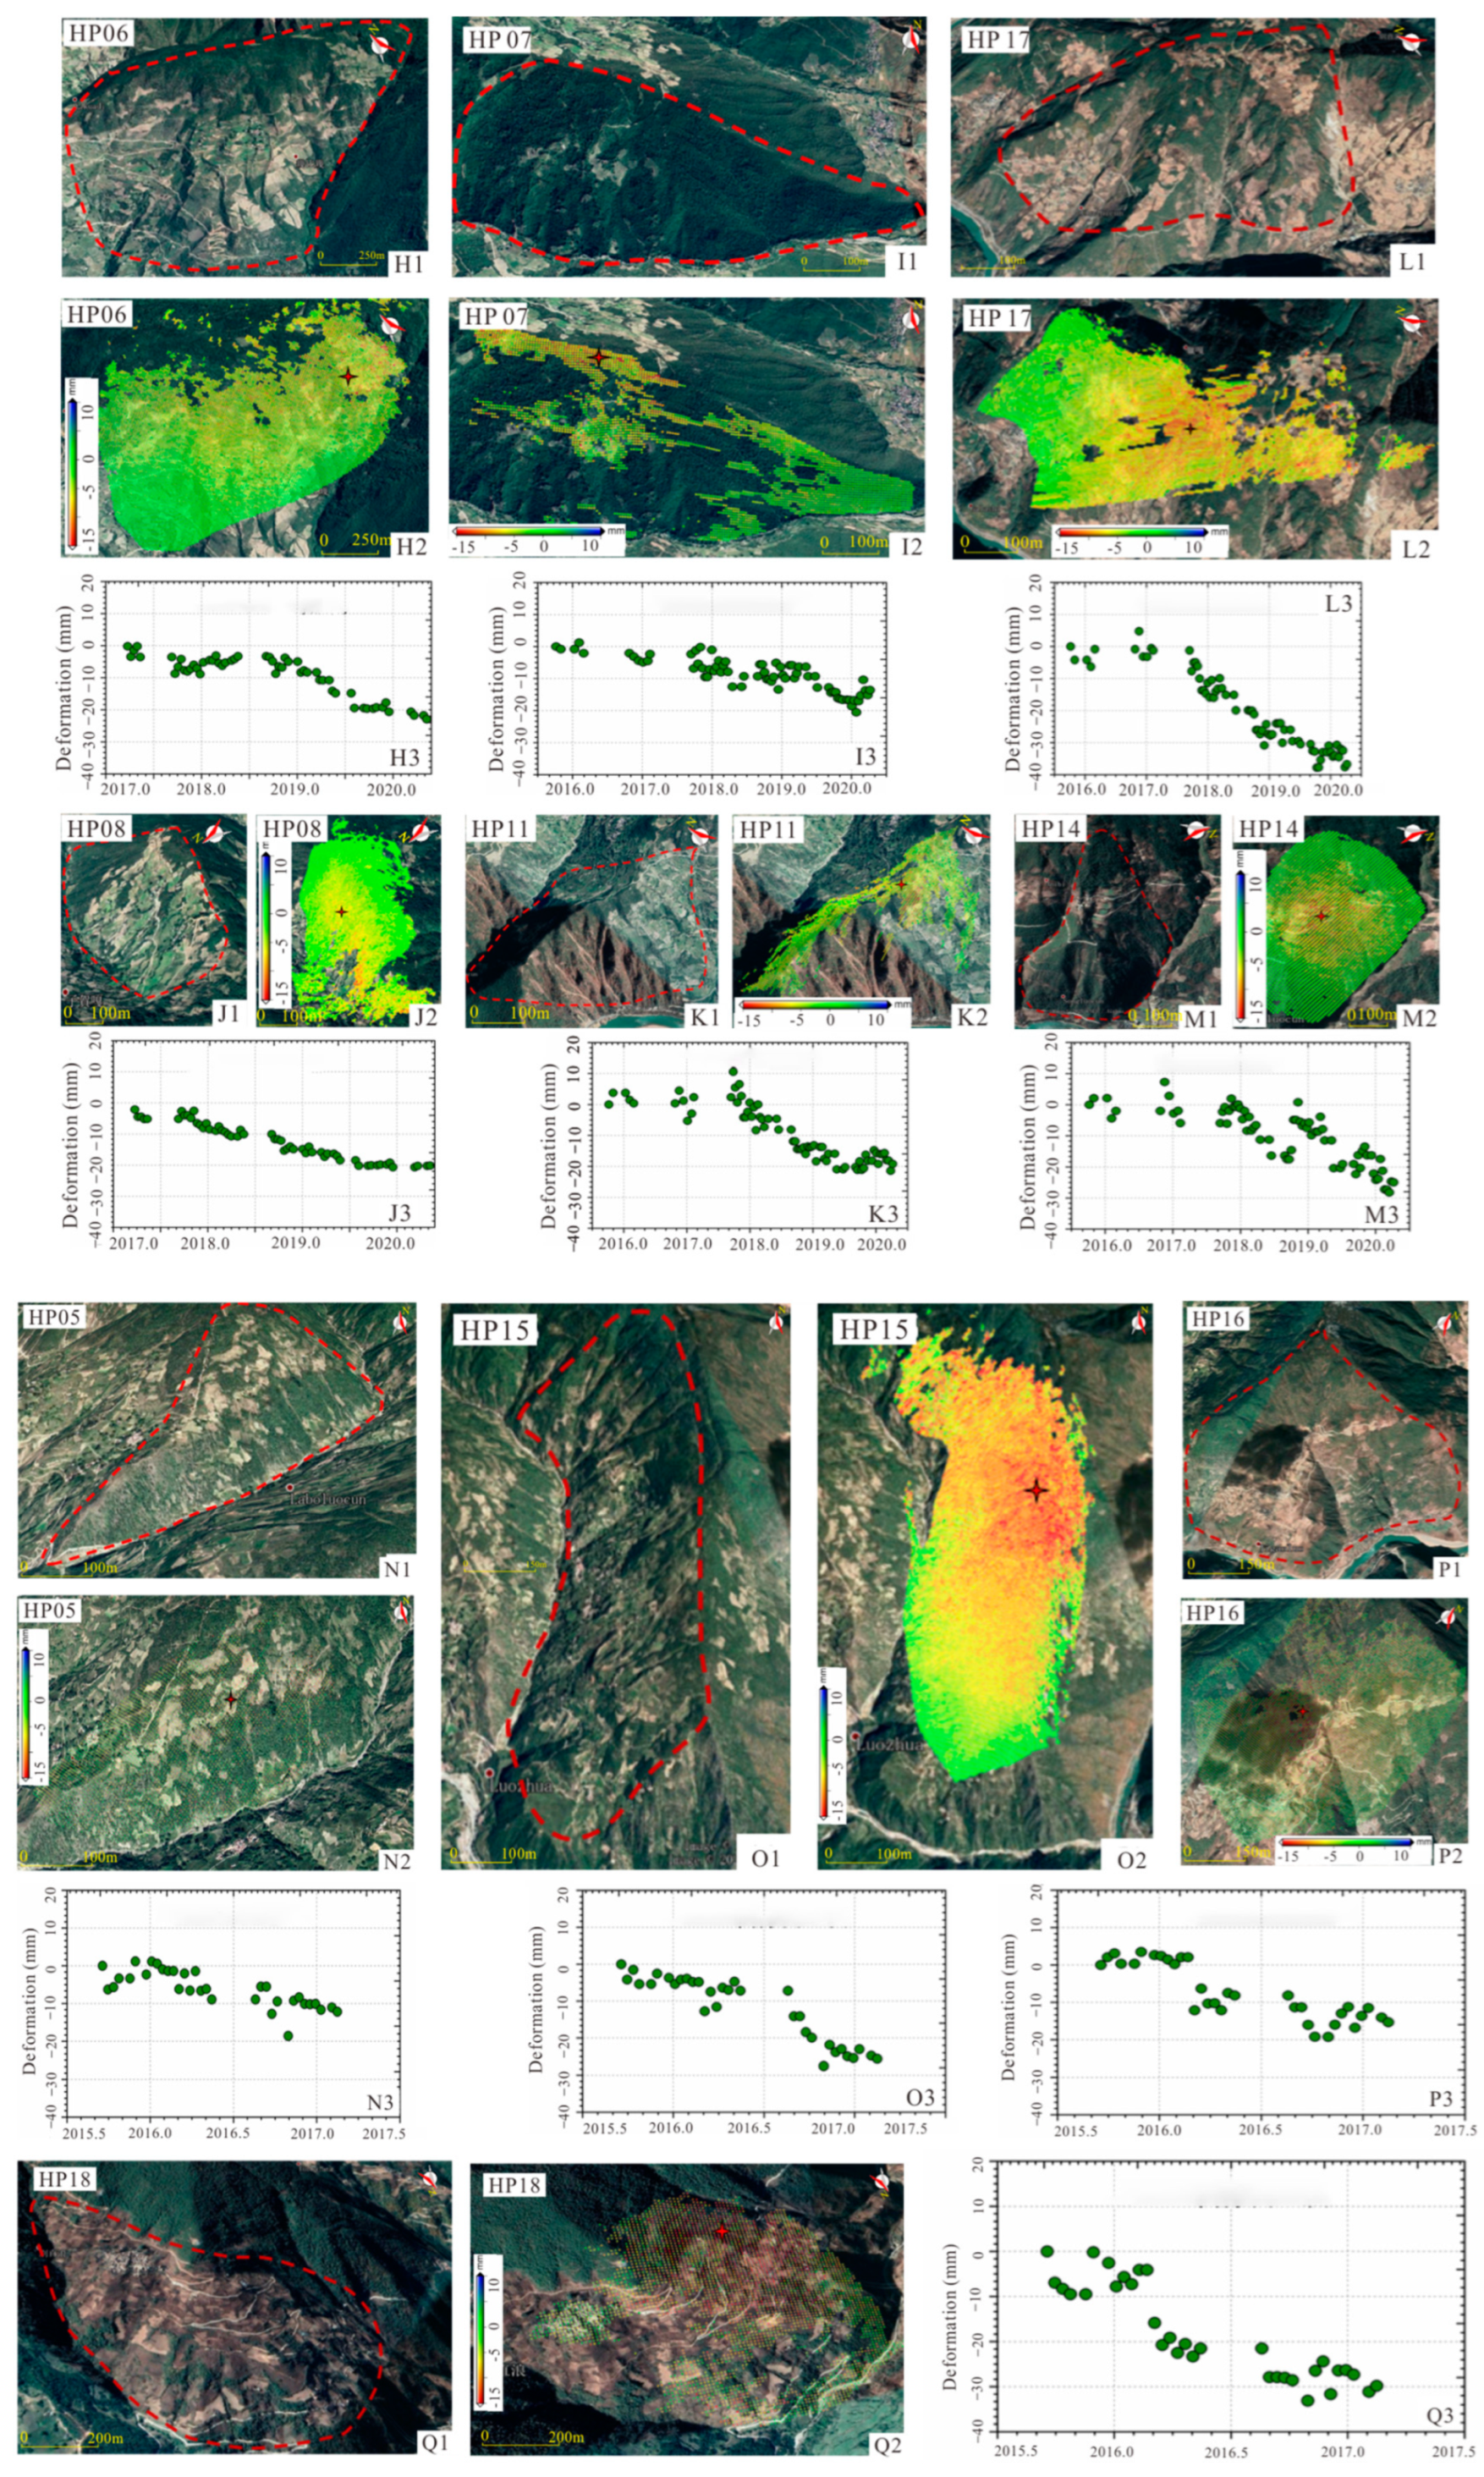
It is known that InSAR deformation results can only identify the areas with active deformation. Additionally, it is unable to precisely detect whether an area is a landslide or its boundary by using InSAR deformation results [43]. Therefore, to more accurately determine the sites and scopes of the suspected landslides, comprehensively utilizing DEM, high-resolution UAV optical images, optical remote sensing images, field surveys, and InSAR results is needed [43,60]. To better explain the landslide mapping results, Figure 9 presents the optical images, deformation rate results, and time series deformation of typical landslide identification results. Through comparison, the error region can be efficiently eliminated by the deformation rate results, and the derived boundary of landslides agrees well with the optical images. Furthermore, due to the high concealment characteristics of some landslides, when used in conjunction with optical images, the InSAR method can identify potential landslides’ hidden threats [57,60].
According to the landslide identification data, the time series of a point on each landslide was selected to estimate their deformation trends. Based on the result, the majority of the detected landslides deformation exhibited a periodic variation trend between 2017 and 2019, as shown in HP01, HP02, HP03, HP04, HP09, and HP12, which may be caused by snow melting and rainfall [18,50]. Before 2019, with maximum cumulative displacements reaching 30 mm, it was found that the deformation evolution at HP01, HP02, HP03, HP04, HP09, HP12, and HP13 varied dramatically. After 2019, the maximum cumulative displacement difference was less than 5 mm, indicating that the deformation reaches a relatively stable state. However, some landslides exhibit different deformation characteristics (see HP06, HP07, HP08, HP11, HP14, and HP17 (Figure 9H–M)). Prior to 2018, the deformation was assumed as a slow creep behavior. However, following 2018, the time series displacement plots show an accelerated deformation trend, with a cumulative deformation difference of 20 mm.
In addition, the deformation characteristics of four more landslides (HP05, HP15, HP16, and HP18) (Figure 9N–Q) identified by Sentinel-1A Track 172 ascending data reveals that the deformation area was continuously deforming throughout the Track 172 ascending data monitoring period, with the areas of deformation displaying a linear growth trend. In contrast, during the Track 99 ascending data and Track 33 descending data monitoring period, it might still be stable with no gradual deformation. It is likely that under the effect of the rainfall or human activities, the deformation of the HP05, HP15, HP16, and HP18 was induced once more, which affects the slopes’ stability and thus certain monitoring measures are necessary.
4. Discussion
The study area is the core hinterland of the natural landscape of “Three rivers flowing together”: Jinsha River, Lancang River, and Nujiang River, and it is distinguished by its steep topography [13]. It is acknowledged that topographic factors such as elevation and slope angle play a key role in the formation as well as the development of landslide disasters [44,54,57,62,63]. To explore the influence of topographic factors on landslide deformation and spatial distribution, DEM was used to generate an elevation map and slope angle, as shown in Figure 10. The results reveal that landslide disasters gradually increase and then decrease with elevation. Specifically, the total number of active landslides increases significantly as elevation increases between 2000 and 3200 m above sea level, while the total number of active landslides decreases obviously with elevation, as elevation exceeds 3200 m. In addition, about 95.5% of the active landslides detected occurred between 2300 m to 3500 m above sea level, while only 2.3% of landslides are distributed above 3500 m (Figure 10c). The main explanation for the phenomenon is the deep and narrow valley of the Lancang River, which cuts a depth of about 800 to 1500 m. Furthermore, the riverbed is widened and deepened by strong water erosion, which can lead to landslide disasters [13,60]. Similarly, it could be inferred that 90.7% of the landslides occurred on slopes with a slope angle of 20–40°, especially on the slopes with an angle of 30–40°, the landslide distribution reaches 72.9%. Figure 10c also demonstrates that the landslide distribution gradually decreases with an increase in slope, reaching only 0.15% at slopes higher than 60°. This phenomenon occurs, on the one hand, due to the long distance between the high-altitude areas and the Lancang River, which is the main reason for landslides caused by down-slope cutting [64]. On the other hand, the low slope lacks sufficient dynamic conditions, while high slopes are not conducive to landslide materials accumulation.
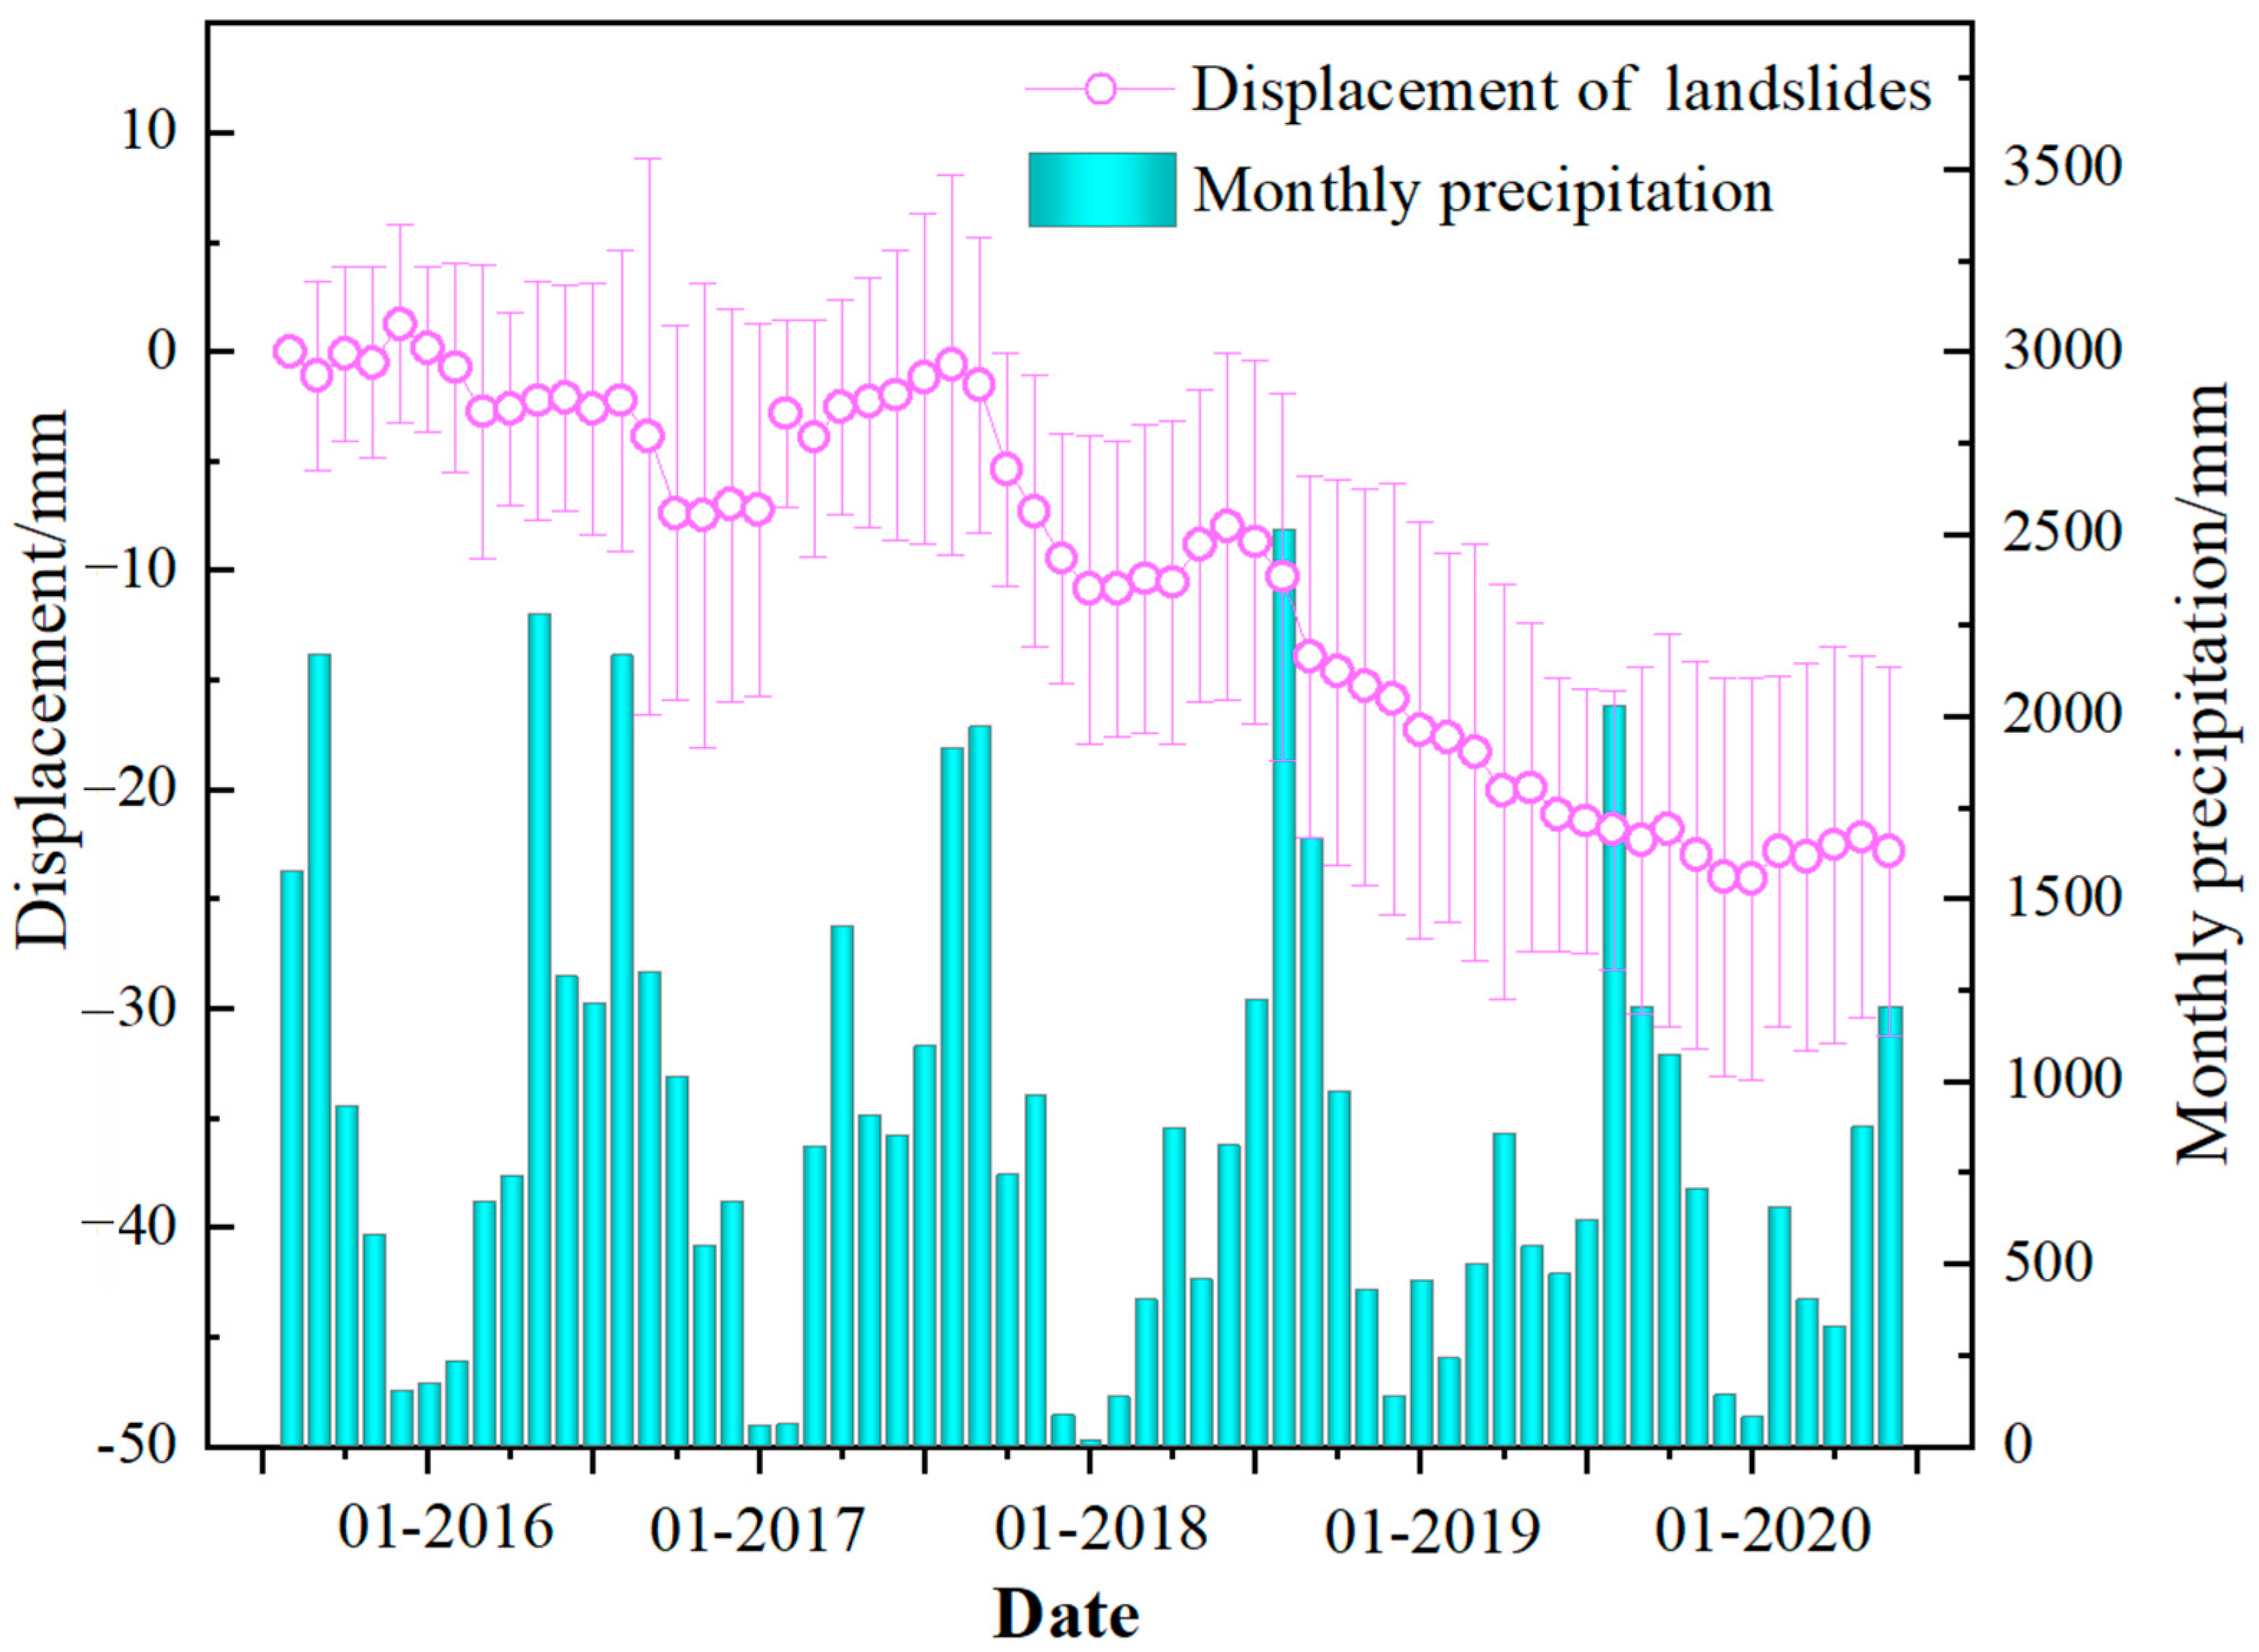
As can be seen from the time series of deformation data for typical landslide locations, most of the observed landslide deformation exhibits a pronounced nonlinear trend (Figure 9). In addition, some landslides exhibit periodic fluctuations, especially on the east bank of the Lancang River. This is mainly due to changes in local conditions, such as excessive precipitation, snow melt, human activities such as downslope cutting due to road construction, etc. [50,57,64,65]. Figure 11 shows the average time series displacements of landslides and monthly precipitation within the research region. The displacement results indicate that prior to March 2016, the study area was in a relatively stable state, and the average deformation was no more than 5 mm. However, landslide deformation accelerated significantly after May 2016 which may be due to the successive heavy rainfall (Figure 11). During the period from November 2016 to May 2017, deformation decreased significantly due to reduced rainfall and then accelerated again after heavy rainfall totaling more than 1916 mm in July 2017, with a maximum average cumulative displacement of 26 mm. Based on the above results, it can be concluded that landslide deformation is closely related to monthly precipitation. In general, precipitation or groundwater can easily infiltrate or flow into the slopes along cracks and loose layers, which accelerates landslide deformation [44]. In addition, no consistent trend was also found, e.g., low precipitation during the period from November 2017 to February 2018 caused significant deformation, which could be due to seasonal snowmelt contributing to landslide deformation [18,66]. Snowmelt and prolonged precipitation easily penetrate landslides through vertical joints and cracks, contributing significantly to their deformation and subsequent failure. Precipitation and snowmelt cause movement by altering pore pressure and water content, which increase when precipitation penetrates the landslide body. As a result, the shear strength of the landslide body decreases, accelerating its deformation [67,68,69].
However, the use of InSAR technology to identify and evaluate landslides still presents some challenges and shortcomings [33]. In particular, because of the steep terrain and dense vegetation in some spots, the SAR images suffered from geometrical distortion that might lead to landslide omission. Therefore, integrating sensor monitoring, field investigation, UAV technology, and multi-track SAR data with landslide investigation is highly promising.
5. Conclusions
The InSAR technique was used to detect ground deformation for Yezhi Site Area. Using 320 scenes of Sentinel-1A SAR data, including Track 33 descending orbit images (121 scenes), Track 172 ascending orbit images (56 scenes), and Track 99 ascending orbit images (113 scenes), we have successfully identified dangerous areas with high displacement rates during the period 2015–2020. In this work, the following conclusions are drawn:
- (1)
- By combining the deformation regions identified by three different orbital SAR data, 18 landslides were identified in total, and it was found that during the monitoring period of Sentinel-1A ascending and descending orbit data, the average deformation rate of the deformation zone ranges from −15 to 10 mm/y. In addition, the deformation zone is mainly distributed on both banks of the Lancang River, especially on the east side.
- (2)
- The utilization of both ascending and descending orbits can significantly enhance the effectiveness of satellite monitoring. The time series deformation shows that most of the high-locality landslides detected deformed periodically, and the study area was in a slow deformation state before 2017, but there was a large deformation during the period from 2017 to 2020 with the maximum deformation reaching 39 mm.
- (3)
- According to the results of the landslide detection and field survey, the main factors affecting the spatial distribution of high-locality landslides within the research region are rainfall, geological factors, and engineering activities. The findings in this study are useful for early landslide identification and dynamic stability evaluation of regional active landslides on complex terrain, especially for high-locality landslides.
Author Contributions
Conceptualization, D.W. and X.W.; methodology, D.W.; formal analysis, B.L. and D.W.; investigation, W.T.; data curation, W.T.; writing—original draft preparation, B.L. and D.W.; writing—review and editing, B.L.; funding acquisition, B.L. All authors have read and agreed to the published version of the manuscript.
Funding
This research was supported by the National Key R&D Program of China (No. 2023YFC3008405), the National Natural Science Foundation of China (No. 42207184), and Nature Science Basic Research Plan in Shaanxi Province of China (No. 2022JQ-253).
Data Availability Statement
The data that support the findings of this study are available from the corresponding author, D.W., upon reasonable request. The data are not publicly available due to privacy restrictions.
Acknowledgments
The authors would like to thank the European Space Agency (ESA) for providing free and open Sentinel-1 data. The authors would also like to thank the Google Earth Platform for providing optical remote-sensing images.
Conflicts of Interest
The authors declare no conflicts of interest.
References
- Del Soldato, M.; Bianchini, S.; Calcaterra, D.; De Vita, P.; Martire, D.D.; Tomás, R.; Casagli, N. A new approach for landslide-induced damage assessment. Geomat. Nat. Hazards Risk 2017, 8, 1524–1537. [Google Scholar] [CrossRef]
- Gariano, S.L.; Guzzetti, F. Landslides in a changing climate. Earth-Sci. Rev. 2016, 162, 227–252. [Google Scholar] [CrossRef]
- Peng, J.; Wang, S.; Wang, Q.; Zhuang, J.; Huang, W.; Zhu, X.; Leng, Y.; Ma, P. Distribution and genetic types of loess landslides in China. J. Asian Earth Sci. 2019, 170, 329–350. [Google Scholar] [CrossRef]
- Wang, X.; Wang, J.; Zhan, H.; Li, P.; Qiu, H.; Hu, S. Moisture content effect on the creep behavior of loess for the catastrophic Baqiao landslide. Catena 2020, 187, 104371. [Google Scholar] [CrossRef]
- Evans, S.; Mugnozza, G.S.; Strom, A.; Hermanns, R.; Ischuk, A.; Vinnichenko, S. Landslides from Massive Rock Slope Failure; Nato Science Series: IV; Earth and Environmental; Sciences Springer Science & Business Media: Berlin/Heidelberg, Germany, 2006; Volume 49. [Google Scholar]
- Fan, X.; Xu, Q.; Alonso-Rodriguez, A.; Subramanian, S.S.; Li, W.; Zheng, G.; Dong, X.; Huang, R. Successive landsliding and damming of the Jinsha River in eastern Tibet, China: Prime investigation, early warning, and emergency response. Landslides 2019, 16, 1003–1020. [Google Scholar] [CrossRef]
- Xu, W.; Zhang, Q.; Zhang, J.; Wang, R.; Wang, R. Deformation and control engineering related to huge landslide on left bank of Xiluodu reservoir, south-west China. Eur. J. Environ. Civ. Eng. 2013, 17, s249–s268. [Google Scholar] [CrossRef]
- Agliardi, F.; Crosta, G.B.; Frattini, P.; Malusà, M.G. Giant non-catastrophic landslides and the long-term exhumation of the European Alps. Earth Planet. Sci. Lett. 2013, 365, 263–274. [Google Scholar] [CrossRef]
- Casagli, N.; Frodella, W.; Morelli, S.; Tofani, V.; Ciampalini, A.; Intrieri, E.; Raspini, F.; Rossi, G.; Tanteri, L.; Lu, P. Spaceborne, UAV and ground-based remote sensing techniques for landslide mapping, monitoring and early warning. Geoenviron. Disasters 2017, 4, 9. [Google Scholar] [CrossRef]
- Ju, N.; Huang, J.; He, C.; Van Asch, T.; Huang, R.; Fan, X.; Xu, Q.; Xiao, Y.; Wang, J. Landslide early warning, case studies from Southwest China. Eng. Geol. 2020, 279, 105917. [Google Scholar] [CrossRef]
- Li, Z.; Shi, W.; Myint, S.W.; Lu, P.; Wang, Q. Semi-automated landslide inventory mapping from bitemporal aerial photographs using change detection and level set method. Remote Sens. Environ. 2016, 175, 215–230. [Google Scholar] [CrossRef]
- Luo, Y. Research on Geologic Environment in Three Parallel Rivers Region. Ph.D. Thesis, China University of Geosciences, Beijing, China, 2009. (In Chinese). [Google Scholar]
- He, Y.; Yang, S.; Pan, H. The geological hazard induding environment and prone zoning research of Weixi County, Yunnan Province. J. Yunnan Univ.-Nat. Sci. Ed. 2019, 41, 74–81. [Google Scholar]
- Wang, G.; Huang, R.; Chigira, M.; Wu, X.; Lourenço, S.D. Landslide Amplification by Liquefaction of Runout-Path Material after the 2008 Wenchuan (M 8·0) Earthquake, China. Earth Surf. Process. Landf. 2013, 38, 265–274. [Google Scholar] [CrossRef]
- Cui, Y.; Cheng, D.; Choi, C.E.; Jin, W.; Lei, Y.; Kargel, J.S. The cost of rapid and haphazard urbanization: Lessons learned from the Freetown landslide disaster. Landslides 2019, 16, 1167–1176. [Google Scholar] [CrossRef]
- Harp, E.L.; Keefer, D.K.; Sato, H.P.; Yagi, H. Landslide inventories: The essential part of seismic landslide hazard analyses. Eng. Geol. 2011, 122, 9–21. [Google Scholar] [CrossRef]
- Meng, Q.; Confuorto, P.; Peng, Y.; Raspini, F.; Bianchini, S.; Han, S.; Liu, H.; Casagli, N. Regional recognition and classification of active loess landslides using two-dimensional deformation derived from Sentinel-1 interferometric radar data. Remote Sens. 2020, 12, 1541. [Google Scholar] [CrossRef]
- Squarzoni, G.; Bayer, B.; Franceschini, S.; Simoni, A. Pre-and post-failure dynamics of landslides in the Northern Apennines revealed by space-borne synthetic aperture radar interferometry (InSAR). Geomorphology 2020, 369, 107353. [Google Scholar] [CrossRef]
- Li, Y.; Mo, P. A unified landslide classification system for loess slopes: A critical review. Geomorphology 2019, 340, 67–83. [Google Scholar] [CrossRef]
- D’Ambrosio, D.; Iovine, G.; Spataro, W.; Miyamoto, H. A macroscopic collisional model for debris-flows simulation. Environ. Model. Softw. 2007, 22, 1417–1436. [Google Scholar] [CrossRef]
- Iovine, G.G.; Greco, R.; Gariano, S.L.; Pellegrino, A.D.; Terranova, O.G. Shallow-landslide susceptibility in the Costa Viola mountain ridge (southern Calabria, Italy) with considerations on the role of causal factors. Nat. Hazards 2014, 73, 111–136. [Google Scholar] [CrossRef]
- Gallo, I.G.; Martínez-Corbella, M.; Sarro, R.; Iovine, G.; López-Vinielles, J.; Hérnandez, M.; Robustelli, G.; Mateos, R.M.; García-Davalillo, J.C. An integration of UAV-based photogrammetry and 3D modelling for rockfall hazard assessment: The Cárcavos case in 2018 (Spain). Remote Sens. 2021, 13, 3450. [Google Scholar] [CrossRef]
- Caduff, R.; Schlunegger, F.; Kos, A.; Wiesmann, A. A review of terrestrial radar interferometry for measuring surface change in the geosciences. Earth Surf. Process. Landf. 2015, 40, 208–228. [Google Scholar] [CrossRef]
- Dai, K.; Xu, Q.; Li, Z.; Tomás, R.; Fan, X.; Dong, X.; Li, W.; Zhou, Z.; Gou, J.; Ran, P. Post-disaster assessment of 2017 catastrophic Xinmo landslide (China) by spaceborne SAR interferometry. Landslides 2019, 16, 1189–1199. [Google Scholar] [CrossRef]
- Necsoiu, M.; Hooper, D. Use of emerging InSAR and LiDAR remote sensing technologies to anticipate and monitor critical natural hazards. In Building Safer Communities. Risk Governance, Spatial Planning and Responses to Natural Hazards; Fra Paleo, U., Ed.; IOS Press: Amsterdam, The Netherlands, 2009; pp. 246–267. [Google Scholar]
- Novellino, A.; Cesarano, M.; Cappelletti, P.; Di Martire, D.; Di Napoli, M.; Ramondini, M.; Sowter, A.; Calcaterra, D. Slow-moving landslide risk assessment combining Machine Learning and InSAR techniques. Catena 2021, 203, 105317. [Google Scholar] [CrossRef]
- Scaioni, M.; Longoni, L.; Melillo, V.; Papini, M. Remote sensing for landslide investigations: An overview of recent achievements and perspectives. Remote Sens. 2014, 6, 9600–9652. [Google Scholar] [CrossRef]
- Teshebaeva, K.; Echtler, H.; Bookhagen, B.; Strecker, M. Deep-seated gravitational slope deformation (DSGSD) and slow-moving landslides in the southern Tien Shan Mountains: New insights from InSAR, tectonic and geomorphic analysis. Earth Surf. Process. Landf. 2019, 44, 2333–2348. [Google Scholar] [CrossRef]
- Liu, W.; Zhang, Y.; Meng, X.; Wang, A.; Li, Y.; Su, X.; Chen, G. Forecast volume of potential landslides in alpine-canyon terrain using time-series InSAR technology: A case study in the Bailong River basin, China. Landslides 2024, 21, 35–51. [Google Scholar] [CrossRef]
- Bovenga, F.; Wasowski, J.; Nitti, D.; Nutricato, R.; Chiaradia, M. Using COSMO/SkyMed X-band and ENVISAT C-band SAR interferometry for landslides analysis. Remote Sens. Environ. 2012, 119, 272–285. [Google Scholar] [CrossRef]
- Carlà, T.; Tofani, V.; Lombardi, L.; Raspini, F.; Bianchini, S.; Bertolo, D.; Thuegaz, P.; Casagli, N. Combination of GNSS, satellite InSAR, and GBInSAR remote sensing monitoring to improve the understanding of a large landslide in high alpine environment. Geomorphology 2019, 335, 62–75. [Google Scholar] [CrossRef]
- Colesanti, C.; Ferretti, A.; Prati, C.; Rocca, F. Monitoring landslides and tectonic motions with the Permanent Scatterers Technique. Eng. Geol. 2003, 68, 3–14. [Google Scholar] [CrossRef]
- Wasowski, J.; Bovenga, F. Investigating landslides and unstable slopes with satellite Multi Temporal Interferometry: Current issues and future perspectives. Eng. Geol. 2014, 174, 103–138. [Google Scholar] [CrossRef]
- Barboux, C.; Delaloye, R.; Lambiel, C. Inventorying slope movements in an Alpine environment using DInSAR. Earth Surf. Process. Landf. 2014, 39, 2087–2099. [Google Scholar] [CrossRef]
- Castañeda, C.; Gutiérrez, F.; Manunta, M.; Galve, J.P. DInSAR measurements of ground deformation by sinkholes, mining subsidence, and landslides, Ebro River, Spain. Earth Surf. Process. Landf. 2009, 34, 1562–1574. [Google Scholar] [CrossRef]
- Haghshenas Haghighi, M.; Motagh, M. Assessment of ground surface displacement in Taihape landslide, New Zealand, with C-and X-band SAR interferometry. N. Z. J. Geol. Geophys. 2016, 59, 136–146. [Google Scholar] [CrossRef]
- Singleton, A.; Li, Z.; Hoey, T.; Muller, J.-P. Evaluating sub-pixel offset techniques as an alternative to D-InSAR for monitoring episodic landslide movements in vegetated terrain. Remote Sens. Environ. 2014, 147, 133–144. [Google Scholar] [CrossRef]
- Tantianuparp, P.; Shi, X.; Zhang, L.; Balz, T.; Liao, M. Characterization of landslide deformations in three gorges area using multiple InSAR data stacks. Remote Sens. 2013, 5, 2704–2719. [Google Scholar] [CrossRef]
- Xiong, Z.; Feng, G.; Feng, Z.; Miao, L.; Wang, Y.; Yang, D.; Luo, S. Pre-and post-failure spatial-temporal deformation pattern of the Baige landslide retrieved from multiple radar and optical satellite images. Eng. Geol. 2020, 279, 105880. [Google Scholar] [CrossRef]
- Cao, C.; Zhu, K.; Xu, P.; Shan, B.; Yang, G.; Song, S. Refined landslide susceptibility analysis based on InSAR technology and UAV multi-source data. J. Clean. Prod. 2022, 368, 133146. [Google Scholar] [CrossRef]
- Herrera, G.; Gutiérrez, F.; García-Davalillo, J.; Guerrero, J.; Notti, D.; Galve, J.; Fernández-Merodo, J.; Cooksley, G. Multi-sensor advanced DInSAR monitoring of very slow landslides: The Tena Valley case study (Central Spanish Pyrenees). Remote Sens. Environ. 2013, 128, 31–43. [Google Scholar] [CrossRef]
- Casu, F.; Manzo, M.; Lanari, R. A quantitative assessment of the SBAS algorithm performance for surface deformation retrieval from DInSAR data. Remote Sens. Environ. 2006, 102, 195–210. [Google Scholar] [CrossRef]
- Dun, J.; Feng, W.; Yi, X.; Zhang, G.; Wu, M. Detection and mapping of active landslides before impoundment in the Baihetan Reservoir Area (China) based on the time-series InSAR method. Remote Sens. 2021, 13, 3213. [Google Scholar] [CrossRef]
- Liu, X.; Zhao, C.; Zhang, Q.; Lu, Z.; Li, Z.; Yang, C.; Zhu, W.; Liu-Zeng, J.; Chen, L.; Liu, C. Integration of Sentinel-1 and ALOS/PALSAR-2 SAR datasets for mapping active landslides along the Jinsha River corridor, China. Eng. Geol. 2021, 284, 106033. [Google Scholar] [CrossRef]
- Zhang, J.; Zhu, W.; Cheng, Y.; Li, Z. Landslide Detection in the Linzhi–Ya’an Section along the Sichuan–Tibet Railway Based on InSAR and Hot Spot Analysis Methods. Remote Sens. 2021, 13, 3566. [Google Scholar] [CrossRef]
- Cui, P.; Guo, C.-X.; Zhou, J.-W.; Hao, M.-H.; Xu, F.-G. The mechanisms behind shallow failures in slopes comprised of landslide deposits. Eng. Geol. 2014, 180, 34–44. [Google Scholar] [CrossRef]
- Malet, J.-P.; Van Asch, T.W.; Van Beek, R.; Maquaire, O. Forecasting the behaviour of complex landslides with a spatially distributed hydrological model. Nat. Hazards Earth Syst. Sci. 2005, 5, 71–85. [Google Scholar] [CrossRef]
- Tomás, R.; Pagán, J.I.; Navarro, J.A.; Cano, M.; Pastor, J.L.; Riquelme, A.; Cuevas-González, M.; Crosetto, M.; Barra, A.; Monserrat, O. Semi-automatic identification and pre-screening of geological–geotechnical deformational processes using persistent scatterer interferometry datasets. Remote Sens. 2019, 11, 1675. [Google Scholar] [CrossRef]
- Zhang, Y.; Meng, X.; Jordan, C.; Novellino, A.; Dijkstra, T.; Chen, G. Investigating slow-moving landslides in the Zhouqu region of China using InSAR time series. Landslides 2018, 15, 1299–1315. [Google Scholar]
- Doin, M.-P.; Lasserre, C.; Peltzer, G.; Cavalié, O.; Doubre, C. Corrections of stratified tropospheric delays in SAR interferometry: Validation with global atmospheric models. J. Appl. Geophys. 2009, 69, 35–50. [Google Scholar] [CrossRef]
- Raucoules, D.; De Michele, M.; Malet, J.-P.; Ulrich, P. Time-variable 3D ground displacements from high-resolution synthetic aperture radar (SAR). Application to La Valette landslide (South French Alps). Remote Sens. Environ. 2013, 139, 198–204. [Google Scholar] [CrossRef]
- Lazecký, M.; Hlaváčová, I.; Martinovič, J.; Ruiz-Armenteros, A.M. Accuracy of Sentinel-1 interferometry monitoring system based on topography-free phase images. Procedia Comput. Sci. 2018, 138, 310–317. [Google Scholar] [CrossRef]
- Peter, H.; Jäggi, A.; Fernández, J.; Escobar, D.; Ayuga, F.; Arnold, D.; Wermuth, M.; Hackel, S.; Otten, M.; Simons, W. Sentinel-1A–First precise orbit determination results. Adv. Space Res. 2017, 60, 879–892. [Google Scholar]
- Zhang, F.; Chen, W.; Liu, G.; Liang, S.; Kang, C.; He, F. Relationships between landslide types and topographic attributes in a loess catchment, China. J. Mt. Sci. 2012, 9, 742–751. [Google Scholar] [CrossRef]
- Berardino, P.; Fornaro, G.; Lanari, R.; Sansosti, E. A new algorithm for surface deformation monitoring based on small baseline differential SAR interferograms. IEEE Trans. Geosci. Remote Sens. 2002, 40, 2375–2383. [Google Scholar] [CrossRef]
- Lanari, R.; Casu, F.; Manzo, M.; Zeni, G.; Berardino, P.; Manunta, M.; Pepe, A. An overview of the small baseline subset algorithm: A DInSAR technique for surface deformation analysis. Pure Appl. Geophys. 2007, 164, 637–661. [Google Scholar] [CrossRef]
- Lyons, S.; Sandwell, D. Fault creep along the southern San Andreas from interferometric synthetic aperture radar, permanent scatterers, and stacking. J. Geophys. Res. Solid Earth 2003, 108, 2047. [Google Scholar] [CrossRef]
- Sirbu, F.; Drăguţ, L.; Oguchi, T.; Hayakawa, Y.; Micu, M. Sensitivity of land-surface variables to scale in identifying landslide scarps. Geomorphometry 2018, 13–17. [Google Scholar]
- Werner, C.; Wegmuller, U.; Strozzi, T.; Wiesmann, A. Interferometric point target analysis for deformation mapping. In Proceedings of the IGARSS 2003. 2003 IEEE International Geoscience and Remote Sensing Symposium. Proceedings (IEEE Cat. No. 03CH37477), Toulouse, France, 21–25 July 2003; IEEE: Piscataway, NJ, USA, 2003; pp. 4362–4364. [Google Scholar]
- Zhao, C.; Kang, Y.; Zhang, Q.; Lu, Z.; Li, B. Landslide identification and monitoring along the Jinsha River catchment (Wudongde reservoir area), China, using the InSAR method. Remote Sens. 2018, 10, 993. [Google Scholar] [CrossRef]
- Bekaert, D.P.; Handwerger, A.L.; Agram, P.; Kirschbaum, D.B. InSAR-based detection method for mapping and monitoring slow-moving landslides in remote regions with steep and mountainous terrain: An application to Nepal. Remote Sens. Environ. 2020, 249, 111983. [Google Scholar] [CrossRef]
- Niu, Q.; Dang, X.; Li, Y.; Zhang, Y.; Lu, X.; Gao, W. Suitability analysis for topographic factors in loess landslide research: A case study of Gangu County, China. Environ. Earth Sci. 2018, 77, 294. [Google Scholar] [CrossRef]
- Zhao, C.; Lu, Z.; Zhang, Q.; de La Fuente, J. Large-area landslide detection and monitoring with ALOS/PALSAR imagery data over Northern California and Southern Oregon, USA. Remote Sens. Environ. 2012, 124, 348–359. [Google Scholar] [CrossRef]
- Wu, C.; Cui, P.; Li, Y.; Ayala, I.A.; Huang, C.; Yi, S.-J. Seismogenic fault and topography control on the spatial patterns of landslides triggered by the 2017 Jiuzhaigou earthquake. J. Mt. Sci. 2018, 15, 793–807. [Google Scholar] [CrossRef]
- Bayer, B.; Simoni, A.; Mulas, M.; Corsini, A.; Schmidt, D. Deformation responses of slow moving landslides to seasonal rainfall in the Northern Apennines, measured by InSAR. Geomorphology 2018, 308, 293–306. [Google Scholar] [CrossRef]
- Van Asch, T.W.; Van Beek, L.; Bogaard, T. Problems in predicting the mobility of slow-moving landslides. Eng. Geol. 2007, 91, 46–55. [Google Scholar] [CrossRef]
- Cui, Y.; Chan, D.; Nouri, A. Coupling of solid deformation and pore pressure for undrained deformation—A discrete element method approach. Int. J. Numer. Anal. Methods Geomech. 2017, 41, 1943–1961. [Google Scholar] [CrossRef]
- Ma, P.; Cui, Y.; Wang, W.; Lin, H.; Zhang, Y. Coupling InSAR and numerical modeling for characterizing landslide movements under complex loads in urbanized hillslopes. Landslides 2021, 18, 1611–1623. [Google Scholar] [CrossRef]
- Pfeiffer, J.; Zieher, T.; Schmieder, J.; Rutzinger, M.; Strasser, U. Spatio-temporal assessment of the hydrological drivers of an active deep-seated gravitational slope deformation: The Vögelsberg landslide in Tyrol (Austria). Earth Surf. Process. Landf. 2021, 46, 1865–1881. [Google Scholar] [CrossRef]
Figure 1.
(a) Study area, Yunnan Province; (b) unmanned aerial vehicle (UAV) images, Yezhi Town; (c) digital elevation model (DEM); (d,e) tectonic erosion landscapes and depositional terrace landforms.
Figure 1.
(a) Study area, Yunnan Province; (b) unmanned aerial vehicle (UAV) images, Yezhi Town; (c) digital elevation model (DEM); (d,e) tectonic erosion landscapes and depositional terrace landforms.
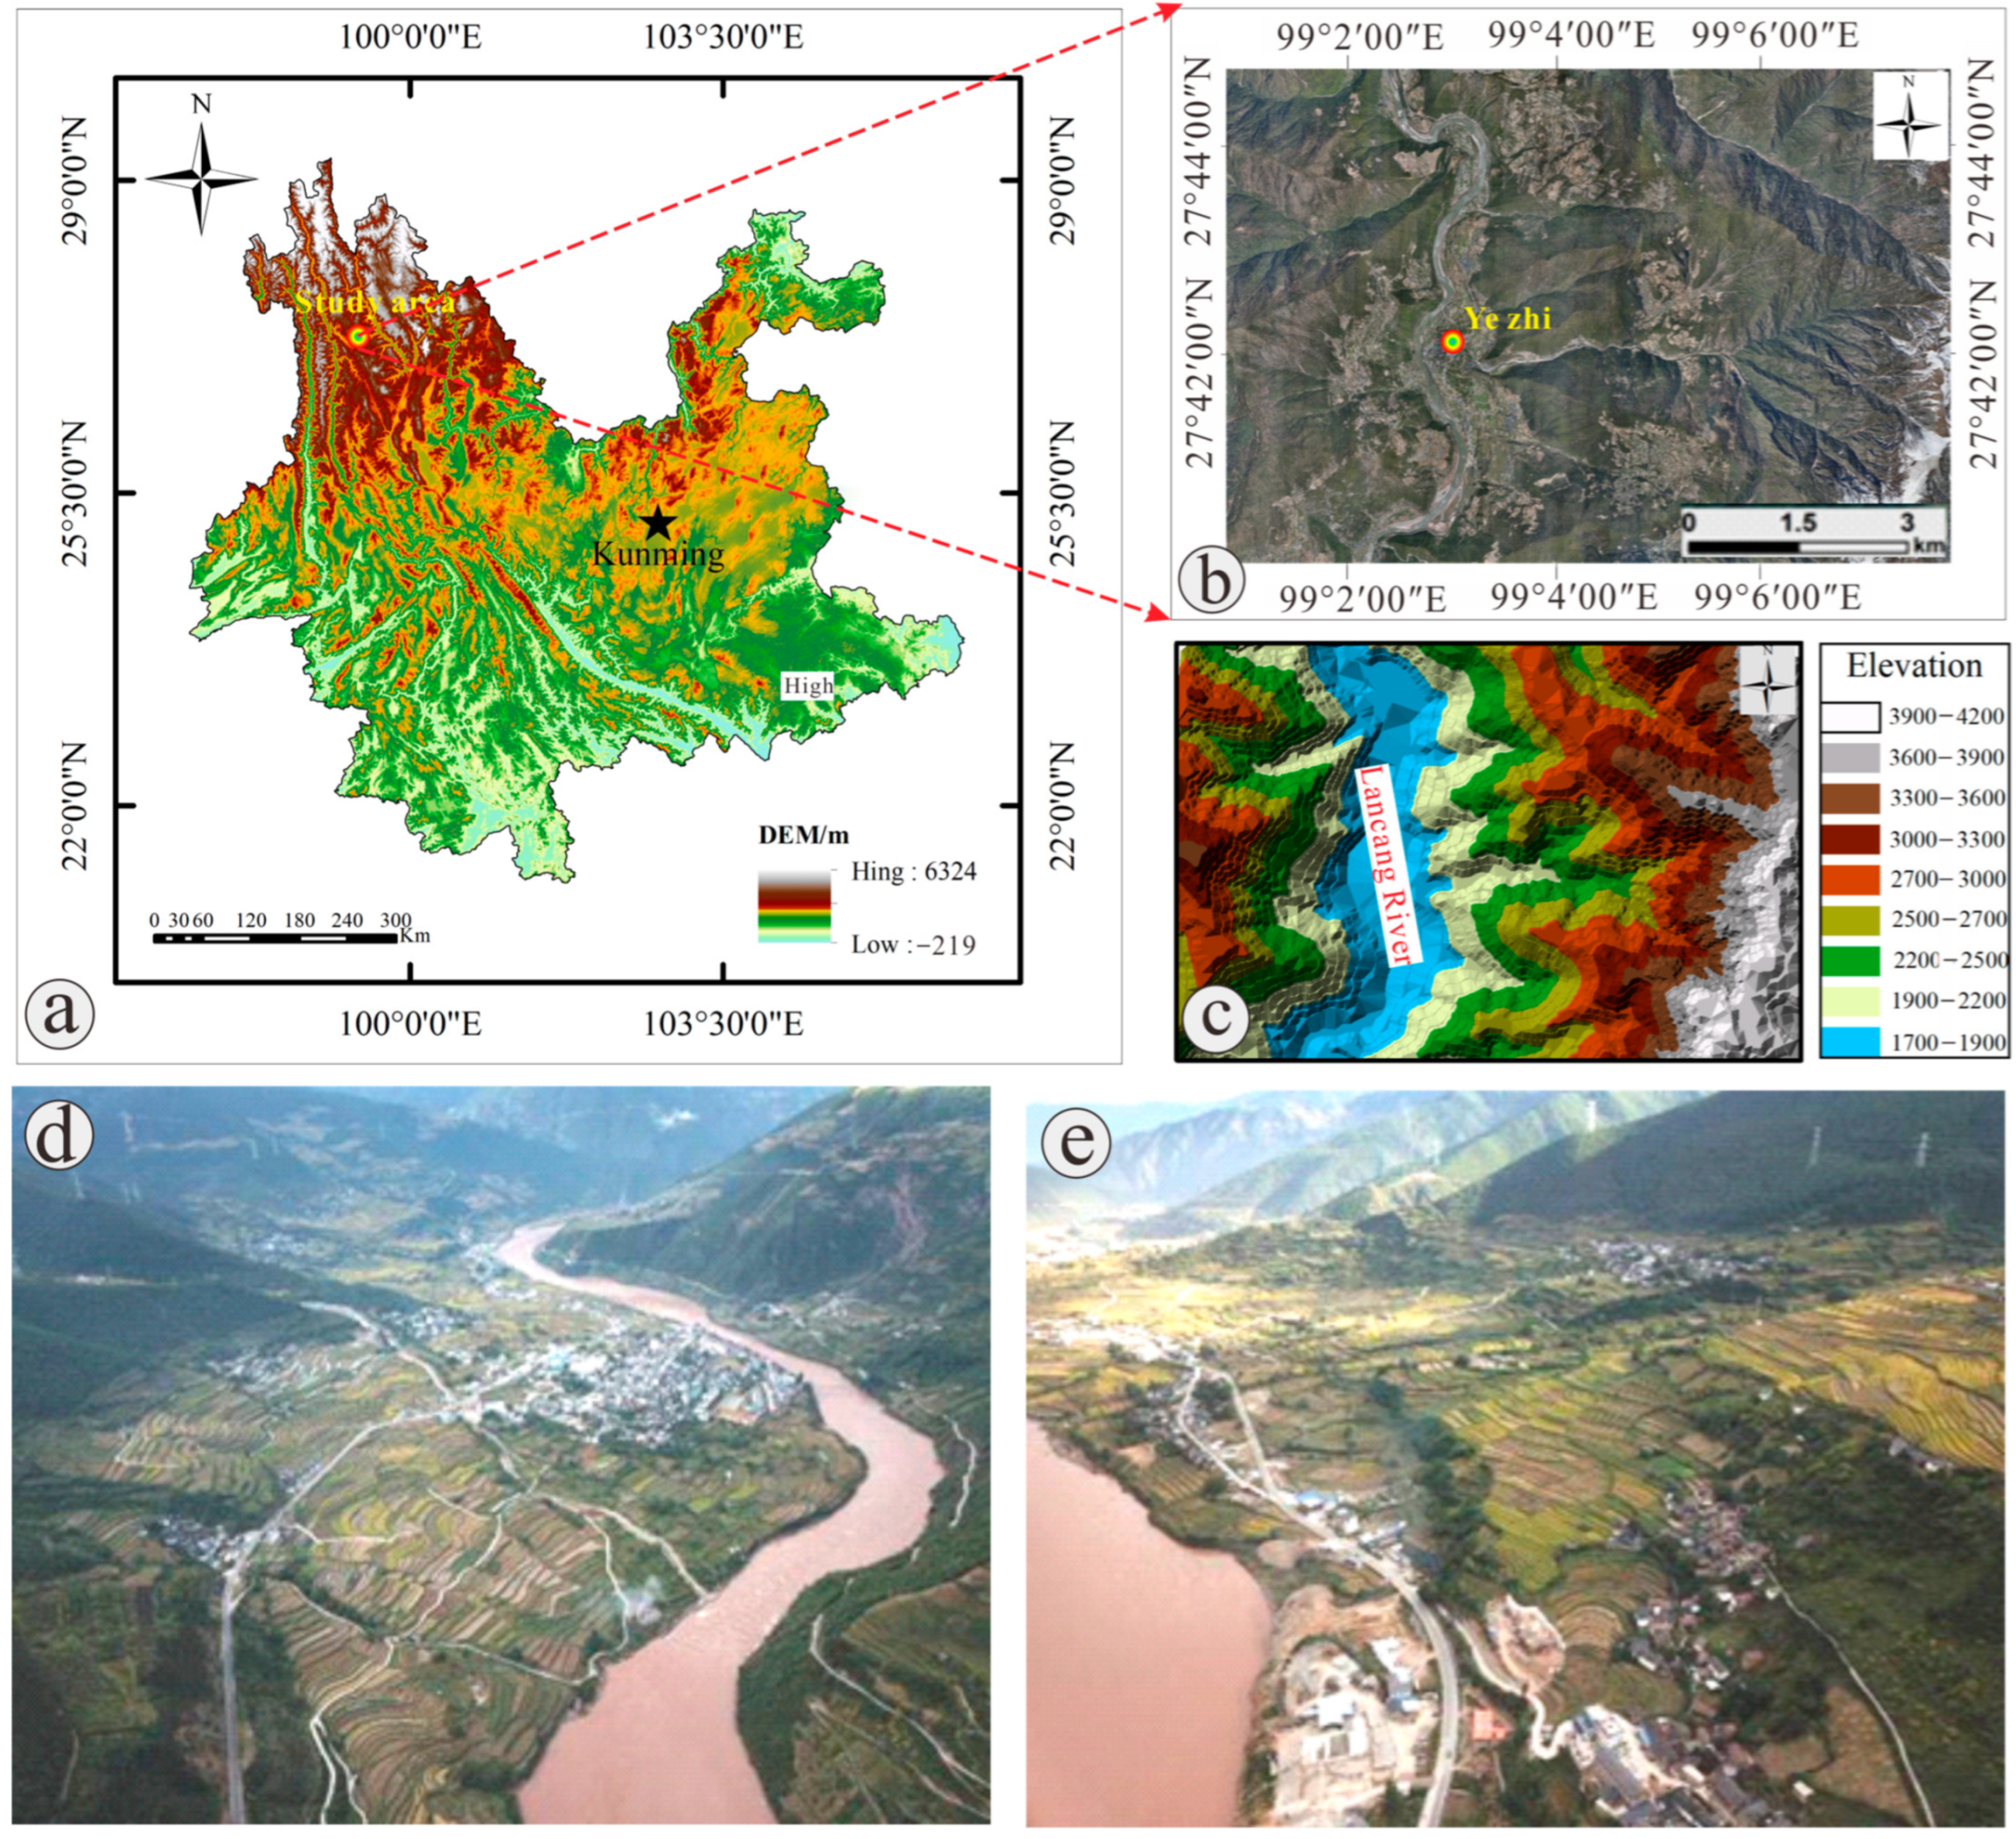
Figure 2.
(a) Groundwater seepage at the foot of landslides, (b) seasonal floods in the channel erode the toe of the slope, (c) loose and fragmented slope, (d) engineering activities.
Figure 2.
(a) Groundwater seepage at the foot of landslides, (b) seasonal floods in the channel erode the toe of the slope, (c) loose and fragmented slope, (d) engineering activities.

Figure 3.
The SAR scene in the ascending and descending paths covering Yezhi Town.

Figure 4.
Time-Baseline map of Sentinel-1A image interferometric pairs (a) Track 99 ascending data, (b) Track 33 descending data, (c) Track 172 ascending data.
Figure 4.
Time-Baseline map of Sentinel-1A image interferometric pairs (a) Track 99 ascending data, (b) Track 33 descending data, (c) Track 172 ascending data.
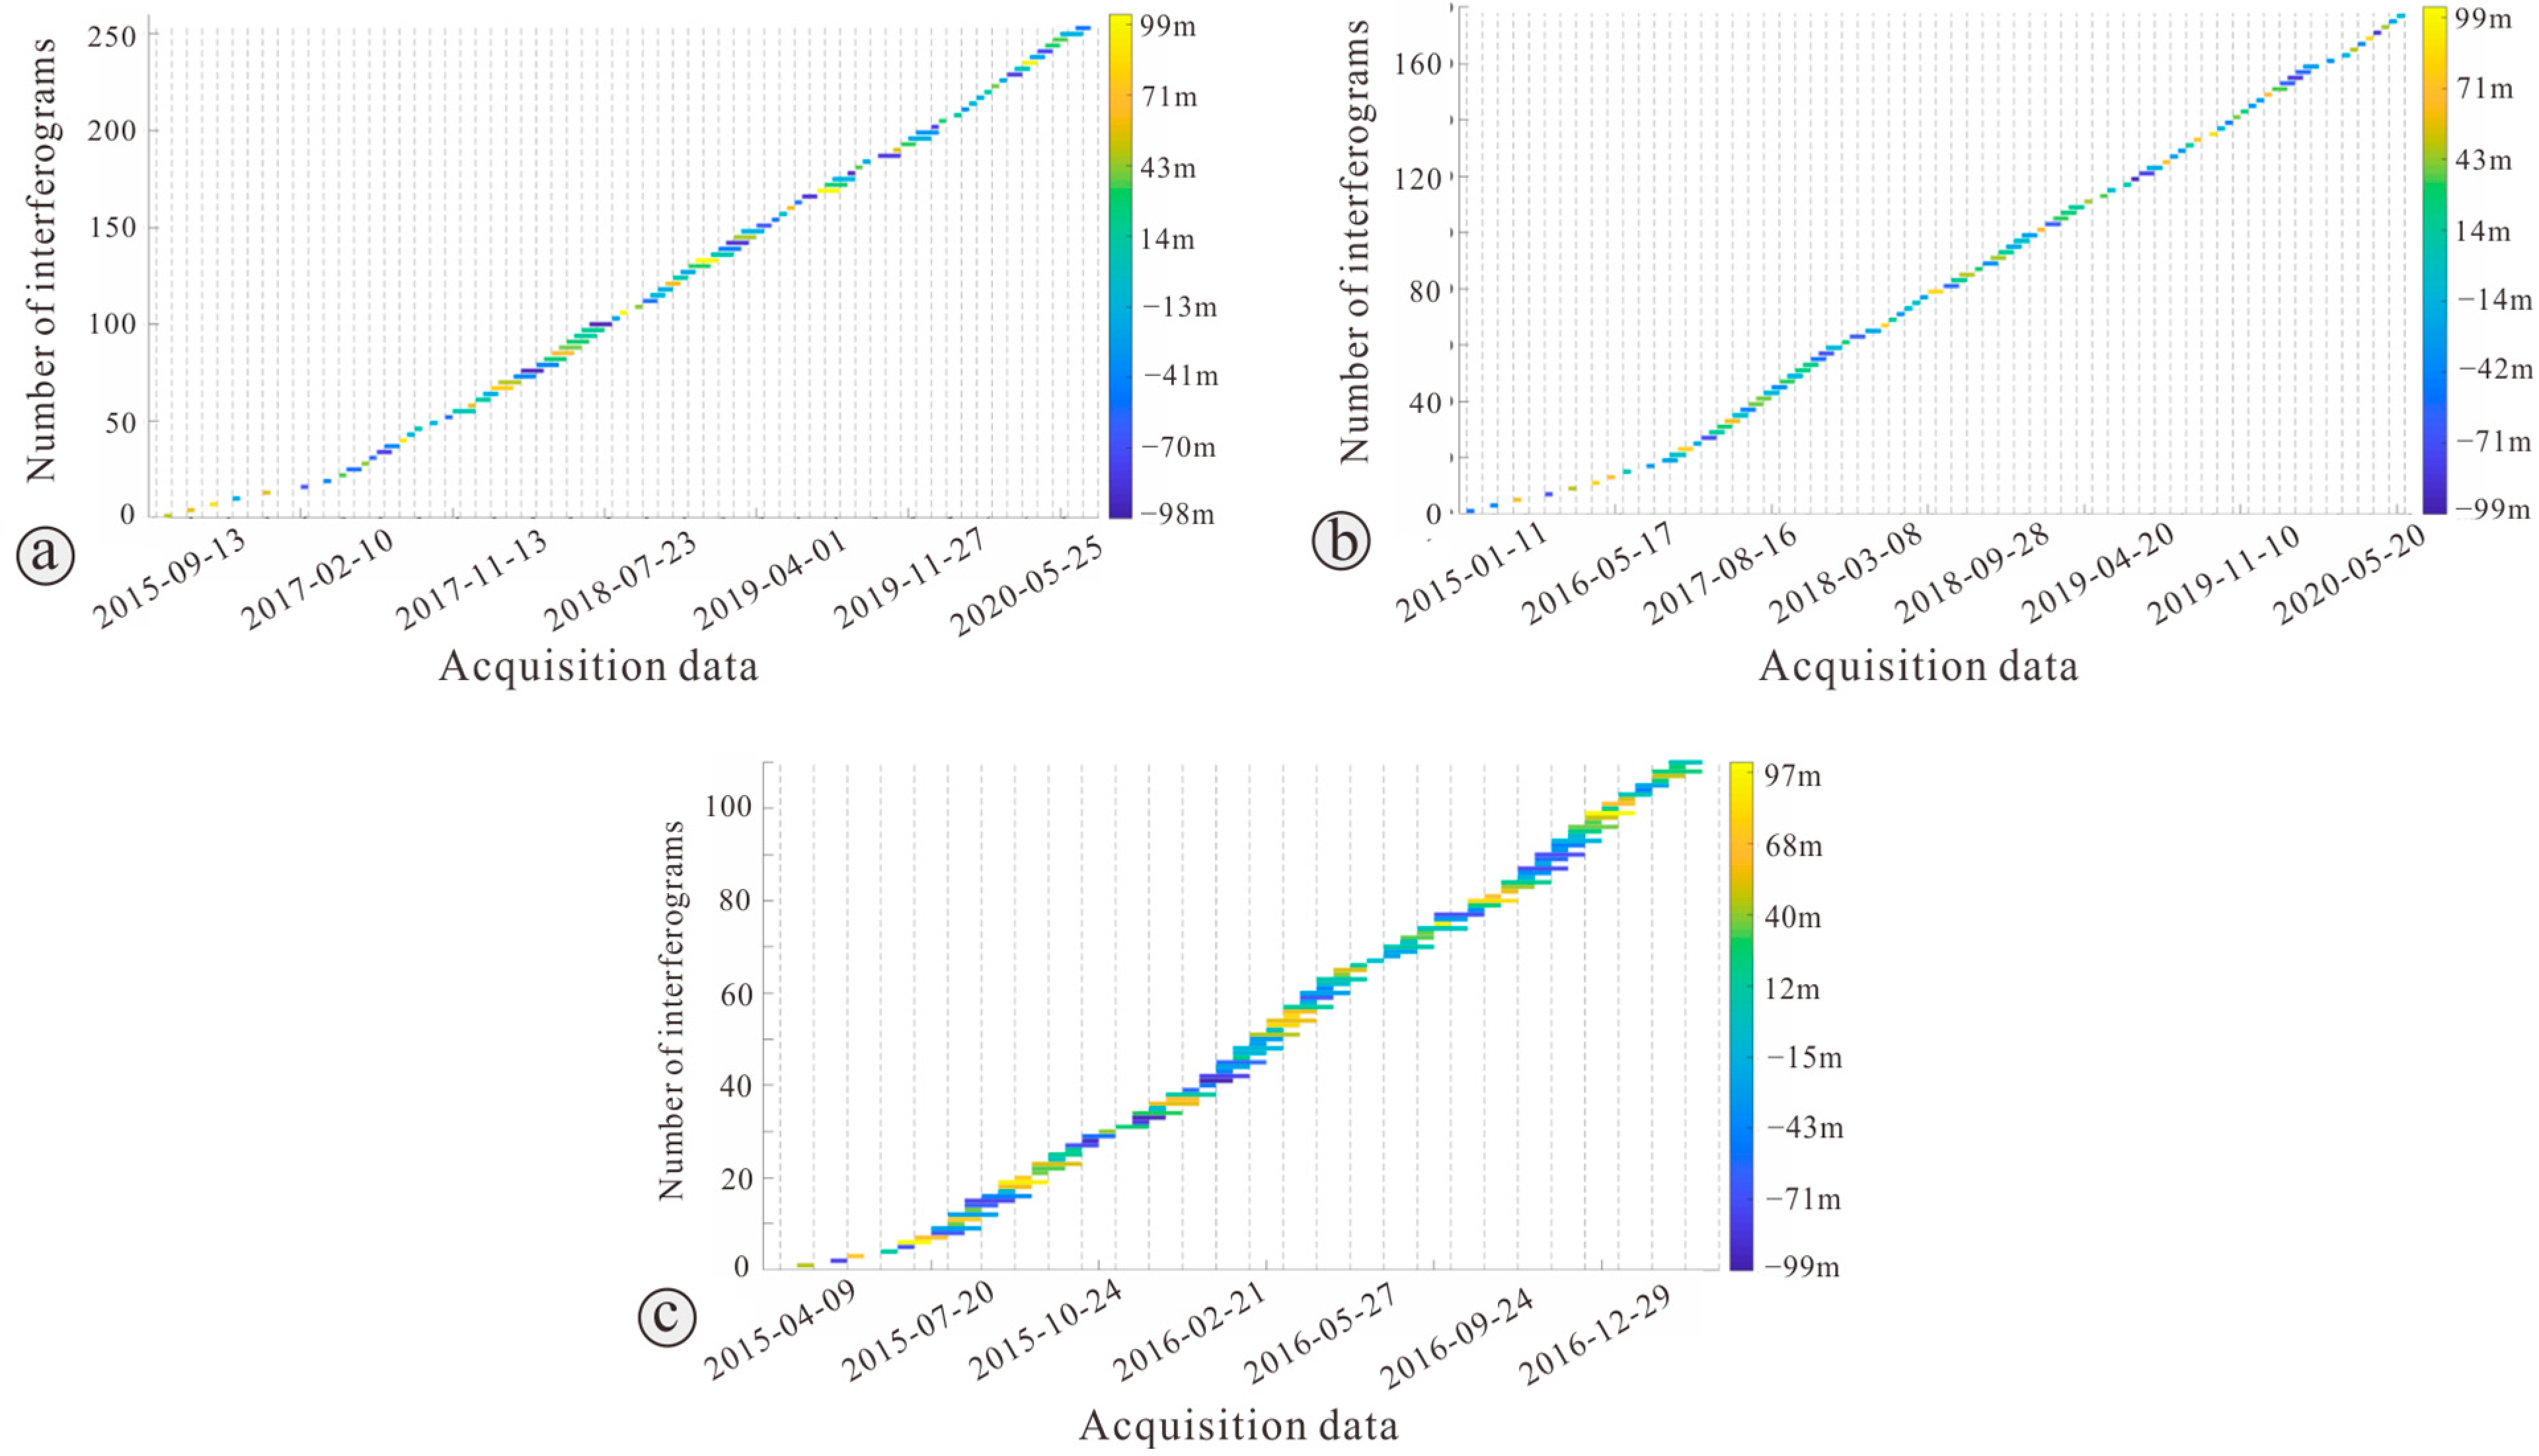
Figure 5.
Deformation results acquired from Sentinel-1A data in the study region (a) along ascending Track 99 (9 June 2015 to 30 June 2020), (b) along descending Track 33 (7 October 2014 to 7 July 2020), (c) along ascending Track 172 (29 October 2014 to 11 March 2017), (d) deformation results derived from three different orbital SAR data.
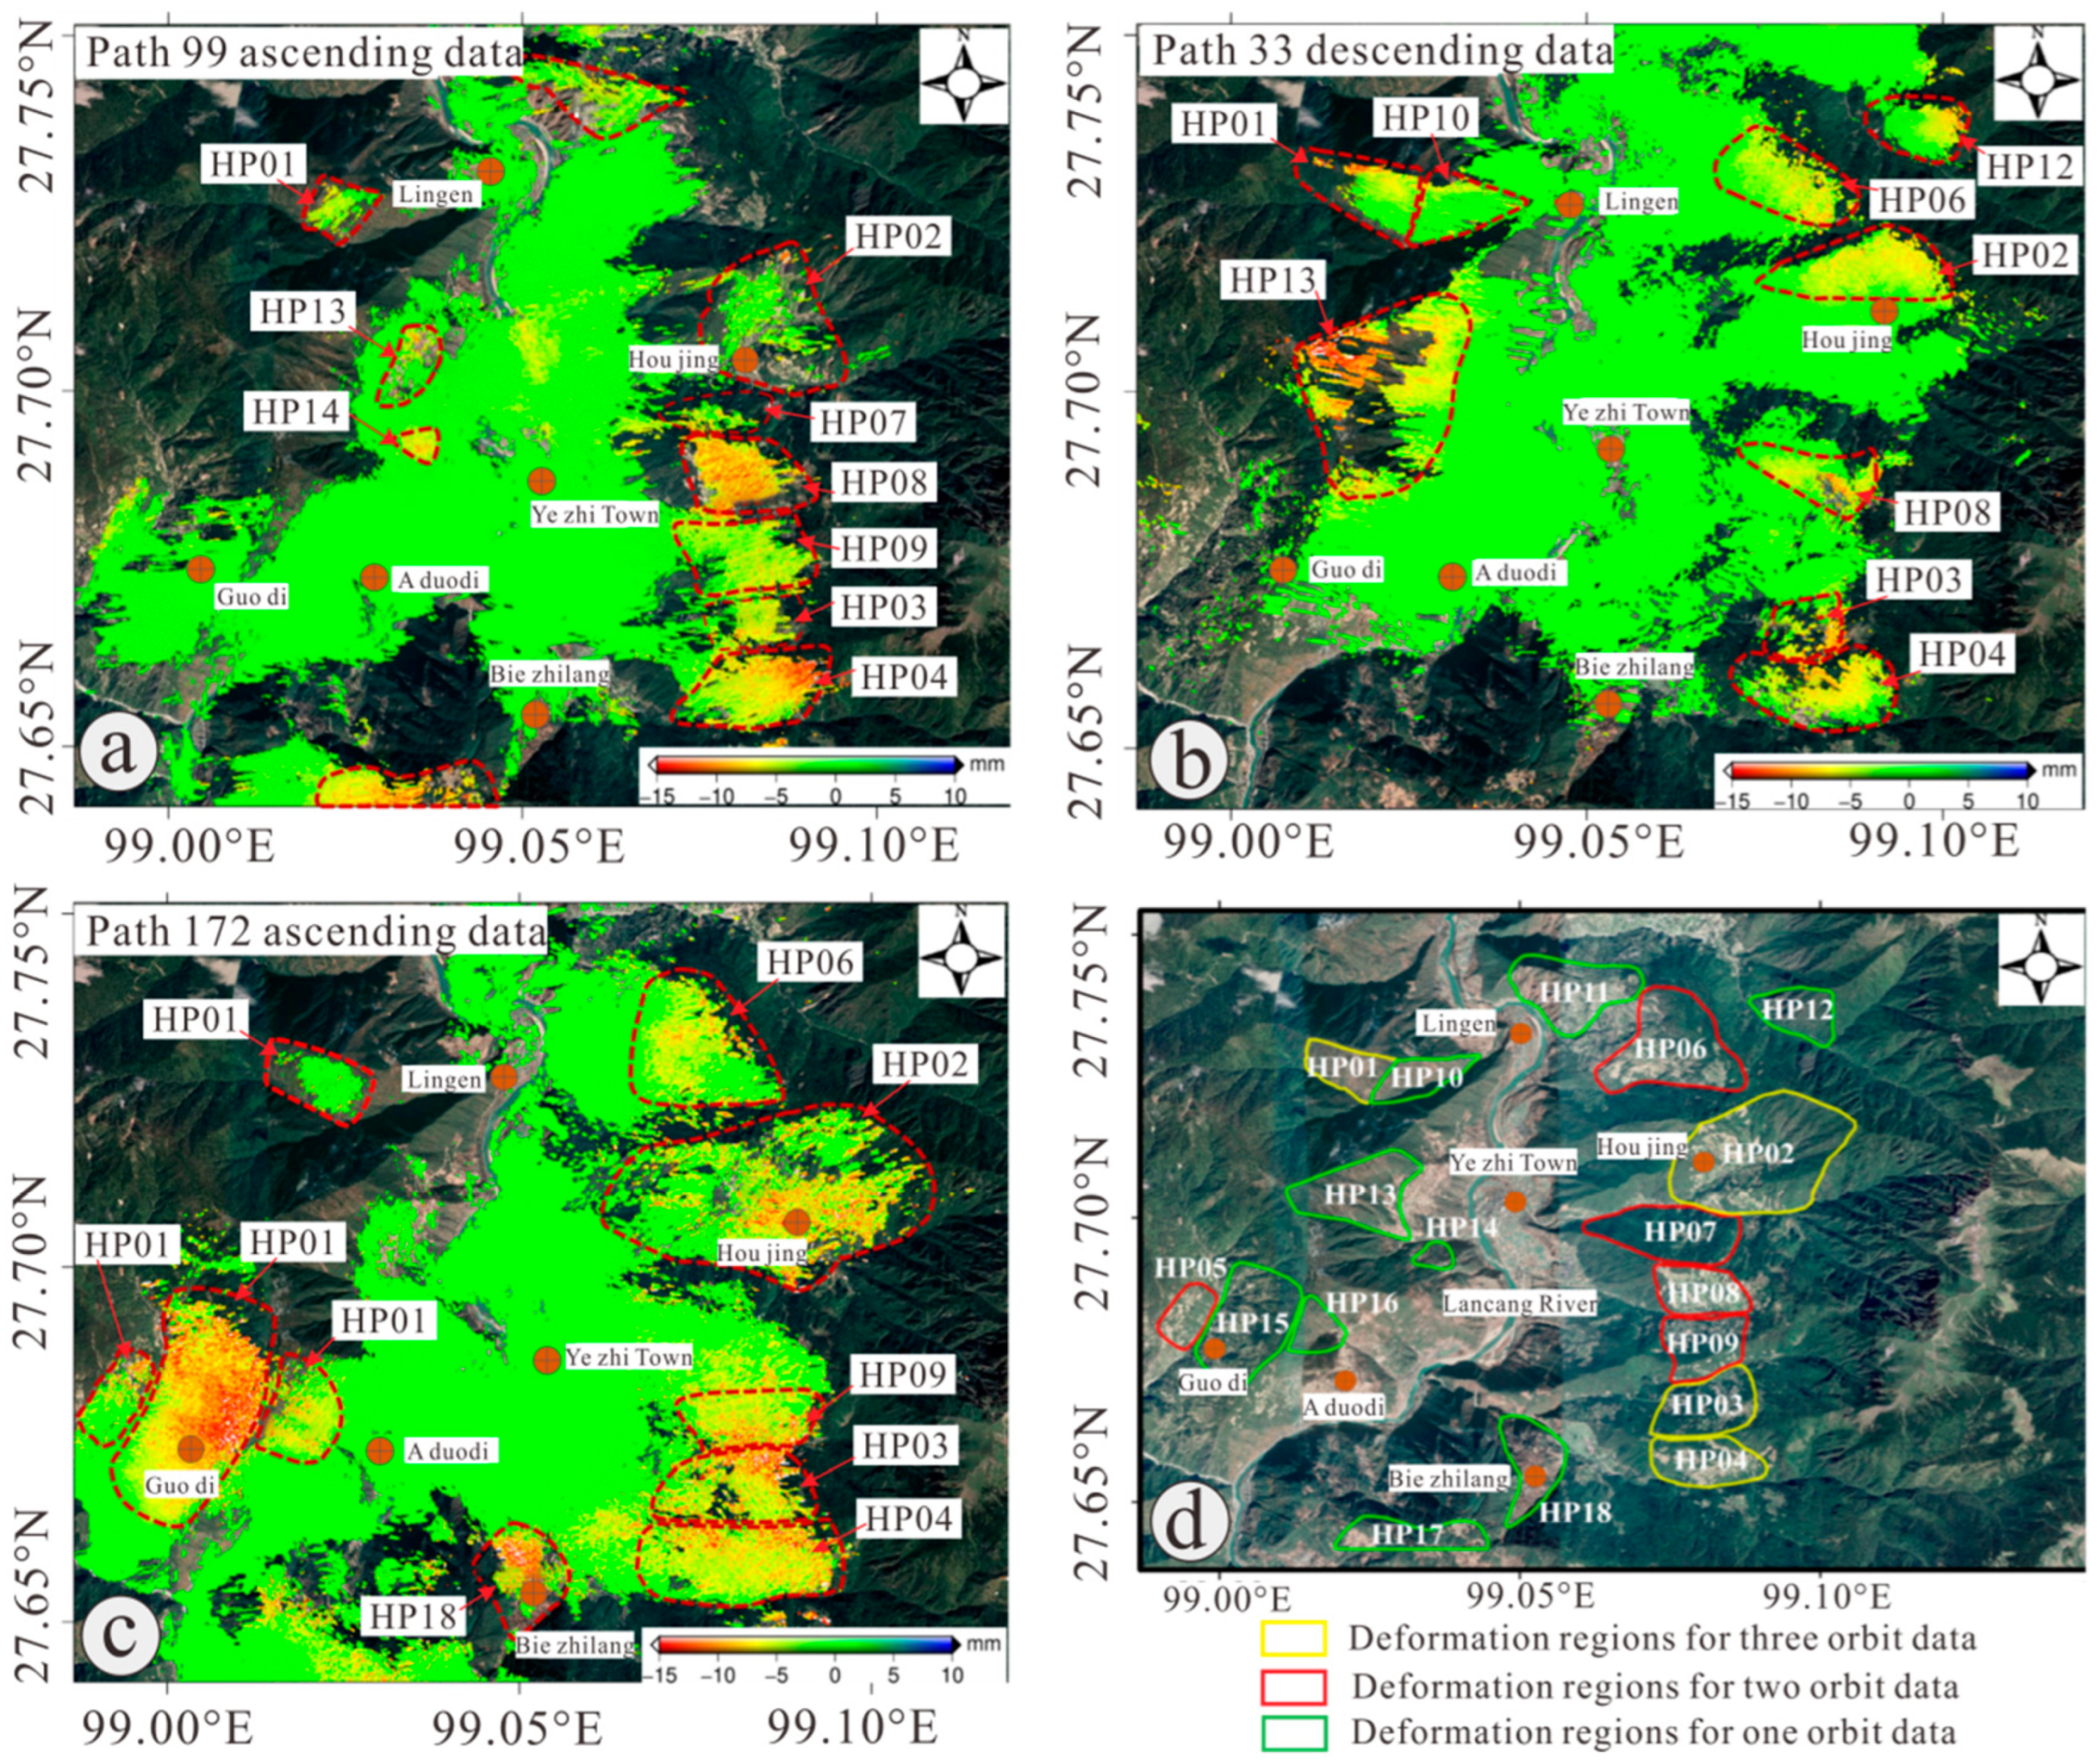
Figure 6.
Time series deformation characteristics during the Track 99 ascending data monitoring period in the study area (Unit: mm/a).
Figure 6.
Time series deformation characteristics during the Track 99 ascending data monitoring period in the study area (Unit: mm/a).

Figure 7.
Time series deformation characteristics during the Track 33 descending data monitoring period in the study area (Unit: mm/a).
Figure 7.
Time series deformation characteristics during the Track 33 descending data monitoring period in the study area (Unit: mm/a).
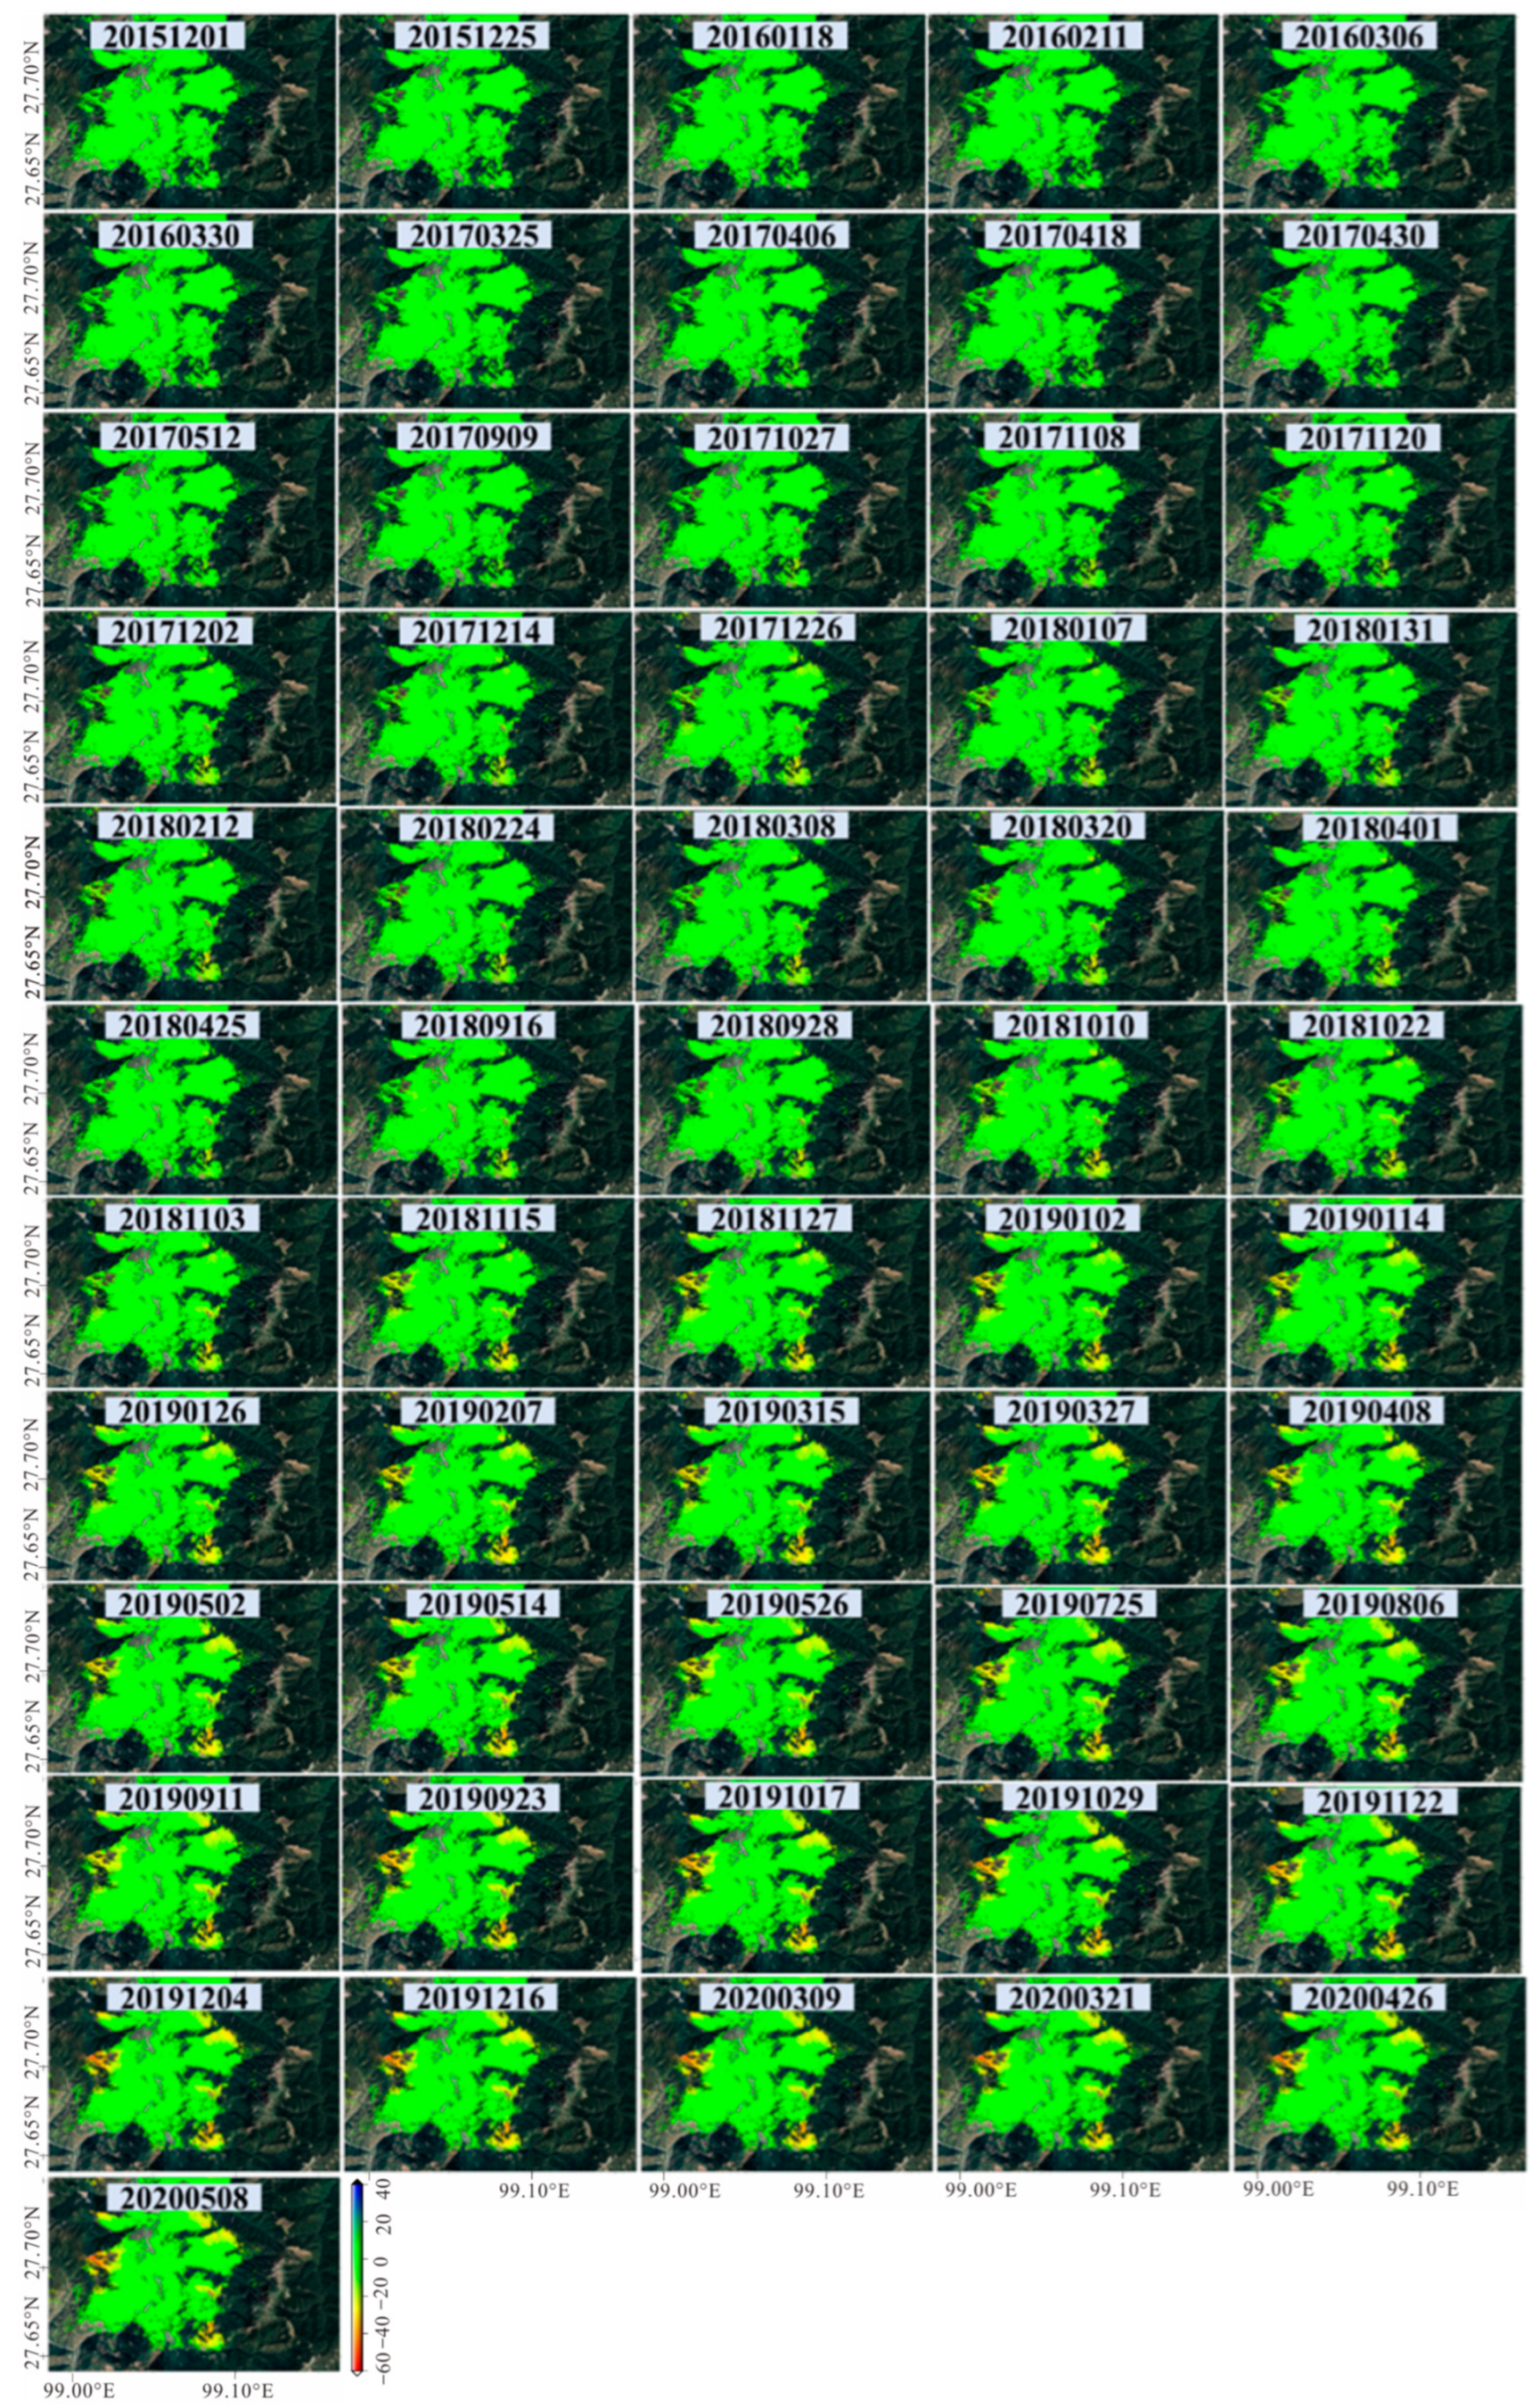
Figure 8.
Time series deformation characteristics during the Track 172 ascending data monitoring period in the study area (Unit: mm/a).
Figure 8.
Time series deformation characteristics during the Track 172 ascending data monitoring period in the study area (Unit: mm/a).
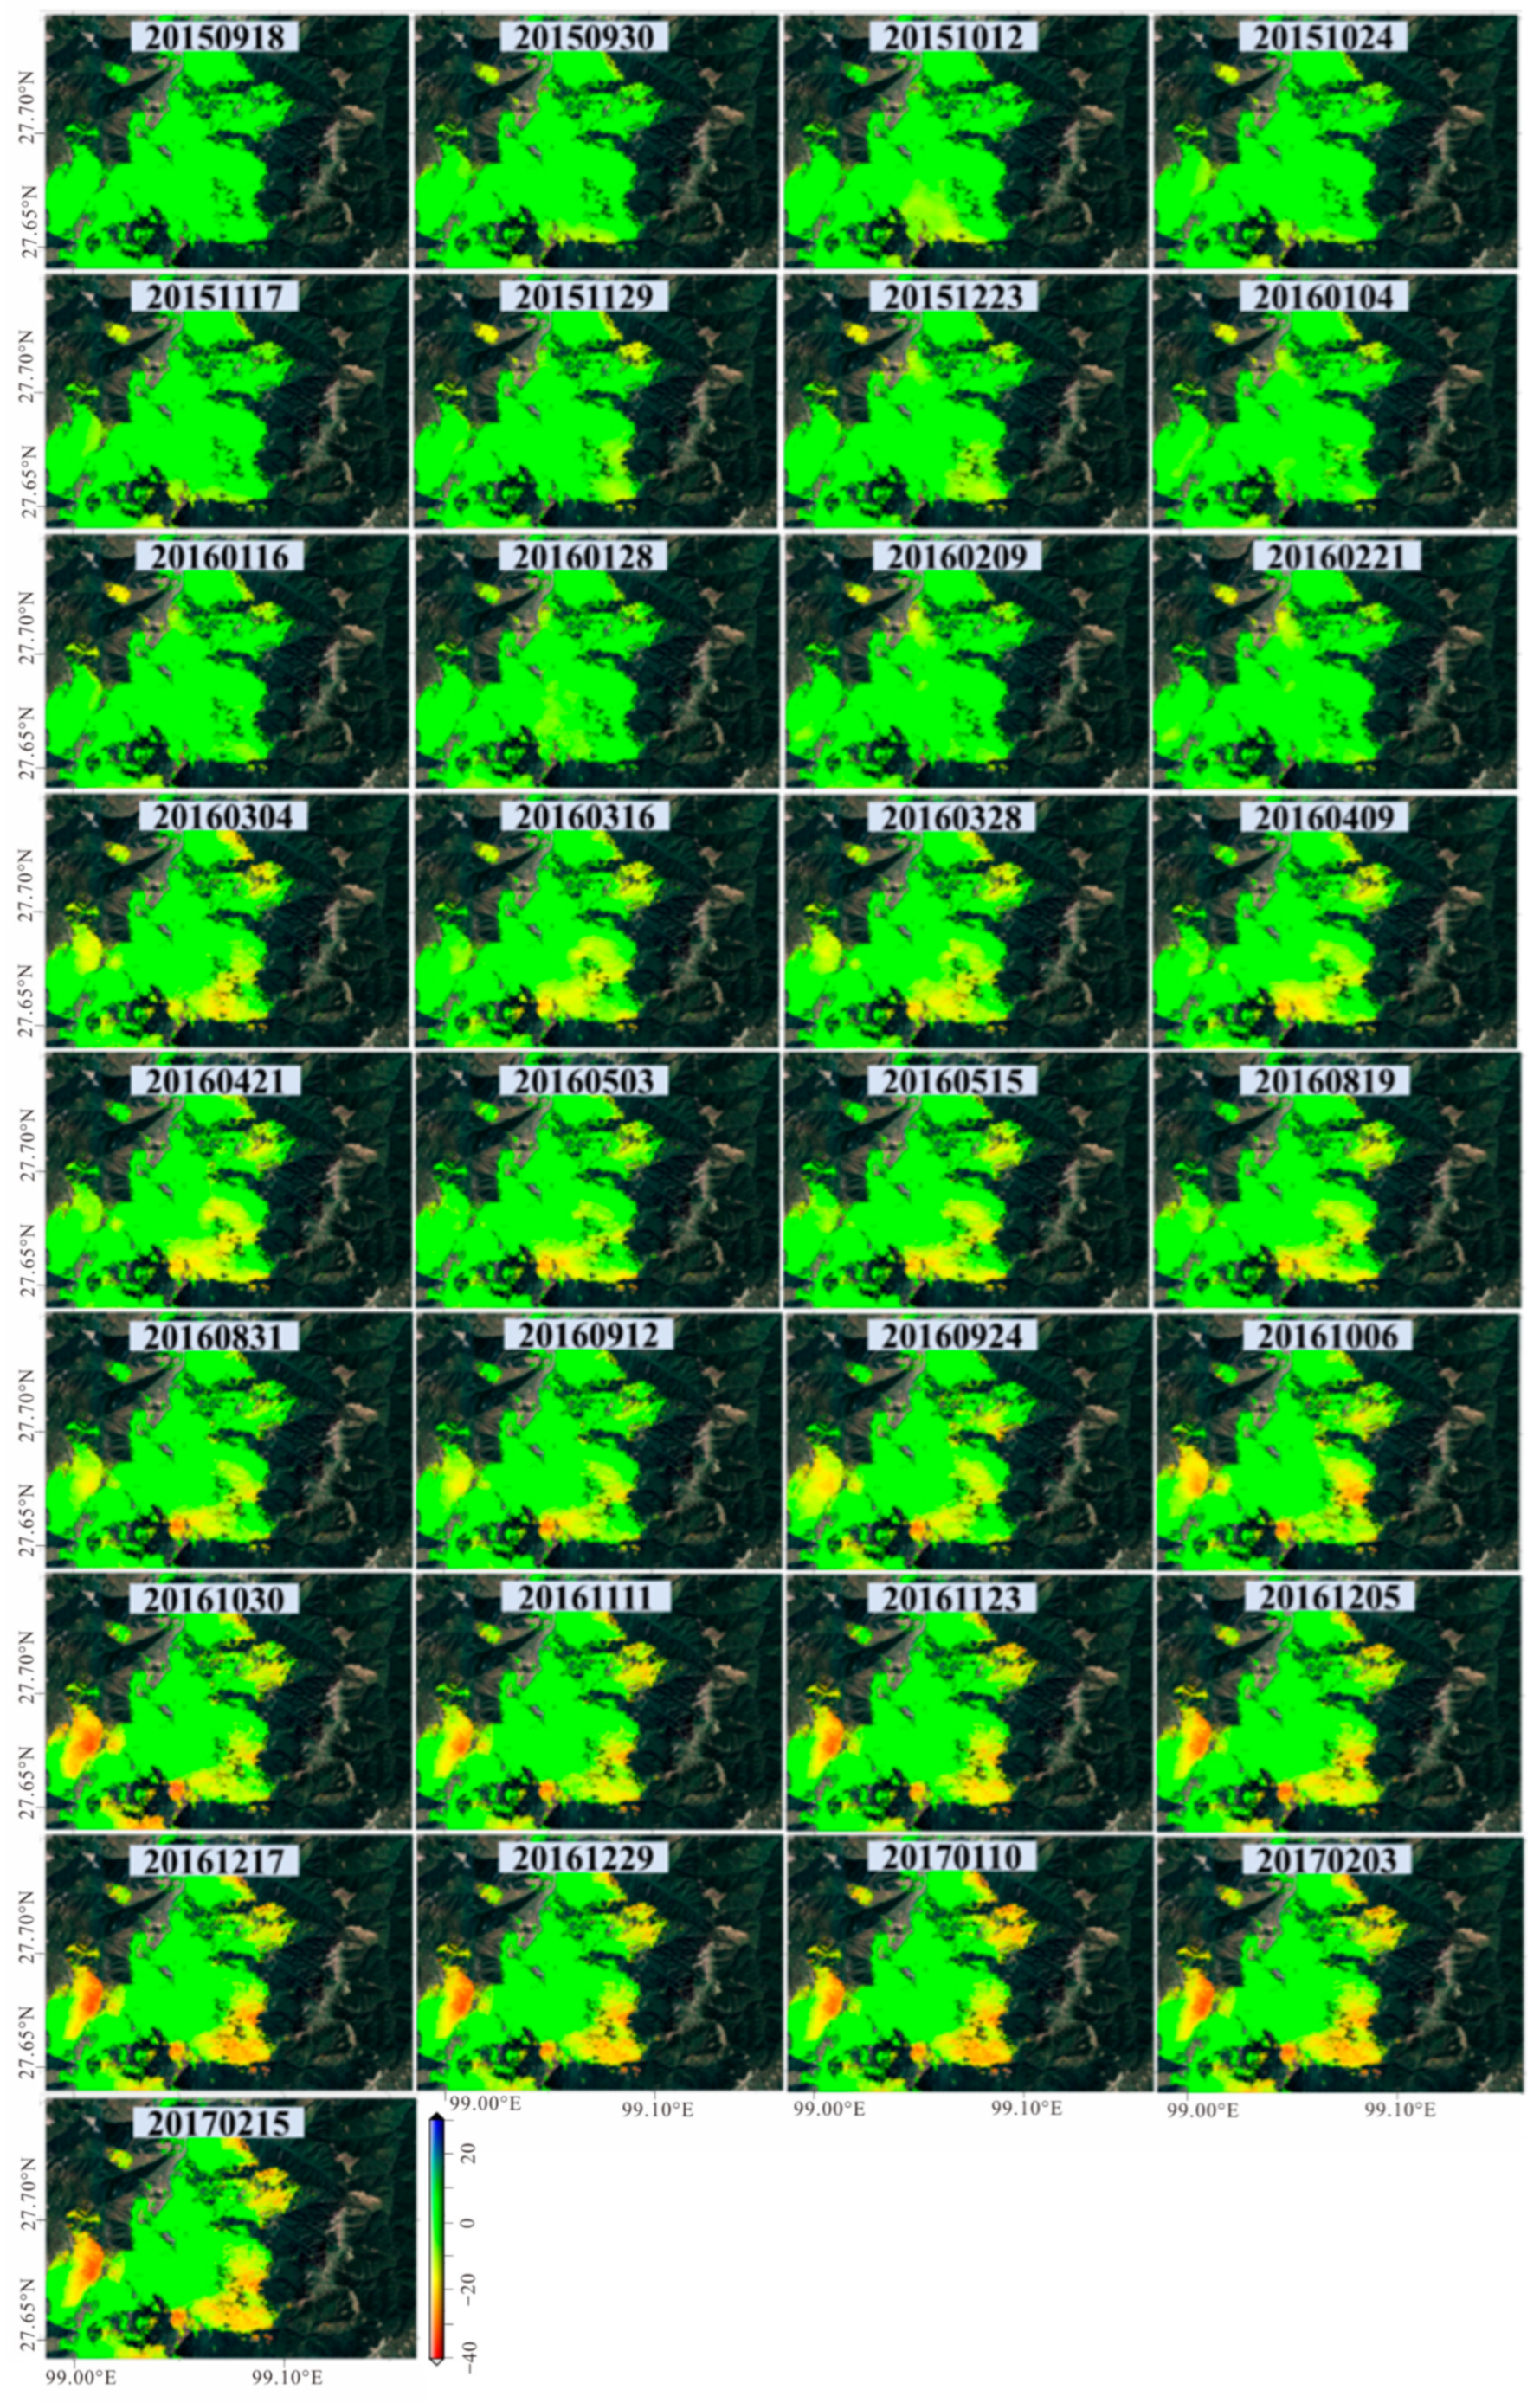
Figure 9.
Enlarged results of representative landslides. HP01–HP18 are landslide numbers illustrated in Figure 4. (A1–Q1) Google optical image, (A2–Q2) deformation rate of typical landslides, (A3–Q3) time series deformation characteristics of reference points (red star point).
Figure 9.
Enlarged results of representative landslides. HP01–HP18 are landslide numbers illustrated in Figure 4. (A1–Q1) Google optical image, (A2–Q2) deformation rate of typical landslides, (A3–Q3) time series deformation characteristics of reference points (red star point).


Figure 10.
(a) Relationship between elevation and spatial distribution of landslides, (b) relationship between slope and spatial distribution of landslides, (c) chart showing landslide distribution versus elevation and slope angle.
Figure 10.
(a) Relationship between elevation and spatial distribution of landslides, (b) relationship between slope and spatial distribution of landslides, (c) chart showing landslide distribution versus elevation and slope angle.
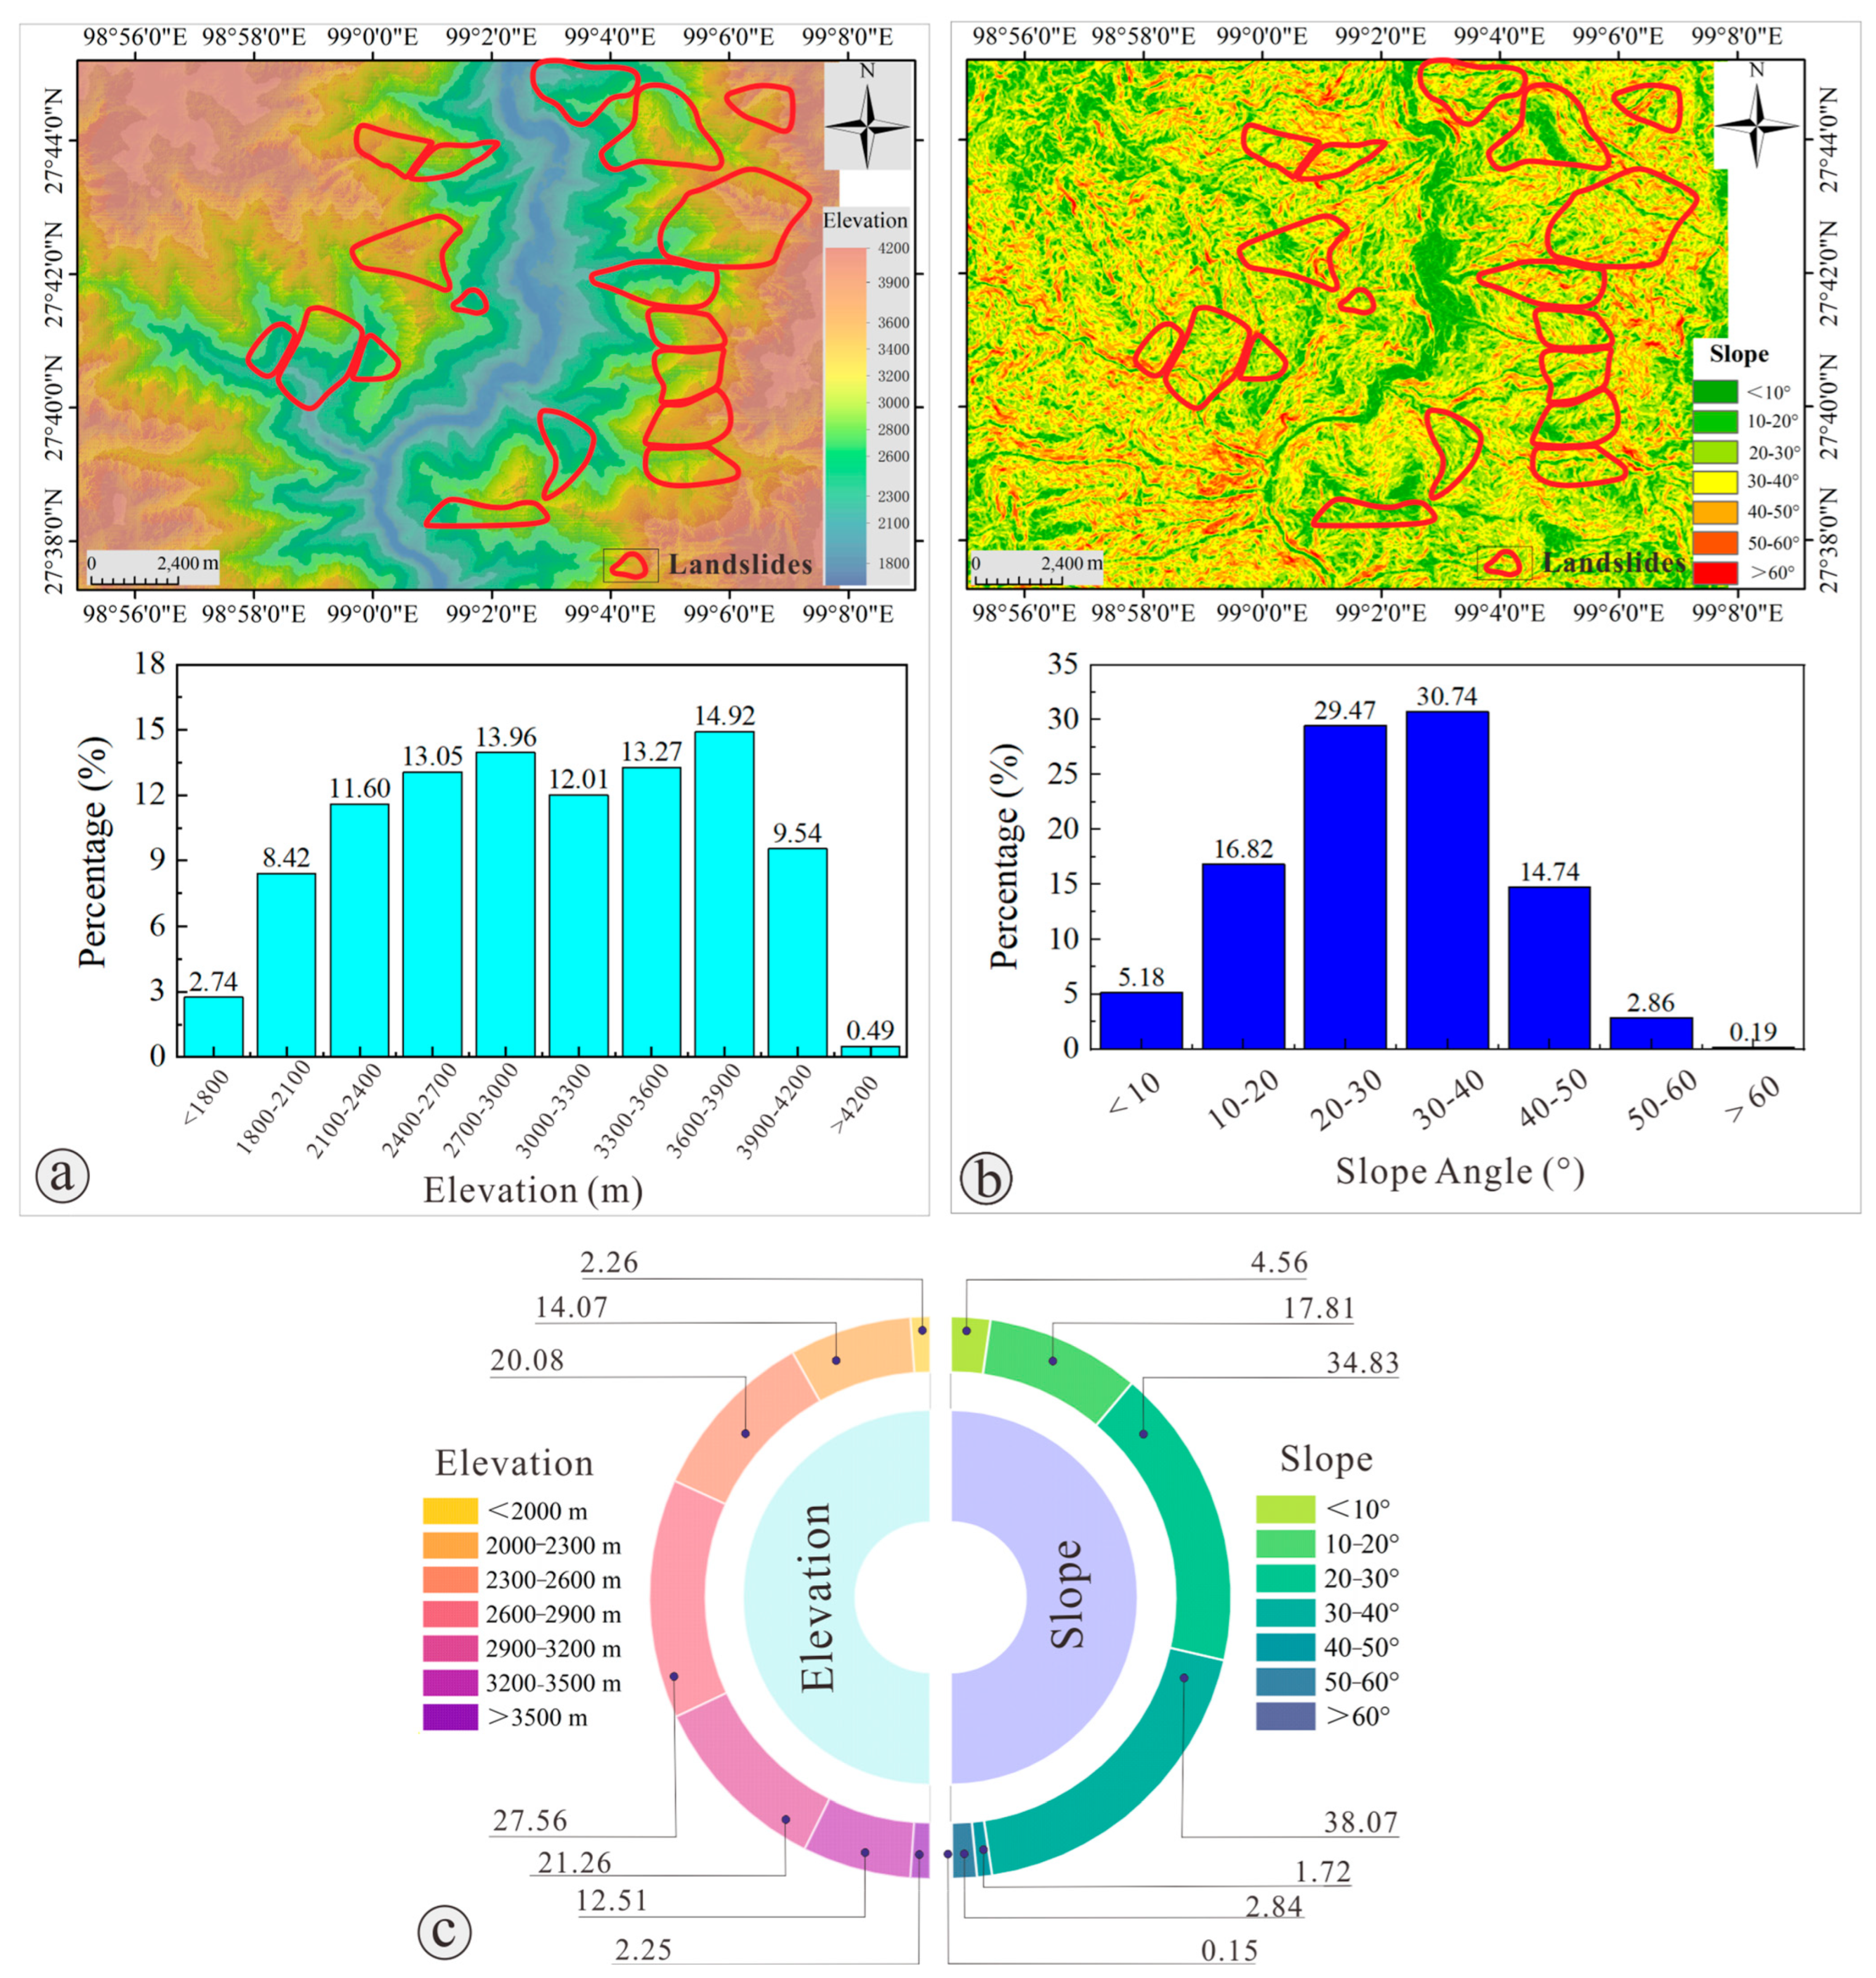
Figure 11.
Average time series displacements of landslides and the monthly precipitation of the study area between July 2015 and May 2020.
Figure 11.
Average time series displacements of landslides and the monthly precipitation of the study area between July 2015 and May 2020.

Table 1.
Parameters of the Sentinel-1 data used.
| Satellite Path | Orbit | Period | Azimuth Angle | Angle of Incidence | Number |
|---|---|---|---|---|---|
| 33 | descending | 7 October 2014 to 7 July 2020 | 10.5 | 39 | 121 |
| 99 | ascending | 9 June 2015 to 30 June 2020 | −10.7 | 33 | 113 |
| 172 | ascending | 29 October 2014 to 11 March 2017 | 9.8 | 43.8 | 56 |
Table 2.
Deformation results acquired from Sentinel-1A data in the study region.
| InSAR Annual Deformation Rate Map | Deformation Identification Results |
|---|---|
| Along ascending Track 99 | HP01, HP02, HP03, HP04, HP07, HP08, HP09, HP11, HP13, HP14, and HP17 |
| Along descending Track 33 | HP01, HP02, HP03, HP04, HP06, HP08, HP10, HP12, and HP13 |
| Along ascending Track 172 | HP01, HP02, HP03, HP04, HP05, HP06, HP09, HP15, HP16, and HP18 |
Disclaimer/Publisher’s Note: The statements, opinions and data contained in all publications are solely those of the individual author(s) and contributor(s) and not of MDPI and/or the editor(s). MDPI and/or the editor(s) disclaim responsibility for any injury to people or property resulting from any ideas, methods, instructions or products referred to in the content. |
© 2024 by the authors. Licensee MDPI, Basel, Switzerland. This article is an open access article distributed under the terms and conditions of the Creative Commons Attribution (CC BY) license (https://creativecommons.org/licenses/by/4.0/).
Share and Cite
MDPI and ACS Style
Lian, B.; Wang, D.; Wang, X.; Tan, W. Early Identification and Dynamic Stability Evaluation of High-Locality Landslides in Yezhi Site Area, China by the InSAR Method. Land 2024, 13, 569. https://doi.org/10.3390/land13050569
AMA Style
Lian B, Wang D, Wang X, Tan W. Early Identification and Dynamic Stability Evaluation of High-Locality Landslides in Yezhi Site Area, China by the InSAR Method. Land. 2024; 13(5):569. https://doi.org/10.3390/land13050569
Chicago/Turabian StyleLian, Baoqin, Daozheng Wang, Xingang Wang, and Weijia Tan. 2024. "Early Identification and Dynamic Stability Evaluation of High-Locality Landslides in Yezhi Site Area, China by the InSAR Method" Land 13, no. 5: 569. https://doi.org/10.3390/land13050569
Note that from the first issue of 2016, this journal uses article numbers instead of page numbers. See further details here.