The Impacts of Weather and Conservation Programs on Vegetation Dynamics in China’s Loess Plateau

Abstract
:1. Introduction

- (1)
- We employed satellite derived vegetation indices with a spatial resolution of 500 m to identify significant vegetation changes since 2000.
- (2)
- We examined monthly temperature and precipitation data to determine if significant weather changes were contributing to the observed vegetation increases.
- (3)
- We employed satellite derived land cover data and vegetation conservation data reported by statistical yearbooks to investigate if the observed vegetation increases can be attributed to land cover change caused by vegetation conservation activities.
- (4)
- We used anthropogenic biomes to evaluate how large-scale vegetation conservation programs choose target regions.
- (5)
- We investigated crop yield data to investigate the effects of vegetation conservation programs on croplands in areas with relatively shallow slopes.
2. Study Region
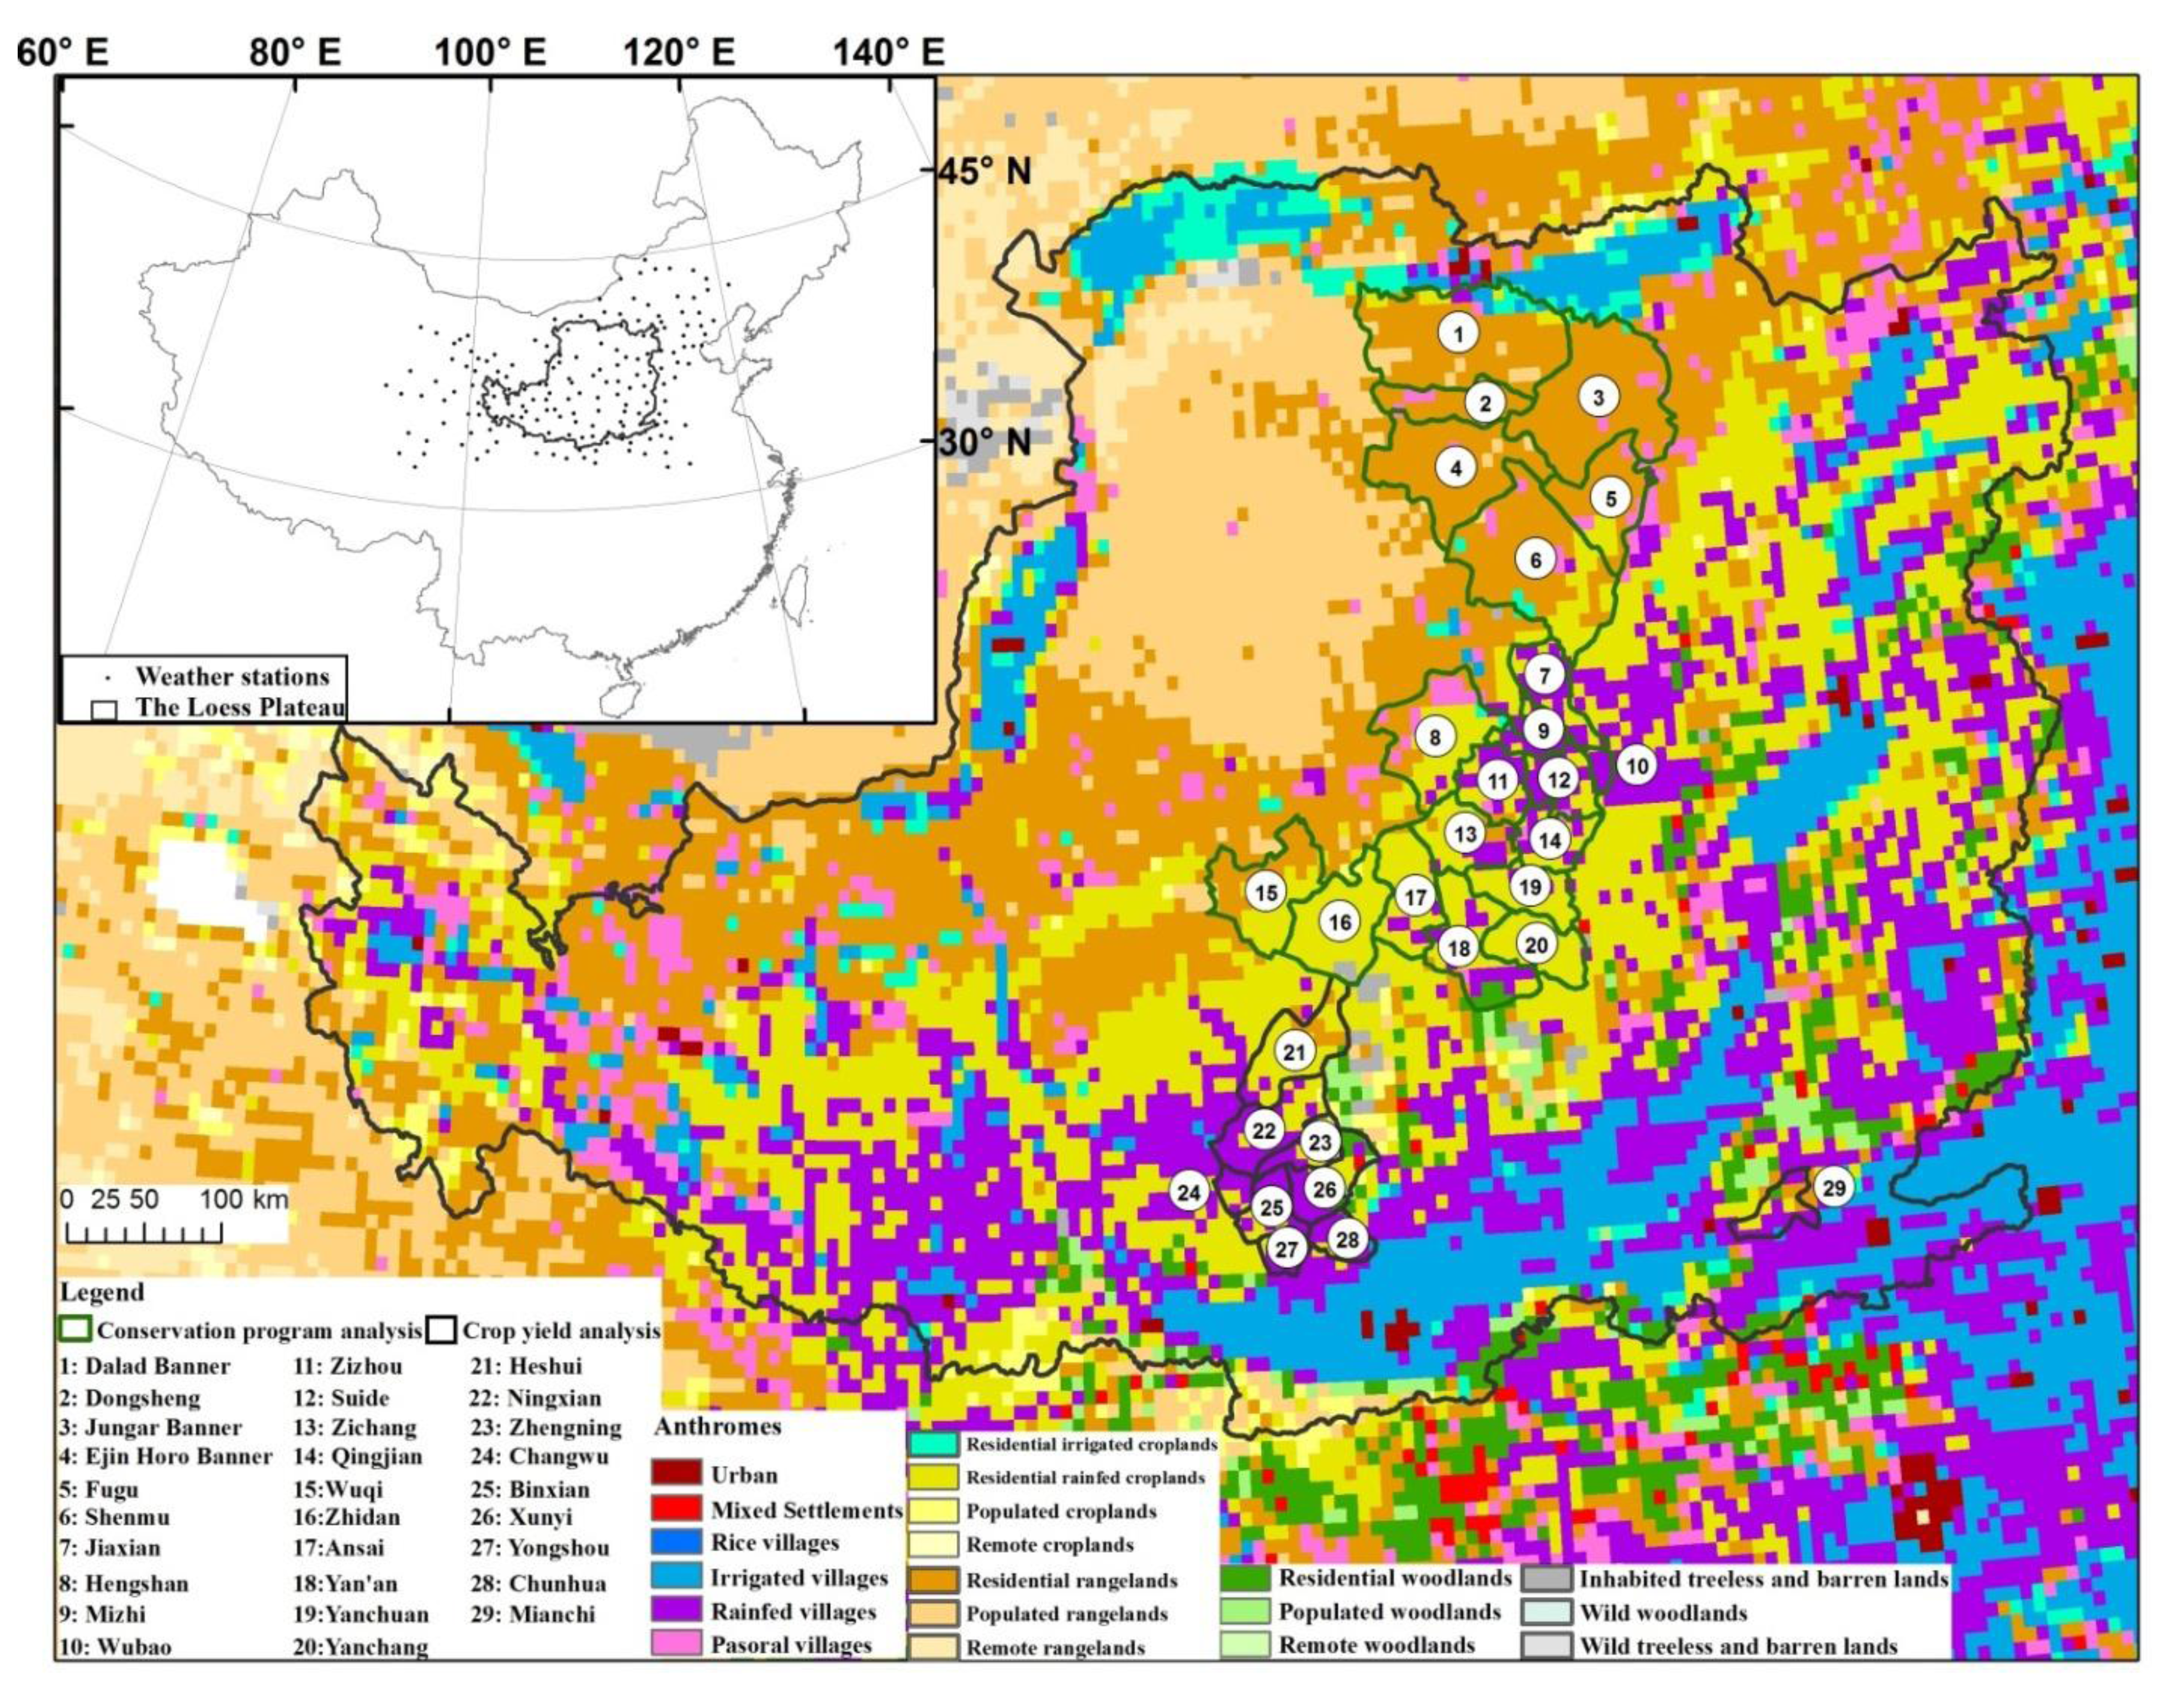
2.1. Loess Plateau
2.2. Study Regions for Conservation Program Analysis and Crop Yield Analysis
3. Data and Methods

| Dataset | Region | Spatial Resolution | Temporal Resolution and Time | Reference |
|---|---|---|---|---|
| MODIS Nadir BRDF-Adjusted Reflectance (MCD43A4) | Loess Plateau | 500 m | 16-day 2000–2009 | Schaaf et al. [19] |
| MODIS global 500 m land cover product (MCD12Q1) | Loess Plateau | 500 m | Annual 2003–2008 | Friedl et al. [20] |
| Temperature and Precipitation | Loess Plateau | Stations | Monthly 1999–2009 | Chinese National Meteorological Information Center [21] |
| Agricultural Productivity | Five counties in Xianyang (Shaanxi) and three counties in Qingyang (Gansu) and one county in Sanmenxia (Henan) | County | Annual 2000–2008 * | Regional statistical yearbooks [22, 23, 24] |
| ASTER Digital Elevation Map | Loess Plateau | 1 arc-second (~30 m) | 2011 | Tachikawa et al. [25] |
| Anthropogenic biomes | Loess Plateau | 0.083° | 2000 | Ellis et al. [15] |
| Vegetation Conservation Statistics | Seven counties in Yan’an (Shaanxi) and nine counties in Yulin (Shaanxi) and four counties in Ordos (Inner Mongolia) | County | 2000 to 2008 ** | Regional statistical yearbooks [26, 27, 28] |
3.1. Vegetation Changes Measured by MODIS Nadir BRDF-Adjusted Reflectance Data and NDVI Maximum Value Composites
3.2. Weather Data
3.3. Land Cover Data
3.4. Vegetation Conservation Data from Statistical Yearbooks
| Region | Artificial Planting | Aerial Seeding | Cropland Converted to Forest and Grassland | Mountain Closure | Dominant Anthromes |
|---|---|---|---|---|---|
| Ordos, Inner Mongolia | Available | Available | N/A | N/A | Residential and populated rangelands |
| Yulin, Shaanxi | Available | Available | Available | N/A | Residential rangelands |
| Yan’an, Shaanxi | Available | Available | Available | Available | Residential rainfed croplands |
3.5. Elevation and Slope
3.6. Crop Yield Data
4. Results and Discussion
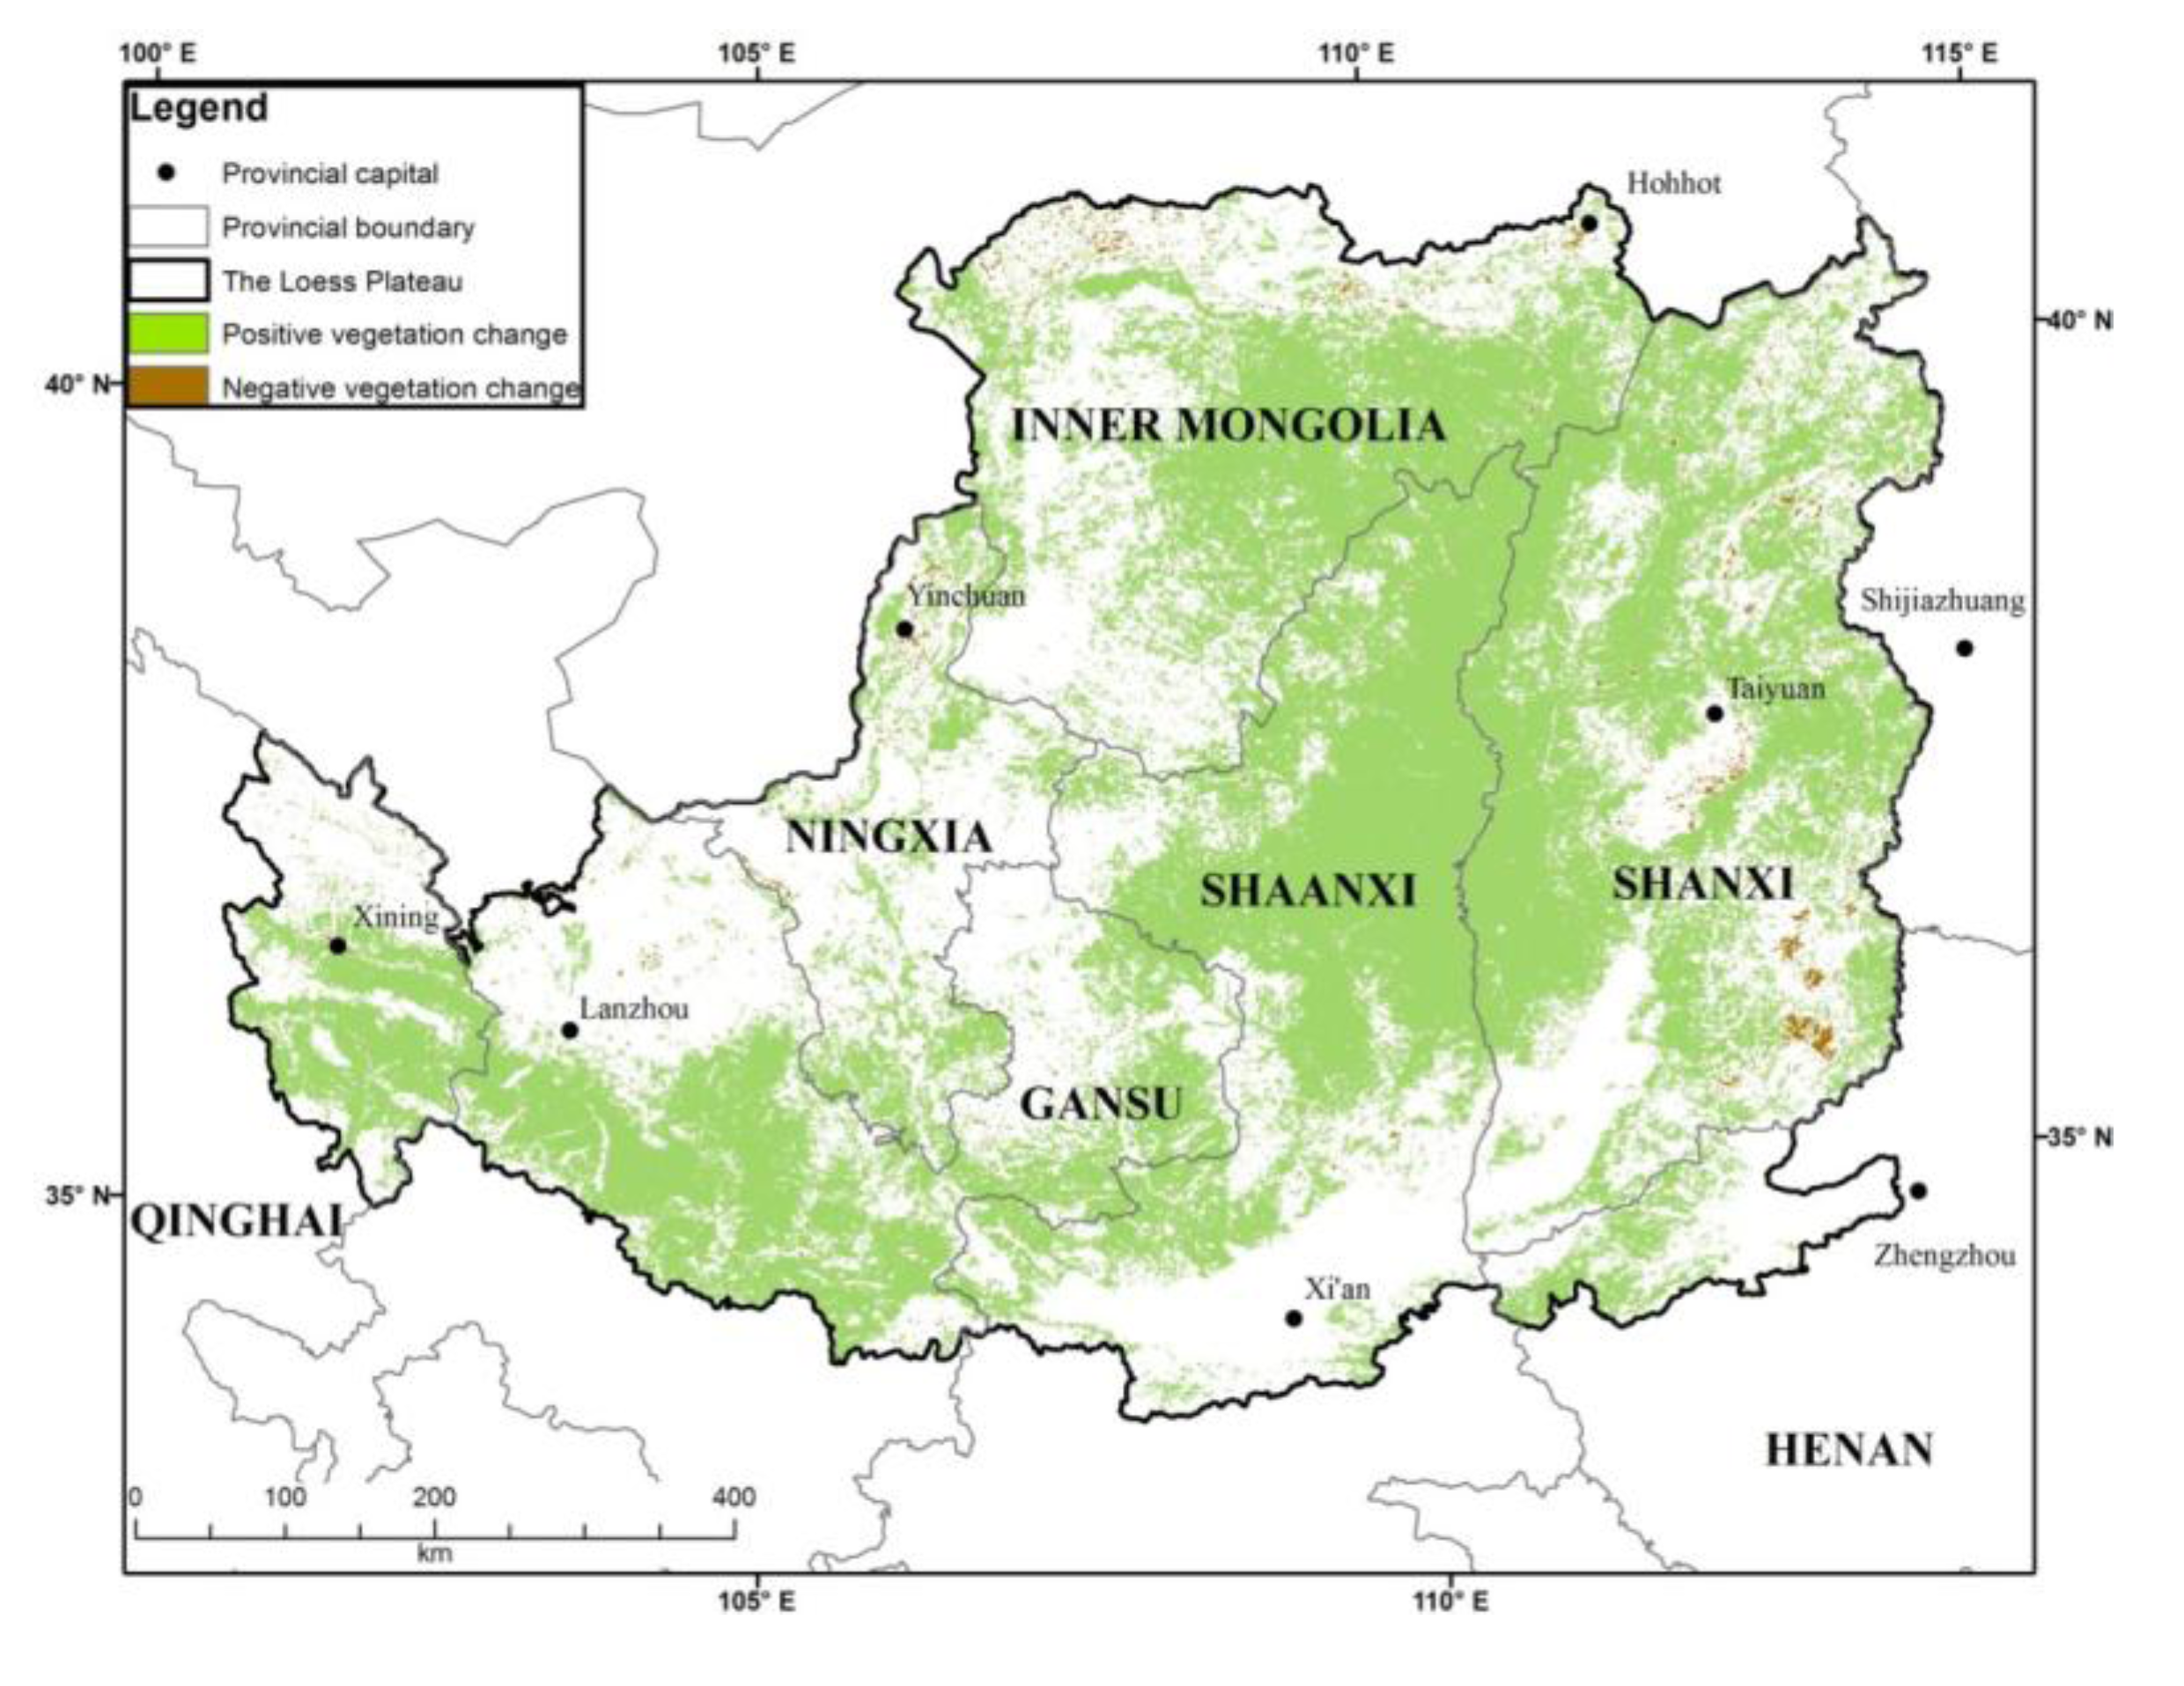
4.1. Vegetation Change since 2000

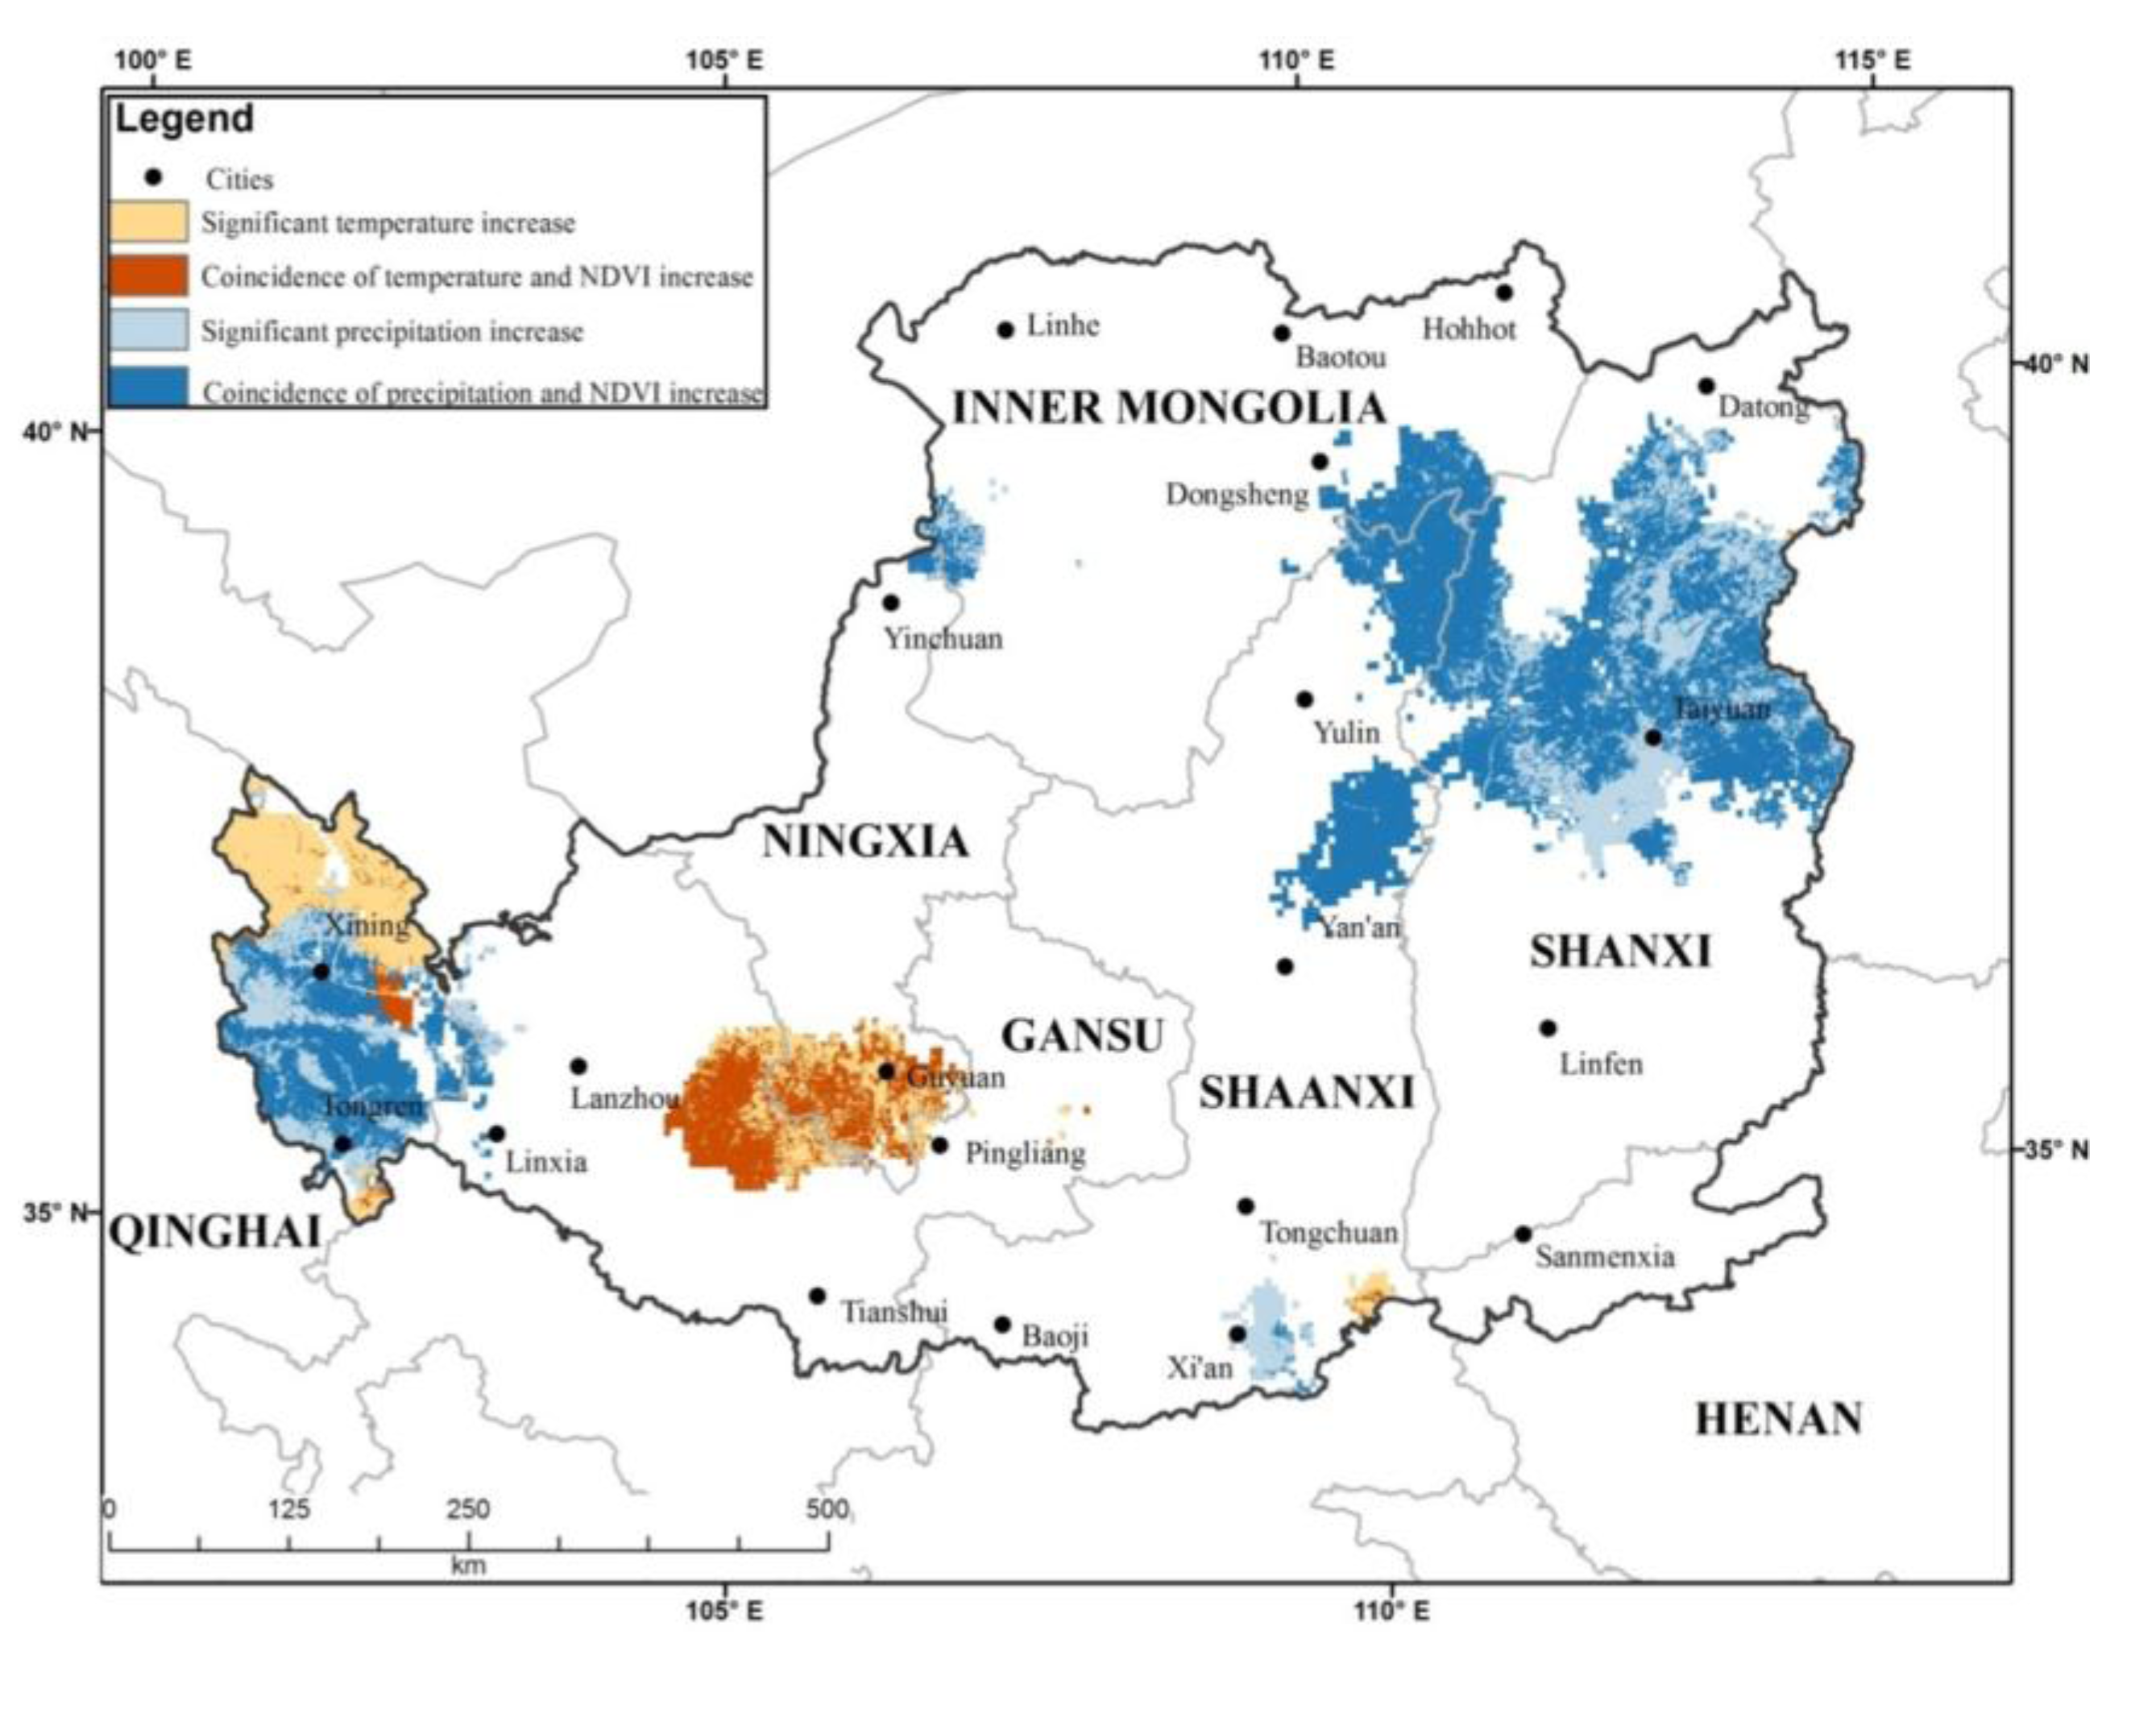
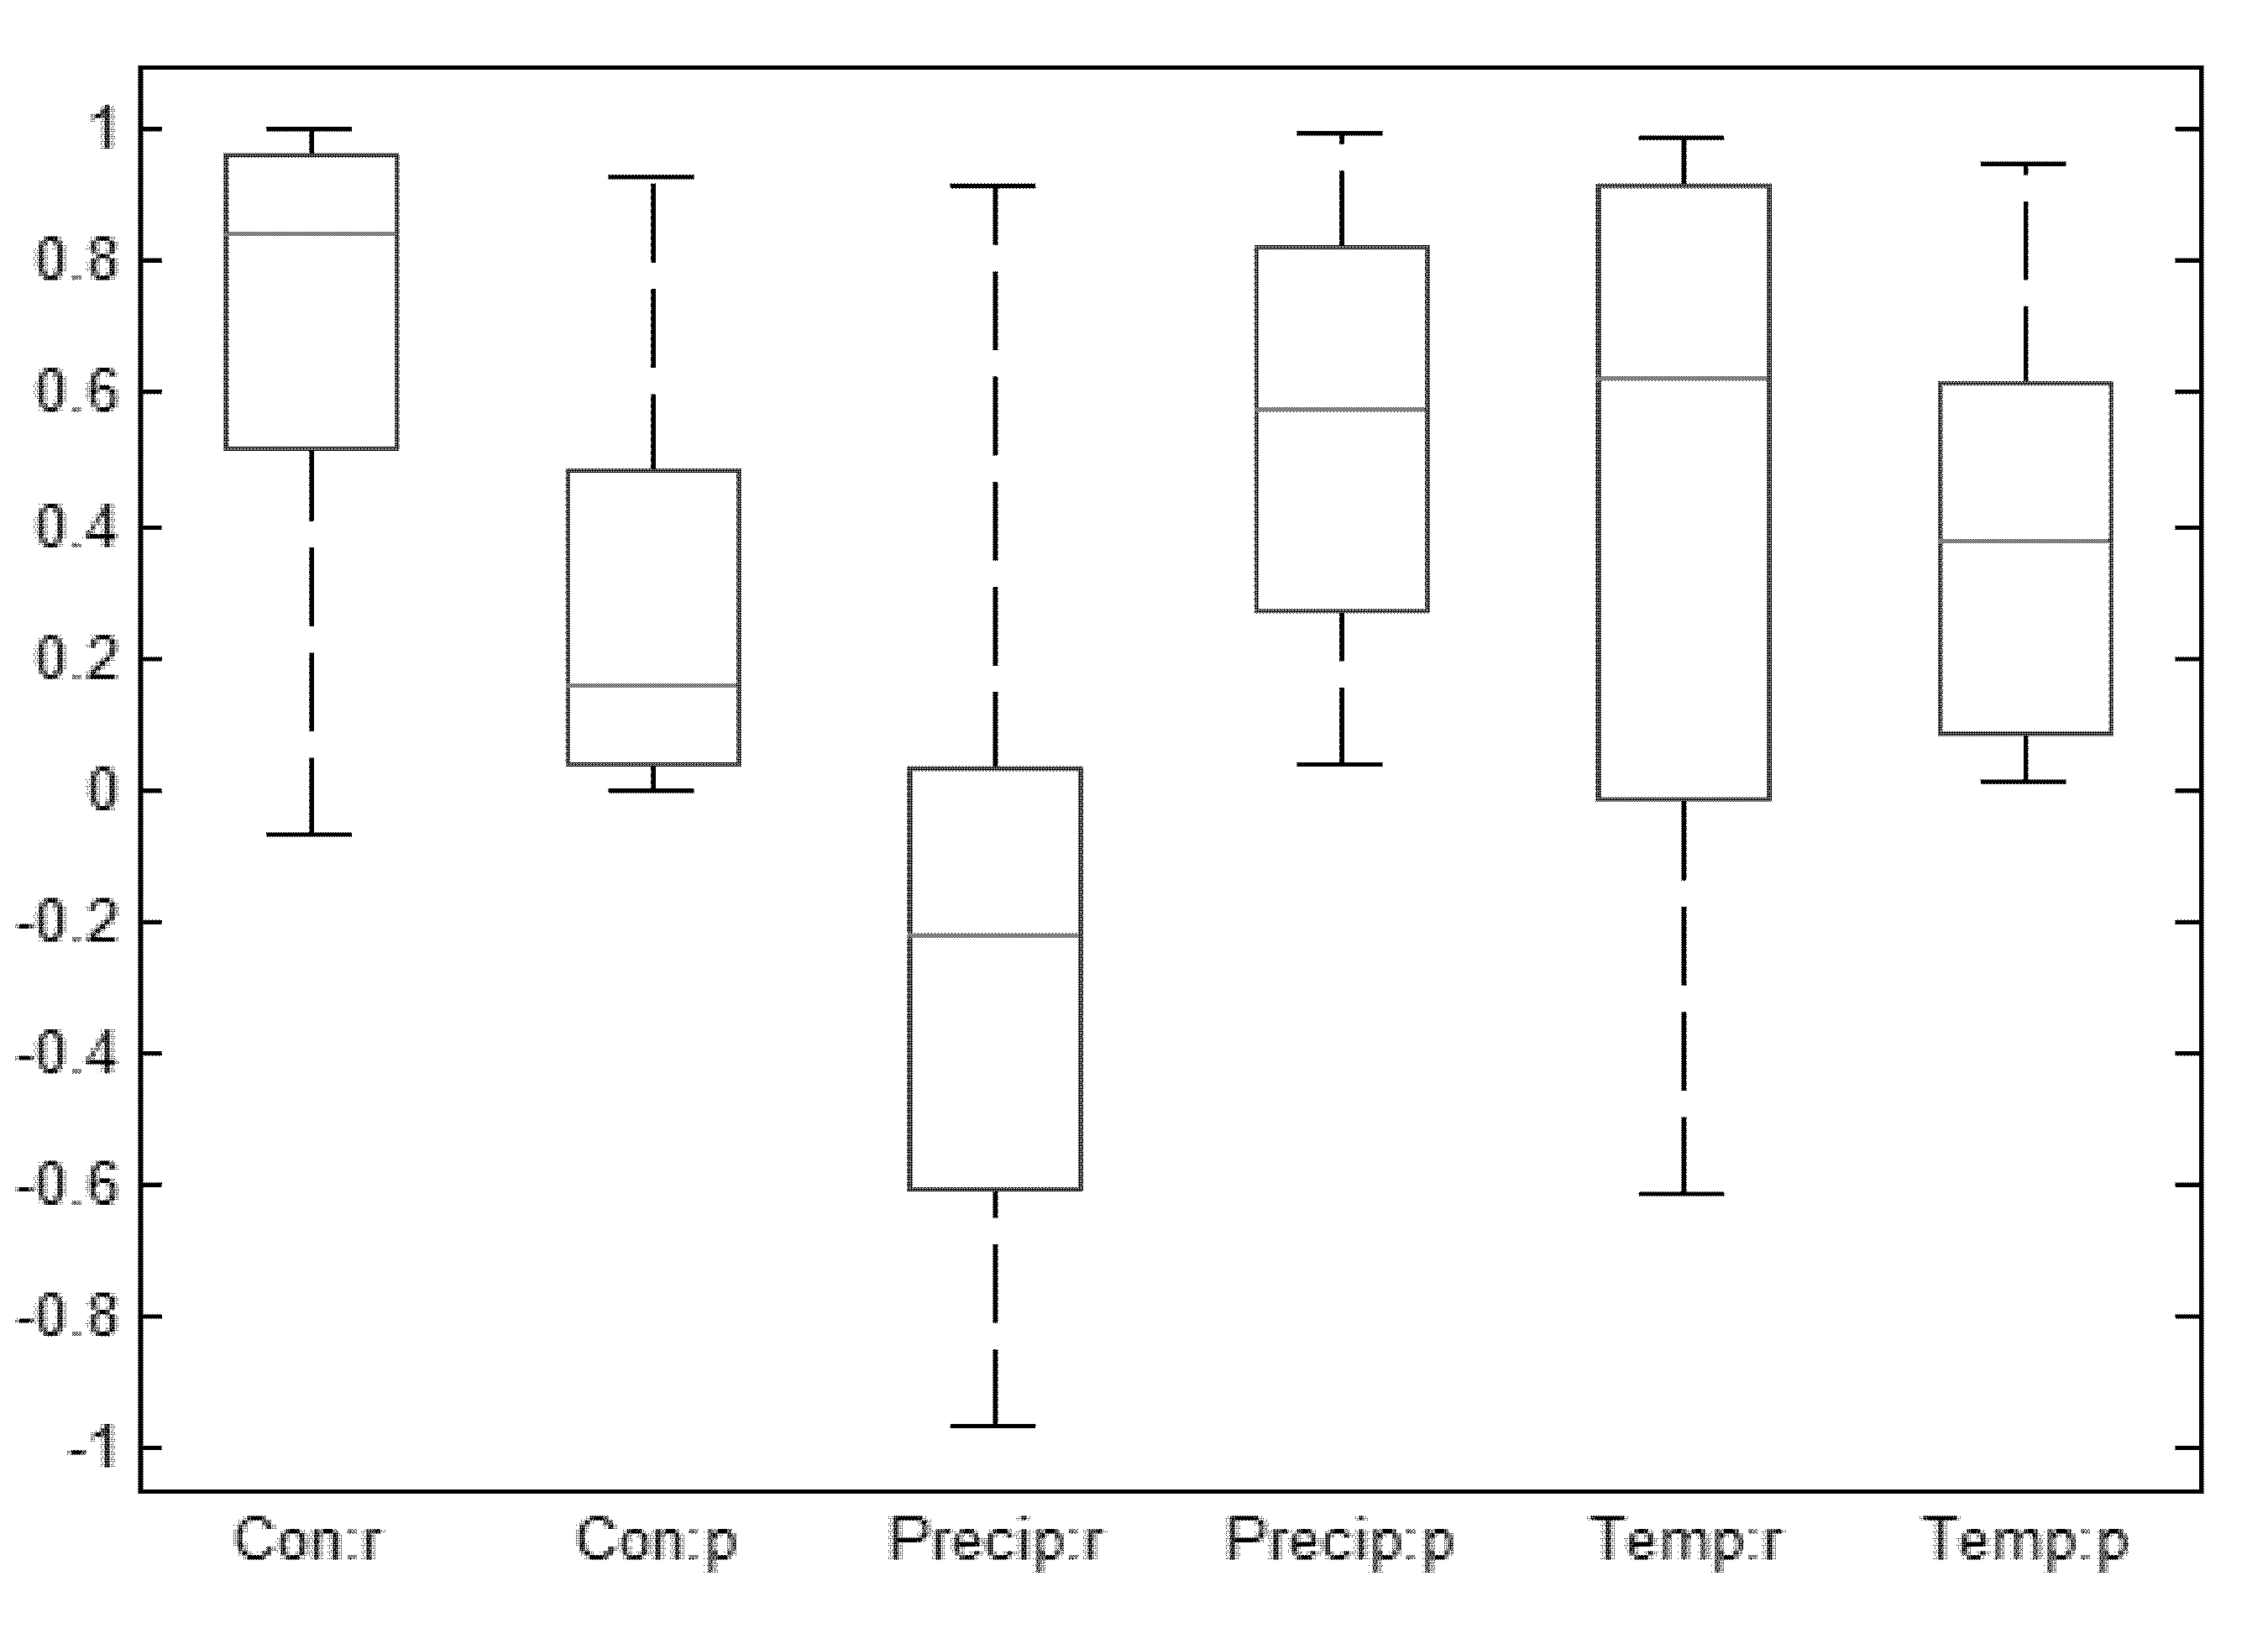
4.2. Impact of Weather Change on Vegetation Change in the Loess Plateau

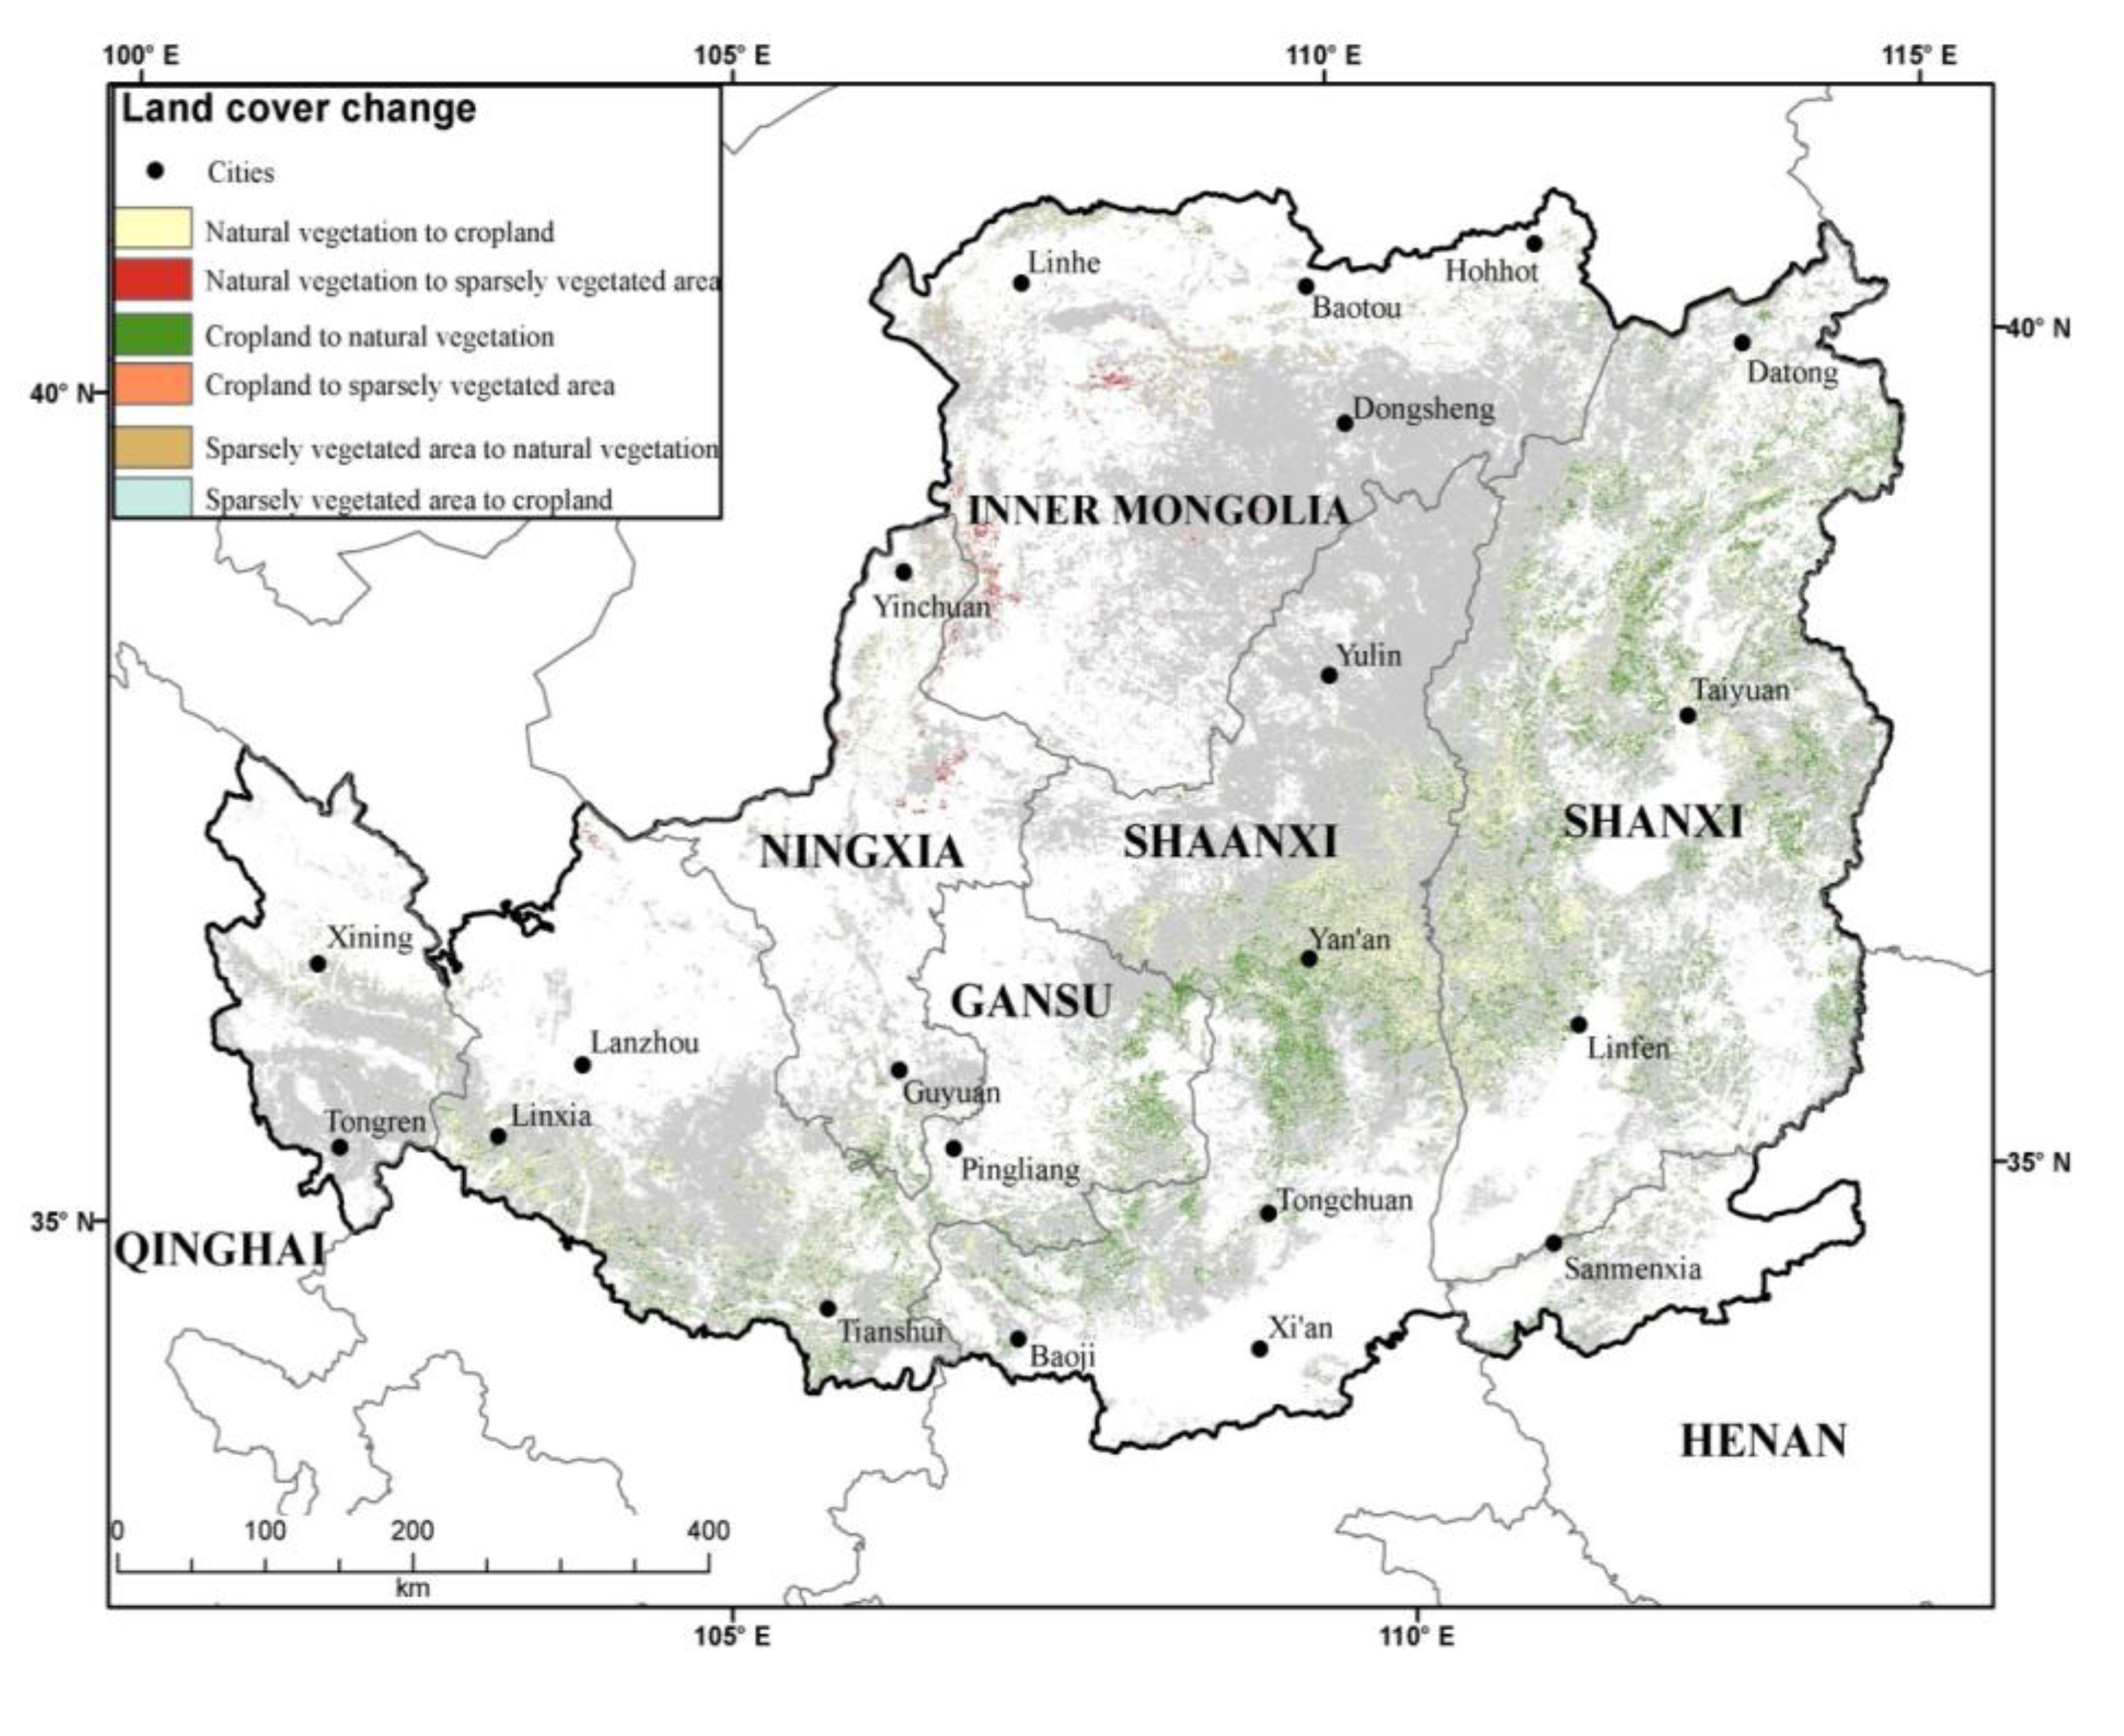
4.3. Land Cover Change Revealed by MODIS

| Natural Vegetation (km2) | Cropland (km2) | Barren or Sparsely Vegetated (km2) | |
|---|---|---|---|
| 2003–2005 | 2.09 × 10⁵ | 7.13 × 10⁴ | 6.40 × 10³ |
| 2006–2008 | 2.17 × 10⁵ | 6.38 × 10⁴ | 6.80 × 10³ |
| Change (%) | 4.13% | −10.62% | 6.22% |
| Anthromes | Land Cover Change according to MODIS Land Cover Data (%) 2003–2005 Compared to 2006–2008 | Population Density (persons/km2) | ||||
|---|---|---|---|---|---|---|
| Cropland to Natural Vegetation | Barren to Natural Vegetation | Unchanged Natural Vegetation | Unchanged Croplands | Unchanged Barren Area | ||
| Irrigated villages | 4.1 | 11.7 | 3.2 | 11.8 | 1.2 | ≥100 |
| Rainfed villages | 29.7 | N/A | 12.7 | 47.5 | N/A | ≥100 |
| Pastoral villages | 3.4 | N/A | 4.9 | 1.2 | N/A | ≥100 |
| Residential irrigated croplands | 1.7 | 5.9 | 1.5 | 1.4 | 2.4 | 10–100 |
| Residential rainfed croplands | 49.3 | 5.9 | 28.5 | 31.3 | N/A | 10–100 |
| Residential rangelands | 7.6 | 35.3 | 31.9 | 4.4 | 15.7 | 10–100 |
| Populated rangelands | N/A | 41.2 | 10.5 | N/A | 47.0 | 1–10 |
| Remote rangelands | N/A | N/A | N/A | N/A | 27.7 | 0–1 |
| All | 95.8 | 100 | 93.2 | 97.6 | 94 | |
4.4. Vegetation Conversion Reported in Statistical Yearbooks

4.5. The Effect of GTGP on Areas with Steep Slopes and Sparsely Vegetated Areas
| Land cover Change Type | Slope (°) | STD a | Elevation (m) | STD b |
|---|---|---|---|---|
| Cropland to Natural Vegetation | 14.3 † | 8.7 | 1,348.4 * | 408.7 |
| Unchanged Cropland | 10.9 ‡ | 8.3 | 1,101.1 * | 380.8 |
| Sparsely Vegetated to Natural Vegetation | 3.5 * | 3.9 | 1,231.7 * | 189.2 |
| Unchanged Sparely Vegetated | 3.6 * | 3.9 | 1,202.2 * | 174.4 |
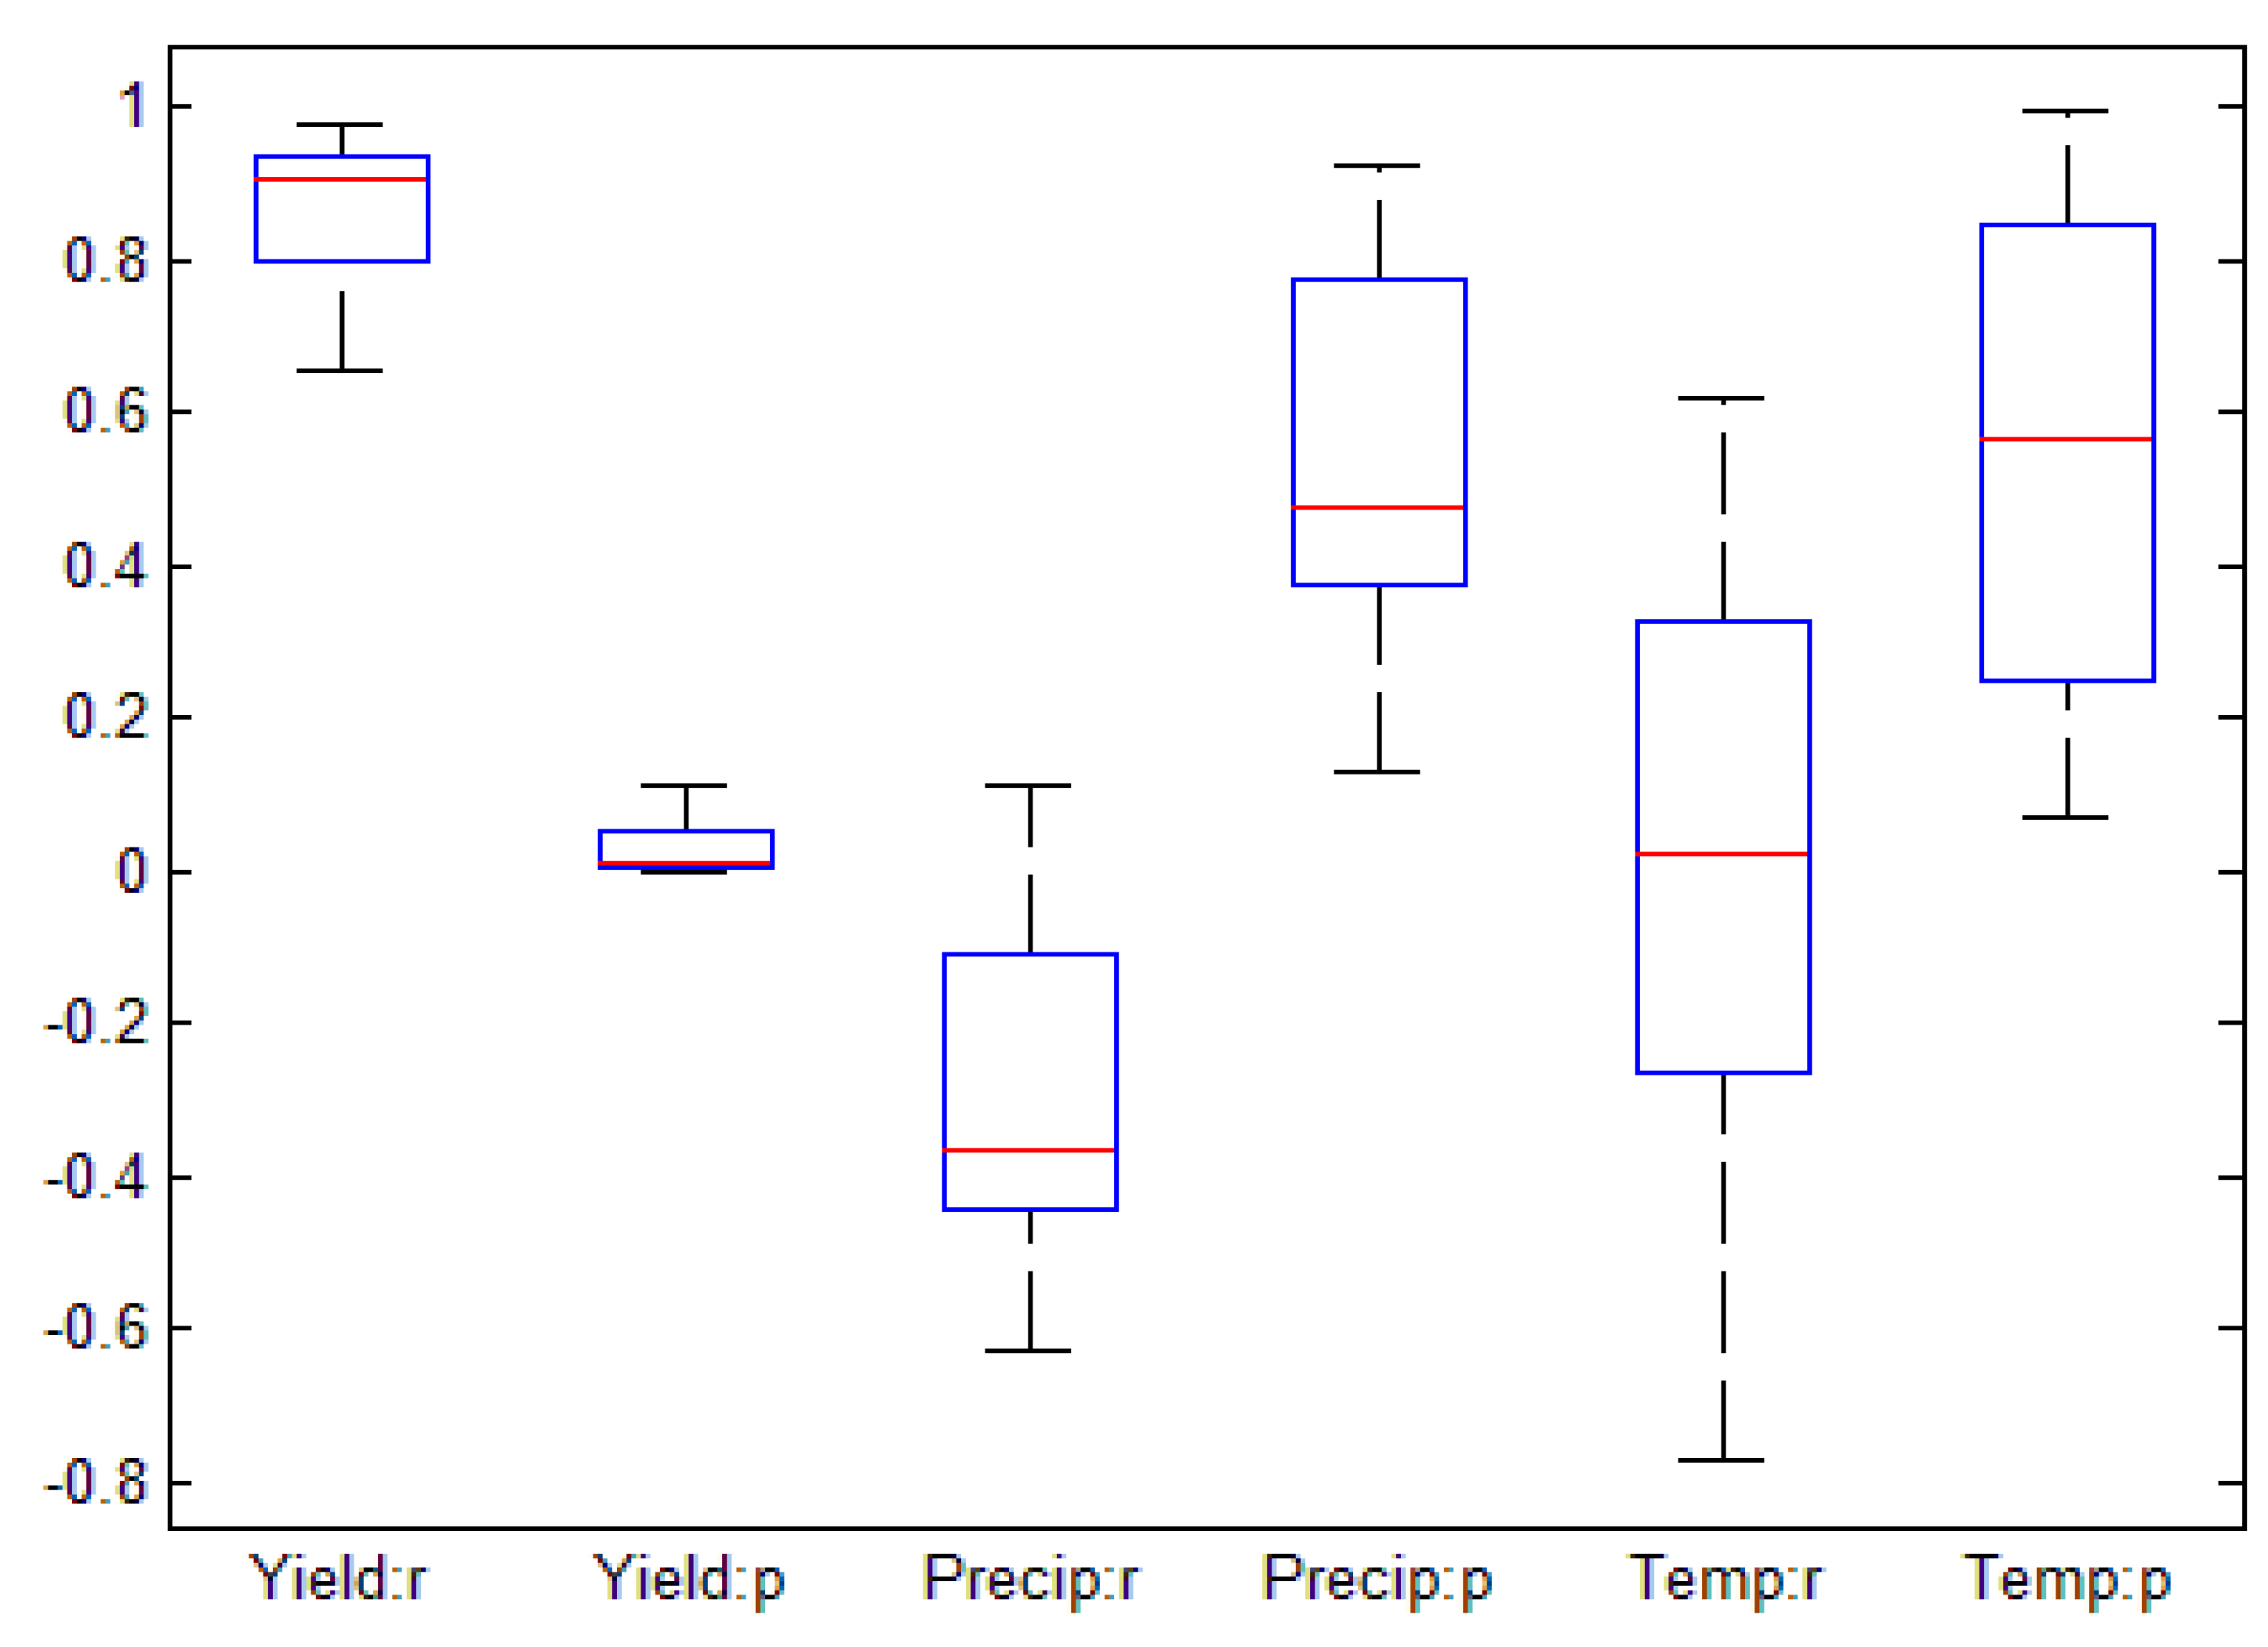
4.6. The Effect of Conservation Programs on Unchanged Croplands

5. Conclusion
| Potential Causes of Vegetation Change | Change Attribution |
|---|---|
| Significant increase in precipitation | 19.8%–22.2% |
| Significant increase in temperature | 3.4%–3.8% |
| Land cover change caused by GTGP or NFCP shown by MODIS | 3.6%–7.6% |
| GTGP and NFCP activities combined with changes in annual precipitation and mean annual temperature | 1.7% |
| GTGP and NFCP activities combined with changes in mean annual temperature | 1.8% |
| GTGP and NFCP activities combined with significant increase in precipitation | 2.3% |
| Crop yield increases | 2.1% |
| Total percentage of vegetation change area explained: | 34.7%–37.5% * |
Acknowledgments
Conflicts of Interest
References
- Mather, A.S.; Needle, C.L. The forest transition: A theoretical basis. Area 1998, 30, 117–124. [Google Scholar] [CrossRef]
- Kauppi, P.E.; Ausubel, J.H.; Fang, J.; Mather, A.S.; Sedjo, R.A.; Waggoner, P.E. Returning forests analyzed with the forest identity. Proc. Natl. Acad. Sci. USA 2006, 103, 17574–17579. [Google Scholar]
- Rudel, T.K.; Coomes, O.T.; Moran, E.; Achard, F.; Angelsen, A.; Xu, J.; Lambin, E.F. Forest transitions: Towards a global understanding of land use change. Glob. Environ. Chang. 2005, 15, 23–31. [Google Scholar] [CrossRef]
- Mather, A.S. Recent asian forest transitions in relation to forest-transition theory. Int. For. Rev. 2007, 9, 491–502. [Google Scholar]
- Liu, J.G.; Diamond, J. China’s environment in a globalizing world. Nature 2005, 435, 1179–1186. [Google Scholar] [CrossRef]
- Qu, G. Environmental Protection Knowledge; (in Chinese). China’s Red Flag Publishing House: Beijing, China, 1999. [Google Scholar]
- Uchida, E.; Xu, J.T.; Rozelle, S. Grain for green: Cost-effectiveness and sustainability of China’s conservation set-aside program. Land Econ. 2005, 81, 247–264. [Google Scholar]
- Liu, J.; Li, S.; Ouyang, Z.; Tam, C.; Chen, X. Ecological and socioeconomic effects of China’s policies for ecosystem services. Proc. Natl. Acad. Sci. USA 2008, 105, 9477–9482. [Google Scholar] [CrossRef]
- Zhang, P.; Shao, G.; Zhao, G.; Le Master, D.C.; Parker, G.R.; Dunning, J.B.; Li, Q. China’s forest policy for the 21st Century. Science 2000, 288, 2135–2136. [Google Scholar] [CrossRef]
- Zheng, M.; Qin, F.; Yang, J.; Cai, Q. The spatio-temporal invariability of sediment concentration and the flow—Sediment relationship for hilly areas of the Chinese Loess Plateau. Catena 2013, 109, 164–176. [Google Scholar] [CrossRef]
- Schnitzer, S.; Seitz, F.; Eicker, A.; Güntner, A.; Wattenbach, M.; Menzel, A. Estimation of soil loss by water erosion in the Chinese Loess Plateau using Universal Soil Loss Equation and GRACE. Geophys. J. Int. 2013, 193, 1283–1290. [Google Scholar] [CrossRef]
- Cao, S.; Chen, L.; Yu, X. Impact of China’s Grain for Green Project on the landscape of vulnerable arid and semi-arid agricultural regions: A case study in northern Shaanxi Province. J. Appl. Ecol. 2009, 46, 536–543. [Google Scholar] [CrossRef]
- Zhou, H.; Van Rompaey, A.; Wang, J. Detecting the impact of the “grain for green” program on the mean annual vegetation cover in the Shaanxi Province, China using SPOT-VGT NDVI data. Land Use Policy 2009, 26, 954–960. [Google Scholar] [CrossRef]
- Qi, Y.; Chang, Q.; Jia, K.; Liu, M.; Liu, J.; Chen, T. Temporal-spatial variability of desertification in an agro-pastoral transitional zone of northern Shaanxi Province, China. Catena 2012, 88, 37–45. [Google Scholar] [CrossRef]
- Ellis, E.C.; Klein Goldewijk, K.; Siebert, S.; Lightman, D.; Ramankutty, N. Anthropogenic transformation of the biomes, 1700 to 2000. Glob. Ecol. Biogeogr. 2010, 19, 589–606. [Google Scholar]
- Chen, L.; Wei, W.; Fu, B.; Lu, Y. Soil and water conservation on the Loess Plateau in China: Review and perspective. Prog. Phys. Geogr. 2007, 31, 389–403. [Google Scholar] [CrossRef]
- Wei, J.; Zhou, J.; Tian, J.; He, X.; Tang, K. Decoupling soil erosion and human activities on the Chinese Loess Plateau in the 20th Century. Catena 2006, 68, 10–15. [Google Scholar] [CrossRef]
- He, X.B.; Zhou, J.; Zhang, X.B.; Tang, K.L. Soil erosion response to climatic change and human activity during the Quaternary on the Loess Plateau, China. Reg. Environ. Chang. 2006, 6, 62–70. [Google Scholar] [CrossRef]
- Schaaf, C.B.; Gao, F.; Strahler, A.H.; Lucht, W.; Li, X.W.; Tsang, T.; Strugnell, N.C.; Zhang, X.Y.; Jin, Y.F.; Muller, J.P.; et al. First operational BRDF, albedo nadir reflectance products from MODIS. Remote Sens. Environ. 2002, 83, 135–148. [Google Scholar] [CrossRef]
- Friedl, M.A.; Sulla-Menashe, D.; Tan, B.; Schneider, A.; Ramankutty, N.; Sibley, A.; Huang, X.M. MODIS Collection 5 global land cover: Algorithm refinements and characterization of new datasets. Remote Sens. Environ. 2010, 114, 168–182. [Google Scholar] [CrossRef]
- Chinese National Meteorological Information Center, Monthly Surface Meteorological Dataset of China; China Meteorological Data Sharing Service System: Beijing, China, 2008.
- Statistic Bureau of Xianyang, Statistical Yearbook of Xianyang; (in Chinese). China Statistics Press: Beijing, China, 2008.
- Statistic Bureau of Qingyang, Statistical Yearbook of Qingyang; (in Chinese). China Statistics Press: Beijing, China, 2008.
- Statistic Bureau of Sanmenxia, Statistical Yearbook of Sanmenxia; (in Chinese). China Statistics Press: Beijing, China, 2008.
- Tachikawa, T.; Hato, M.; Kaku, M.; Iwasaki, A. Characteristics of ASTER GDEM Version 2. In Proceedings of 2011 IEEE International Geoscience and Remote Sensing Symposium (IGARSS), Vancouver, Canada, 24–29 July 2011; pp. 3657–3660.
- Statistic Bureau of Yan’an, Statistical Yearbook of Yan’an; (in Chinese). China Statistics Press: Beijing, China, 2008.
- Statistic Bureau of Yulin, Statistical Yearbook of Yulin; (in Chinese). China Statistics Press: Beijing, China, 2007.
- Statistic Bureau of Ordos, Statistical Yearbook of Ordos (In Chinese); China Statistics Press: Beijing, China, 2007.
- de Beurs, K.M.; Henebry, G.M. Trend analysis of the Pathfinder AVHRR Land (PAL) NDVI data for the deserts of Central Asia. IEEE Geosci. Remote Sens. Lett. 2004, 1, 282–286. [Google Scholar] [CrossRef]
- Ellis, E.C.; Ramankutty, N. Putting people in the map: Anthropogenic biomes of the world. Front. Ecol. Environ. 2008, 6, 439–447. [Google Scholar] [CrossRef]
- Gale, F. China’s statistics: Are they reliable? USDA ERS Agric. Inf. Bull. 2002, 775, 50–53. [Google Scholar]
- Hansen, J.; Fuller, F.H.; Hsu, H. Sources of Discontinuity and Uncertainty in Chinese Agricultural Data. In Staff General Research Papers; Department of Economics, Iowa State University: Ames, IA, USA, 2003. [Google Scholar]
- Chow, G. Are Chinese official statistics reliable? CESifo Econ. Stud. 2006, 52, 19. [Google Scholar] [CrossRef]
- Xu, Z.G.; Xu, J.T.; Deng, X.Z.; Huang, J.K.; Uchida, E.; Rozelle, S. Grain for green versus grain: Conflict between food security and conservation set-aside in China. World Dev. 2006, 34, 130–148. [Google Scholar] [CrossRef]
- Feng, Z.M.; Yang, Y.Z.; Zhang, Y.Q.; Zhang, P.T.; Li, Y.Q. Grain-for-green policy and its impacts on grain supply in west China. Land Use Policy 2005, 22, 301–312. [Google Scholar] [CrossRef]
- de Beurs, K.M.; Yan, D.; Karnieli, A. The Effect of Large Scale Conservation Programs on the Vegetative Development of China’s Loess Plateau. In Dryland East Asia: Land Dynamics Amid Social and Climate Change; Chen, J., Wan, S., Henebry, G., Qi, J., Gutman, G., Sun, G., Kappas, M., Eds.; De Gruyter: Berlin, Germany, 2013. [Google Scholar]
- Kelly, P.; Huo, X. Do farmers or governments make better land conservation choices? Evidence from China’s Sloping Land Conversion Program. J. For. Econ. 2013, 19, 32–60. [Google Scholar]
- Zhou, D.; Zhao, S.; Zhu, C. The Grain for Green Project induced land cover change in the Loess Plateau: A case study with Ansai County, Shanxi Province, China. Ecol. Indic. 2012, 23, 88–94. [Google Scholar] [CrossRef]
- Meyfroidt, P.; Lambin, E.F. Forest transition in Vietnam and displacement of deforestation abroad. Proc. Natl. Acad. Sci. USA 2009, 106, 16139–16144. [Google Scholar] [CrossRef]
- Meyfroidt, P.; Rudel, T.K.; Lambin, E.F. Forest transitions, trade, and the global displacement of land use. Proc. Natl. Acad. Sci. USA 2010, 107, 20917–20922. [Google Scholar] [CrossRef]
© 2013 by the authors; licensee MDPI, Basel, Switzerland. This article is an open access article distributed under the terms and conditions of the Creative Commons Attribution license (http://creativecommons.org/licenses/by/3.0/).
Share and Cite
Yan, D.; De Beurs, K.M.; Fan, J. The Impacts of Weather and Conservation Programs on Vegetation Dynamics in China’s Loess Plateau. Land 2013, 2, 573-594. https://doi.org/10.3390/land2040573
Yan D, De Beurs KM, Fan J. The Impacts of Weather and Conservation Programs on Vegetation Dynamics in China’s Loess Plateau. Land. 2013; 2(4):573-594. https://doi.org/10.3390/land2040573
Chicago/Turabian StyleYan, Dong, Kirsten M. De Beurs, and Jianrong Fan. 2013. "The Impacts of Weather and Conservation Programs on Vegetation Dynamics in China’s Loess Plateau" Land 2, no. 4: 573-594. https://doi.org/10.3390/land2040573