Abstract
This study assessed forest cover change from 1985 to 2016, analyzed community perception on forest cover change and its drivers, and suggested possible solutions in northern Ethiopia. Landsat images of 1985, 2000 and 2016, household interviews and focus group discussions were used. While dense forests and open forests increased by 8.2% and 32.3% respectively between 1985 and 2000, they decreased by 10.4% and 9.8% respectively from 2000 to 2016. Grasslands and cultivated land decreased in the first period by 37.3% and 5.5% but increased in the second period by 89.5% and 28.5% respectively. Fuel wood collection, cultivated land expansion, population growth; free grazing, logging for income generation and drought were the major drivers of the change reported by local communities. Soil erosion, reduction in honey bee production, flooding and drought were the most perceived impacts of the changes. Most of the farmers have a holistic understanding of forest cover change. Strengthening of forest protection, improving soil and water conservation, enrichment planting, awareness creation, payment for ecosystem services and zero grazing campaigns were mentioned as possible solutions to the current state of deforestation. In addition, concerted efforts of conservation will ensure that the forests’ ecosystems contribute to increased ecosystem services.
1. Introduction
Forests are important sources of livelihood for millions of people and contribute to the national economic development of many countries. Despite their crucial importance in livelihood and climate regulation, forest resources all over the globe are subjected to enormous pressure resulting in deforestation and degradation due to the increase in human and cattle population and widespread rural poverty [1]. For instance, since 1990 FAO [2] has estimated that about 129 million hectares of forests have been lost. The depletion of forests has many ecological, social and economic consequences, including the extinction of biotic communities leading to reduction in biodiversity, soil erosion, global warming and loss of income to forest dwellers [3].
In Ethiopia, the diverse forest resources available provide goods and services of significant values to the society, environment and economy [4]. Afromontane vegetation, which covered more than 50% of the highlands in Ethiopia, is one of the key biodiversity hotspot areas in the country, with enormous plant species [5]. Afromontane vegetation, especially the dry Afromontane forests, provide a diverse range of ecosystem services including serving as habitat for wild animals, watershed protection, soil erosion prevention and control, provision of fodder for livestock, non-timber forest products, groundwater regulation, flood control and climate change mitigation [6,7,8]. Wujig Mahgo Waren forest is one of the remnant dry Afromontane forests in northern Ethiopia which plays a crucial role in the livelihoods of the local communities.
A hundred years ago, about 40% of the landmass of Ethiopia was covered by forest. Currently, less than 3% of the land is covered by forest [9]. The FAO estimated a decline of forest cover from 15.11 million ha in 1990 to 12.5 million ha in 2015 [10]. Deforestation is the main cause of forest cover change in the tropics including Ethiopia and this is due to several factors [11,12]. The forest management over the last 50 years in Ethiopia has negatively affected the forest resource in Ethiopia by restricting access and use rights to the local communities [13]. For example, during the imperial era (1941–1974), forest land was considered as wasteland to expand both small scale and commercial agriculture to boost the economy. In this period, 100,000 hectares of forestland were given to royal elites and military forces, and other dignitaries to convert them into agricultural land [14]. In the socialist-Derge regime (1975–1991), the land tenure policy of the country changed due to the new land reform proclamation of “land to the tillers.” Consequently, landless people moved from one place in the form of resettlement which resulted in additional pressure on the remaining forests [15]. Under the current federal government (1995–present), forest management has been designated to the federal government and regional administrative tiers [16]. In this period, participatory forest management which encourages local community participation was introduced.
In Ethiopia, several studies have been carried out to estimate forest cover change [17,18,19,20,21,22]. However, little is known about the dynamics in the dry Afromontane forests of Ethiopia. Like many other parts of the country, the problem of deforestation poses a serious environmental threat in Wujig Mahgo Waren forest. However, the rate and extent of forest cover change and their drivers remains unclear. In addition, while the participatory management approach is said to be in place in this forest, the understanding of local community regarding forest cover change, its drivers and possible solutions was scanty. Therefore, it is crucial to assess and monitor the status of forest cover change and the drivers of the change to inform coherent and sustainable forest conservation strategies. These strategies will require the inclusion of the local community’s knowledge and perception for the design of effective and locally-relevant measures.
This study explored the forest cover dynamics in the Wujig Mahgo Waren forest in northern Ethiopia using a multi-disciplinary approach that combines a remote sensing method with participatory and community engagement approaches. It aimed at providing multi-disciplinary insights and understanding of the dynamics of forest cover change processes in the Wujig Mahgo Waren forest to inform policy and management decision making. Specifically, the study (i) determined the magnitude and the percentage change of the Wujig Mahgo Waren forest for the last 30 years; and (ii) analyzed the perception of the community towards forest cover change, its drivers, impact and possible solutions.
2. Materials and Methods
2.1. Study Area
Wujig Mahgo Waren is an elongated chain of natural forest in the southern zone of Tigray, northern Ethiopia. Geographically, the forest is situated at 12°47′–13°02′ N to 39°26′–39°39′ E, covering a total area of 17,000 ha (Figure 1). The state forest is found within four districts, namely Alaje, Endamokeni, Hintalowejerat, and Rayaazebo. These districts have 12 peasant associations (Kebeles) within or at the periphery of the forest boundary. The area is characterized by an undulating landscape where the dense forest is found on the hillsides and the valleys are left as cultivated areas and scattered bushlands.
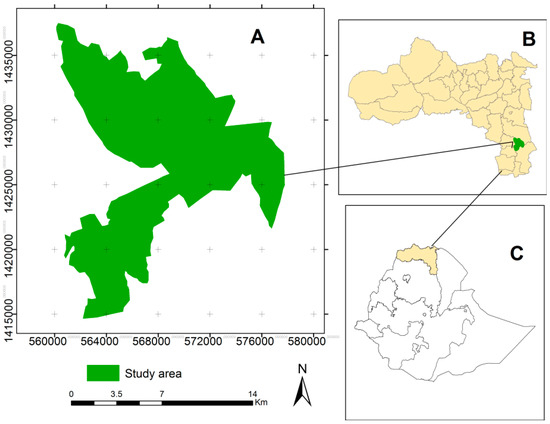
Figure 1.
Location map of study area: Wujig Mahgo Waren forest (A), Tigray region (B) and Ethiopia (C).
The mean annual and monthly temperature of the study area ranges between 8 and 25 °C. The elevation of the study area ranges between 1404 and 3924 m.a.s.l and is on average 2284 m. The highlands receive mean annual rainfall of 833 mm, whereas, the annual rainfall for the lowlands is 841 mm [23]. The area has a mainly semiarid climate with a bimodal rainfall pattern. Based on the 2013 population projection of Ethiopia, southern Tigray zone had a total population of 1,184,208 in 2017 of which 49% were men and 51% were women; 18% were urban inhabitants [24].
A wide range of plant species occur in the area including Acacia abyssinica [Hochst. ex] Benth, Eucalyptus globulus Labill, Eucalyptus camaldulensis Dehnh, Juniperus procera Hochst. Ex Endl, Olea europaea ssp. africana Mill, Podocarpus falcatus (Thunb.) Mirb, Dedonea angustifolia L.F., Combretum molle R.Br. ex G.Don, Diospyros mesipliformis Hochst ex A. DC, Cadia purpurea (G.Piccioli) Aiton and Opuntia ficus-indica (L.) Mill. According to WRB’s soil taxonomy, Vertisols, Cambisols, Fluvisols, Regosols, and Leptosols are dominant soil types in the study area [23].
The community in the study area practice rain-fed, subsistence-mixed farming. Small-scale farmers with an average landholding size of less than one hectare per household dominate the area. Southern Tigray is known for its high potential for wheat, barley, faba bean and maize production as well as its rich livestock.
2.2. Data Collection
2.2.1. Acquisition of Satellite Images and Ground Truth Data
Cloud-free Landsat satellite images captured in the dry season for the years 1985, 2000, and 2016 were acquired from the U.S. Geological Survey’s Earth Resources Observation and Science (USGS). The years of study were selected based on major changes in political systems. The technical details of the satellite data that were used in the present study are given in Table 1.

Table 1.
Details of satellite data used in the study.
For training points, more than 30 ground control points per land cover (LC) class were purposively assigned [25,26]. For accuracy assessment, 40 points per class were collected using a Global Positioning System (Garmin GPS) [27]. To include differences of reflectance due to difference in density (canopy cover) within each category, ground control points were systematically distributed. For historical image classification and accuracy assessment, ground control points were collected by interviewing a group of five elders to indicate what was found where. Those areas which achieved an agreement of four of the five elders were taken as valid. The consistent cover types that had not been changed within the study period as confirmed by the elderly people and verified with Google Earth were included for training and accuracy assessment.
2.2.2. Household Survey and Focus Group Discussion
The data used for the community and stakeholder study originated from primary and secondary sources including household survey and focus group discussions. A reconnaissance survey was conducted to have a broader understanding of study areas. During this exploratory survey, discussions were held with different stakeholders including farmers and extension staff working directly with the farmers. The findings from this stage were used to refine the study objectives, sampling methods, and the survey instrument.
A stratified two-stage sampling procedure was used to select kebeles and farming households. The study area was stratified into three groups based on agro-ecology zones (AEZs), following the classifications distinguished by the Ministry of Agriculture [28]. The classifications incorporated sub-humid highlands from 1500 to 2300 m, humid highlands from 2300 to 3200 m, and cold highlands above 3200 m. The two-stage sampling technique was applied to select the individuals from each of these agro-ecology zones. In the first stage, a purposive sampling method was employed to identify representative kebeles from each of the AEZs based on their distance to the forest. Accordingly, Tsigea and Ebo from the sub-humid highlands, Hizba Teklahymanot from the humid highlands, and Ayiba from the cold highlands were selected. In the second stage, respondents were randomly selected from each Kebele.
A total of 150 households were selected for the household survey. In addition to the household survey, we conducted 12 group discussions with farmers and development agents. Each group was composed of about 10 to 12 individuals and the topics for the discussion were related to their perception of forest cover change, drivers of deforestation, their impact, existing remedies and possible solutions. Each focus group had a trained facilitator who guided the participants through sets of prepared questions. The selection of explanatory variables (drivers) of LC changes incorporated in the questionnaire (Appendix A1) was based on literature [29,30] and expert knowledge of the area.
2.3. Data Analysis
2.3.1. Satellite Image Analysis and Accuracy Assessment
To improve the interpretability of the images, appropriate preprocessing procedures including radiometric correction (haze reduction and histogram equalization) were performed using the Earth Resources Data Analysis System (ERDAS) Imagine software, 2014. Both unsupervised and supervised image classification methods were employed [31]. Unsupervised classification using the Iterative Self-Organizing Data Analysis Technique (ISODATA algorithm) was first carried out to identify a potential representative of the overall land cover clusters of pixels available. The results of the unsupervised classification were then verified in the ground. A total of five land cover classes were identified. All five classes were identified in all images and represented the years under investigation in a consistent manner. The five classes were identified as dense forest, open forest, cultivated land, bare land and grassland (Table 2). Using training samples, maximum likelihood supervised classification was performed.
Table 2.
Description of land cover classes used for analysis of change between 1985, 2000 and 2016.
Consequently, the accuracy of the image classification was assessed. Thus, total accuracy and Kappa statistics were computed. Comparison was carried out by creating an error matrix, as discussed by Congalton and Green [32]. In principle, all the output maps have to meet the minimum 85% accuracy [33].
Change detection was conducted using a post-classification image comparison technique [30,36]. Visual comparison of features and matrix analysis were adopted to determine and detect land cover change [37]. Areas that were converted from one class to any of the other classes were computed and the change directions were also determined. The values were presented in terms of hectares and percentages. The estimation of the rate of change for the different covers were computed based on the formulae [38].
2.3.2. Household Survey and Focus Group Discussion
Descriptive statistics of simple frequency analyses were used to describe socioeconomic characteristics of households. Differences in perceptions among respondents in different kebeles concerning the forest cover change and drivers of forest cover change were also investigated using a nonparametric test, namely Pearson’s chi-square test. Ranking of drivers of forest cover change were done using ranking index method [39]. The index was computed as:
where, Rn = value given for the least ranked level (example, if the least rank is 5th, then Rn = 5, Rn-1 = 4, R1 = 1; Cn = counts of the least ranked level (in the above example, the count of the 5th rank = Cn, and the count of the 1st rank = C1.
Index = Rn*C1 + Rn-1*C2… + R1*Cn/Ʃ Rn*C1 + Rn-1*C2… + R1*Cn
Data collected through focus group discussions and observations were analyzed qualitatively.
3. Results and Discussion
3.1. Accuracy Classification
The overall accuracies for our classified thematic maps ranged from 90% to 93% with the Kappa coefficient ranging from 0.87 to 0.89 (Table 3). According to Turan and Günlü [40], the overall accuracy is acceptable if it is greater than 80%. The accuracy of our result is reasonably high falling within the range of land cover classification accuracies in similar regions. Similar results with relatively high accuracies (86–93%) were reported for land cover classifications in other regions of Ethiopia by Fetene, et al. [41] and by Kindu, et al. [30].
Table 3.
Accuracy assessment of classified images.
3.2. Land Cover (LC) Changes
A total of five LC types were extracted in the studied landscape (Figure S1). In 1985, dense forest was the dominant LC type making up 26% of the total area; followed by bare land (24%), open forest (21%), cultivated land (19%) and grassland (10%) (Table 4; Figure S1). In 2000, dense forest constituted the largest part (28%) and open forest, bare land, cultivated land and grassland made up 28%, 19%, 18% and 6% of the studied landscape, respectively. Dense forest continued to be the dominant LC in 2016 followed by open forest, cultivated land, bare land and grassland.
Table 4.
Area and Land cover (LC) change in Wujig Mahgo Waren forest in 1985, 2000, and 2016.
Between 1985 and 2000, an increase in dense forest and open forest and a reduction in cultivated land, grassland and bare land were observed (Table 4; Figure S2). However, between 2000 and 2016, a decrease in dense forest and open forest and an increase in cultivated land and grassland were recorded (Table 4; Figure S2). The fluctuating changes of the land cover overtime can be attributed to management changes of the forest. When the regime system of the country changed in 1991, there was a change in natural resource management including intensive soil and water conservation, exclosure establishment and community participation which gave the forest a recovery time for which some improvements have been observed between 1985 and 2000 [42,43,44,45]. However, communities were encroaching on lands to get wood for fuel, construction materials, more arable land and animal feed which caused a slight decrease in cover between 2000 and 2016 [45,46]. This is made evident from the results which show that the significant increase in cultivated and grassland has dictated the overall changes in the study area. The current growth of farmland and grassland at the expense of other LC types, especially forests and woodland, in the study area may be a manifestation of the weak or inappropriate institutional arrangements in the study area as it was observed in other parts of Ethiopia [47]. This has led to the inclusion of Wujig Mahgo Waren forest in the existing state forests according to the regional proclamation of 2012 [48], to continuously protect and manage it so that a continuous increment in the forest cover can be expected.
These results are in agreement with previous findings [21,41], suggesting that habitat conversions were observed from forest to cultivated land. A significant loss of forest cover was also reported by Hailemariam, et al. [26] in the Bale mountains within an observation period of 30 years. Such changes of forest cover are also evident in different parts of the world. For example, Huang, et al. [49] found that massive vegetation loss had occurred over the past 30 years in Beijing. This finding is therefore in line with the findings of [50,51], who reported that agriculture is expanding in the tropics.
While all land covers have undergone changes in area, the level of changes was different (Table 5). For instance, out of 3629 ha of open forest in 1985, only 1320 ha remained unchanged during the study period, implying that about 64% of the open forest had been converted into other LCs. Of the 64% converted open forest areas, 23%, 17%, 13% and 10% were transformed to dense forest, cultivated land, bare land, and grassland, respectively. In a similar fashion, out of 4469 ha of dense forest in 1985, 2435 ha (about 55%) remained unchanged. The remaining 46% of the 1985 dense forest were converted into other LC types. During the same period, out of 3999 ha of bare land in 1985, 766 ha (about 19%) remained unchanged. The remaining 81% of the 1985 bare land was converted into cultivated land (28%), open forest (23%), dense forest (18%) and grassland (12%).
Table 5.
Change matrix of Land cover change (LCC) types (ha) between 1985 and 2016.
Major trends contrary to the LC changes previously observed were found in the change matrix analysis for cultivated land and grasslands. Cultivated land replaced about 691 ha of the land that used to be covered by other LC types. The major sources were bare land (about 1122 ha), open forest (about 620 ha), grassland (about 279 ha) and dense forest (about 253 ha). Our study result is in line with what was reported by Hailemariam, et al. [26], where farmland gained the most compared to other LC types. Furthermore, other findings, in Nech Sar National Park, for example, showed that forest was largely replaced by cultivated land [41]. Tesfaye, et al. [52] found a major decline in forest cover and a substantial increase in cultivated land in the Gilgel Tekeze catchment. Our study also confirmed the results of Alemu, et al. [53], indicating an increased in trends of conversion of woodland into agriculture. A study by Dessie and Christiansson [15] also revealed a decline in forest area from about 40% at the turn of the 19th century to less than 3% in the year 2000 in the south-central rift valley of Ethiopia. Findings from elsewhere also showed an expansion of cultivated land and a decrease in forest and woodland over four decades in northern Ethiopia [54].
3.3. Socioeconomic Characteristics of Respondents
The majority (63%) of the sampled households were middle aged (20 and 49 years, mean age = 47 years) while older inhabitants aged > 50 years accounted for 37% (Table 6). Furthermore, the household size composition was 1–5 (51%), 6–10 (47%) and the 11–15 (2.6%). The minimum, mean, and maximum household size was 1, 6, and 12 persons, respectively (Table 6). The larger proportion of households had smaller land sizes, <0.5 ha (68%) and 0.75–1.25 ha (28%) and landless (4%). The overall average farm size under cultivation was 0.5 ha per household. The mean household income for all the interviewed households was USD 323 (ETB 7377) per year. The majority (75%) of the household respondents were male, and only 29% of the respondents were literate. Approximately 97% were farmers and only 3% of the respondents depended primarily on other off-farm income sources like wood collection and trade.
Table 6.
Sample household characteristics in the studied landscape (N = 150).
3.4. Perception of Farmers towards Forest Cover Change
Significant differences were found in perceptions among respondents regarding forest cover change. For instance, 73% of respondents perceived that the forest was in a bad condition, and if the government and the community do not act promptly, the condition of the forest may worsen in the near future. In contrast, 24% signified that the forest was increasing in size and cover and 3% of the respondents stated that there had been no change in forest cover (Table 7). The remote sensing image analysis results between 2000 and 2016 were perceived correctly by a majority of the respondents. Significant differences were also found in perceptions among respondents in different kebeles concerning the forest cover change (Table 8). For instance, while 89% of the respondents from Hiziba Teklehimanot kebele perceived that the forest was declining; 50% of the respondents from Tsgea kebele perceived that the forest was increasing. This might be due to the location of communities and spatial differences of forest conditions within the study area. During the reconnaissance survey, it was observed that the forest cover in Tsgea Kebele was better compared to that of Hiziba Teklehimanot kebele.
Table 7.
Farmer’s perception of forest cover changes at landscape level.
Table 8.
Farmer’s perception of forest cover changes by kebele-% of respondents.
During the focus group discussions (FGDs), the participants had perceived that the changes in government in 1991 (from Derg’s regime to EPRDF regime), had brought about changes in natural resource management approaches, from top down to bottom up, and ultimately to its current status of the forest. The participants further explained that apart from the state-owned remnant forests, there was little effort to protect the forest before 1991. However, since the change in regime in 1991, the forest cover has improved because of the change in the forest administration system, that is, from state-owned forest to community managed forest.
3.5. Ranked Drivers of Forest Cover Change
The respondents identified seven factors as important drivers for LC changes in the studied landscape with fuel wood collection (71%) and the expansion of cultivated land (63%) as the most important drivers (Table 9). In addition, some of the respondents reported house construction (51%), population growth (38%), pastoral use (35%), logging for income generation (34%) and drought (12%) as important causes for the observed LC changes. In agreement with our findings, these causes were reported in Demissie, et al. [29] as important drivers of LC changes in the Libokemkem district of South Gonder, Ethiopia. Kindu, et al. [55] indicated that population growth, expansion of cultivated lands, settlements and fuel-wood collection were the top significant drivers of change in LC in the Munessa-Shashemene, South-central highlands of Ethiopia. Fuel wood collection and charcoal production were the main degradation drivers for the African continent [56]. In this study, the opening up of new agricultural land to feed the ever growing population was indicated to significantly contribute to the current deforestation process. Similar results have been forwarded by Noriko, et al. [56] indicating that agriculture alone caused 73% of all deforestation in developing countries. According to DeFries, et al. [57] and Fisher [58], existing deforestation in Africa is still largely driven by small-scale subsistence agriculture.
Table 9.
Drivers of forest cover change as perceived by respondents.
Our FGDs in the different kebeles have indicated that population pressure had a great impact on the forest dynamics. Previous studies in other parts of the country also reported population pressure as a major driver of LC changes [20,59,60]. Furthermore, in the FGD, elders pointed out that they are dependent on the selling of fuelwood as an immediate source of income during decline or failure of crop production as a result of drought years. In these cases, farmers living in the study landscape and the neighbouring areas were forced to clear the remaining forests either to create additional croplands or to provide a source of income to maintain their livelihoods. This is a common survival strategy of rural populations in the events of degradation, drought, and rainfall variability across Africa [61].
Significant differences were found in perception among respondents in different kebeles regarding free grazing and income generation driving factors (Table 10). While all of the respondents in Hiziba Teklehimanot perceived free grazing as a major driver of forest cover change; most farmers in Ayiba kebele did not consider it as a key driver of the change. Instead, the majority of the respondents from Ayiba kebele perceived income generation as a major driver of the observed changes. There were no significant differences in perception among the respondents of all Kebeles for the cultivated land expansion, fuel wood collection, population growth, housing, and drought drivers.
Table 10.
Differences between farmers’ perceptions of drivers of forest cover changes by kebele-% respondents.
3.6. Perception of Farmers on Impact of Deforestation
Soil erosion (52%), aesthetic value reduction (33%), flooding (35%), water cycle disruption (30%), drought (11.3%), shortage of wood for fuel, housing and agricultural implements (35%) and honey bee reduction (12%) (Figure 2) were indicated as the direct impact of deforestation in the studied area. Deforestation generally increases rates of soil erosion by increasing the amount of runoff and reducing the protection of the soil from tree litter [62]. According to Gore [63] and Bruijnzeel [64], the water cycle is also affected due to deforestation. In developing regions of Africa, Asia, and Latin America, the loss of forests was projected to result in widespread fuel wood shortages [65]. Similar findings were also recorded by Ejigu, et al. [66] who revealed that shortage in bee forage was the major constraint of bee-keeping in the Amhara Region, Ethiopia. The aforementioned findings are in agreement with the perceptions of the respondents indicating that they critically understand the consequences of deforestation in the studied area.
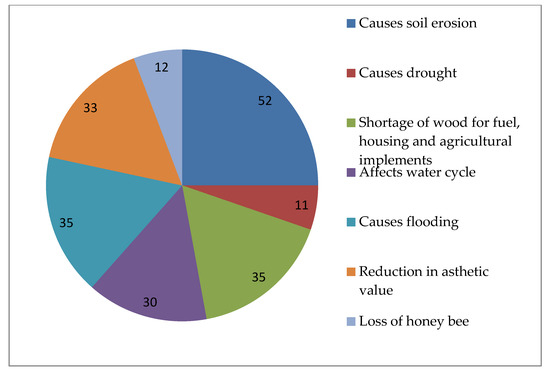
Figure 2.
Impacts of deforestation as perceived by respondents.
3.7. Existing Remedies and Potential Solutions
Various efforts have been made at several levels to maintain and increase the forest cover. Among the main activities that have been implemented were the establishment of exclosures, formulation of bylaws, enrichment plantation and soil and water conservation structures. Exclosures are areas closed from human and animal interference to promote natural regeneration of plants on formerly degraded communal grazing lands [67].
To maintain areas undergoing long-term forest regeneration, additional measures need to be taken. According to the respondents, strengthening forest protection (52%), improving soil and water conservation structures (39%), awareness creation (37 %), enrichment planting (35%), financing for added ecosystem services (31%) and introduction of zero grazing mechanisms (15%) are possible solutions to the current deforestation (Table 11).
Table 11.
Possible solutions as perceived by respondents.
4. Conclusions
This study analyzed the land cover (LC) dynamics of the Wujig Mahgo Waren state forest of Northern Ethiopia, from 1985 to 2016. The land cover changes were successfully detected using a combination of GIS and remote sensing techniques and household surveys. The study area has undergone extensive land cover changes over the past 30 years with a rapid transformation from dense and open forest to cultivated land and grassland. Due to the increment in population, additional arable and grazing lands are in demand, placing immense pressure on the other land use types, mainly the forest. This implies that the natural resource conservation measures that have been practised in the study area did not bring the desired conservation results.
Multiple factors underpin the observed changes in the land cover types. Fuel wood collection and expansion of cultivated land were ranked as the key factors responsible for the changes in land cover.
Improving forest protection, soil and water conservation structures, community awareness, enrichment planting, financing for added ecosystem services and the introduction of zero grazing mechanisms are among possible solutions forwarded to reverse the undesired situation in the study area.
We recommend that an option of forest management that addresses the needs of the community and avoids pressure on the forest has to be studied critically to sustain the forest and its ecosystem services.
Supplementary Materials
The following are available online at http://www.mdpi.com/2073-445X/7/1/32/s1, Figure S1: A comparative map showing the actual LCC in Wujig Mahgo Waren (WMW) in 1985, 2000 and 2016, Figure S2: LC changes during 1985–2016.
Acknowledgments
This study was financed by Mekelle University (CRPO/CoDANR/PhD/001/09) and the Steps Toward Sustainable Forest Management with the Local Communities in Tigray, Northern Ethiopia (ETH 13/0018) funded by NORAD/NORHED. We thank the University of Ghana and Transdisciplinary Training for Resource Efficiency and Climate Change Adaptation in Africa II (TRECCAfrica II) project. We also acknowledge Angesom Shushay and farmers of Wujig Mahgo Waren for their assistance during the fieldwork activities. We are grateful to the two anonymous referees and editors for constructive comments on an earlier version of this manuscript.
Author Contributions
N.S. conceived and designed the study; N.S. and H.H. collected and analyzed the data and wrote the paper; E.B., O.P., T.A. and I.K.A. critically reviewed the paper and provided comments on the contents and structure of the paper.
Conflicts of Interest
The authors declare no conflict of interest.
Appendix A
Appendix A1. Questionnaire on Drivers of Forest Cover Change and Perception of the Community
Questionnaire Number/code: _______________
Name of the interviewer………………………………………………… Signature……………………
Survey Area: District: ___________ Kebele: _________ Village: ________ Distance from the forest _______________
Location (coordinates) X ___________________, Y __________ Elevation
Date of interview: Day: _______ Month ________ Year: __________
1. Personal information
1.1. Name of household head: ______________________
1.2. Respondent’s name (if different from the head): ____________________________
1.3. Gender of head (1) M = ………… (2) F = …………
1.4. Age of respondent …………………
1.5. Educational status (year of schooling) _________________
If illiterate record zero; if literate record one
1.6. House hold family size: …………………………
1.7. Land holding size: ________________________
1.8. Mean household income: ____________________
2. What are the major uses of forests in your area?
3. Do you think that deforestation is the major problem in your locality?
4. How is today’s coverage of the forest when compared to the conditions before 1985?
A. Declined B. Increased C. No change
5. According to your knowledge, is severe and rapid forest cover change observed today?
A. yes B. No
6. If the answer to question number ‘4’ is yes, what were/are the major causes of deforestation? (Put in order)
| Drivers | Rank |
| Cultivated land expansion | |
| Fuelwood | |
| Charcoal production | |
| Grazing land | |
| Housing | |
| Drought | |
| Cutting trees to get rid of wild animals | |
| Wildfire | |
| Income generation | |
| Population growth | |
| Settlement | |
| Road access | |
| Civil war and conflict | |
| Market access | |
| Land tenure | |
| Rainfall variability |
7. What is your major source of income?
A. Sale of cash crops B. Sale of wood and charcoal C. Other __________
8. What types of fuel do you use for household needs (List them in order).
| Description | Before 1985 | Between 1985 to 2000 | From 2000 to Present |
| 1. Forest trees | |||
| 2. Crop residue | |||
| 3. Cow Dung | |||
| 4. Charcoal | |||
| 5. Kerosene |
9. On the basis of your knowledge, what are the impacts of deforestation/forest cover change in the area? (Put in order).
10. Are there species of “trees” and wild animals, in danger of extinction due to forest cover change from the local region? Please mention if any?
11. What do you think about the possible solution to alleviate the current problem of deforestation and to use forest resources in a sustainable manner?
12. What are the existing efforts to reduce deforestation and forest degradation in the study region?
13. What are the challenges in implementing the efforts to reduce deforestation and forest degradation in the study region/area?
References
- FAO. The state of the World’s Land and Water Resources for Food and Agriculture (SOLAW)—Managing Systems at Risk; Food and Agriculture Organization of the United Nations: Rome, Italy; London, UK, 2011. [Google Scholar]
- FAO. Global Forest Resources Assessment 2015: How Are the World’s Forests Changing? Food and Agriculture Organization of the United Nation: Rome, Italy, 2015. [Google Scholar]
- Chakravarty, S.; Ghosh, S.; Suresh, C.; Dey, A.; Shukla, G. Deforestation: Causes, effects and control strategies. In Global Perspectives on Sustainable Forest Management; InTech: London, UK, 2012. [Google Scholar]
- Moges, Y.; Eshetu, Z.; Nune, S. Ethiopian Forest Resources: Current Status and Future Management Options in View of Access to Carbon Finances; Ethiopian Climate and Research and Networking and the United Nations Development Programme: Addis Ababa, Ethiopia, 2010. [Google Scholar]
- Teketay, D. Seed Ecology and Regeneration in Dry Afromontane Forests of Ethiopia; Swedish University of Agricultural Sciences: Umeå, Sweden, 1996. [Google Scholar]
- Asfaw, A.; Lemenih, M.; Kassa, H.; Ewnetu, Z. Importance, determinants and gender dimensions of forest income in eastern highlands of Ethiopia: The case of communities around Jelo Afromontane forest. For. Policy Econ. 2013, 28, 1–7. [Google Scholar] [CrossRef]
- Solomon, N.; Birhane, E.; Tadesse, T.; Treydte, A.C.; Meles, K. Carbon stocks and sequestration potential of dry forests under community management in Tigray, Ethiopia. Ecol. Process. 2017, 6, 20. [Google Scholar] [CrossRef]
- Price, M.; Gratzer, G.; Alemayehu Duguma, L.; Kohler, T.; Maselli, D. Mountain Forests in a Changing World: Realizing Values, Adressing Challenges; Food and Agriculture Organization of the United Nations (FAO) and Swiss Agency for Development and Cooperation (SDC): Rome, Italy, 2011. [Google Scholar]
- Bedru, B. Economic valuation and management of common-pool resources: The case of exclosures in the highlands of Tigray, Northern Ethiopia. Ph.D. Dissertation, Katholieke Universiteit, Leuven, Belgium, 18 October 2007. [Google Scholar]
- FAO. Global Forest Resources Assessments; Food and Agriculture Organization of the United Nations: Rome, Italy, 2015. [Google Scholar]
- FAO. Global forest Resources Assessment 2010: Terms and Definitions; Food and Agriculture Organization of the United Nations: Rome, Italy, 2010. [Google Scholar]
- Rahman, M.M.; Sumantyo, J.T.S. Mapping tropical forest cover and deforestation using synthetic aperture radar (SAR) images. Appl. Geomat. 2010, 2, 113–121. [Google Scholar] [CrossRef]
- Engida, T.G.; Teshoma, A.J. The Socio Economic Effects of Community Forest Management: Evidence from Dendi District, Ethiopia. Int. Aff. Glob. Strategy 2012, 4, 15–22. [Google Scholar]
- Ayana, A.N.; Arts, B.; Wiersum, K.F. Historical development of forest policy in Ethiopia: Trends of institutionalization and deinstitutionalization. Land Use Policy 2013, 32, 186–196. [Google Scholar] [CrossRef]
- Dessie, G.; Christiansson, C. Forest Decline and Its Causes in the South-Central Rift Valley of Ethiopia: Human Impact over a One Hundred Year Perspective. AMBIO A J. Human Environ. 2008, 37, 263–271. [Google Scholar] [CrossRef]
- Lemenih, M.; Woldemariam, T. Review of forest, woodland and bushland resources in Ethiopia up to 2008. Ethiopian Environ. Rev. 2010, 1, 131–173. [Google Scholar]
- Gessesse, B. Forest Cover Change and Susceptibility to Forest Degradation Using Remote Sensing and GIS Techniques: A Case of Dendi District, West Central Ethiopia. Master’s Thesis, Addis Ababa University, Addis Ababa, Ethiopia, 2007. [Google Scholar]
- Bewket, W. Land Cover Dynamics Since the 1950s in Chemoga Watershed, Blue Nile Basin, Ethiopia. Mt. Res. Dev. 2002, 22, 263–269. [Google Scholar] [CrossRef]
- Reusing, M. Change detection of natural high forests in Ethiopia using remote sensing and GIS techniques. Int. Arch. Photogramm. Remote Sens. 2000, 33, 1253–1258. [Google Scholar]
- Dessie, G.; Kleman, J. Pattern and Magnitude of Deforestation in the South Central Rift Valley Region of Ethiopia. Mt. Res. Dev. 2007, 27, 162–168. [Google Scholar] [CrossRef]
- Gebrehiwot, S.G.; Bewket, W.; Gärdenäs, A.I.; Bishop, K. Forest cover change over four decades in the Blue Nile Basin, Ethiopia: Comparison of three watersheds. Reg. Environ. Chang. 2013, 14, 253–266. [Google Scholar] [CrossRef]
- Alemu, M.; Suryabhagavan, K.; Balakrishnan, M. Assessment of cover change in the Harenna habitats in Bale Mountains, Ethiopia, using GIS and remote sensing. Int. J. Ecol. Environ. Sci. 2012, 38, 39–45. [Google Scholar]
- Amanuel, Z.; Girmay, G.; Atkilt, G. Characterisation of Agricultural Soils in Cascape Intervention Woredas in Southern Tigray, Ethiopia; Mekelle University: Mekelle, Ethiopia, 2015. [Google Scholar]
- CSA. Population projection of Ethiopia for all regions at wereda level from 2014–2017; Central Statistical Agency: Addis Ababa, Ethiopia, 2013. [Google Scholar]
- Bakker, W.H.; Feringa, W.; Gieske, A.S.M.; Gorte, B.G.H.; Grabmaier, K.A.; Hecker, C.A.; Horn, J.A.; Huurneman, G.C.; Janssen, L.L.F.; Kerle, N.; et al. Principles Remote Sens; The International Institute for Geo-Information Science and Earth Observation (ITC): Enschede, The Netherlands, 2009. [Google Scholar]
- Hailemariam, S.; Soromessa, T.; Teketay, D. Land Use and Land Cover Change in the Bale Mountain Eco-Region of Ethiopia during 1985 to 2015. Land 2016, 5, 41. [Google Scholar] [CrossRef]
- MacLean, M.G.; Congalton, R.G. Map accuracy assessment issues when using an object-oriented approach. In Proceedings of the Annual Conference of American Society for Photogrammetry and Remote Sensing, Sacramento, CA, USA, 19–23 March 2012; pp. 1–5. [Google Scholar]
- MoA. Agro ecological Zones of Ethiopia; Natural Resource Management and Regulatory Department: Addis Ababa, Ethiopia, 2000.
- Demissie, F.; Yeshitila, K.; Kindu, M.; Schneider, T. Land use/Land cover changes and their causes in Libokemkem District of South Gonder, Ethiopia. Remote Sens. Appl. Soc. Environ. 2017, 8, 224–230. [Google Scholar] [CrossRef]
- Kindu, M.; Schneider, T.; Teketay, D.; Knoke, T. Land Use/Land Cover Change Analysis Using Object-Based Classification Approach in Munessa-Shashemene Landscape of the Ethiopian Highlands. Remote Sens. 2013, 5, 2411–2435. [Google Scholar] [CrossRef]
- Rogan, J.; Chen, D. Remote sensing technology for mapping and monitoring land-cover and land-use change. Prog. Plan. 2004, 61, 301–325. [Google Scholar] [CrossRef]
- Congalton, R.G.; Green, K. Assessing the Accuracy of Remotely Sensed Data: Principles and Practices; CRC Press: Boca Raton, FL, USA, 2009. [Google Scholar]
- Anderson, J.R.; Hardy, E.E.; Roach, J.T.; Witmer, R.E. A Land Use and Land Cover Classification System for Use with Remote Sensor Data; U.S. Government Printing Office: Washington, DC, USA, 1976.
- Singh, J.; Dhillon, S.S. Agricultural Geography; Tata McGraw-Hill: New Delhi, India, 2004. [Google Scholar]
- Deng, X.; Huang, J.; Rozelle, S.; Uchida, E. Cultivated land conversion and potential agricultural productivity in China. Land Use Policy 2006, 23, 372–384. [Google Scholar] [CrossRef]
- Singh, A. Review Article Digital change detection techniques using remotely-sensed data. Int. J. Remote Sens. 1989, 10, 989–1003. [Google Scholar] [CrossRef]
- Lu, D.; Mausel, P.; Brondízio, E.; Moran, E. Change detection techniques. Int. J. Remote Sens. 2004, 25, 2365–2401. [Google Scholar] [CrossRef]
- Kashaigili, J.J.; Majaliwa, A.M. Integrated assessment of land use and cover changes in the Malagarasi river catchment in Tanzania. Phys. Chem. Earth Parts A/B/C 2010, 35, 730–741. [Google Scholar] [CrossRef]
- Musa, L.; Peters, K.; Ahmed, M. On farm characterization of Butana and Kenana cattle breed production systems in Sudan. Livest. Res. Rural Dev. 2006, 18, 2006. [Google Scholar]
- Turan, S.Ö.; Günlü, A. Spatial and temporal dynamics of land use pattern response to urbanization in Kastamonu. Afr. J. Biotechnol. 2010, 9, 640–647. [Google Scholar]
- Fetene, A.; Hilker, T.; Yeshitela, K.; Prasse, R.; Cohen, W.; Yang, Z. Detecting Trends in Landuse and Landcover Change of Nech Sar National Park, Ethiopia. Environ. Manag. 2016, 57, 137–147. [Google Scholar] [CrossRef] [PubMed]
- Mekuria, W.; Veldkamp, E.; Corre, M.D.; Haile, M. Carbon Changes Following the Establishment of Exclosure on Communal Grazing Lands in the Semi-Arid Lowlands of Tigray, Ethiopia. In Experiences of Climate Change Adaptation in Africa; Leal Filho, W., Ed.; Springer: Berlin/Heidelberg, Germany, 2011; pp. 111–131. [Google Scholar] [CrossRef]
- Birhane, E.; Teketay, D.; Barklund, P. Actual and potential contribution of exclosures to enhance biodiversity of woody species in the drylands of Eastern Tigray. J. Drylands 2006, 1, 134–147. [Google Scholar]
- Mengistu, T.; Teketay, D.; Hulten, H.; Yemshaw, Y. The role of enclosures in the recovery of woody vegetation in degraded dryland hillsides of central and northern Ethiopia. J. Arid Environ. 2005, 60, 259–281. [Google Scholar] [CrossRef]
- Teketay, D.; Lemenih, M.; Bekele, T.; Yemshaw, Y.; Feleke, S.; Tadesse, W.; Moges, Y.; Hunde, T.; Nigussie, D. Forest Resources and Challenges of Sustainable Forest Management and Conservation in Ethiopia; Earthscan Publications: London, UK; New York, NY, USA, 2010; pp. 19–63. [Google Scholar]
- Ango, T.G.; Bewket, W. Challenges and prospects for sustainable forest management in Wondo Genet area, Southern Ethiopia. Ethiop. J. Dev. Res. 2007, 29, 27–64. [Google Scholar] [CrossRef]
- Hailemariam, S.N.; Soromessa, T.; Teketay, D. Institutional arrangements and management of environmental resources in Ethiopia. Environ. Nat. Resour. Res. 2016, 6, 67. [Google Scholar] [CrossRef]
- Jarno, H. Study of Causes of Deforestation and Forest Degradation in Ethiopia and the Identification and Prioritization of Strategic Options to Address Those; The Federal Democratic Republic of Ethiopia, REDD+ Secretariat, Ministry of Environment and Forest: Addis Ababa, Ethiopia, 2015.
- Huang, H.; Chen, Y.; Clinton, N.; Wang, J.; Wang, X.; Liu, C.; Gong, P.; Yang, J.; Bai, Y.; Zheng, Y.; et al. Mapping major land cover dynamics in Beijing using all Landsat images in Google Earth Engine. Remote Sens. Environ. 2017, 202, 166–176. [Google Scholar] [CrossRef]
- Foley, J.A.; Ramankutty, N.; Brauman, K.A.; Cassidy, E.S.; Gerber, J.S.; Johnston, M.; Mueller, N.D.; O’Connell, C.; Ray, D.K.; West, P.C.; et al. Solutions for a cultivated planet. Nature 2011, 478, 337–342. [Google Scholar] [CrossRef] [PubMed]
- Coulter, L.L.; Stow, D.A.; Tsai, Y.-H.; Ibanez, N.; Shih, H.-C.; Kerr, A.; Benza, M.; Weeks, J.R.; Mensah, F. Classification and assessment of land cover and land use change in southern Ghana using dense stacks of Landsat 7 ETM+ imagery. Remote Sens. Environ. 2016, 184, 396–409. [Google Scholar] [CrossRef]
- Tesfaye, S.; Guyassa, E.; Joseph Raj, A.; Birhane, E.; Wondim, G.T. Land Use and Land Cover Change, and Woody Vegetation Diversity in Human Driven Landscape of Gilgel Tekeze Catchment, Northern Ethiopia. Int. J. For. Res. 2014, 2014, 614249. [Google Scholar] [CrossRef]
- Alemu, B.; Garedew, E.; Eshetu, Z.; Kassa, H. Land use and land cover changes and associated driving forces in north western lowlands of Ethiopia. Int. Res. J. Agric. Sci. Soil Sci. 2015, 5, 28–44. [Google Scholar]
- Gebresamuel, G.; Singh, B.R.; Dick, Ø. Land-use changes and their impacts on soil degradation and surface runoff of two catchments of Northern Ethiopia. Acta Agric. Scand. Sect. B Soil Plant Sci. 2010, 60, 211–226. [Google Scholar] [CrossRef]
- Kindu, M.; Schneider, T.; Teketay, D.; Knoke, T. Drivers of land use/land cover changes in Munessa-Shashemene landscape of the south-central highlands of Ethiopia. Environ. Monit. Assess. 2015, 187, 452. [Google Scholar] [CrossRef] [PubMed]
- Noriko, H.; Martin, H.; Veronique De, S.; Ruth, S.D.F.; Maria, B.; Louis, V.; Arild, A.; Erika, R. An assessment of deforestation and forest degradation drivers in developing countries. Environ. Res. Lett. 2012, 7, 044009. [Google Scholar]
- DeFries, R.S.; Rudel, T.; Uriarte, M.; Hansen, M. Deforestation driven by urban population growth and agricultural trade in the twenty-first century. Nat. Geosci. 2010, 3, 178–181. [Google Scholar] [CrossRef]
- Fisher, B. African exception to drivers of deforestation. Nat. Geosci. 2010, 3, 375–376. [Google Scholar] [CrossRef]
- Hurni, H.; Tato, K.; Zeleke, G. The Implications of Changes in Population, Land Use, and Land Management for Surface Runoff in the Upper Nile Basin Area of Ethiopia. Mt. Res. Dev. 2005, 25, 147–154. [Google Scholar] [CrossRef]
- Kidane, Y.; Stahlmann, R.; Beierkuhnlein, C. Vegetation dynamics, and land use and land cover change in the Bale Mountains, Ethiopia. Environ. Monit. Assess. 2012, 184, 7473–7489. [Google Scholar] [CrossRef] [PubMed]
- Campbell, D.J. Strategies for coping with severe food deficits in rural Africa: A review of the literature. Food Foodways 1990, 4, 143–162. [Google Scholar] [CrossRef]
- Hobbs, R.J.; Harris, J.A. Restoration Ecology: Repairing the Earth’s Ecosystems in the New Millennium. Restor. Ecol. 2001, 9, 239–246. [Google Scholar] [CrossRef]
- Gore, A. An Inconvenient Truth: The Planetary Emergency of Global Warming and What We Can Do about It; Rodale: Emmaus, PA, USA, 2006. [Google Scholar]
- Bruijnzeel, L.A. Hydrological functions of tropical forests: Not seeing the soil for the trees? Agric. Ecosyst. Environ. 2004, 104, 185–228. [Google Scholar] [CrossRef]
- Bensel, T. Fuelwood, deforestation, and land degradation: 10 Years of evidence from Cebu province, the Philippines. Land Degrad. Dev. 2008, 19, 587–605. [Google Scholar] [CrossRef]
- Ejigu, K.; Gebey, T.; Preston, T. Constraints and prospects for apiculture research and development in Amhara region, Ethiopia. Livest. Res. Rural Dev. 2009, 21, 172. [Google Scholar]
- Aerts, R.; Nyssen, J.; Haile, M. On the difference between “exclosures” and “enclosures” in ecology and the environment. J. Arid Environ. 2009, 73, 762–763. [Google Scholar] [CrossRef]
© 2018 by the authors. Licensee MDPI, Basel, Switzerland. This article is an open access article distributed under the terms and conditions of the Creative Commons Attribution (CC BY) license (http://creativecommons.org/licenses/by/4.0/).