FlexMonitor: A Flexible Monitoring Framework in SDN


1
College of Computer, National University of Defense Technology, Changsha 410073, China
2
Science and Technology On Parallel and Distributed Processing Laboratory, National University of Defense Technology, Changsha 410073, China
*
Author to whom correspondence should be addressed.
Symmetry 2018, 10(12), 713; https://doi.org/10.3390/sym10120713
Submission received: 29 October 2018
/
Revised: 15 November 2018
/
Accepted: 17 November 2018
/
Published: 4 December 2018
(This article belongs to the Special Issue Symmetry in Computing Theory and Application)
Abstract
:Efficient network monitoring is an important basis work for network management. Generally, many management applications require accurate and timely statistics about network states at different aggregation levels at low cost, such as malicious traffic detection, traffic engineering, etc. Moreover, the network environment to be monitored is constantly changing and expanding, including not only the data center for cloud computing but also the Internet of Things (IoT) for smart urban sensing, which requires the intensive study of more fine-grained network monitoring. As is well known, the development of efficient network monitoring approaches greatly relies on a flexible monitoring framework. Software defined network (SDN) can provide dramatic advantages for network management by separating the control plane and data plane. Therefore, it is a good choice to design a flexible monitoring framework based on the advantages of SDN. However, most research works only take advantage of the centralized control feature in SDN, which leads to limited improvement in the flexibility of the monitoring framework. This paper proposes a flexible monitoring framework named FlexMonitor, which can realize greater flexibility based on not only the centralized control feature, but also the high programmability in the controller and the limited programmability in the openflow switches in SDN. There are two key parts in FlexMonitor, namely the monitoring strategy deployment part and the monitoring data collection part, which can enrich the deployment methods of monitoring strategies and increase the kinds of monitoring data sources, respectively. Based on the NetMagic platform, this monitoring framework was implemented and evaluated through realizing a distributed denial of service (DDoS) detection approach. The experimental results show that the proposed DDoS detection approach has a better detection performance compared with other related approaches as well as indirectly show that FlexMonitor can flexibly support a variety of efficient monitoring approaches.
1. Introduction
Obviously, efficient monitoring is an important foundation for network management [1,2]. Many management applications, such as elephant detection, load balancing, traffic engineering, accounting, etc., require accurate and timely statistics about network states at different aggregation levels [3,4]. For example, elephant detection may need to collect the related flow statistics about suspected elephant flows, while accounting application may need to collect all network traffic through the outgoing switches. In addition, it is also required to minimize the monitoring overhead as it may affect the normal traffic in the network [5]. These monitoring requirements would bring great challenges to the design of efficient monitoring approaches. Moreover, the network environment to be monitored is constantly changing and expanding. On the one hand, there are more and more new network applications deployed in the network, which results in increasingly complex traffic and greater and greater network scale. On the other hand, the network environment to be monitored is not confined to traditional networks. It may refer to the data center for cloud computing, the Internet of Things for smart urban sensing, etc. These new changes in network environment also increase the difficulty of the design of efficient monitoring approaches.
In this case, it is a good idea to propose a flexible monitoring framework and design new efficient monitoring approaches based on it according to the specific monitoring requirements. In this way, the design cost and the deployment cost of efficient monitoring approaches can be greatly reduced. In terms of the monitoring framework, there should be three characteristics described as follows. Firstly, this framework should flexibly support the deployment of monitoring strategies to meet different monitoring requirements. Secondly, this framework could extend the kinds of monitoring data sources. On the one hand, this can better guarantee the monitoring timeliness and the minimal monitoring overhead, while, on the other hand, this can make the analysis of monitoring data simpler. Finally, this framework can be scaled easily without incurring much deployment overhead or monitoring overhead into the network.
Obviously, by separating the control plane with the data plane, SDN can greatly simplify the network management. However, the SDN management framework cannot be directly applied to the network monitoring. The reason for that is the related monitoring mechanisms are not specifically defined in this framework, which would limit their ability to adequately meet the different monitoring requirements. Taking a variety of the monitoring requirements into account, this paper fully extends the monitoring mechanisms in the SDN management framework while maintaining the advantages of SDN to a great extent. There are mainly four contributions in this paper. (1) This paper proposes a flexible monitoring framework named FlexMonitor, which can flexibly support the design of efficient monitoring approaches according to the specific monitoring requirements. (2) This monitoring framework FlexMonitor extends the kinds of monitoring data sources by introducing the event triggering mechanism. Leveraging this mechanism, FlexMonitor can reduce the monitoring overhead and obtain the network states in a timely manner. (3) The monitoring framework FlexMonitor increases the flexibility of the monitoring strategy deployment. With regard to efficiently carrying out a monitoring task, FlexMonitor can support selectively using some of the monitoring strategies including event definition, switch selection and end–host pair selection. (4) This paper proposes a DDoS (Distributed Denial of Service) detection approach based on the monitoring framework FlexMonitor. By evaluating the performance using NetMagic [6], this approach shows dramatic advantages on the DDoS detection. At the same time, the experimental results verify the flexibility and efficiency of the monitoring framework FlexMonitor.
The rest of this paper is organized as follows. Section 2 describes the traditional monitoring framework and the related monitoring framework in SDN. Then, the proposed monitoring framework FlexMonitor is presented in Section 3, where the related monitoring mechanisms are also discussed including the deployment of monitoring strategy, the collection of monitoring data, the definition of monitoring request and the scalability of FlexMonitor. Section 4 proposes a DDoS detection approach based on FlexMonitor. Section 5 makes the performance evaluation to verify the efficiency of the proposed DDoS detection approach. Finally, Section 6 presents the conclusion.
2. Related Work
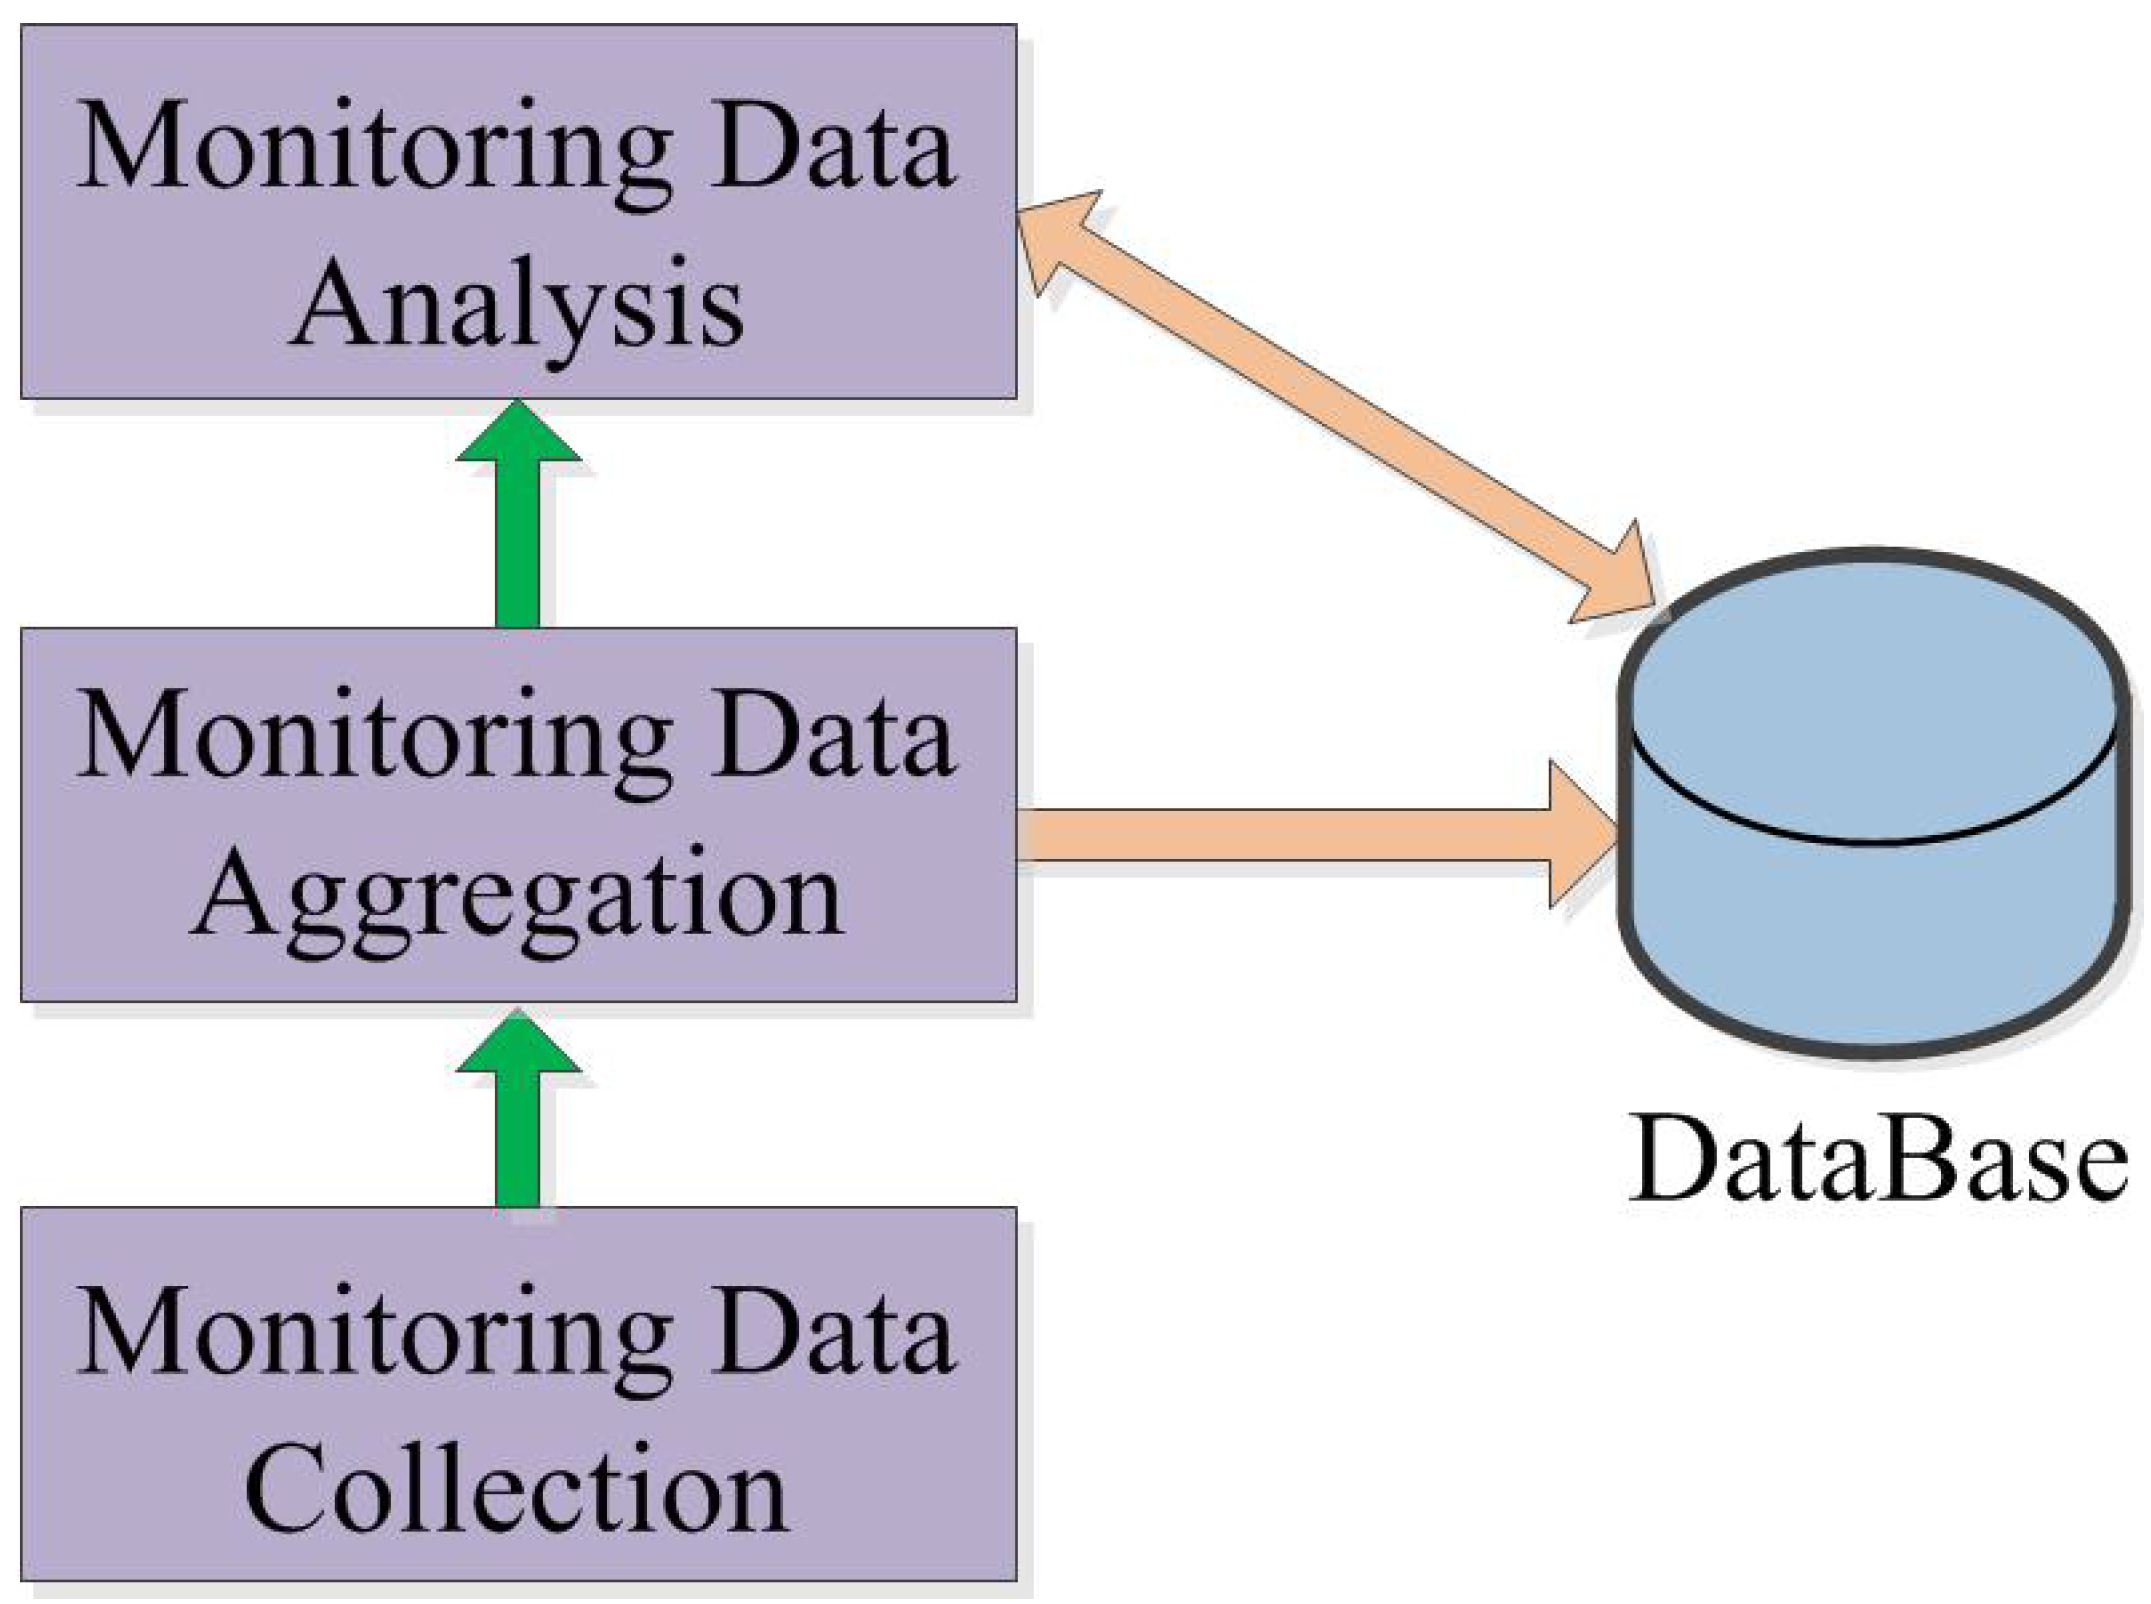
Efficient network monitoring is a hot research field and the monitoring framework is studied continuously as monitoring requirements are changing. As shown in Figure 1, the traditional monitoring framework mainly covers four functionalities: the collection, aggregation, analysis and storage of the monitoring data. The collection part is the most basic and important part pf the monitoring framework because its efficiency can affect the monitoring accuracy to a great extent. Generally, the monitoring frameworks can be classified into two kinds: distributed frameworks [7] and centralized frameworks [8]. Distributed frameworks are often applied to very-large-scale networks and their deployment is rather complex. For the majority of networks, their monitoring frameworks would adopt the centralized model, based on which all the monitoring agents (e.g., SNMP [9], NetFlow [10], etc.) would send their monitoring data to the central collector and then the central collector can analyze, aggregate and store these data in the database according to different monitoring requirements.
Since the SDN management framework [11] itself is a typical centralized framework, it is a good choice to design the monitoring framework in SDN on the basis of the SDN management framework. Compared with the traditional networks, there are several advantages in SDN on the network monitoring. Firstly, the SDN controller can obtain network topology and the routing information easily because the controller is responsible for the routing computing of the whole network. The traditional networks often adopt the distributed routing protocols, which makes it hard to obtain the routing information of the whole network at low cost for the monitoring collector. Secondly, the SDN switch can provide the monitoring collector with a variety of counters, such as port byte/packet counters, flow byte/packet counters, flow duration, etc. These counters can make the monitoring data collection easier without deploying specific monitoring agents. Finally, different from the traditional networks, the SDN switches are only responsible for the forwarding functionality. Thus, there may be abundant computing capability in SDN switches which can be used for the network monitoring. However, the SDN management framework does not focus on the network monitoring specifically and fails to fully leverage the advantages of SDN on network monitoring. Currently, the collection of monitoring data mainly relies on the active polling [12] and sampling [13]. On the one hand, they cannot meet the fine granularity monitoring requirements of typical SDN such as data center and campus network. On the other hand, they would go against the scalability of the monitoring framework because of the monitoring overhead.
OpenNetMon [14] and Probe-SDN [15] focus on the tradeoff problem between the monitoring accuracy and the monitoring overhead. However, the solutions they propose are not universal and are specific to different certain application scenarios. The former is mainly for traffic engineering and the latter is mainly for computing the bandwidth utilization. PayLess [16] is a monitoring framework for SDN, which can provide an abstract view of the network and a uniform way to request the monitoring data. In addition, it proposes an adaptive flow statistics collection algorithm that can obtain highly accurate monitoring data in a timely manner while incurring little network overhead. However, an important assumption of PayLess is that sophisticated and effective monitoring approaches can be developed only using the monitoring mechanisms provided by OpenFlow such as active polling, sampling and flow statistics triggering. Obviously, this assumption is not very reasonable. FlowCover [17] is a low-cost, high-accuracy monitoring scheme which can support various network management tasks. By leveraging the advantages of SDN, the whole network visibility and the central control functionality, FlowCover can select the target switches based on the view of all active flows instead of on per-flow basis. Although FlowCover can reduce the communication overhead to some extent, it does not innovate on the ways of flow statistics collection from switches. With finer and finer granularity monitoring requirements, the work of the monitoring mechanisms provided by OpenFlow is very limited.
Generally, different application scenarios often have different characteristics in terms of the structure and the communication among each other. Therefore, each application scenario may be faced with different challenges on the design of monitoring framework. In Internet of Things for smart urban sensing, an appropriate IoT architecture is badly needed to avoid problems such as the embedded control intelligence, vendor-dependent interfaces, highly personalized applications, etc. Liu et al. [18] proposed a software-defined IoT architecture for smart urban sensing, which successfully extends the spirit of the software-defined approach from network devices to sensor platforms and the cloud. However, they focused on the improved control feature and only introduced the basic functionalities of SDN. In data center, adopting the centralized model may result in much computing overhead on the central monitoring collector and much communication overhead between the controller and the switches. An appropriate management framework is badly needed to reasonably distribute the computing overhead on different collectors and the communication overhead on different links. Xu et al. [19] proposed a management model, in which regional networks on lower layers are aggregated and viewed as single switches to upper layers. Another interesting application scenario is the RFID (radio frequency identification)-based smart parking management system. Tsiropoulou et al. [20] proposed a smart parking system architecture and fully uses the functionality of passive RFID tags, which realizes not only the power saving but also the constant monitoring of the parked cars. Given the above, the most important factor of a system or framework is reducing the related overhead as much as possible while maintaining the convenience of the core functionality.
In terms of the research of the monitoring framework, the core motivation is reducing the overhead of the whole monitoring process as much as possible while carrying out the monitoring tasks normally. The monitoring mechanisms in SDN need to be further developed and studied because they are the key to the efficient work of the monitoring framework.
3. FlexMonitor
In this section, the monitoring framework FlexMonitor is described in detail from the perspective of the monitoring strategy deployment, the monitoring data collection and the monitoring request definition. Thereafter, the scalability of FlexMonitor is also discussed.
3.1. Overview
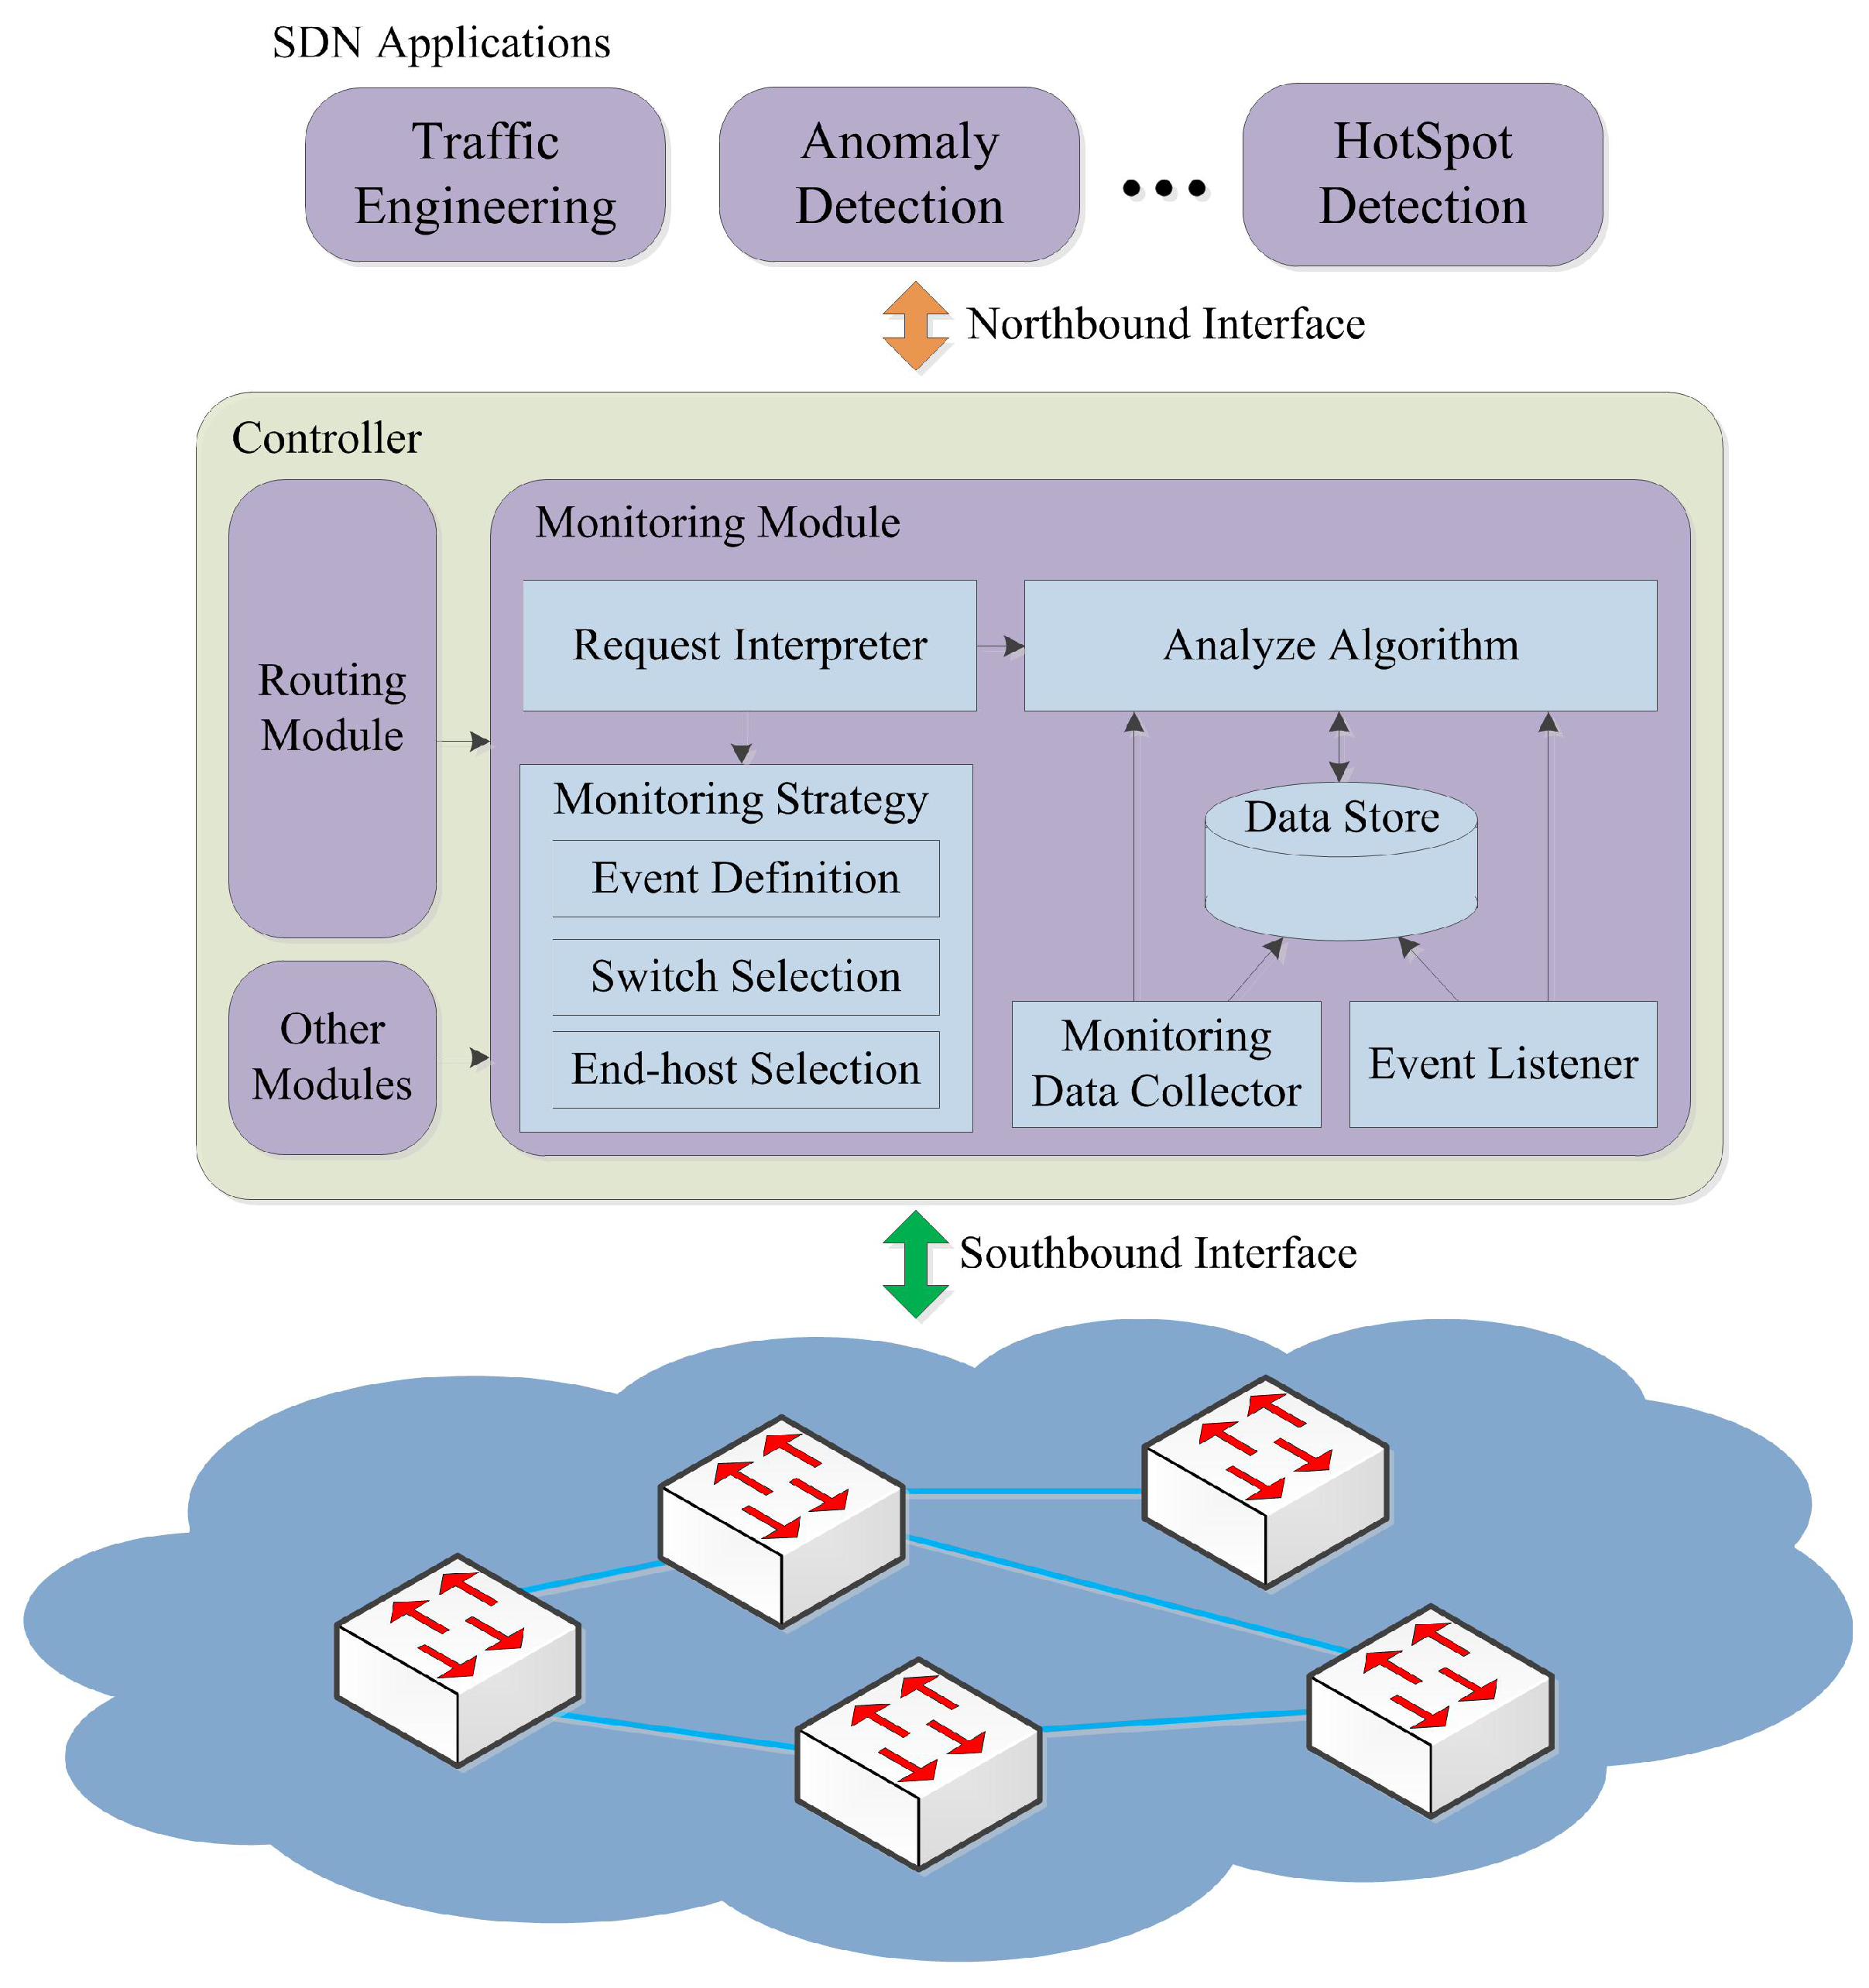
As shown in Figure 2, the monitoring framework FlexMonitor can be regarded as a monitoring module plugged into the controller. Through the southbound interface, the monitoring module in the controller can deploy the monitoring strategy and collect the monitoring data. Through the northbound interface, it can also provide the network view to the upper network management applications.
The functionalities of FlexMonitor can be mainly classified into four parts: the monitoring task interpretation part, the monitoring strategy deployment part, the monitoring data collection part and the monitoring data analysis part. The monitoring task interpretation part is responsible for interpreting the monitoring requests of the upper management applications. Effective interpretation can be helpful to choose the appropriate monitoring strategies. The monitoring strategy deployment part is responsible for carrying out the monitoring tasks through deploying the specific monitoring strategies in the network. The collection part is responsible for collecting the monitoring data accurately and in a timely manner from the network devices or end hosts using various monitoring approaches. According to the specific monitoring requirements, the analysis part is responsible for analyzing and aggregating the raw monitoring data from the collection part.
Among the four functional parts, the monitoring strategy deployment part and the monitoring data collection part are the key parts to FlexMonitor. On the one hand, the accuracy, timeliness and incurred overhead of network monitoring depends on the adopted status or statistics collection approaches to a great extent. On the other hand, the choice of the status or statistics collection approaches depends on the adopted monitoring strategy.
3.2. Monitoring Strategy and Data Source
3.2.1. Strategy
Generally, for each monitoring task, not every switch needs to poll the statistics of ports or flows and not every end–host pair needs to deploy the active measurements. In addition, there may be many monitoring solutions achieving a specific monitoring goal and different monitoring solutions can cause different degrees of network overhead. Therefore, adopting the appropriate monitoring strategies is helpful to better carry out the monitoring tasks. In FlexMonitor, there are three basic monitoring strategies: switch selection, end–host pair selection and event definition.
Switch selection: Select the optimal targeted switch set to collect the statistics of ports or flows according to the monitoring requirements. In FlexMonitor, the monitoring strategy deployment part can use different targeted switch selecting algorithms to obtain the optimal targeted switch set. Meanwhile, this part can use customized port or flow statistics collection algorithms to efficiently obtain the monitoring data from the chosen targeted switches. By this way, the communication overhead between the controller and switches can be greatly reduced during the network monitoring.
End–host pair selection: Select the optimal end–host pair set to collect the end-to-end monitoring data according to the monitoring requirements. In FlexMonitor, the monitoring strategy deployment part can use different end–host pair selecting algorithms to obtain the optimal end–host pairs. Choosing the appropriate end–host pairs can reduce the monitoring overhead incurred by the active measurements.
Event definition: Abstract some simple network events and define their corresponding event triggers. For abstracting the network events, mainly two factors need to be determined: (1) the triggering condition that the corresponding event triggers rely on to work; and (2) the basic monitoring data that need to be collected and used to judge whether the current network state meets the triggering condition. If these two factors of a network event can be easily determined, they can be directly detected through deploying the event triggers. Once the event triggers are deployed in the switches or end–hosts, the collection unit of each event trigger will continuously collect the required basic monitoring data. Based on the collected basic monitoring data, the computing unit of the event trigger will timely evaluate the current network state.
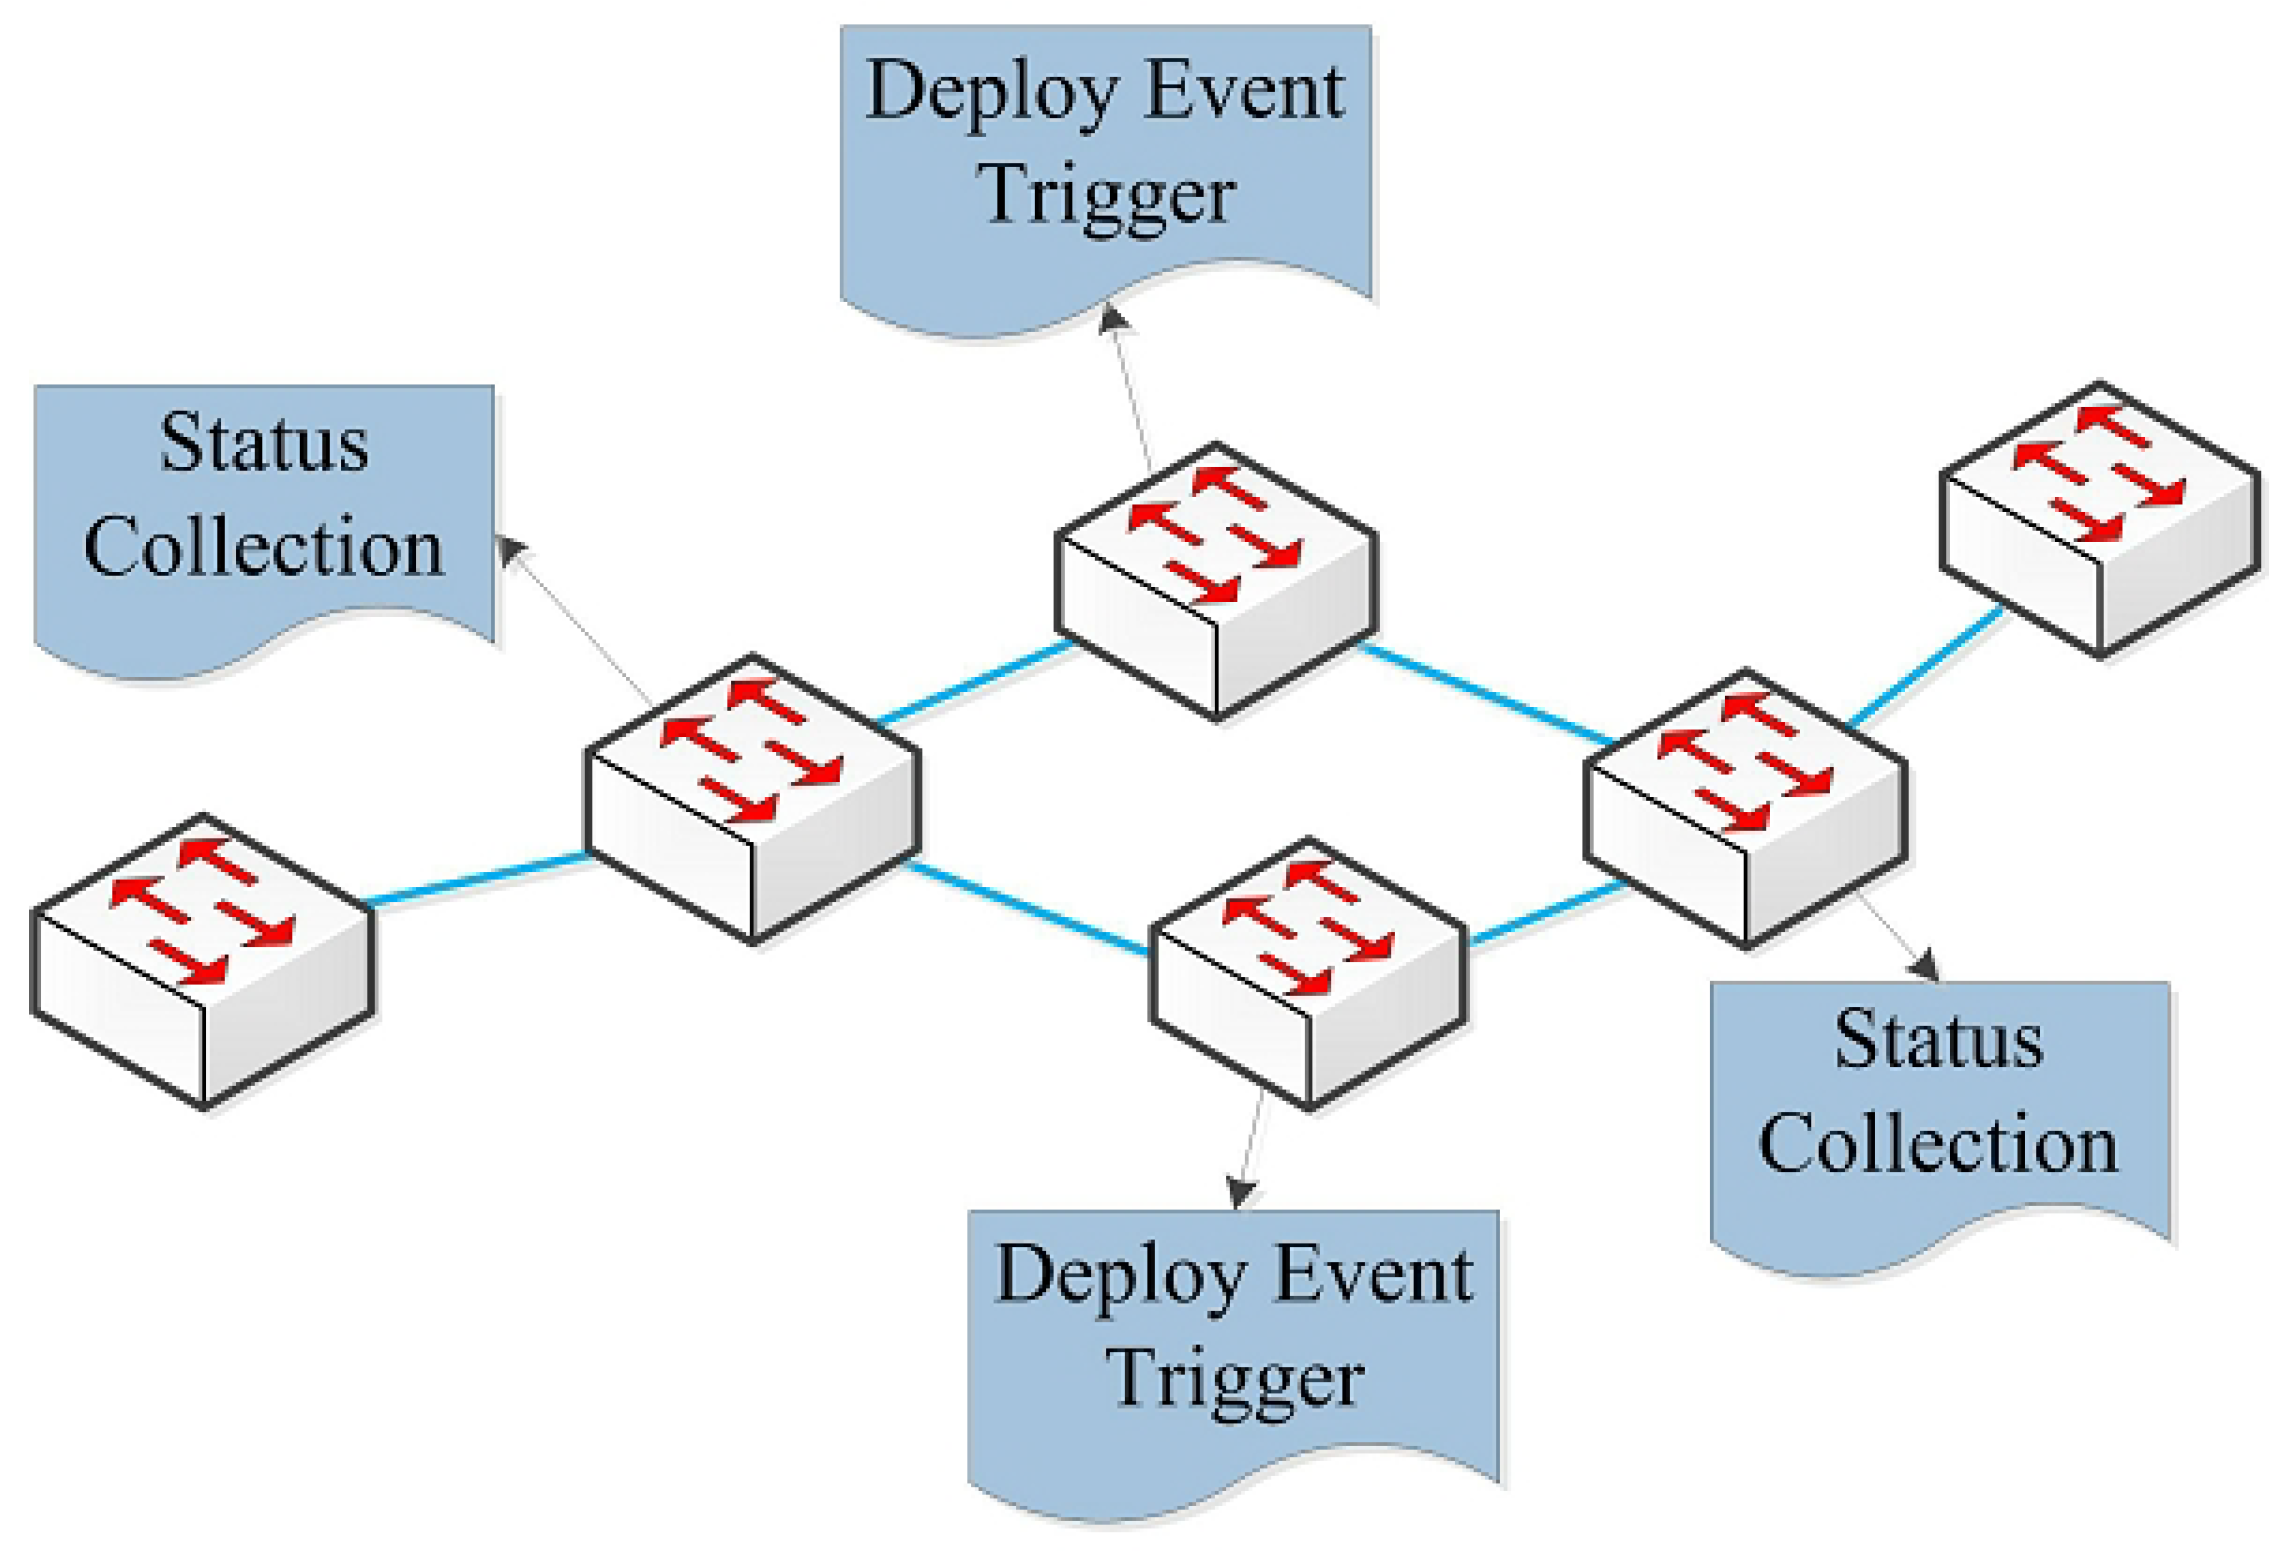
The former two monitoring strategies have been fully studied and been used in a variety of monitoring environments. Generally, to detect the occurrence of a network event, the monitoring data collection part often needs to collect the corresponding statistics of ports or flows many times, which may incur much monitoring overhead in the network. However, for some network events, their corresponding event triggers can be defined easily and they can be quickly detected at low cost through deploying the event triggers in the switches or end–hosts. Therefore, the event definition strategy can be considered as a complementary strategy for the switch selection strategy and the end–host pair selection strategy. Through combining these three basic monitoring strategies reasonably, FlexMonitor can realize complex monitoring strategies to meet different monitoring requirements of upper management applications. For example, the network hot spot detection can be realized using a hybrid monitoring strategy, which combines the switch selection strategy with the event definition strategy, as shown in Figure 3. For network hot spot detection, it is obvious that, if every port statistics or the total traffic of each switch can be acquired, the detection can reach high accuracy easily. However, detecting network hot spots in this way would be inevitable to cause much monitoring overhead in the network. Alternatively, the network manager can resolve this problem from two perspectives: on the one hand, collecting the port statistics or the total traffic only for selected switches with larger degree; and, on the other hand, for the rest of switches in the network, defining the network hot spot event and deploying the corresponding triggers into these switches. By this way, the accuracy of the hot spot detection can be guaranteed while the monitoring overhead can also be dramatically reduced.
3.2.2. Data Source
According to the proposed monitoring strategies, there are mainly four kinds of monitoring data sources in FlexMonitor: the raw packets, the statistics data, the end-to-end measuring data and the network event triggering messages.
The characteristics of different monitoring data sources are listed as Table 1. Among these four kinds of monitoring data sources, the network event triggering message is a kind of efficient monitoring data source. When the collection part listens to the event triggering messages, it can directly obtain the occurrence information of the network event without further analyzing the event triggering messages. Through relying on the event triggers in the switches or end–hosts, the network monitoring can realize the corresponding network event detection, which may only incur limited event triggering messages into the network. It can be seen that the monitoring overhead can be greatly reduced in this way. The reduction of monitoring overhead can be reflected from two perspectives: On the one hand, for the reason that the collection unit of each event trigger would continuously poll the network state and the computing unit of each event trigger would also continuously judge whether the network condition meets the deployed event triggers in the targeted switches or end–hosts, the computing overhead in the controller can be almost entirely reduced. On the other hand, due to the decrease of the port or flow statistics polling messages, the communication overhead between the controller and switches is also greatly reduced. In addition, through defining appropriate triggering conditions, using the network event triggering messages as one of monitoring data sources can be helpful to enhance the real-time detection of corresponding network events. In practice, many network events can be easily described into event triggers. These network events include the detection of network congestion, abnormal traffic, elephant flows, network hot spots, etc. For example, regarding the elephant flow detection, the triggering condition can be defined as a specific elephant flow threshold and the basic monitoring data can be defined as the byte statistics for each flow. When there exists a flow where its byte statistics exceeds the pre-defined threshold, the switch would trigger an elephant flow notification message to the controller.
According to the specific monitoring requirements of upper management applications, the collection part would continuously collect monitoring data from these different sources. In addition, FlexMonitor can use customized analysis algorithms to analyze and aggregate the received monitoring data. The upper management applications can obtain these required monitoring data through the northbound interface.
3.3. Monitoring Request
In FlexMonitor, the monitoring requests corresponding to monitoring tasks of upper management applications can be delivered to the monitoring task interpretation part through the northbound interface. To make an effective interpretation, the method of monitoring requests is very important for upper management applications.
Obviously, the definition of monitoring requests is a key step to the efficient network monitoring. There are mainly two important aspects during the monitoring request definition. One is that the monitoring request definition needs to accurately and clearly describe the monitoring tasks of upper management applications; the other is that the monitoring request definition needs to be simple, which can be helpful to interpret monitoring tasks of upper management applications.
In FlexMonitor, the monitoring tasks can be classified into three major categories. The first category refers to the basic monitoring tasks, which may include flow statistics collection, jitter, latency, link utilization, etc. Each basic monitoring task usually corresponds to many classic scheduler algorithms. In FlexMonitor, the basic monitoring task can choose one of its corresponding scheduler algorithms as the default scheduler algorithm. Besides this, it can also specify a customized scheduler algorithm in the monitoring request of this monitoring task. The second category refers to these monitoring tasks which have been designed considering what monitoring strategies will be adopted and for the chosen monitoring strategy what scheduler or detection algorithms will be adopted. Generally, for some classic network events, their corresponding monitoring solutions have been well studied and corresponding scheduler or detection algorithms tend to be mature and perfect. To simplify the interpretation of monitoring requests, related monitoring strategies and related scheduler or detection algorithms can be initially specified in the form of configure files in FlexMonitor for these monitoring tasks. When the upper management applications need to monitor one of these network events, FlexMonitor can directly adopt the pre-installed monitoring strategy and scheduler or detection algorithm to carry out the monitoring task. The three category refers to the complex monitoring tasks, which belongs to neither the first category nor the second category. If these monitoring tasks are directly carried out, the monitoring implementation may be complex and the monitoring overhead may be high. Therefore, if the upper monitoring applications need to monitor a complex monitoring task, this monitoring task will be broken down into several basic monitoring tasks in FlexMonitor.
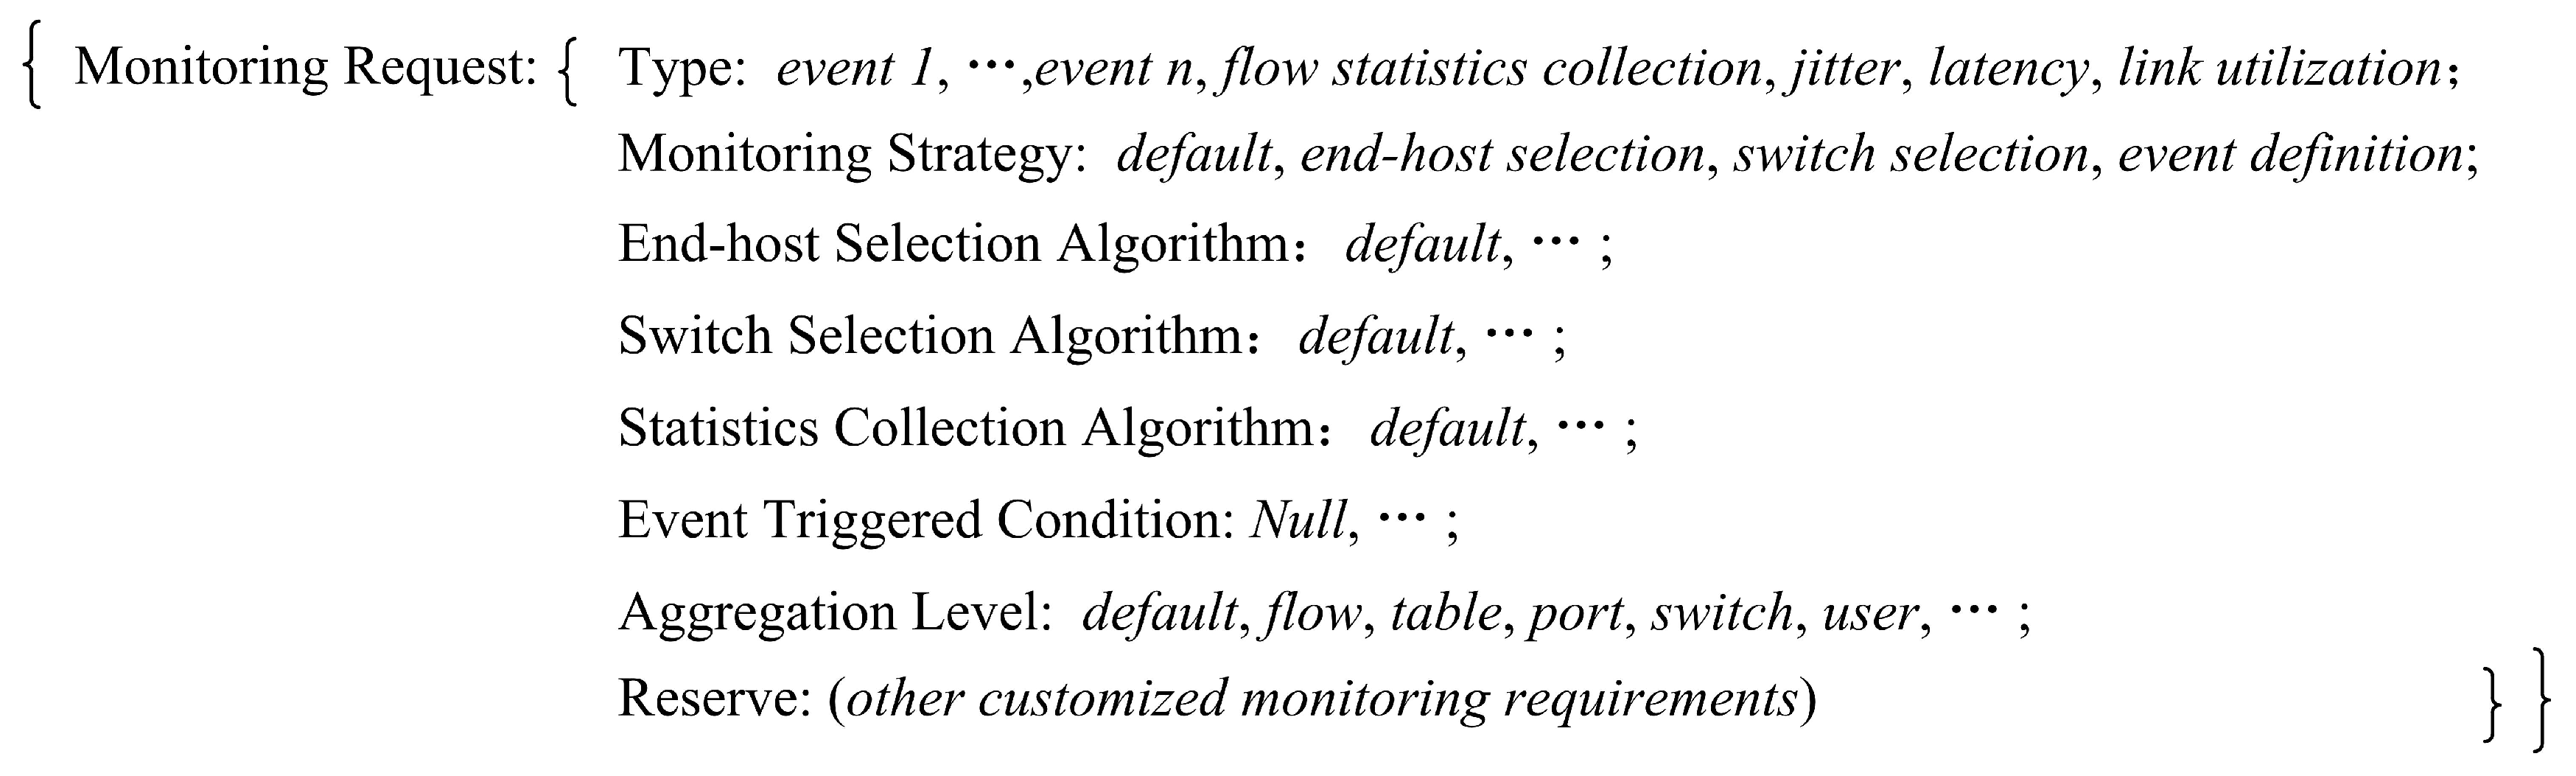
In FlexMonitor, the general monitoring request definition for a monitoring task is described in Figure 4. There are mainly four kinds of information in the monitoring request definition: type, monitoring strategy, aggregation level and reserved.
Type: The upper management applications specify the type of the monitoring tasks. Considering each complex monitoring task will be broken down into several basic monitoring tasks, the specification of the type in monitoring request only involves the monitoring tasks which belong to the first and second categories. For the first category, the type in monitoring request is the name of the basic monitoring task. For the second category, the type in monitoring request is the name of its corresponding monitoring task.
Monitoring strategy: The upper management applications specify the monitoring strategy for the monitoring task. The monitoring strategy here can be specified as the default value or some of the three basic monitoring strategies including the switch selection, end–host pair selection and event definition. If the chosen monitoring strategy does not specify the specific scheduler algorithm in the monitoring request, FlexMonitor will adopt the default scheduler algorithm of the monitoring strategy. Each monitoring task can adopt multiple monitoring strategies in order to increase the flexibility of the network monitoring.
Aggregation level: The upper management applications specify the aggregation level for the monitoring task. Some monitoring tasks may not be involved in the definition of aggregation level. In this case, the aggregation level in monitoring request is set to zero, which indicates the aggregation level of the corresponding monitoring task need not be set. Generally, the aggregation level definitions of different kinds of monitoring tasks are different from each other. According to the upper management applications, the aggregation level in monitoring request is set to the value of its own customized aggregation level. For example, the aggregation level for flow statistics collection may be set to flow, port, user, switch, etc.
Reserved: The upper management applications can specify other monitoring requirements in this reserved field.
3.4. Scalability
Generally, the scalability of the monitoring framework FlexMonitor is mainly reflected in two aspects: (1) the ability to reduce to computing overhead on the controller; and (2) the ability to reduce the communication overhead between the controller and switches.
During the network monitoring, the computing overhead on the controller is mainly caused by the analysis of the monitoring data. In FlexMonitor, due to the increase of monitoring data sources, especially the use of event triggering messages, the monitoring data analysis would become relatively simpler. Therefore, the computing overhead on the controller is reduced to some extent. Furthermore, FlexMonitor takes various measures to reduce the communication overhead between the controller and switches. From the perspective of the controller, it collects the monitoring data only from switches in the optimal targeted switch set rather than all switches. From the perspective of the switch, it fully exploits the computing capability of the switches. On the one hand, it introduces the event triggering message as one of the monitoring data source, which can make the communication overhead minimal while maintaining the monitoring accuracy. On the other hand, it can send the monitoring data to the controller after aggregating or compressing it in the switches.
Therefore, the monitoring framework FlexMonitor has good scalability and can be easily extended to large-scale networks.
4. Example
With the increasing popularity of the Internet and the development of network technology, DDoS attacks often occur [21,22,23]. Through using the client/server model, DDoS can combine thousands of computers as an attack platform to launch an attack on one or more targets, which would multiply the power of denial of service attacks. Obviously, DDoS attack can lead to legal users no longer being able to visit the services provided by the attacked server. To avoid being attacked, the DDoS detection has always been a hot research field [24]. Taking DDoS detection as an example, this section makes an illustration for the monitoring request definition in FlexMonitor.
4.1. DDoS Detection
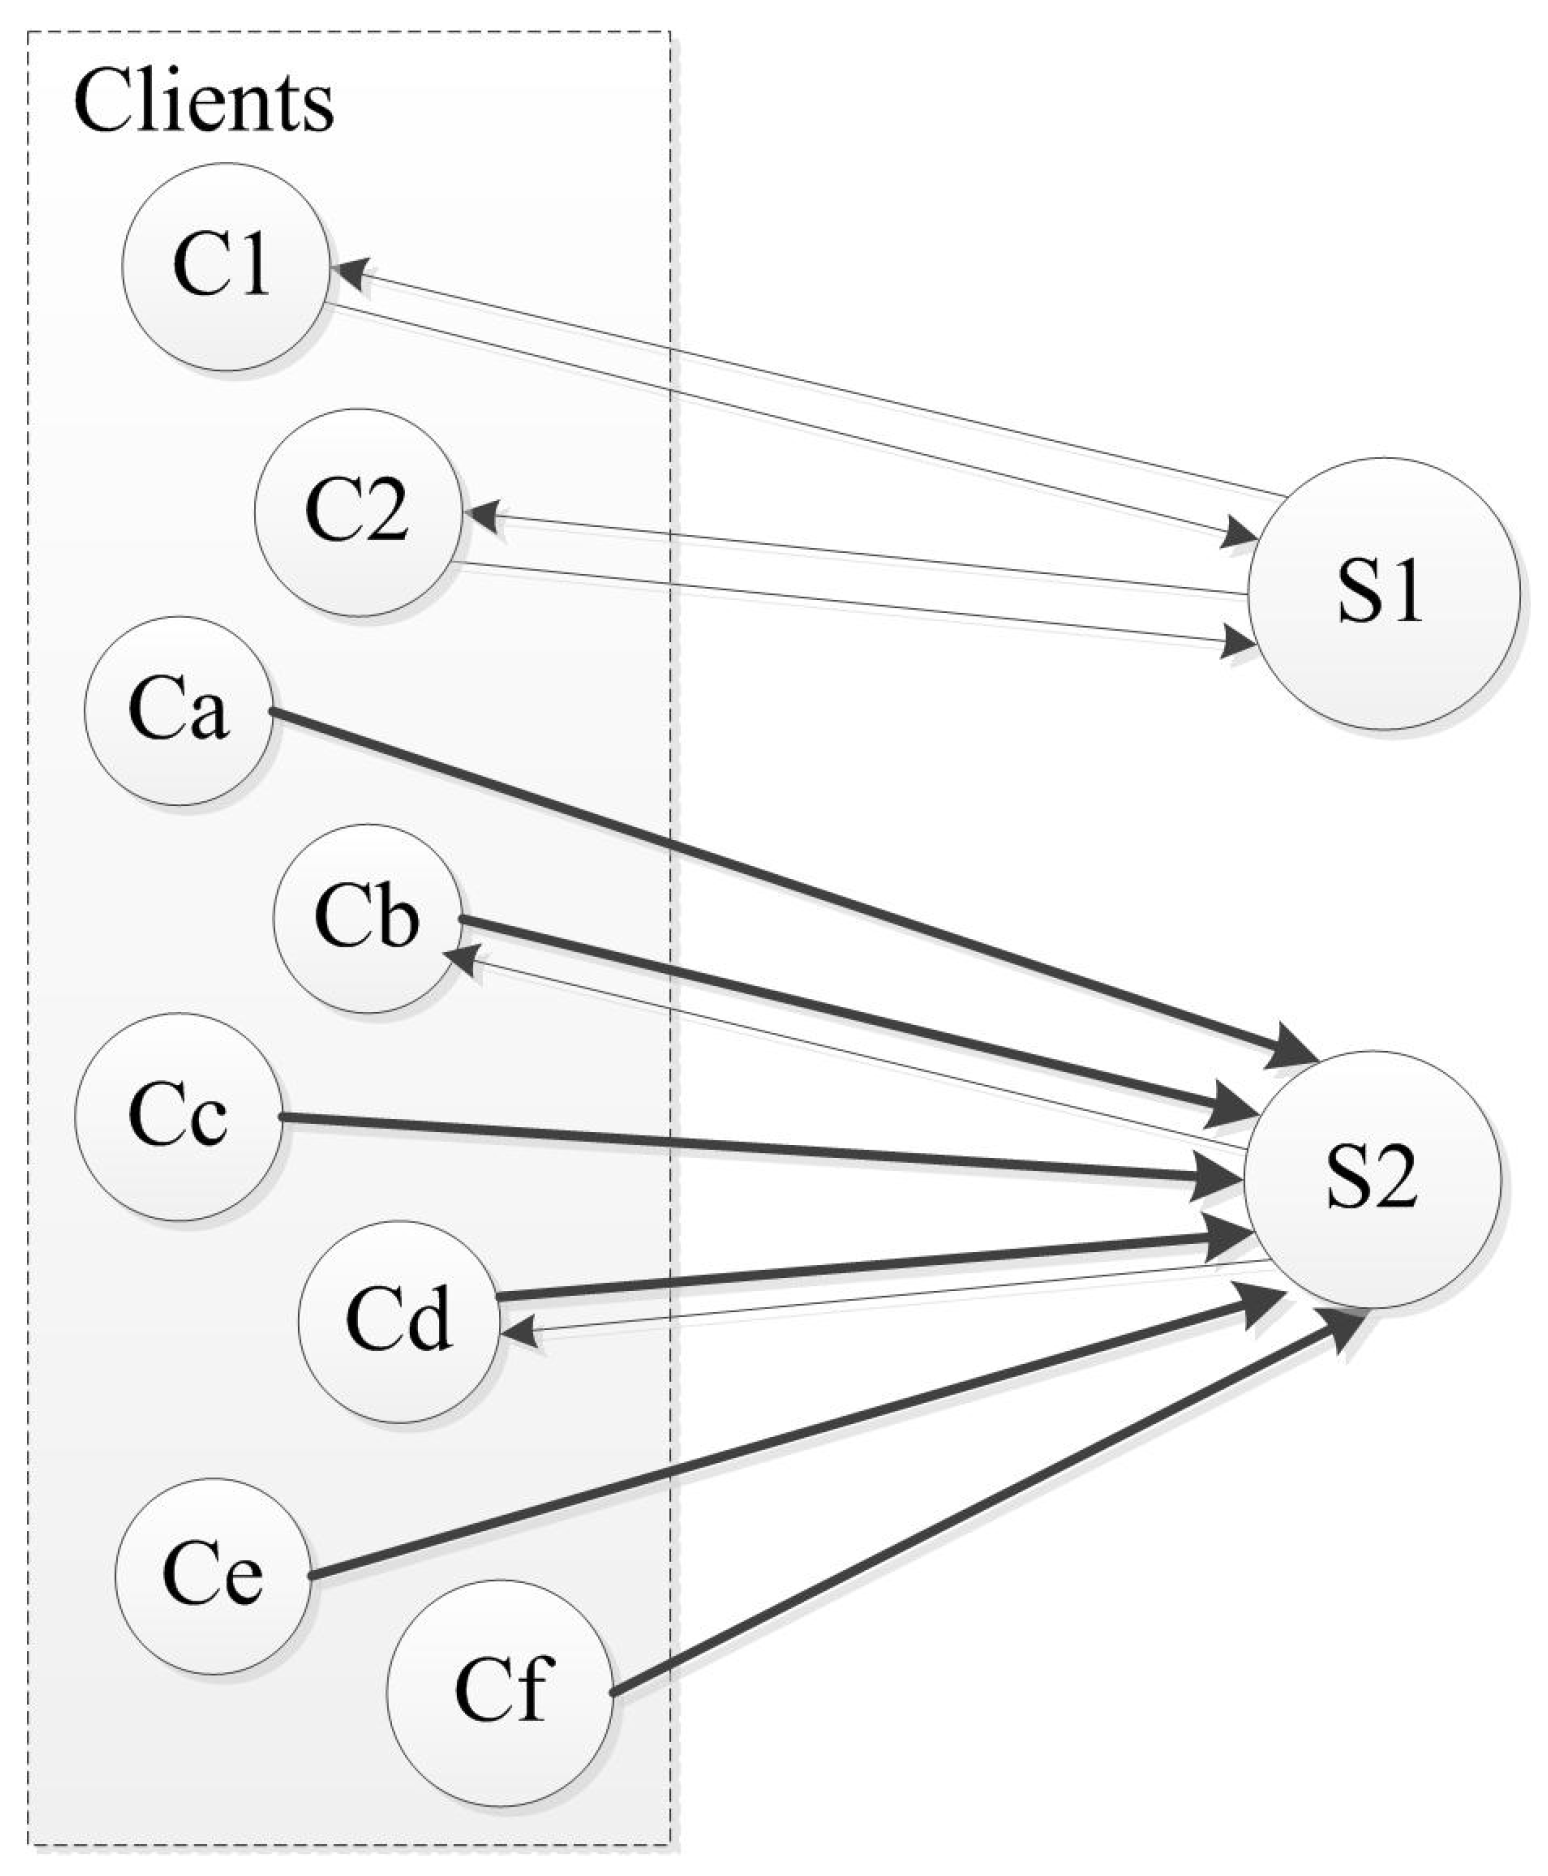
In terms of DDoS detection, there are mainly three kinds of approaches. The first is detecting the DDoS attacks based on the change of the traffic characteristics. The second is detecting the DDoS attacks based on analyzing the packet content or the packet feature. The third is detecting the DDoS attacks using the hybrid approach of the former two kinds. In this section, we propose a DDoS detection approach based on the change of the traffic characteristics. As shown in Figure 5, there exists dramatic differences between the normal traffic and the DDoS attacked traffic. When a DDoS attack occurs, the number of visits to the targeted servers or services will suddenly increase by tens, thousands or even tens of thousands of times. Along with the increased visits, the traffic to the targeted servers or services will also suddenly increase. In addition, because the purpose of DDoS attacks is to paralyze the targeted servers or services, the traffic to the servers or services is far more than that from the servers or services. According to these phenomena of the DDoS attack, this paper defines three typical variables to characterize the DDoS attack: (1) the visit volume P for each targeted server N; (2) the transmission rate P for flow traffic; and (3) the ratio P of the traffic into the servers and the traffic out the servers.
Based on these three typical variables P, P and P, this paper proposes a DDoS detection approach. In this proposed approach, the detecting process can be divided into two phases: The first phase is responsible for seeking for the suspected attacked servers based on the evaluation indicator P and choosing the corresponding switches to collect the related network status or statistics. The second phase is responsible for making further identification about the suspected attacked servers based on the evaluation indicators P and P.
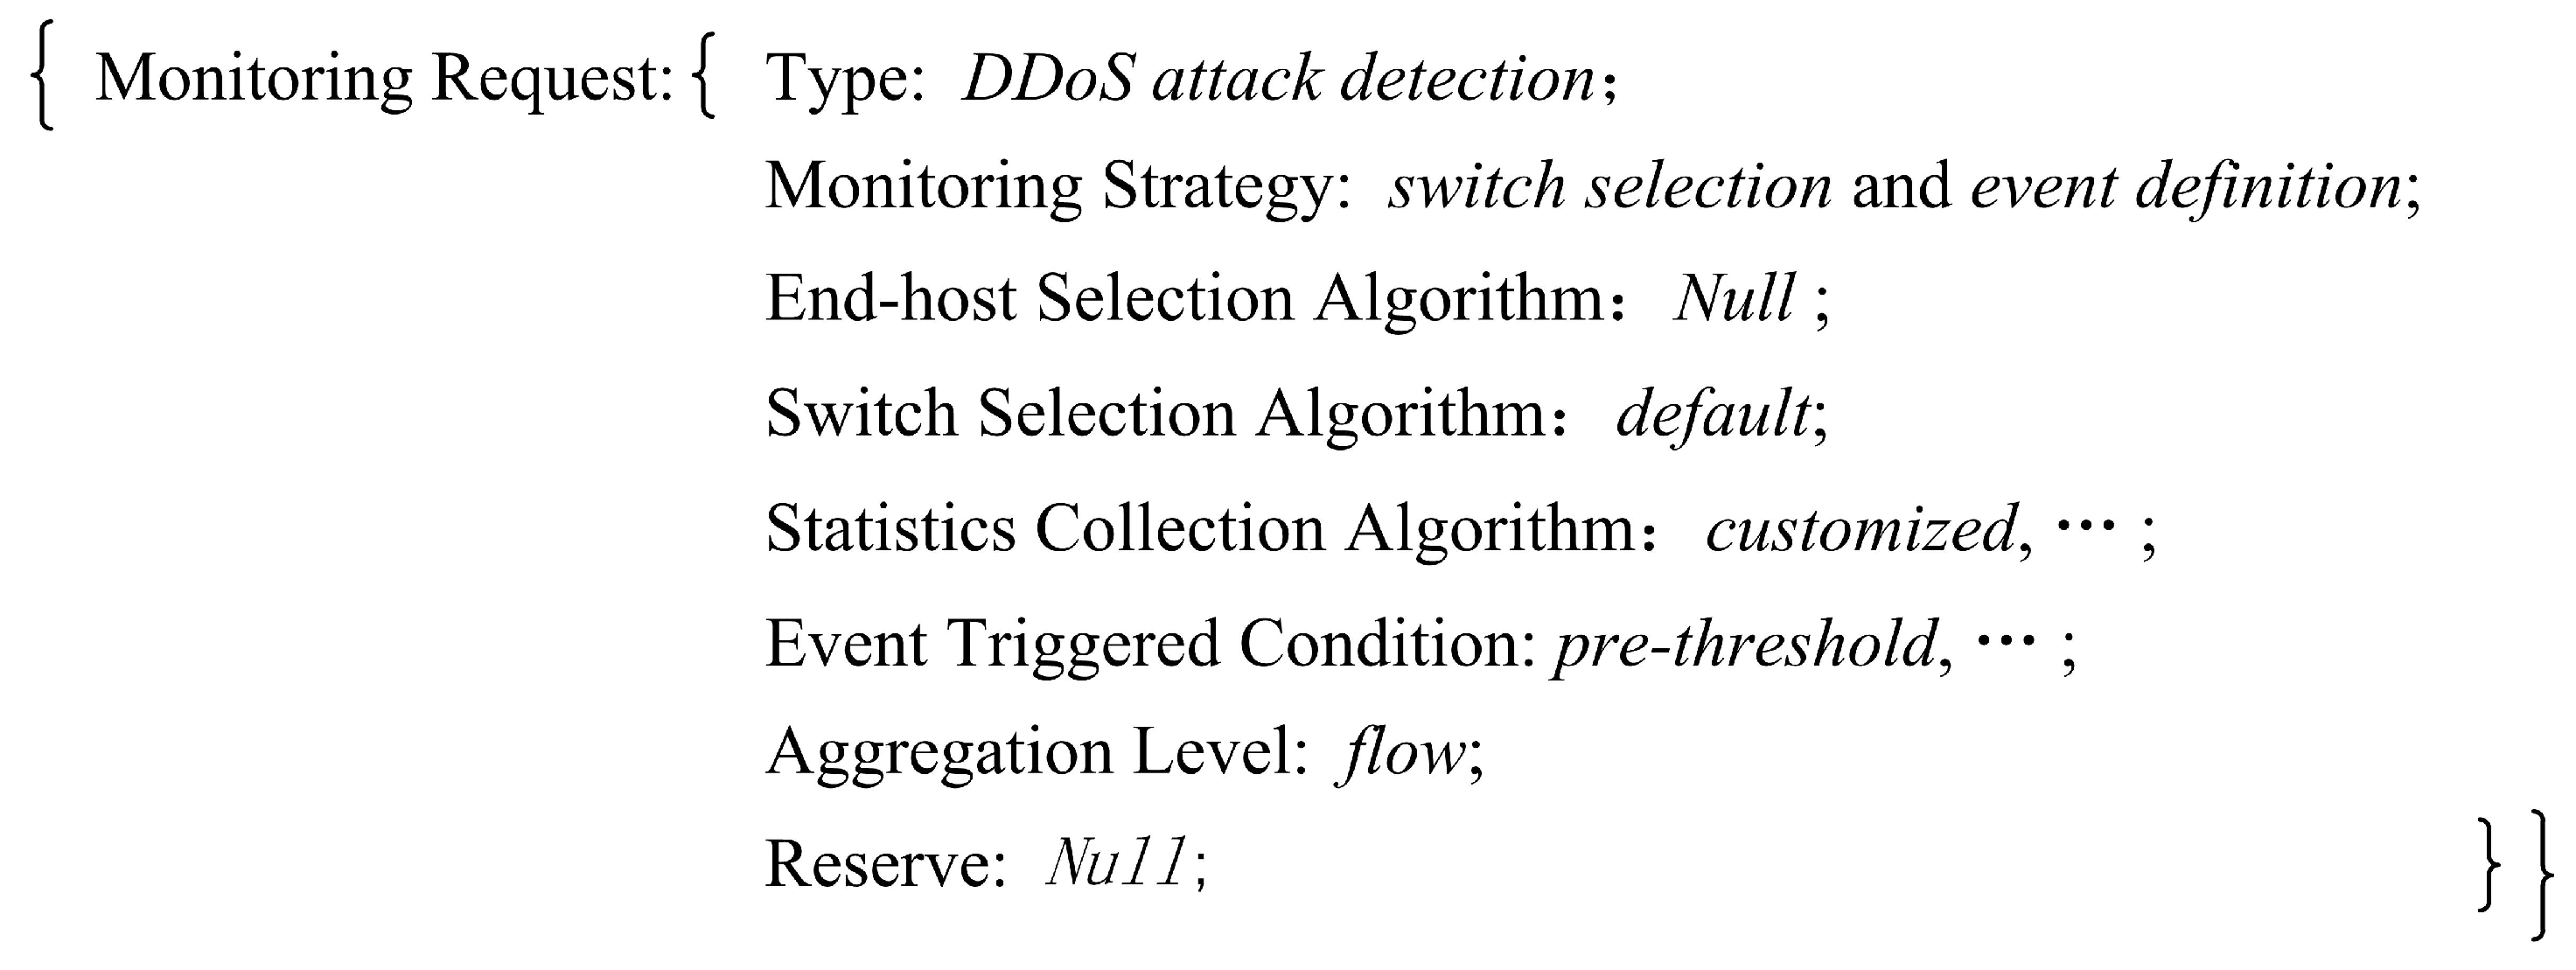
The DDoS detection is a classic monitoring problem and belongs to the second category of monitoring tasks. Obviously, the computing of the three typical variables is very important and collecting the related flow statistics is the core monitoring task of the proposed DDoS detection. According to the detecting process, the adopted monitoring strategy and the adopted detection algorithm can be designed in advance. The proposed DDoS detection adopts a hybrid monitoring strategy which involves the switch selection monitoring strategy and event definition monitoring strategy. To efficiently carry out the monitoring task, the hybrid monitoring strategy uses customized switch selection algorithm and flow statistics collection algorithm instead of the default algorithm. The specific monitoring request of the proposed DDoS detection is described in Figure 6. The design information about the proposed DDoS detection can be initially installed in the form of configure file in FlexMonitor. In the proposed DDoS Detection, the monitoring task is mainly collecting the number of active flows to compute the variable P and collecting the byte statistics of related flows to compute the variables P and P. Therefore, the value flow is specified as the aggregation level in the monitoring request.
4.2. Detection Algorithm
There are mainly two advantages of the proposed DDoS detection approach. Firstly, it can characterize the DDoS attack more accurately through the defined three typical variables P, P and P. Secondly, it can leverage the central control functionality and the event definition strategy of FlexMonitor to maintain and collect the flow information for DDoS detection, which reduces the complexity of DDoS detection to a great extent.
Assume T denotes a monitoring period and the proposed approach will compute the three variables P, P and P at the end of each monitoring period. The pseudo-code of the proposed approach is shown in Algorithm 1. Lines 1–7 describe the first phase of the proposed approach and Lines 8–16 describe the second phase of the proposed approach. In the first phase, the controller computes the change rate of the variable P according to the real-time active flow list in the controller. In SDN, when a new flow arrives, the switch will send the corresponding PacketIn packet to the controller and when a flow is no longer active, the switch will send the corresponding FlowRemoved packet to the controller. Therefore, the active flow list can be timely maintained by the controller. If the change rate of the variable P for a server or service is greater than the value , the corresponding server would be added into the suspected attacked server set. To make further identification, the controller needs to collect some related status and statistics information from the network. For each suspected attacked server or service, the controller often pointedly chooses the corresponding nearest edge switches to make the related status and statistics collection. By this way, the controller can avoid incurring too much monitoring overhead during the monitoring. In the second phase, the controller computes the change rate of the variable P and P for each suspected attacked server or service. Based on FlexMonitor, the approach can adopt two monitoring methods to collect the network status and statistics information: deploying the network event triggers and using customized flow statistics collection algorithm. By combining these two monitoring methods, it can efficiently obtain the required information for computing the change rate of the variable P and P. Regarding the network event trigger, the proposed approach defines a specific threshold and its corresponding multiples as the triggering condition and defines the byte statistics of the traffic which is sent to and originated from the suspected attacked server as the basic monitoring data. When the byte statistics of the targeted traffic reaches the triggering condition, the switch would send a triggering message including the corresponding byte statistics to the controller. In this way, the byte statistics information can be collected at low cost. Regarding another monitoring way, it is used to overcome the shortage of the network event trigger in the flow statistics collection. For the suspected attacked servers the total byte statistics of which do not exceed the defined threshold, deploying network event triggers cannot collect its corresponding byte statistics. In this case, the proposed approach uses customized flow statistics collection algorithm to pointedly poll the byte statistics at the end of each monitoring period. If the change rates of P and P for the suspected attacked server or service are greater than the values and , respectively, it is determined that the corresponding server or service is attacked by DDoS.
| Algorithm 1 DDoS detection. |
Input: Des_List, ActiveFlow_List Output: Attacked_Target_Set
|
Assume n denotes the number of the destinations in the network, which is equals to the size of the array Des_List, and m denotes the active flows in the network, which is equals to the size of the array ActiveFlow_List. Considering the suspected attacked target list is conditionally obtained from the array Des_List, its size is much smaller than the number of the destinations. Therefore, according to Algorithm 1, its complexity is O(n*m).
5. Evaluation
We implemented the proposed DDoS detection approach and evaluated its detecting performance based on the NetMagic platform. The experimental results show that the proposed DDoS detection approach can timely and accurately detect the DDoS attack at low cost. These results also indirectly show that FlexMonitor has greater flexibility, which can support various monitoring approaches.
5.1. Experimental Settings
In this experiment, we implemented the proposed DDoS detection approach based on NetMagic platform, which includes two parts: hardware platform and software platform [6]. The hardware platform is a combination of commodity Ethernet switch chip and FPGA. The former provides the function of fast data processing and the latter makes NetMagic platform reconfigurable. The software platform was implemented on the remote host and provided well-defined interface to control the hardware platform across networks. The communication between the two sub-platforms was complied to the NMac protocol.
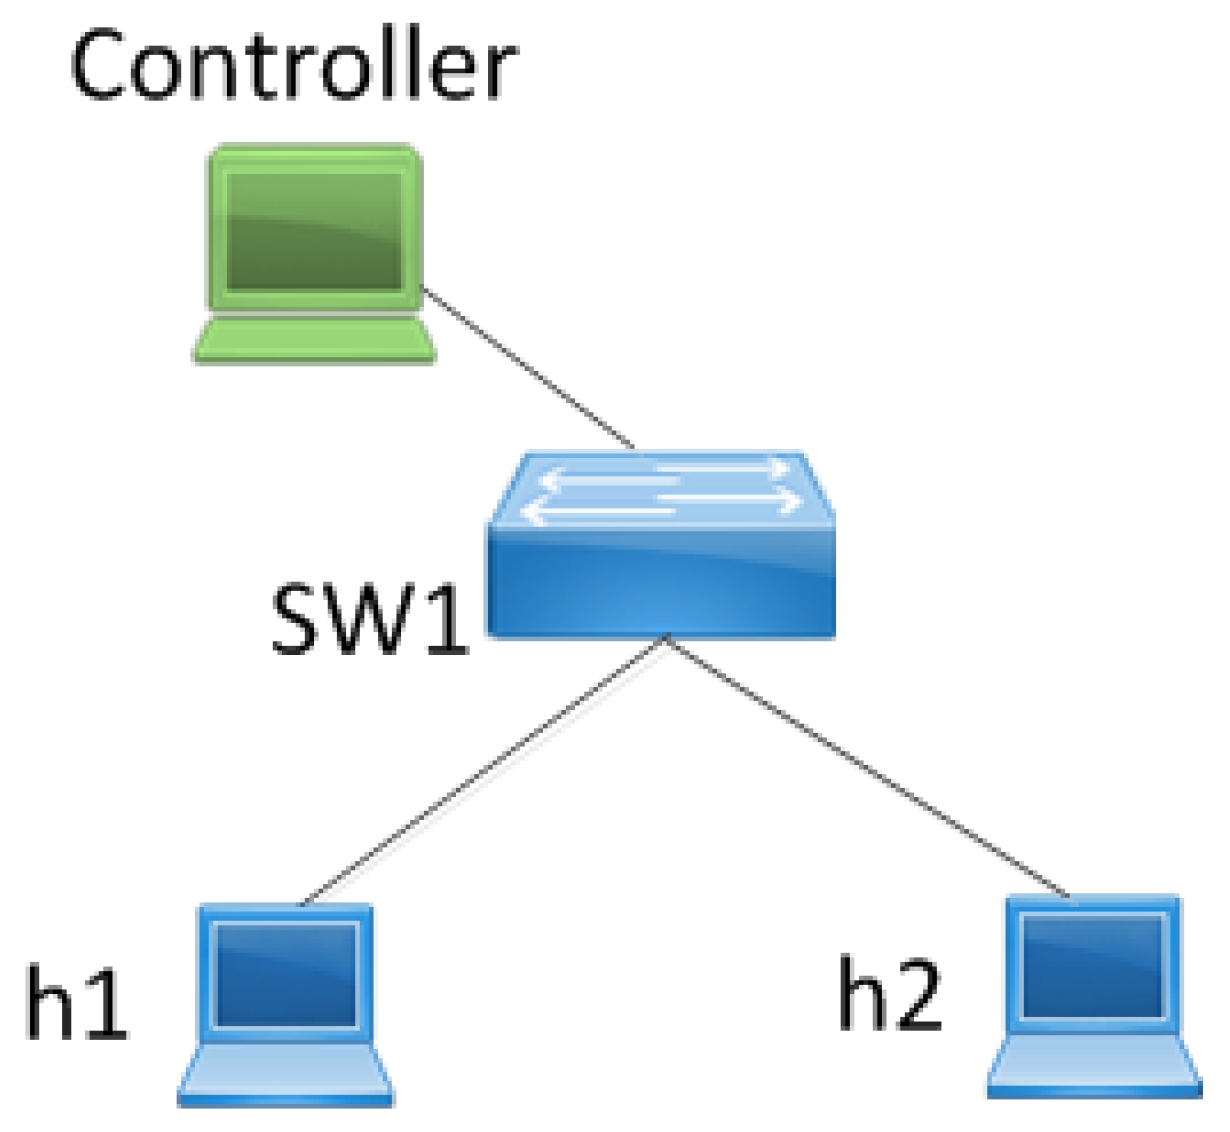
As shown in Figure 7, the experimental topology consisted of a NetMagic platform and three end hosts including the controller, h1 and h2, respectively. The controller was used to deploy the proposed DDoS detection approach, which can monitor the traffic through SW1. h1 and h2 were used as the client and the server, respectively, to simulate network traffic. In this experiment, 110 different clients were simulated by using 110 different client applications hosted on h1 and three different servers were simulated by using three different server applications hosted on h2.
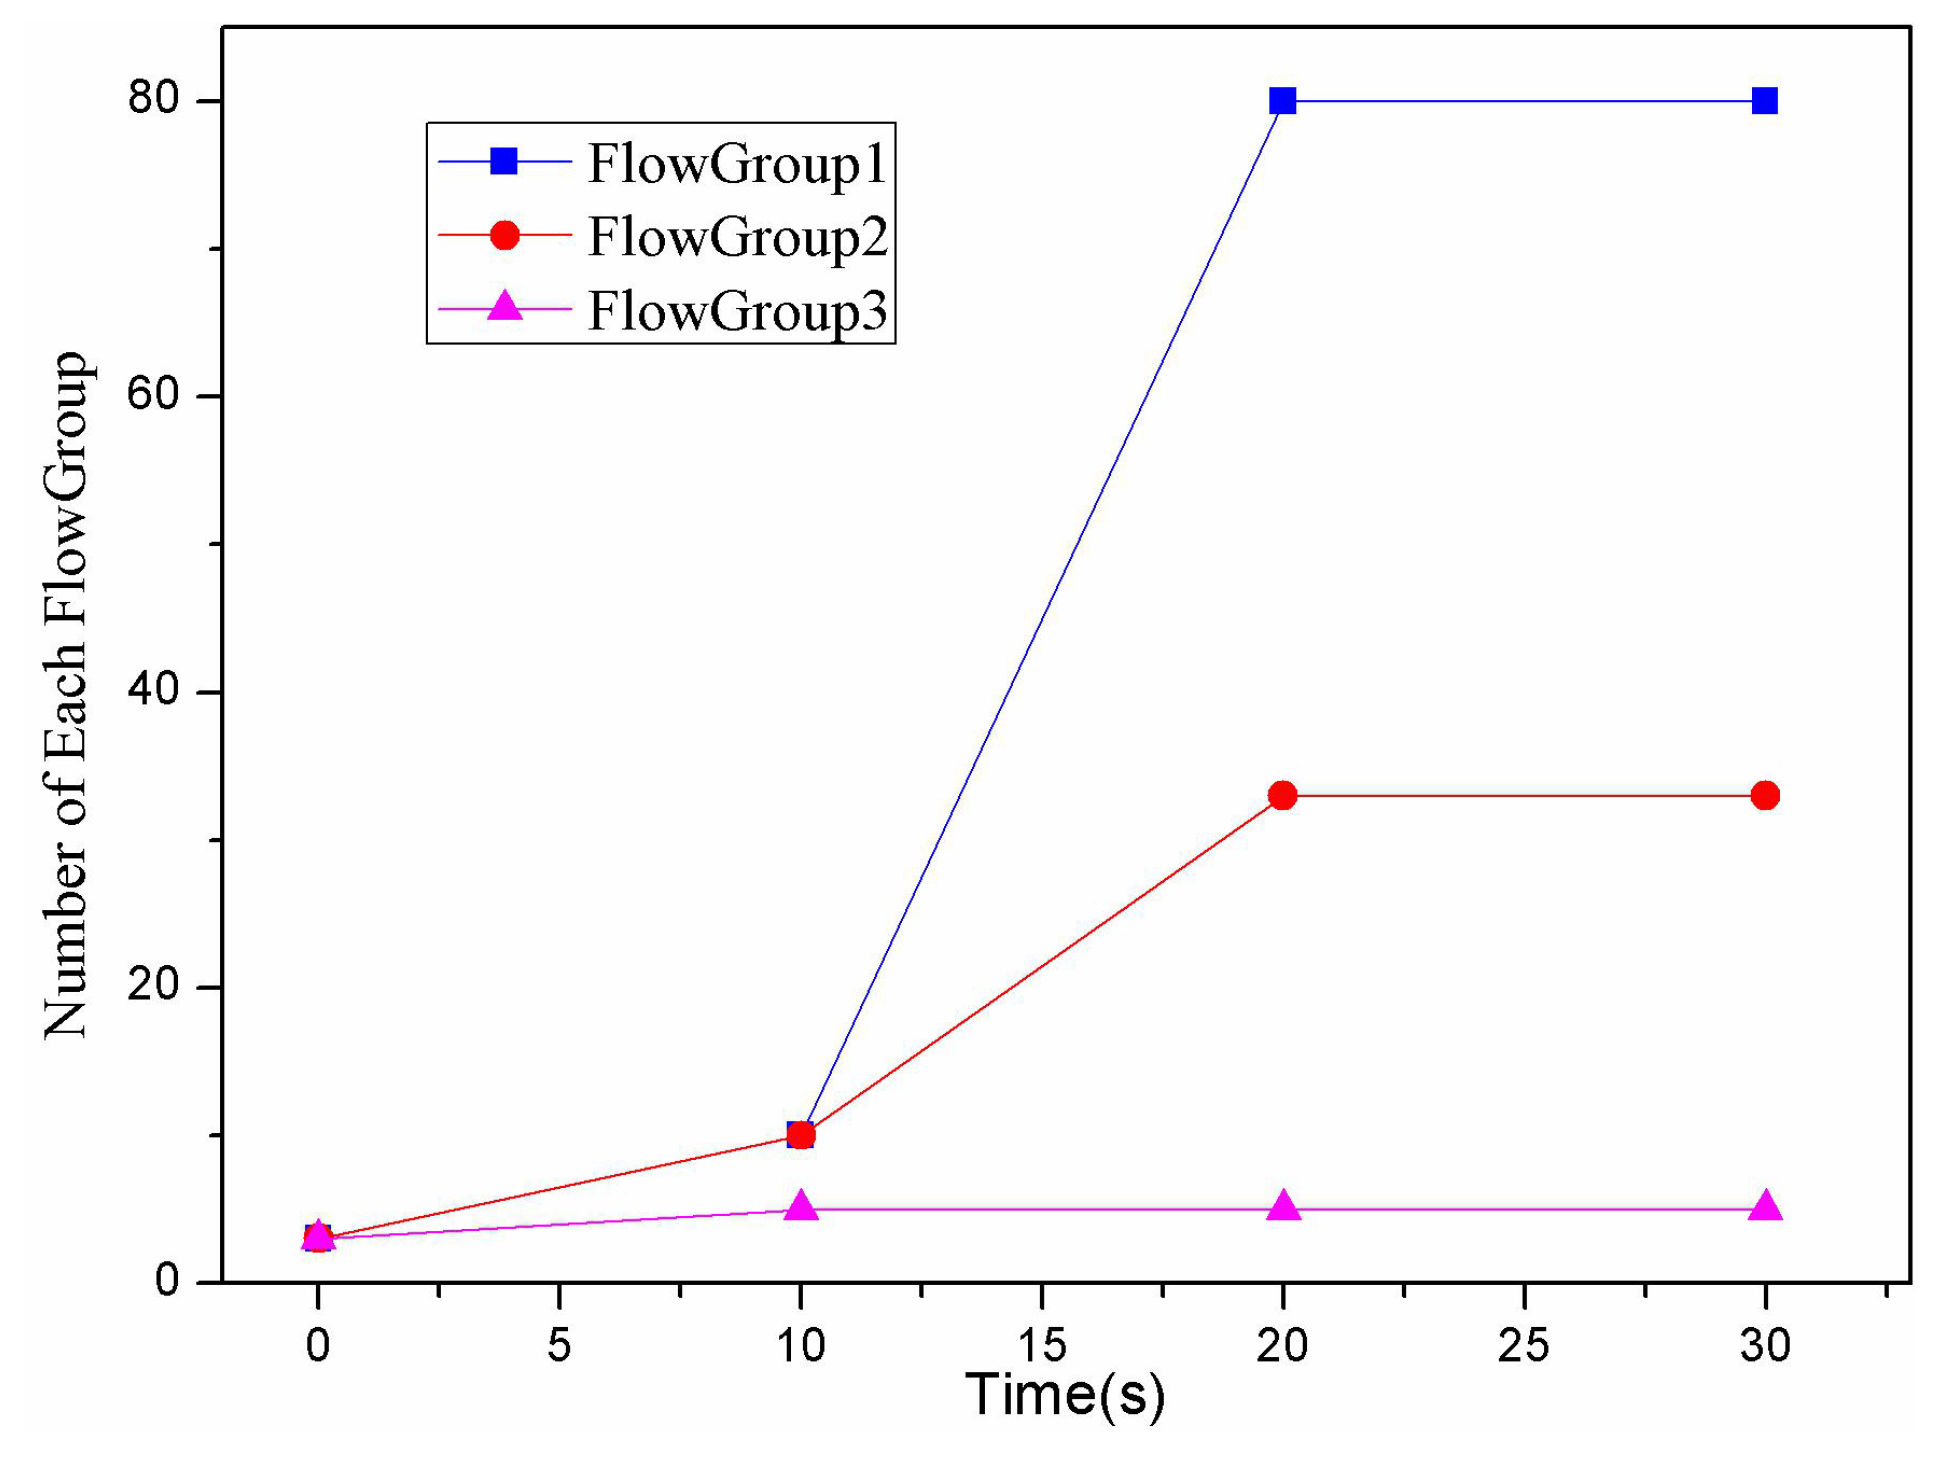
Assuming all the flows generated during visiting a specific application can be regarded as a flow group, there were three flow groups in total between h1 and h2. In terms of each flow group, the number of its corresponding flows was changing over the time and these flows could be classified into two kinds: (1) the flows originated by the client; and (2) the flows originated by the server. As shown in Table 2, the simulated three flow groups had different characteristics in terms of the visiting volume, the traffic rate and symmetry. Specifically, the number of the flows originated by the client in each flow group changed over time, as shown in Figure 8. In the first 10 s, the increase in the flow number of each flow group was quite small. Their corresponding flow number was nearly the same and remained about 5. From the tenth second, the increased flow numbers of Flow Group 1 and Flow Group 2 increased abruptly and significantly, reaching 70 and 20, respectively. The increased flow number of Flow Group 3 increased slightly, and was only 1 or 2. From the twentieth second, the flow number of these three flow groups no longer changed greatly.
5.2. Evaluation Metrics
The detecting performance was fully analyzed and compared among the proposed approach, OverWatch [24] and the baseline approach, which is generally based on the two factors (P and P) to detect DDoS attack and depends on the periodic polling to obtain the flow statistics information. OverWatch is also based on the two factors (P and P) to detect DDoS attack and also depends on the periodic polling to obtain the flow statistics information. However, the computing of the two factors and the collection of flow statistics information in OverWatch are finished in the switches. The controller in OverWatch would only receive the DDoS attack notification from the switches on the condition that the switch detects the DDoS attack. Considering the detection mechanism of the baseline approach and OverWatch is the same, we only discuss the cost of OverWatch with other two DDoS detection approaches in this section.
5.2.1. Detection Accuracy
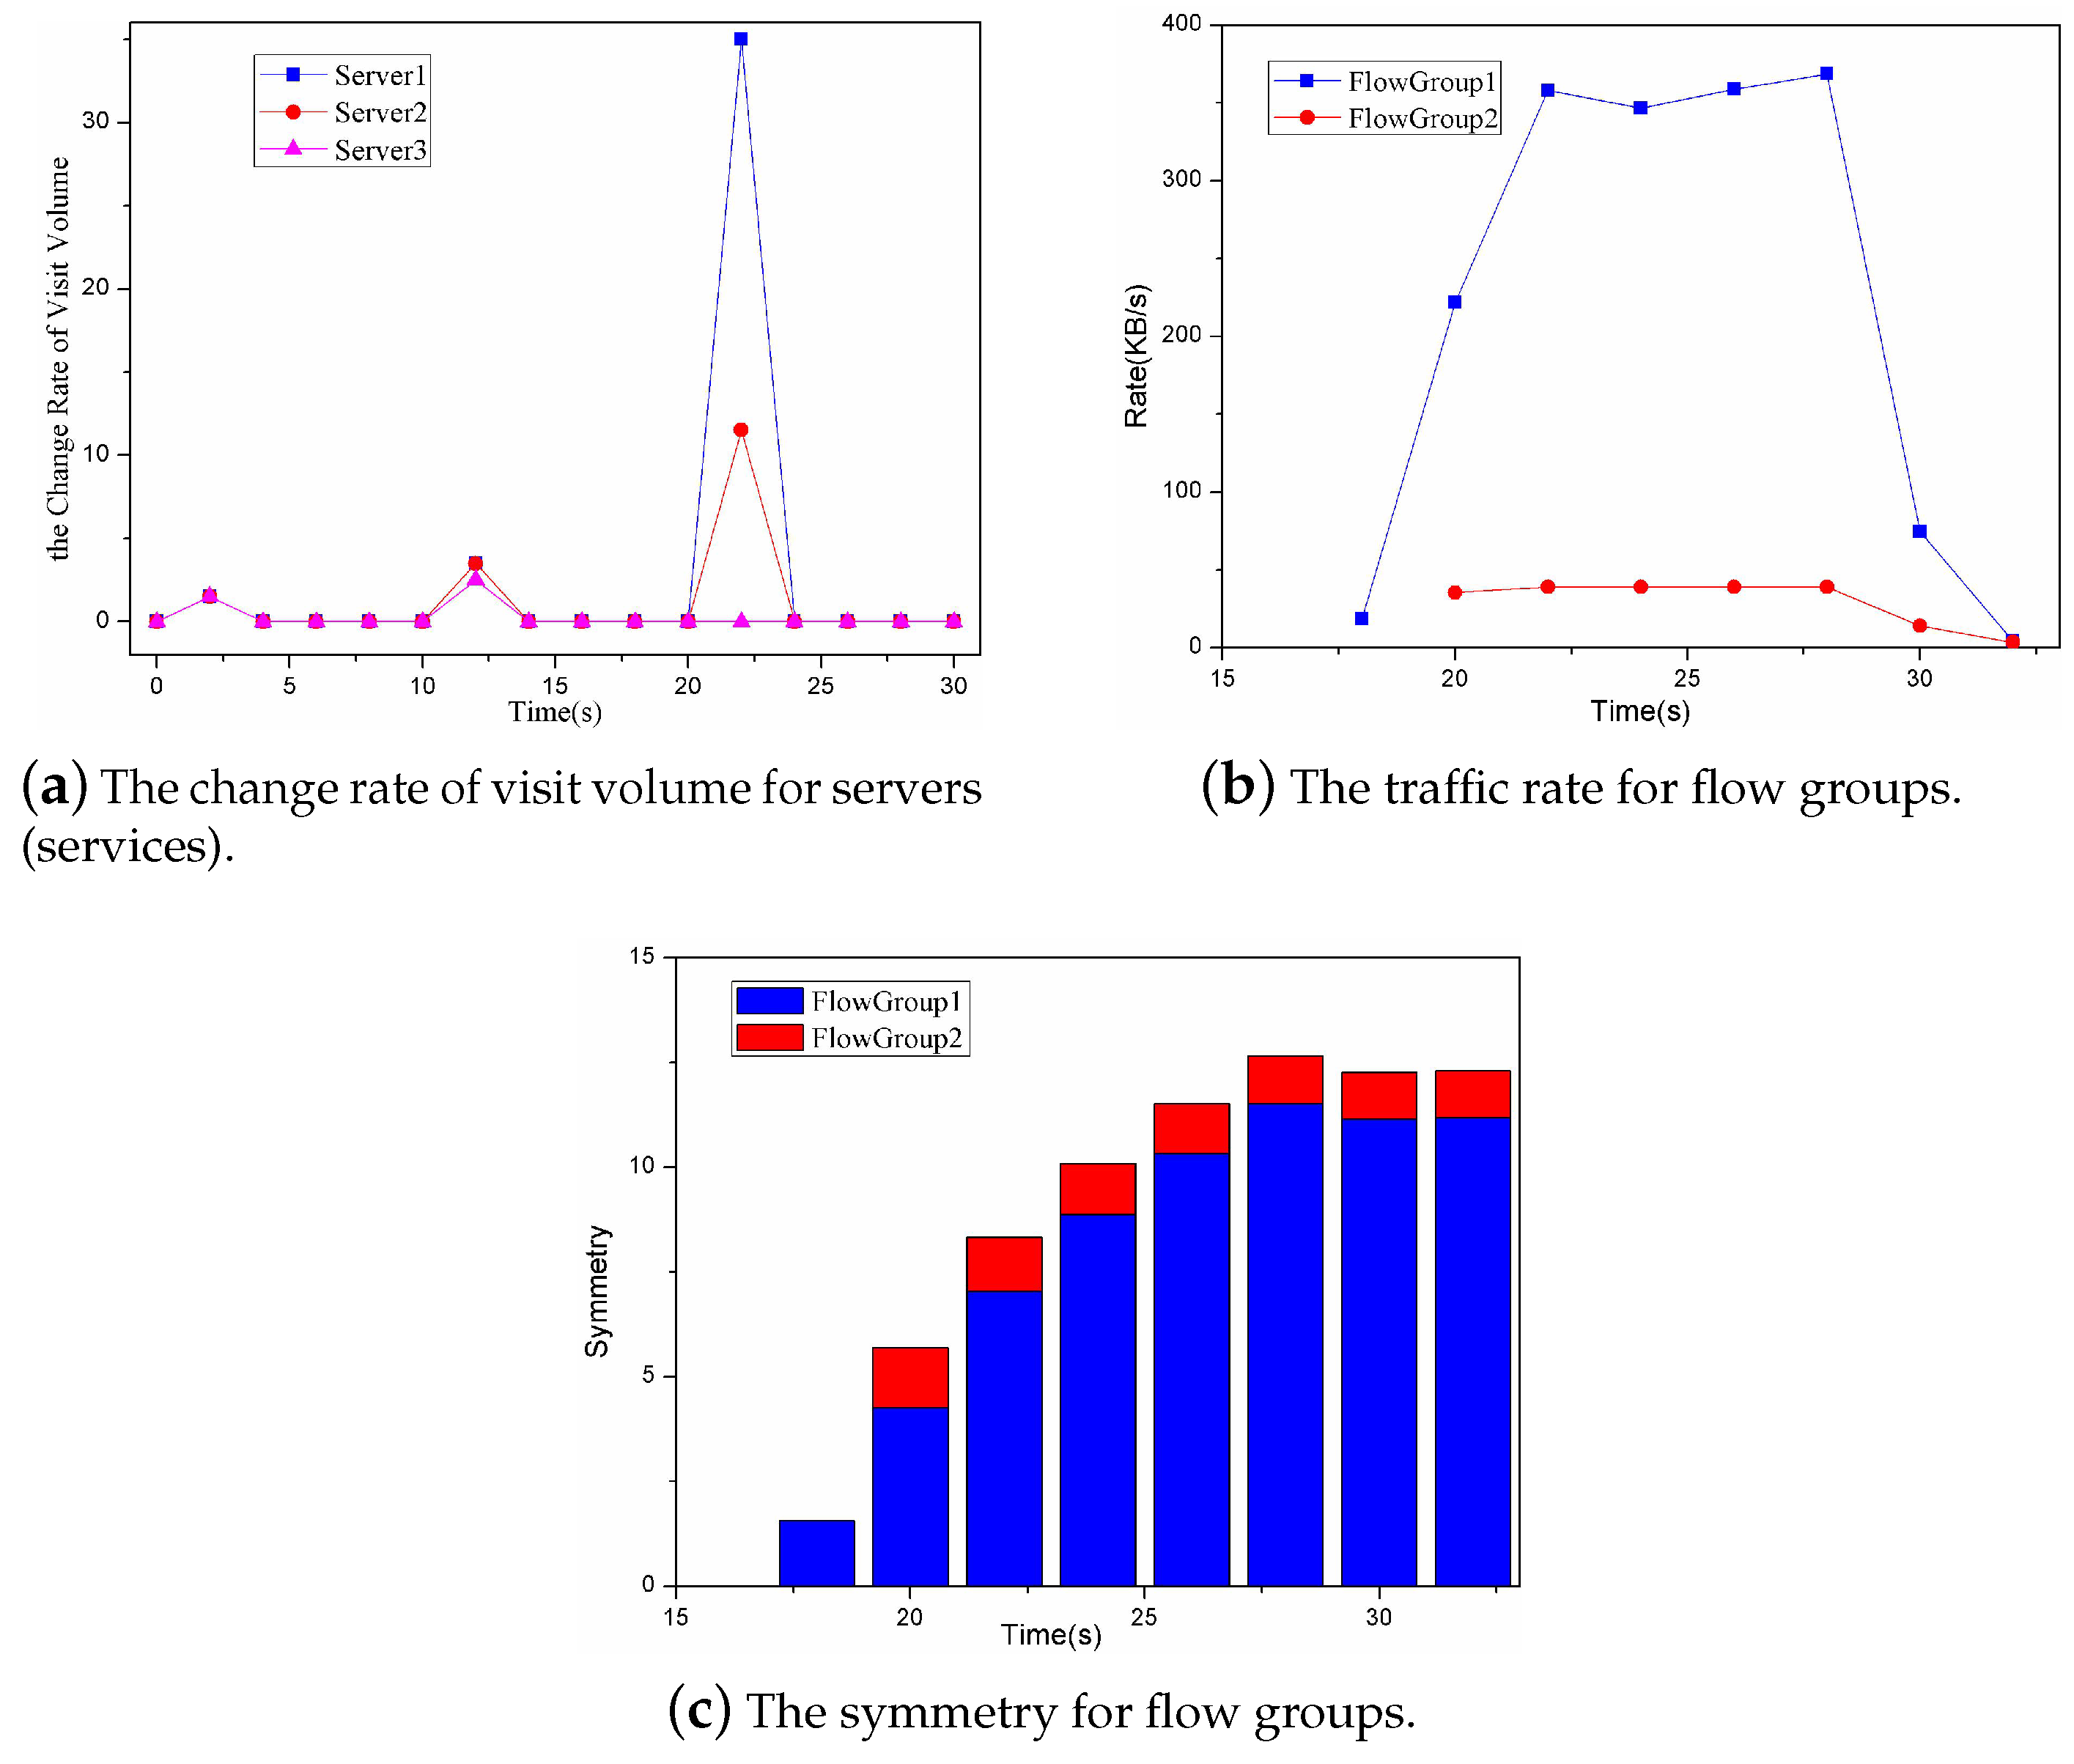
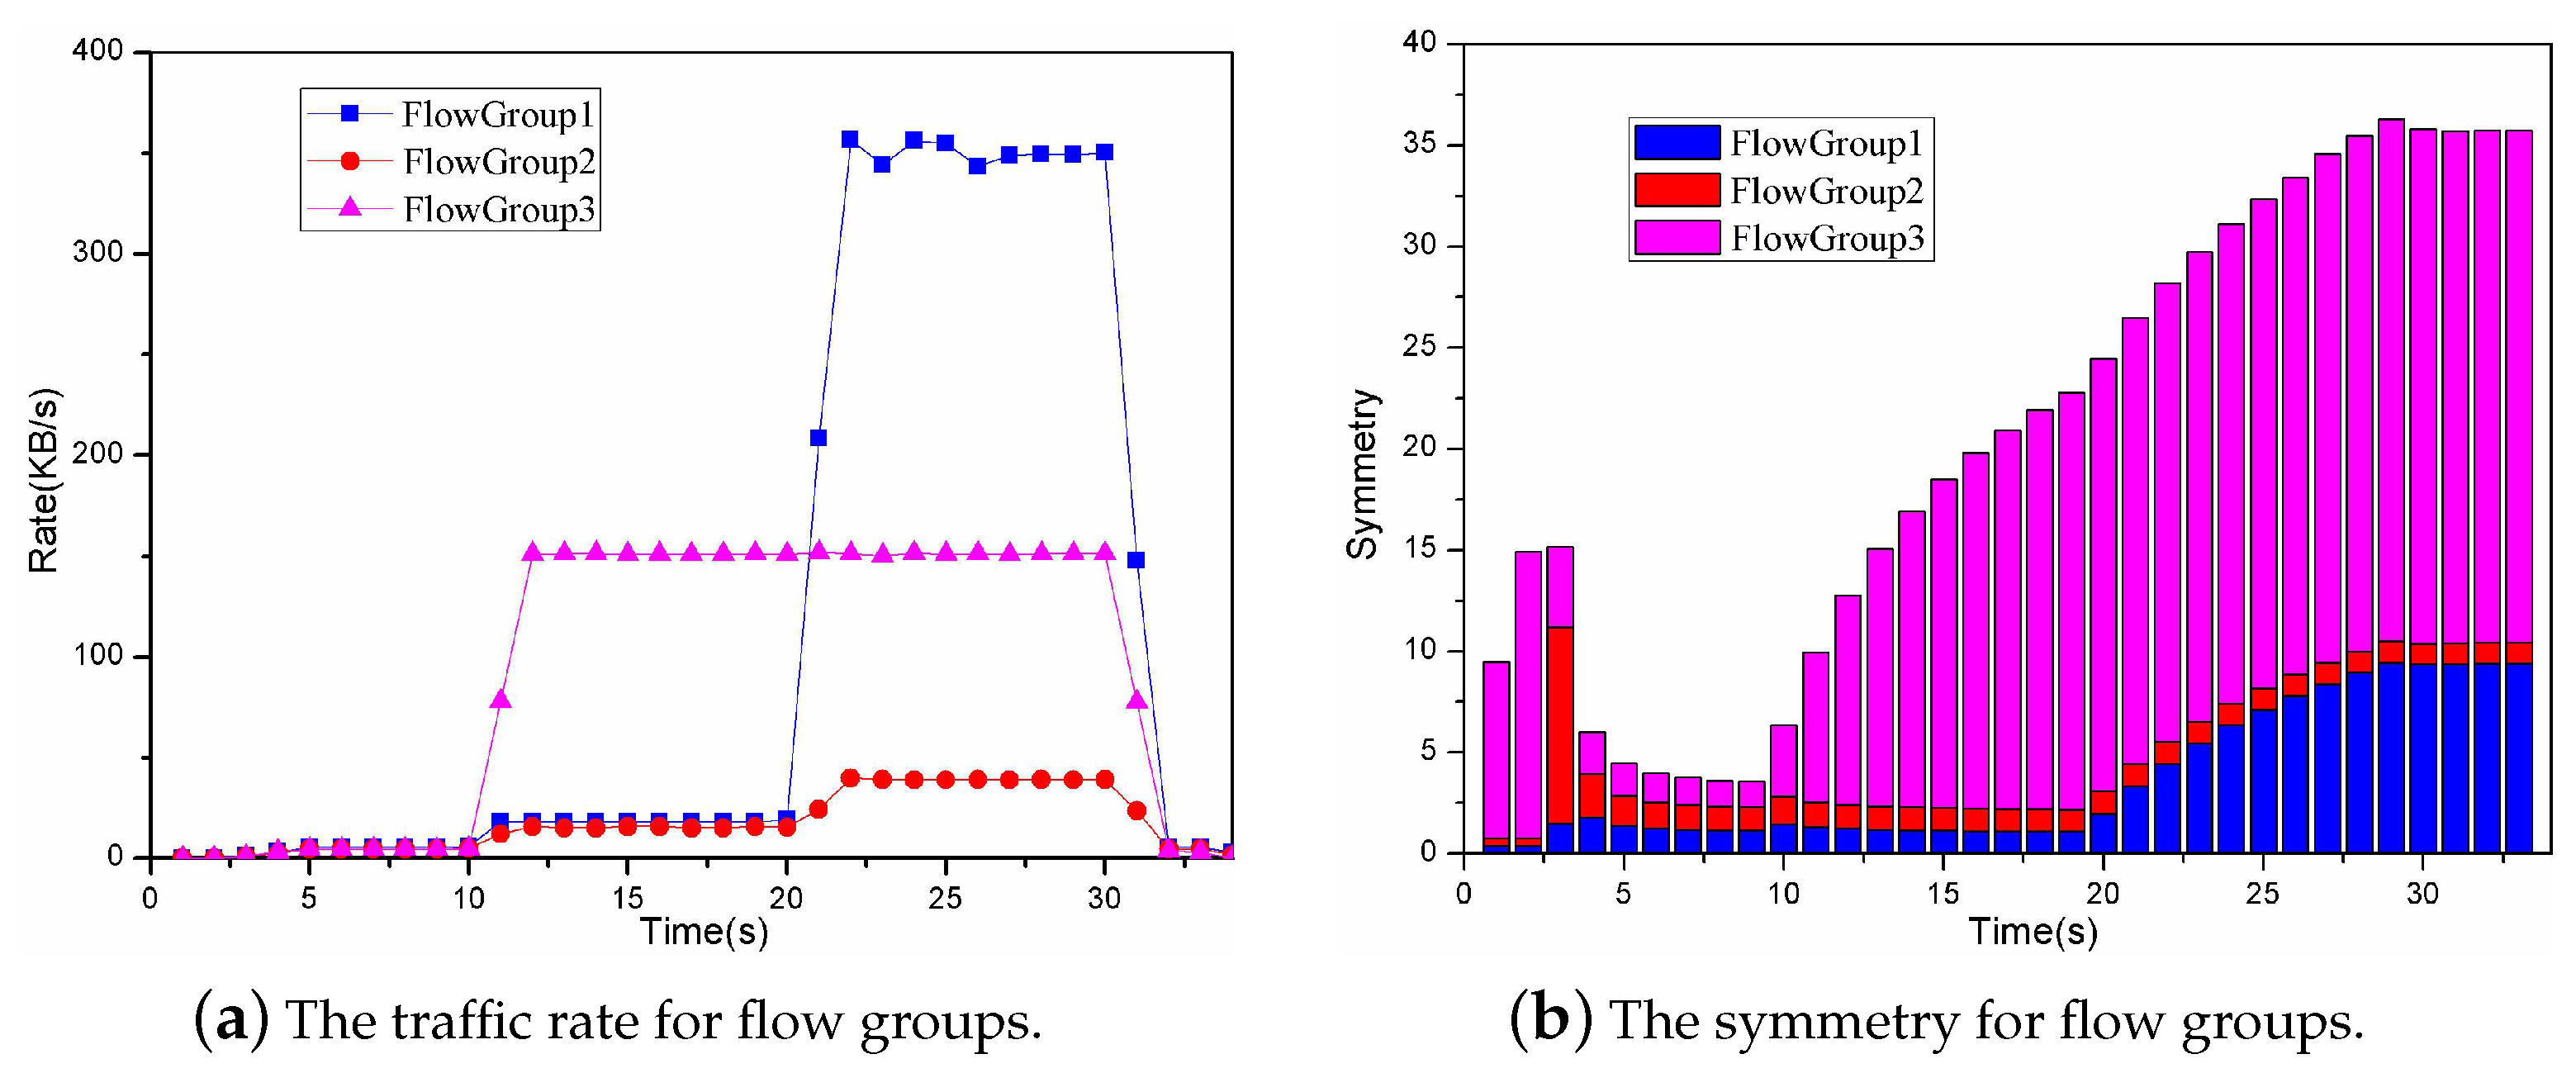
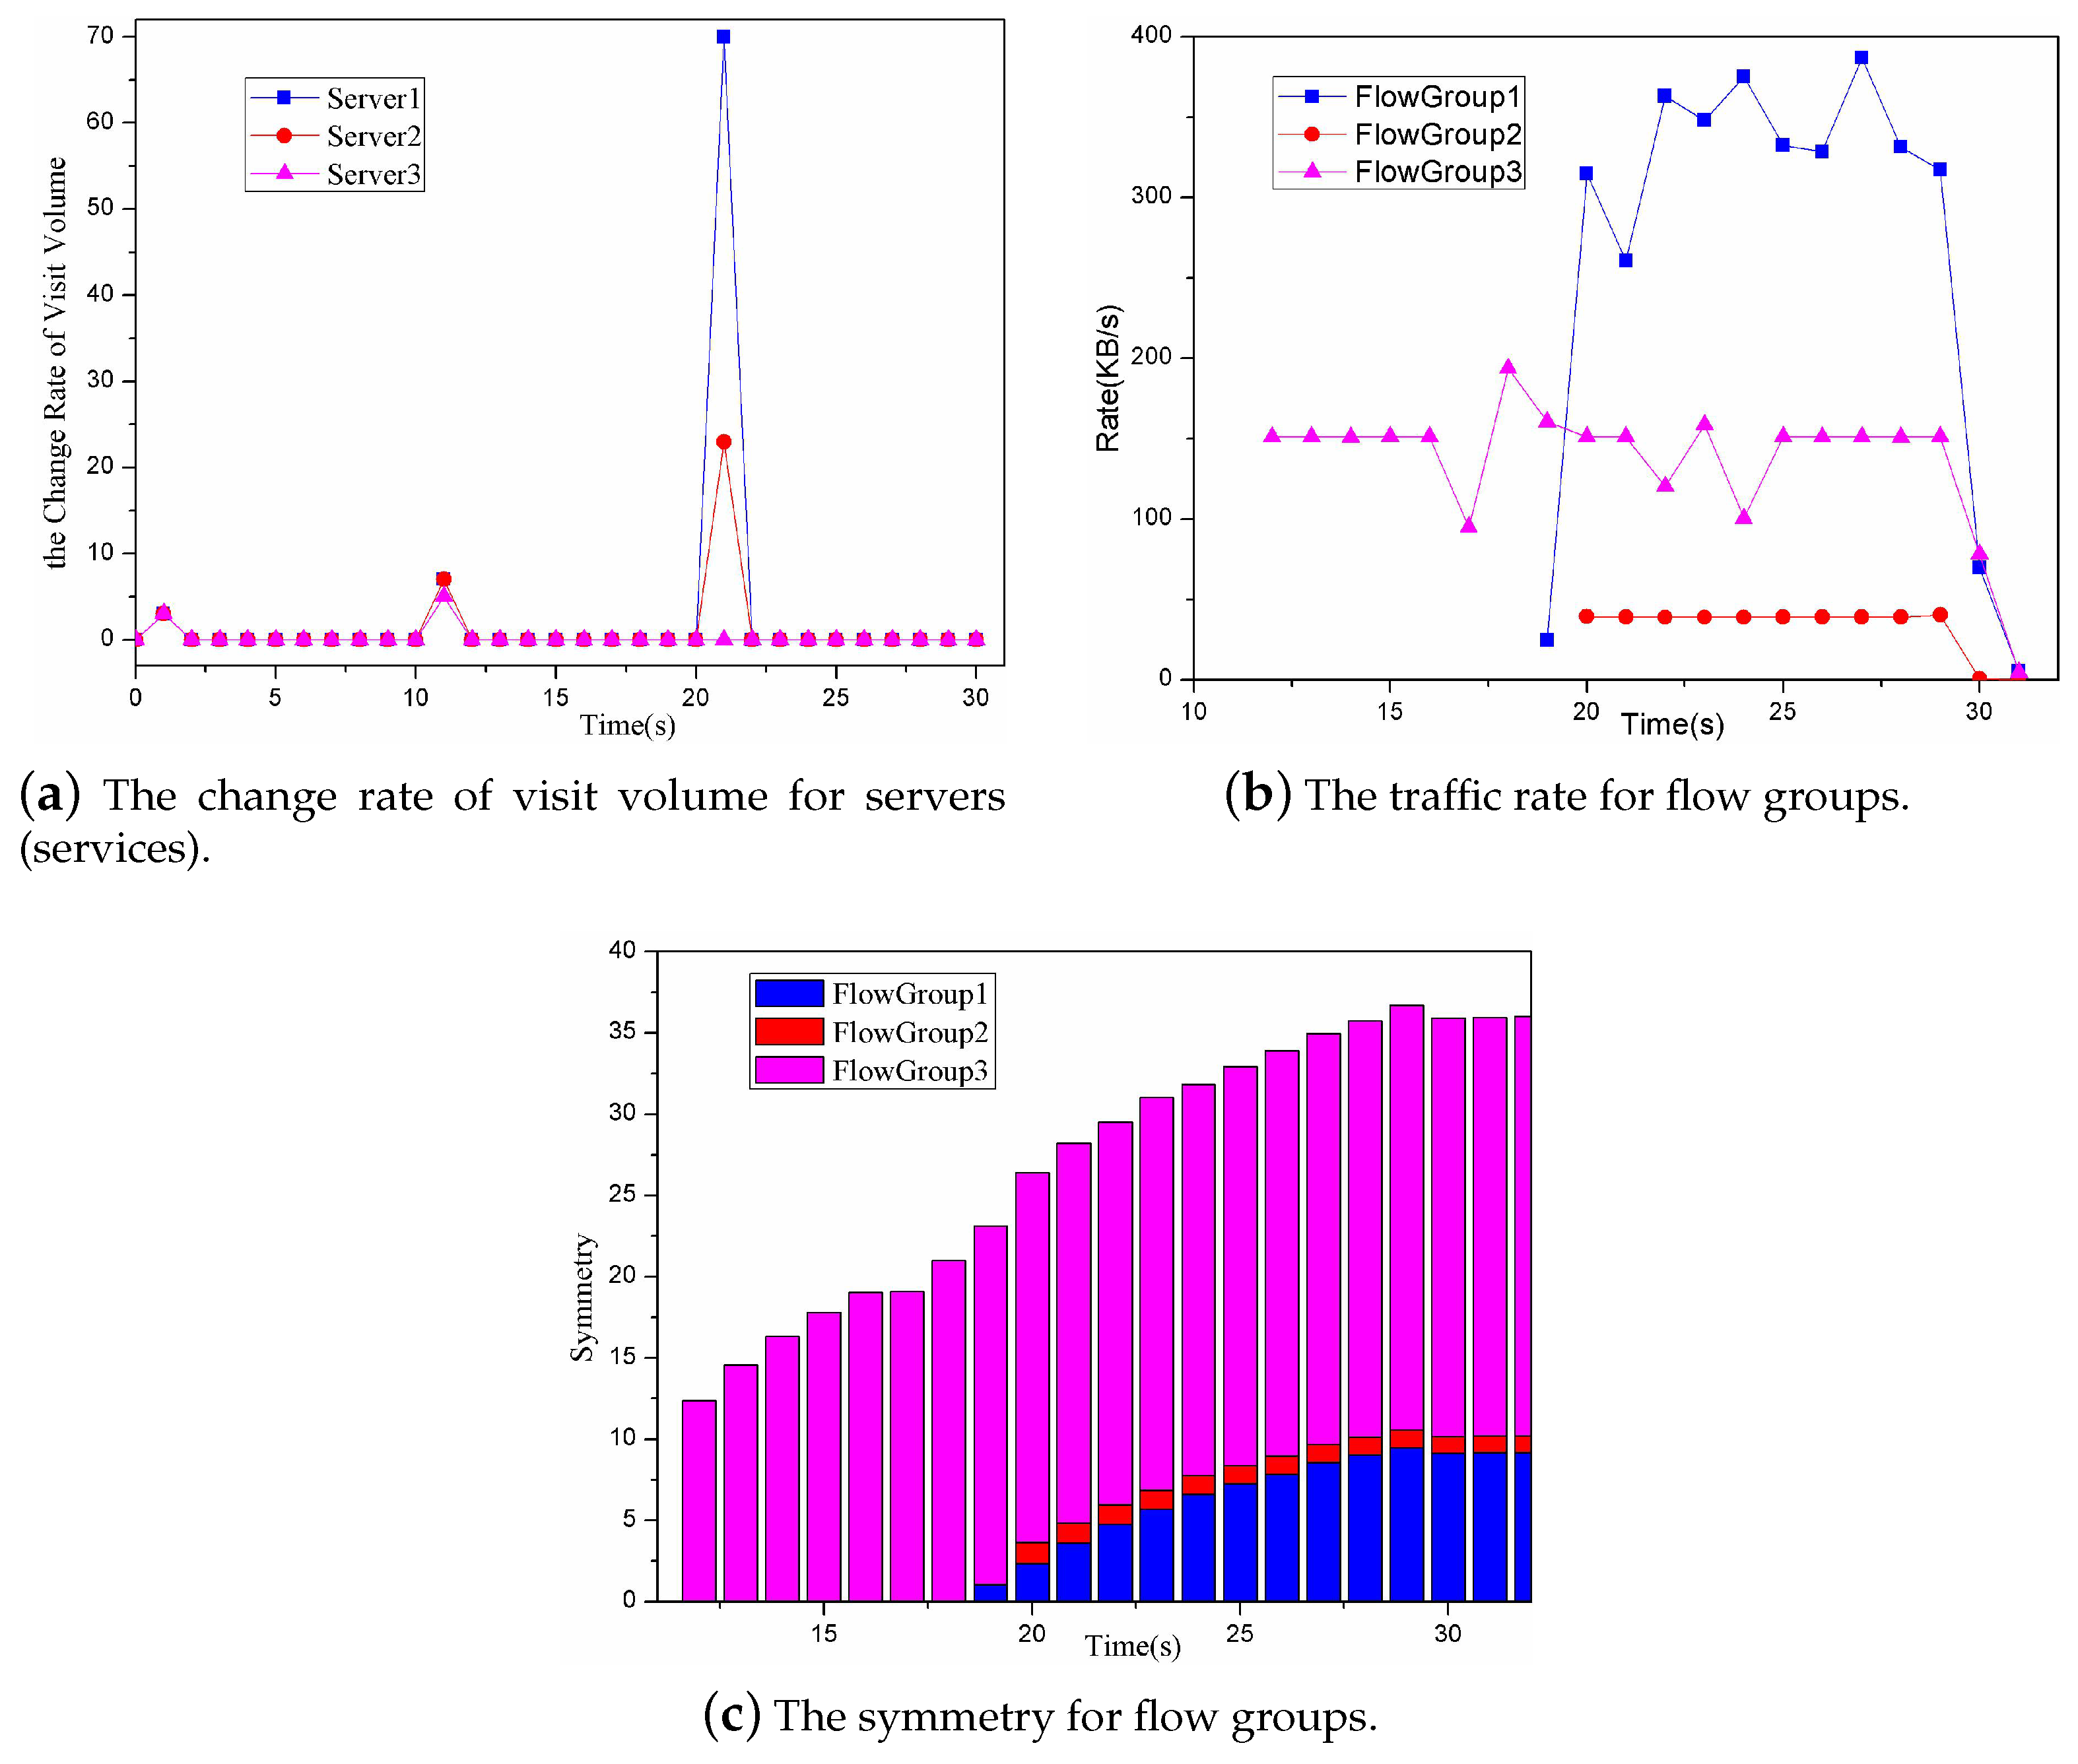
In this experiment, the proposed approach computed the three variables (P, P and P) to detect the DDoS attack and the change of these three variables is shown in Figure 9. The baseline approach computed the two variables (P and P) to detect the DDoS attack and the change of these two variables is shown in Figure 10. As shown in Figure 9a, the variable P for Flow Group 3 changed slightly. The ones for Flow Group 1 and Flow Group 2 changed greatly. Thus, it can be inferred that the DDoS attack does not exist in Flow Group 3 and the DDoS attack may exist in Flow Group 1 and Flow Group 2. As shown in Figure 9b,c, the variables P and P for Flow Group 1 changed greatly and for Flow Group 2 changed slightly over the time, especially after the twentieth second. Thus, it can be inferred that the DDoS attack exists in Flow Group 1. As shown in Figure 10a,b, the variables P and P for Flow Group 1 and Flow Group 3 all changed greatly over the time. Thus, it can be inferred that the DDoS attack exists in Flow Group 1 and Flow Group 3. However, the DDoS attack actually only exists in Flow Group 1. Therefore, the baseline approach made an error in the DDoS detection. The three variables P, P and P can completely characterize the DDoS attack and missing any factor will lead to the possibility of detecting errors.
In addition, the proposed approach can narrow the scope of the detection through computing the variable P. By this way, it can detect the DDoS attack pointedly and in a timely manner.
5.2.2. Different Threshold
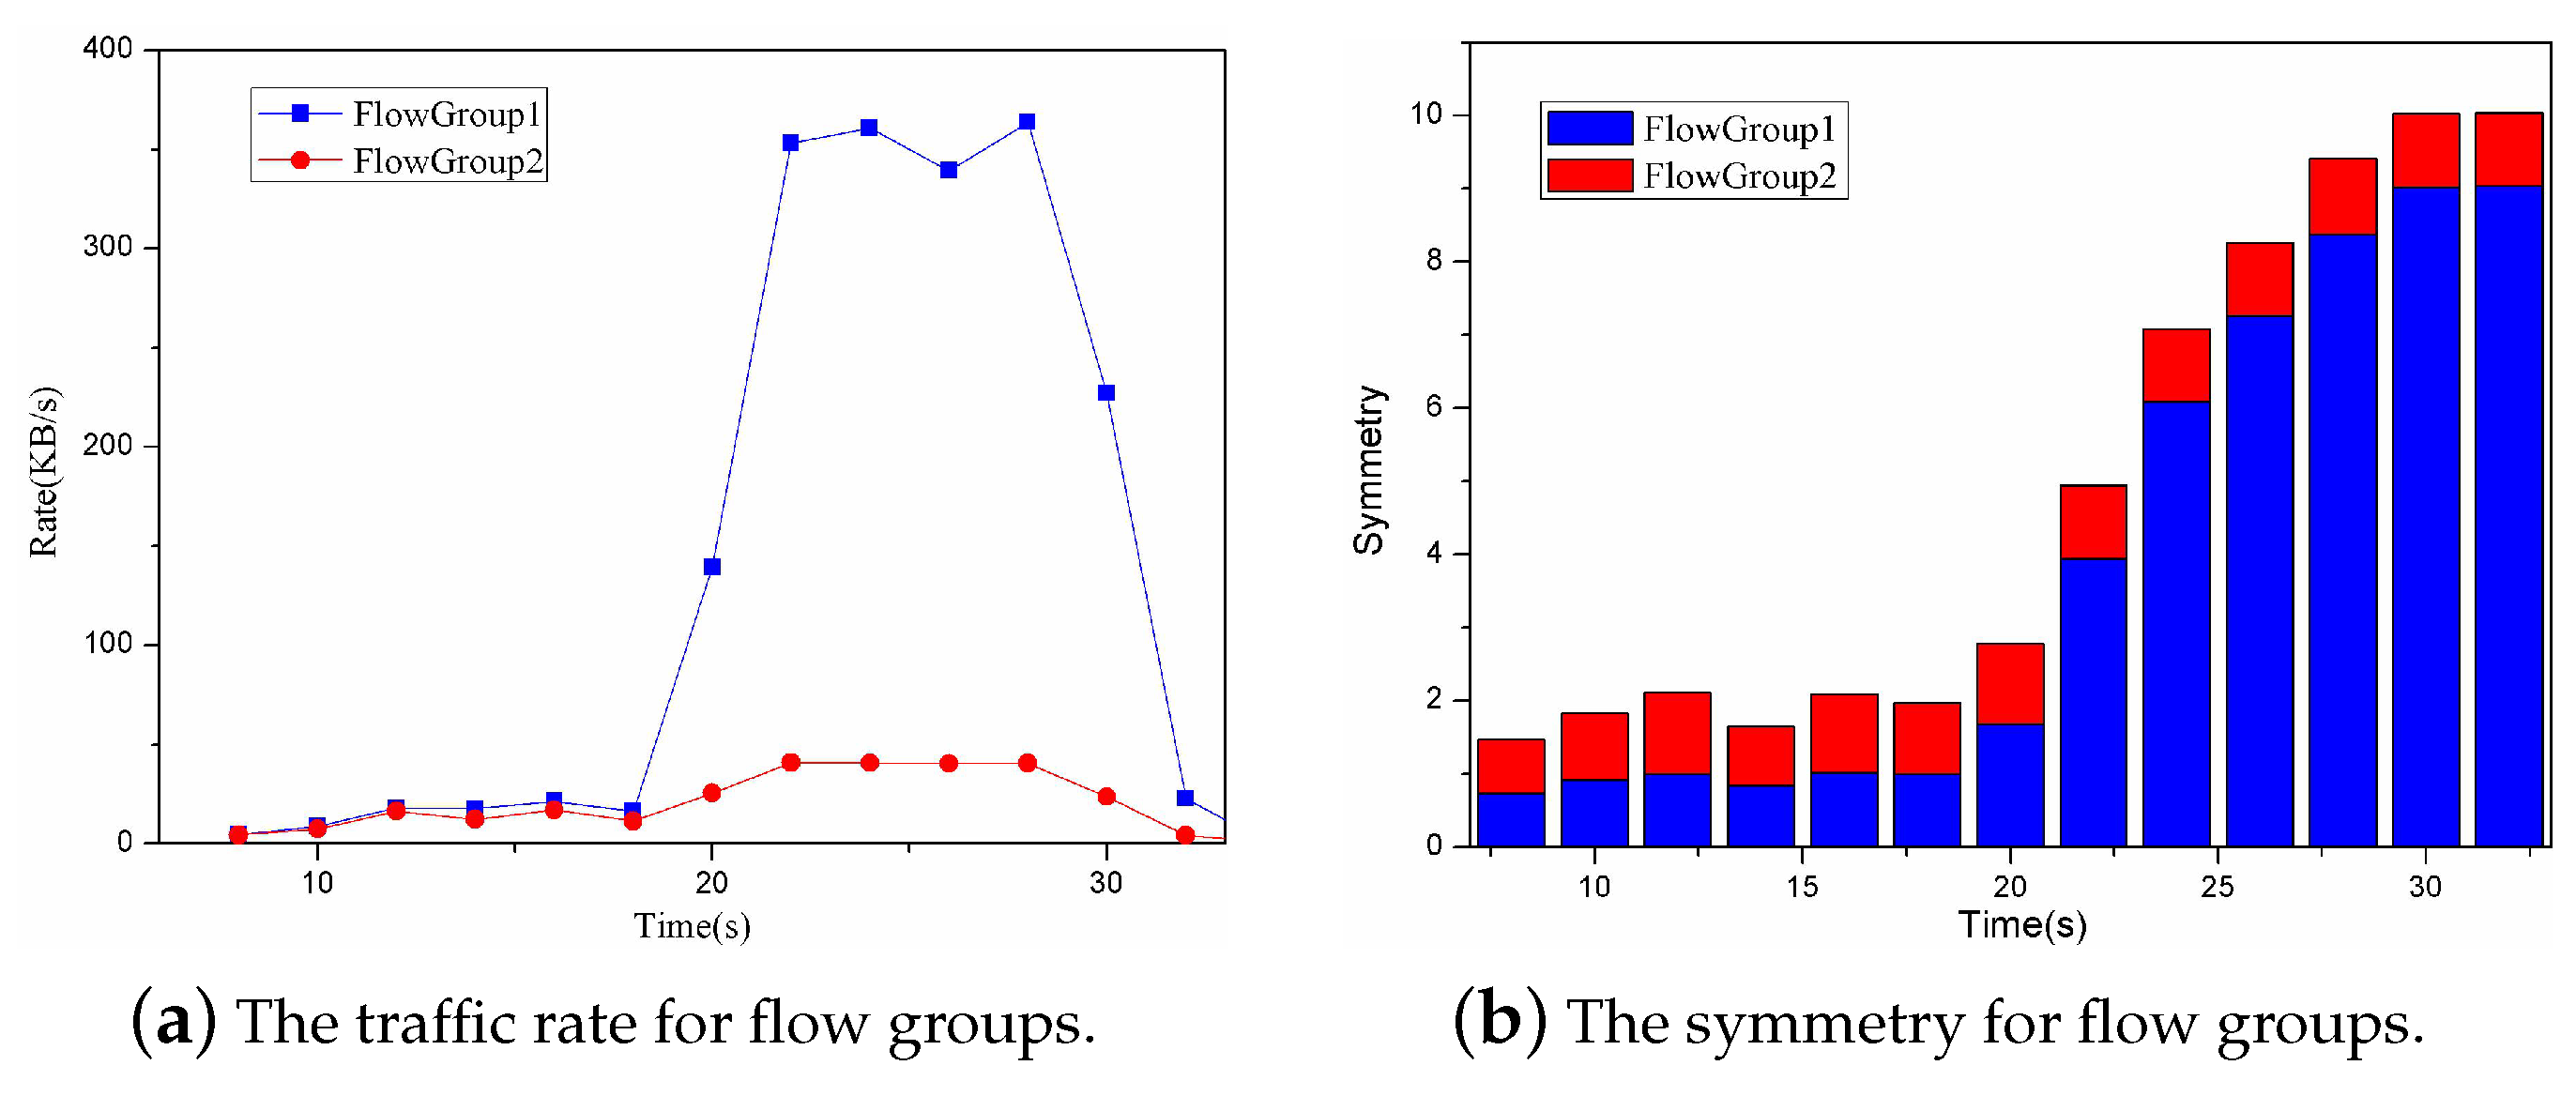
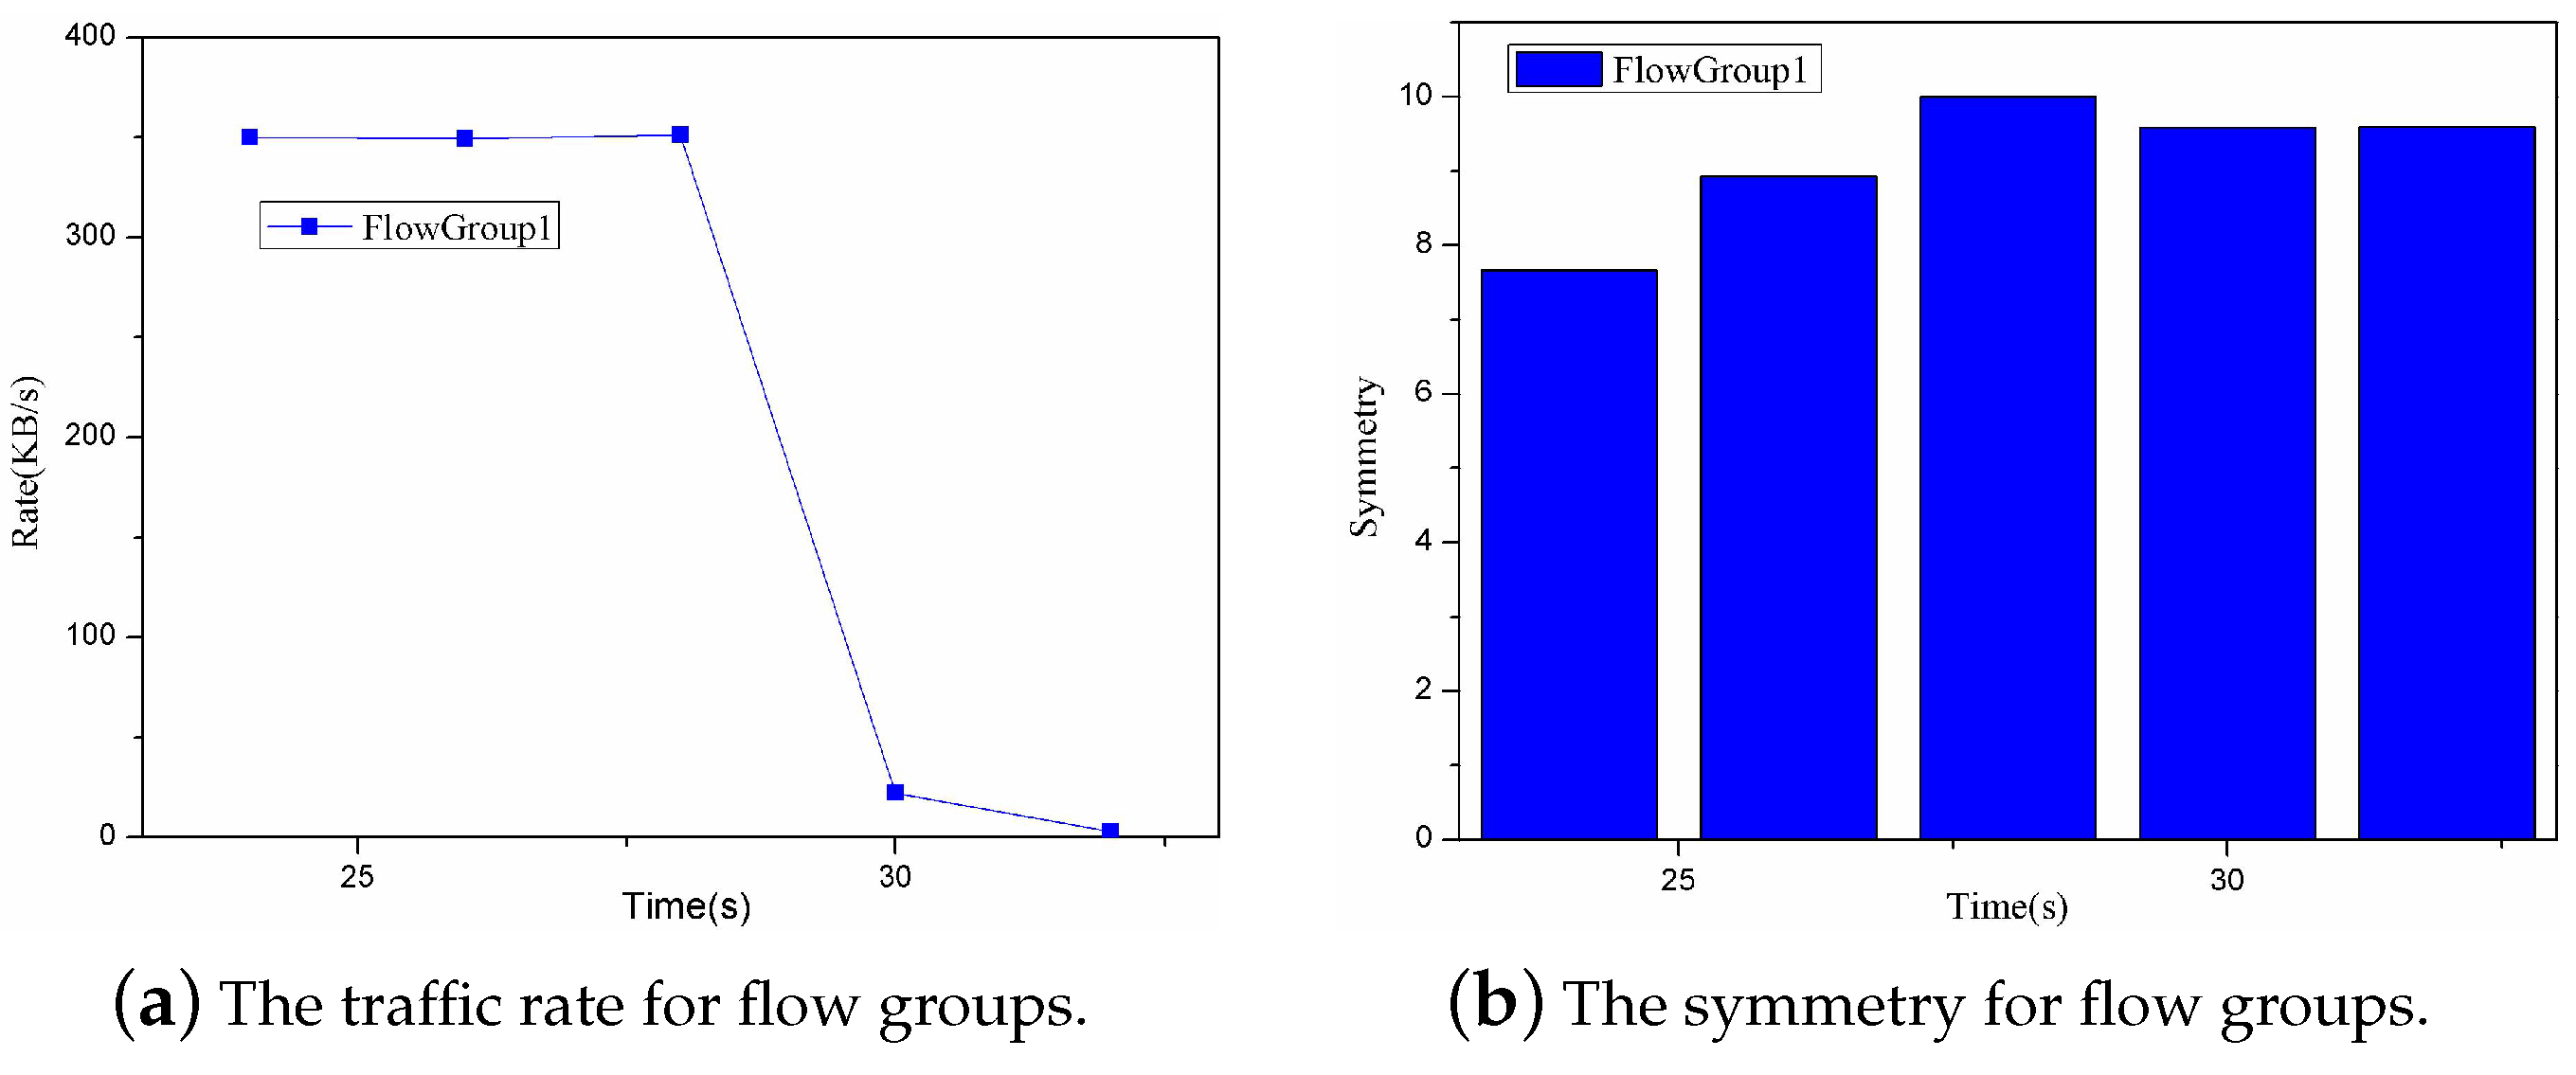
The appropriate flow statistics threshold is extremely important for obtaining the flow statistics information from the switches. There are mainly two key functionalities about this value: (1) it can determine the starting point of the flow statistics collection; and (2) it can indirectly affect the time interval between the adjacent received flow statistics messages. As shown in Figure 11, if the flow statistics threshold is too low, the collection of the flow statistics information will be too frequent, which may be similar to the low-frequent periodic polling. Using this way may cause high network overhead during the flow statistics collection. As shown in Figure 12, if the flow statistics threshold is too high, the starting point of flow statistics collection may be delayed, which leads to the small flows (the flow statistics of them is less than the threshold) to be not monitored. In addition, it may not capture the traffic burst due to the possible long time interval between the adjacent received flow statistics messages.
5.2.3. Different Detection Period
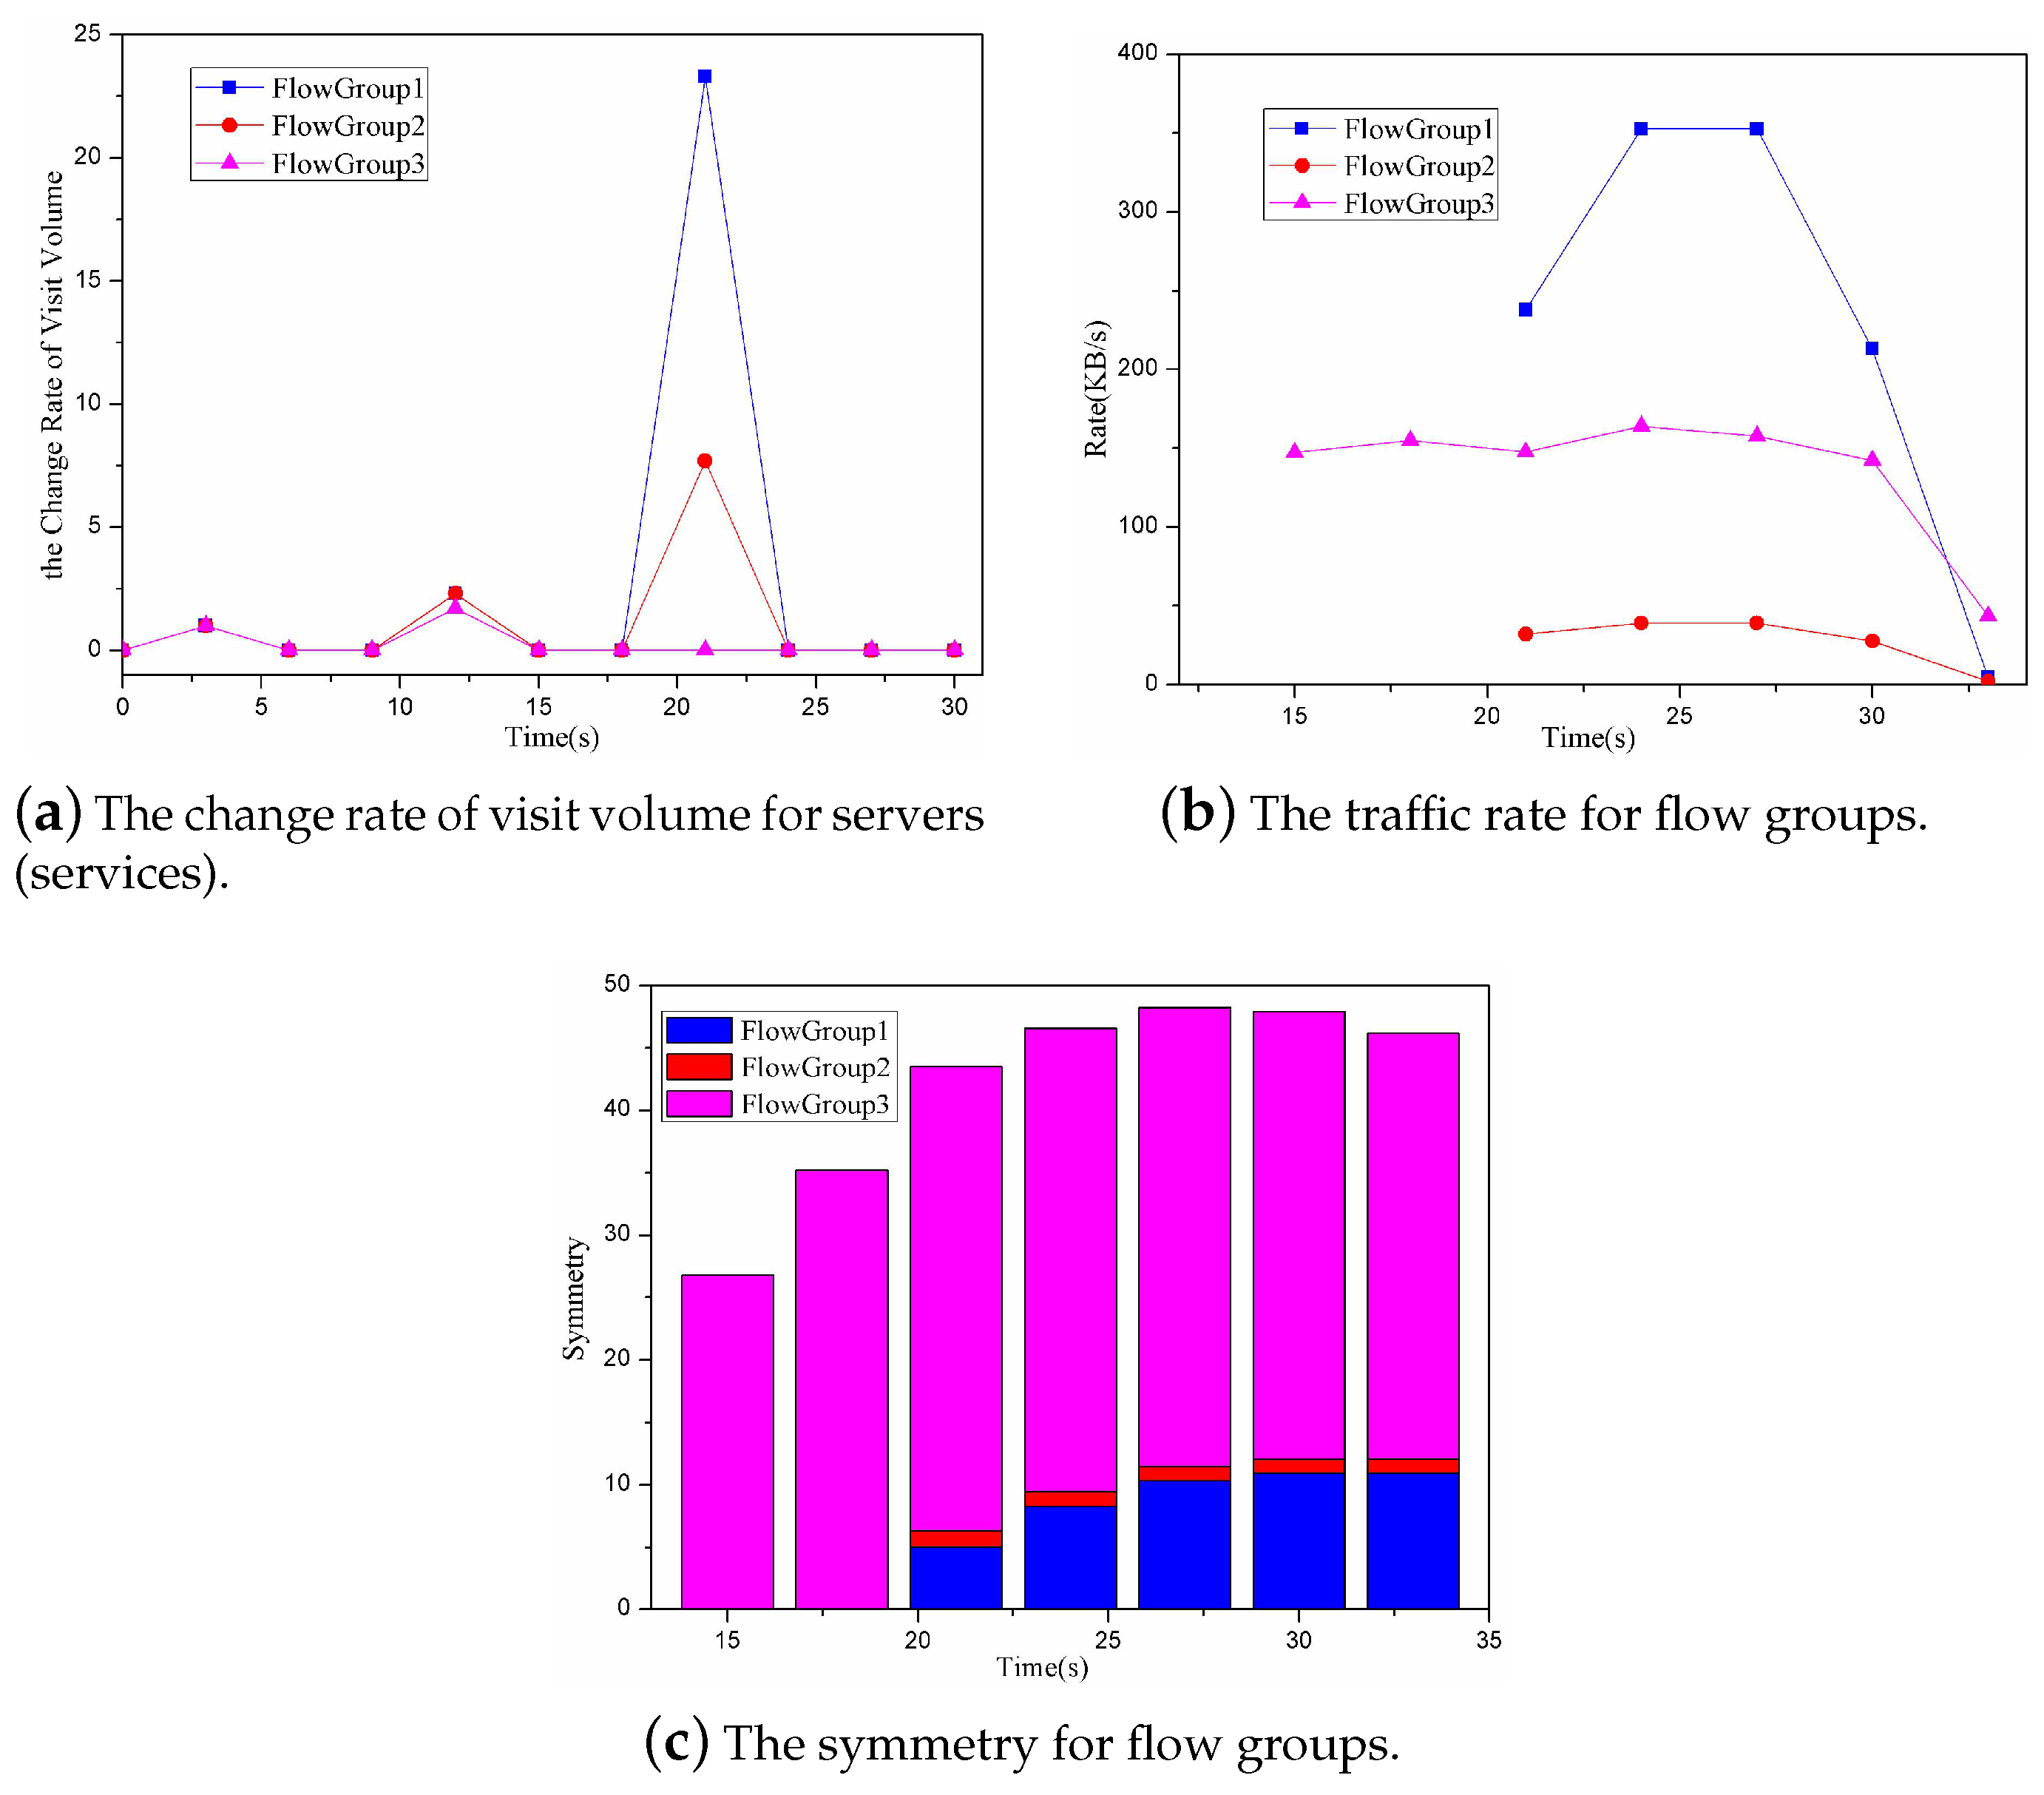
At the end of each monitoring period, the controller will compute the three variables P, P and P. Different detection periods can make different effects on the detecting accuracy of the DDoS attack. The detection period was set to 1 s and 3 s. When it was set to 1 s, the changes of the variables P, P and P are as shown in Figure 13. We can see that, when the monitoring period is low, the computing frequency of the three variables will become high. In this way, the proposed approach can detect the DDoS attack in a timely manner but may lead to too much computing overhead and the flow statistics collection overhead. When it is set to 3 s, the changes of the variables P, P and P are as shown in Figure 14. We can see that, when the monitoring period is high, on the one hand the DDoS detection will lack the timeliness, while, on the other hand, the accuracy of P, P and P will be also decreased. Therefore, choosing an appropriate monitoring period is also important to the proposed DDoS detection.
5.2.4. Cost
The cost of these three DDoS detection approaches mainly includes two parts: the computing cost and the flow statistics collection cost. The former is caused by computing the variable P, P and P in the controller or in the switches. The latter is caused by collecting the flow statistics information from switches. Especially, the cost of the baseline approach is mainly caused by periodically polling the switches. The cost of the proposed approach is mainly caused by triggering the flow statistics messages from the switches. In terms of the two part costs, the flow statistics collection cost has a greater impact on the network than the computing cost. The reason is that the controller usually has sufficient computing capability, while the bandwidth resource is very limited in the network. Too much computing cost may bring little impact on the controller but too much flow statistics collection cost may seriously interfere with the normal network traffic. Therefore, the cost comparison here refers more to the comparison of the flow statistics collection cost.
According to the monitoring data in SubSection 5.2.1, the costs of the three DDoS Detection approaches are shown in Table 3. The cost of OverWatch is almost equal to zero because the computing and the polling are all carried out in the switches. The advantages on the flow statistics collection cost of the proposed approach are reflected in three aspects: (1) it pointedly chooses the targeted switches and the targeted flows through computing the variable P in the controller; (2) it customizes the starting point of the collection by defining an appropriate flow statistics threshold; and (3) it combines the event triggering mechanism and customized collection algorithm to collect flow statistics information from the switches. As shown in Figure 9 and Figure 10, the baseline approach collects the flow statistics information of all the flows from the very beginning. However, the proposed approach only collects flow statistics information for Flow Group 1 and Flow Group 2 from the eighteenth second. Under the condition of guaranteeing the detecting accuracy, the proposed approach generates less overhead than the baseline approach.
However, in terms of the implementation complexity, OverWatch is much higher than the other two approaches. Considering the polling and the computing in OverWatch are accomplished in the switch, the implementation of OverWatch must modify the switch. Different from OverWatch, both the polling operation and the triggering operation can be accomplished by the related mechanism provided by openflow in the baseline approach and the proposed approach. In addition, to improve the accuracy of the proposed DDoS detection approach, the determined DDoS attack can be made by further identification through using the flow content analysis algorithms.
6. Conclusions
This paper proposes a flexible monitoring framework named FlexMonitor, which can efficiently support a variety of network monitoring approaches and be extended to large-scale networks. FlexMonitor has two key parts: the monitoring strategy deployment part and the monitoring data collection part, which can enrich the deployment methods of monitoring strategies and increase kinds of the monitoring data sources, respectively. To demonstrate the effectiveness of FlexMonitor, the paper proposes a DDoS detection approach based on FlexMonitor. Based on the evaluation and comparison, the experimental results show that the proposed DDoS detection approach can timely detect the DDoS attack at low cost. These results also indirectly show that FlexMonitor has greater flexibility which can support various monitoring approaches.
Our future work is to improve the interpretation of the monitoring tasks of the upper monitoring applications. Making the monitoring task interpretation simple and universal can not only improve the interpreting efficiency of the monitoring tasks, but also facilitate the quick deployment of monitoring strategies. In addition, we make further study on the improvement of the network event definition to make more and more network events monitored by the way of deploying network event triggers in switches.
Author Contributions
Conceptualization, B.W. and J.S.; Formal analysis, B.W. and J.S.; Methodology, B.W.; Validation, B.W.; Writing—original draft, B.W.; and Writing—review and editing, J.S.
Funding
This research was funded by the National Natural Science Foundation of China (Grant #: 61472438 and Grant #: 61303264).
Acknowledgments
The authors would like to thank the editor and anonymous referees for the constructive comments in improving the contents and presentation of this paper.
Conflicts of Interest
The authors declare no conflict of interest.
References
- Mardani, M.; Giannakis, G.B. Estimating Traffic and Anomaly Maps via Network Tomography. IEEE/ACM Trans. Netw. 2016, 24, 1533–1547. [Google Scholar] [CrossRef] [Green Version]
- Kim, J.; Sim, A.; Sang, C.S.; Kim, I. An approach to online network monitoring using clustered patterns. In Proceedings of the International Conference on Computing, Networking and Communications, Silicon Valley, CA, USA, 26–29 January 2017; pp. 656–661. [Google Scholar]
- Yu, C.; Lumezanu, C.; Zhang, Y.; Singh, V.; Jiang, G.; Madhyastha, H.V. FlowSense: Monitoring Network Utilization with Zero Measurement Cost. In Proceedings of the International Conference on Passive and Active Network Measurement, Hong Kong, China, 18–19 March 2013; pp. 31–41. [Google Scholar]
- Yang, Z.; Yeung, K.L. An efficient flow monitoring scheme for SDN networks. In Proceedings of the 2017 IEEE 30th Canadian Conference on Electrical and Computer Engineering, Windsor, ON, Canada, 30 April–3 May 2017; pp. 1–4. [Google Scholar]
- Shirali-Shahreza, S.; Ganjali, Y. Traffic statistics collection with FleXam. In Proceedings of the ACM Conference on SIGCOMM, London, UK, 17–21 August 2015; pp. 117–118. [Google Scholar]
- Li, T.; Sun, Z.; Jia, C.; Su, Q.; Lee, M. Using NetMagic to observe fine-grained per-flow latency measurements. ACM SiGCOMM Comput. Commun. Rev. 2011, 41, 466–467. [Google Scholar] [CrossRef]
- Xuan, T.P.; Fukuda, K. Adaptive and distributed monitoring mechanism in software-defined networks. In Proceedings of the International Conference on Network and Service Management, Tokyo, Japan, 26–30 November 2017; pp. 1–5. [Google Scholar]
- Shah, S.A.R.; Bae, S.; Jaikar, A.; Noh, S.Y. An adaptive load monitoring solution for logically centralized SDN controller. In Proceedings of the Network Operations and Management Symposium, Kanazawa, Japan, 5–7 October 2016; pp. 1–6. [Google Scholar]
- Xiao, K. The Research and Application of Simple Network Management Protocol SNMP. China Comput. Commun. 2018. Available online: http://erlang.org/doc/apps/snmp/snmp.pdf (accessed on 1 October 2018).
- Li, Y.; Kim, C.; Kim, C.; Yu, M. FlowRadar: A better NetFlow for data centers. In Proceedings of the Usenix Conference on Networked Systems Design and Implementation, Santa Clara, CA, USA, 16–18 March 2016; pp. 311–324. [Google Scholar]
- Song, P.; Liu, Y.; Liu, T.; Qian, D. Controller-proxy: Scaling network management for large-scale SDN networks. Comput. Commun. 2017, 108, 52–63. [Google Scholar] [CrossRef]
- Megyesi, P.; Botta, A.; Aceto, G. Available bandwidth measurement in software defined networks. In Proceedings of the 31st Annual ACM Symposium on Applied Computing, Pisa, Italy, 4–8 April 2016; pp. 651–657. [Google Scholar]
- Tang, F.; Li, L.; Barolli, L.; Tang, C. An Efficient Sampling and Classification Approach for Flow Detection in SDN-Based Big Data Centers. In Proceedings of the IEEE International Conference on Advanced Information Networking and Applications, Taipei, Taiwan, 27–29 March 2017; pp. 1106–1115. [Google Scholar]
- Adrichem, N.L.M.V.; Doerr, C.; Kuipers, F.A. OpenNetMon: Network monitoring in OpenFlow Software-Defined Networks. In Proceedings of the Network Operations and Management Symposium, Krakow, Poland, 5–9 May 2014; pp. 1–8. [Google Scholar]
- Henni, D.E.; Hadjaj-Aoul, Y.; Ghomari, A. Probe-SDN: A smart monitoring framework for SDN-based networks. In Proceedings of the Global Information Infrastructure and NETWORKING Symposium, Saint Pierre, France, 25–27 October 2017; pp. 1–6. [Google Scholar]
- Chowdhury, S.R.; Bari, M.F.; Ahmed, R.; Boutaba, R. PayLess: A low cost network monitoring framework for Software Defined Networks. In Proceedings of the Network Operations and Management Symposium, Krakow, Poland, 5–9 May 2014; pp. 1–9. [Google Scholar]
- Su, Z.; Wang, T.; Xia, Y.; Hamdi, M. FlowCover: Low-cost flow monitoring scheme in software defined networks. In Proceedings of the Global Communications Conference, Austin, TX, USA, 8–12 December 2015; pp. 1956–1961. [Google Scholar]
- Liu, J.; Li, Y.; Chen, M.; Dong, W. Software-defined internet of things for smart urban sensing. IEEE Commun. Mag. 2015, 53, 55–63. [Google Scholar] [CrossRef]
- Xu, Y.; Yan, Y.; Dai, Z.; Wang, X. A management model for SDN-based data center networks. In Proceedings of the Computer Communications Workshops, Toronto, ON, Canada, 27 April–2 May 2014; pp. 113–114. [Google Scholar]
- Tsiropoulou, E.E.; Baras, J.S.; Papavassiliou, S.; Sinha, S. RFID-based smart parking management system. Cyber-Phys. Syst. 2017, 3, 22–41. [Google Scholar] [CrossRef]
- Sagduyu, Y.E.; Ephremides, A. A game-theoretic analysis of denial of service attacks in wireless random access. Wirel. Netw. 2009, 15, 651–666. [Google Scholar] [CrossRef]
- Tsiropoulou, E.E.; Baras, J.S.; Papavassiliou, S.; Qu, G. On the Mitigation of Interference Imposed by Intruders in Passive RFID Networks. In Proceedings of the International Conference on Decision and Game Theory for Security, New York, NY, USA, 2–4 November 2016. [Google Scholar]
- Kandoi, R.; Antikainen, M. Denial-of-service attacks in OpenFlow SDN networks. In Proceedings of the IFIP/IEEE International Symposium on Integrated Network Management, Ottawa, ON, Canada, 11–15 May 2015; pp. 1322–1326. [Google Scholar]
- Yang, X.; Han, B.; Sun, Z.; Huang, J. SDN-based DDoS Attack Detection with Cross-Plane Collaboration and Lightweight Flow Monitoring. In Proceedings of the GLOBECOM 2017, Singapore, 4–8 December 2017. [Google Scholar]
Figure 1.
Traditional monitoring framework.

Figure 2.
The monitoring framework FlexMonitor.

Figure 3.
A hybrid monitoring strategy instance.

Figure 4.
The general monitoring request.

Figure 5.
The normal and attacked traffic.

Figure 6.
The monitoring request for byte statistics of related flows in DDoS attack detection.

Figure 7.
The experimental topology.

Figure 8.
The three groups of simulated flows.

Figure 9.
The change of three variables for the proposed approach when threshold =8 KB and T = 2 s.

Figure 10.
The change of P and P for the baseline approach when T = 1 s.

Figure 11.
The change of P and P for the proposed approach when threshold =5 KB and T = 2 s.

Figure 12.
The change of P and P for the proposed approach when threshold =20 KB and T = 2 s.

Figure 13.
The change of three variables for the proposed approach when threshold =8 KB and T = 1 s.
Figure 13.
The change of three variables for the proposed approach when threshold =8 KB and T = 1 s.

Figure 14.
The change of three variables for the proposed approach when threshold =8 KB and T = 3 s.
Figure 14.
The change of three variables for the proposed approach when threshold =8 KB and T = 3 s.


Table 1.
Different monitoring data sources in FlexMonitor.
| Data Source | Monitoring Strategy | Approaches | Application Scenario | Kind of Data |
|---|---|---|---|---|
| raw packets | switch selection | sampling from the targeted switches | extract the flow features or analyze the content of packets, such as detecting malicious traffic, etc. | the header of packet or the whole packet |
| statistics data | switch selection | polling or sampling from the targeted switches | traffic engineering, hot spot detection, link capacity planning, etc. | port packets/bytes, flow packets/bytes, etc. |
| end-to-end measuring data | end–host pair selection | make the active measurements between the targeted end–host pairs | hard to directly obtain the required statistics data from the targeted switches | end-to-end latency, end-to-to bandwidth, etc. |
| network event triggering message | event definition | define the two factors for network events | some simple network events, such as large flow detection, hot spot detection, etc. | event triggering messages |
Table 2.
The characteristics comparison of the three flow groups.
| Attribute | Visiting Volume | Traffic Rate | Symmetry | |
|---|---|---|---|---|
| Flow Group | ||||
| 1 | High | High | No | |
| 2 | High | High | Yes | |
| 3 | Low | High | No | |
Table 3.
The cost comparison of the three DDoS detection approaches.
| Detection Approach | Flow Group 1 | Flow Group 2 | Flow Group 3 | Implementation Complexity |
|---|---|---|---|---|
| baseline approach | 32 | 32 | 32 | low |
| OverWatch | 1 | 0 | 1 | high |
| the proposed approach | 8 | 7 | 0 | low |
© 2018 by the authors. Licensee MDPI, Basel, Switzerland. This article is an open access article distributed under the terms and conditions of the Creative Commons Attribution (CC BY) license (http://creativecommons.org/licenses/by/4.0/).
Share and Cite
MDPI and ACS Style
Wang, B.; Su, J. FlexMonitor: A Flexible Monitoring Framework in SDN. Symmetry 2018, 10, 713. https://doi.org/10.3390/sym10120713
AMA Style
Wang B, Su J. FlexMonitor: A Flexible Monitoring Framework in SDN. Symmetry. 2018; 10(12):713. https://doi.org/10.3390/sym10120713
Chicago/Turabian StyleWang, Binfeng, and Jinshu Su. 2018. "FlexMonitor: A Flexible Monitoring Framework in SDN" Symmetry 10, no. 12: 713. https://doi.org/10.3390/sym10120713
Note that from the first issue of 2016, this journal uses article numbers instead of page numbers. See further details here.