Anti-3D Weapon Model Detection for Safe 3D Printing Based on Convolutional Neural Networks and D2 Shape Distribution


1
Department of IT Convergence & Application Engineering, Pukyong National University, Busan 608-737, Korea
2
Department of Information Security, Tongmyong University, Busan 608-711, Korea
*
Author to whom correspondence should be addressed.
Symmetry 2018, 10(4), 90; https://doi.org/10.3390/sym10040090
Submission received: 28 February 2018
/
Revised: 21 March 2018
/
Accepted: 29 March 2018
/
Published: 31 March 2018
(This article belongs to the Special Issue Information Technology and Its Applications 2021)
Abstract
:With the development of 3D printing, weapons are easily printed without any restriction from the production managers. Therefore, anti-3D weapon model detection is necessary issue in safe 3D printing to prevent the printing of 3D weapon models. In this paper, we would like to propose an anti-3D weapon model detection algorithm to prevent the printing of anti-3D weapon models for safe 3D printing based on the D2 shape distribution and an improved convolutional neural networks (CNNs). The purpose of the proposed algorithm is to detect anti-3D weapon models when they are used in 3D printing. The D2 shape distribution is computed from random points on the surface of a 3D weapon model and their geometric features in order to construct a D2 vector. The D2 vector is then trained by improved CNNs. The CNNs are used to detect anti-3D weapon models for safe 3D printing by training D2 vectors which have been constructed from the D2 shape distribution of 3D weapon models. Experiments with 3D weapon models proved that the D2 shape distribution of 3D weapon models in the same class is the same. Training and testing results also verified that the accuracy of the proposed algorithm is higher than the conventional works. The proposed algorithm is applied in a small application, and it could detect anti-3D weapon models for safe 3D printing.
1. Introduction
The three-dimensional (3D) printing revolution can help users to realize their ideas from the digital models with 3D printers [1,2]. Three-dimensional printing is used in many areas of life including jewelry, footwear, industrial design, architecture, engineering and construction, automotive, aerospace, medical and healthcare industries, education and consumer products [3,4]. With the development of 3D printing technology, people can search 3D weapon models, such as firearm, gun and knife to print physical 3D objects with home 3D printers or share them unlimitedly. In particular, with new materials users can print dangerous weapons and can use them to do damage [5,6]. This leads to concerns for 3D printing security because anyone can also print dangerous weapons.
Until now, the danger of 3D printed weapons has been proved [7,8] but worries about the danger of 3D printed weapons have only just begun to form into suggestions, considerations and policies [9,10]. Researchers have not been interested in the aspect of “how to restrict the printing of 3D weapon models” yet, and there is no solution to stop the printing of 3D weapon models in the 3D printing industry. The handgun detection techniques based on image processing methods applied to the surveillance systems or the checking security systems in special places as airport or building [11,12,13,14,15,16] could not be applied to safe 3D printing. Because the input of 3D printing is a 3D printing model, it is not an image. Additionally, 3D model matching techniques [17,18,19,20] could also not apply to safe 3D printing in order to prevent the printing of 3D weapon models. This is because the 3D model matching techniques have to access to the database of 3D models to give the decision. If the sample models of a model type are not stored in the database of 3D models, an input model will not match to any model when it is queried by 3D model matching techniques. So, an anti-3D weapon model detection solution for safe 3D printing is necessary and suitable to prevent the printing of 3D weapon models for a safe 3D printing industry.
For meeting the above requirements, we would like to propose an anti-3D weapon model detection algorithm for safe 3D printing. The proposed algorithm is based on improved convolutional neural networks (CNNs) and the D2 shape distribution of 3D printing models. The main content of the proposed algorithm is to extract geometric features from a 3D weapon model in order to compute a D2 shape distribution. The D2 shape distribution is then used to construct a D2 vector, and this D2 vector will be trained by improved CNNs for detecting anti-3D weapon models. To clarify the proposed algorithm, we organize our paper as follow: in Section 2, we explain the matching techniques for 3D model and related works. In Section 3, we show the proposed algorithm in detail. Experimental results and the evaluation of the proposed algorithm will be shown in Section 4. Section 5 concludes.
2. Related Works
2.1. Handgun Detection and 3D Model Matching
The handgun detection issues were proposed and solved several years ago. All handgun detection techniques are based on image processing and only applied to the monitoring systems or the security checking system at special places, such as airports, buildings or important events. It is only useful to detect where weapons are kept on the body or in the luggage. It is unsuitable to detect anti-3D weapon models for safe 3D printing because the input of 3D printing is a 3D printing model, not an image. So handgun detection methods based on image processing are unsuitable for safe 3D printing.
Three-dimensional model matching has been researched since the 2000s. The ability of 3D model matching techniques could only search for similar 3D models in the database of 3D models when a user gives an input model if the database of 3D models contains similar 3D models to the input models. Thus, they could not detect whether a model is a weapon or not, and they could not find similar 3D models or find incorrect 3D models if the input 3D model was not previously stored in database. Moreover, these 3D model matching methods have to perform the searching process in the database of 3D models, and the accuracy of these method is not high. Consequently, 3D matching techniques could not applied to safe 3D printing.
2.2. Shape Distribution
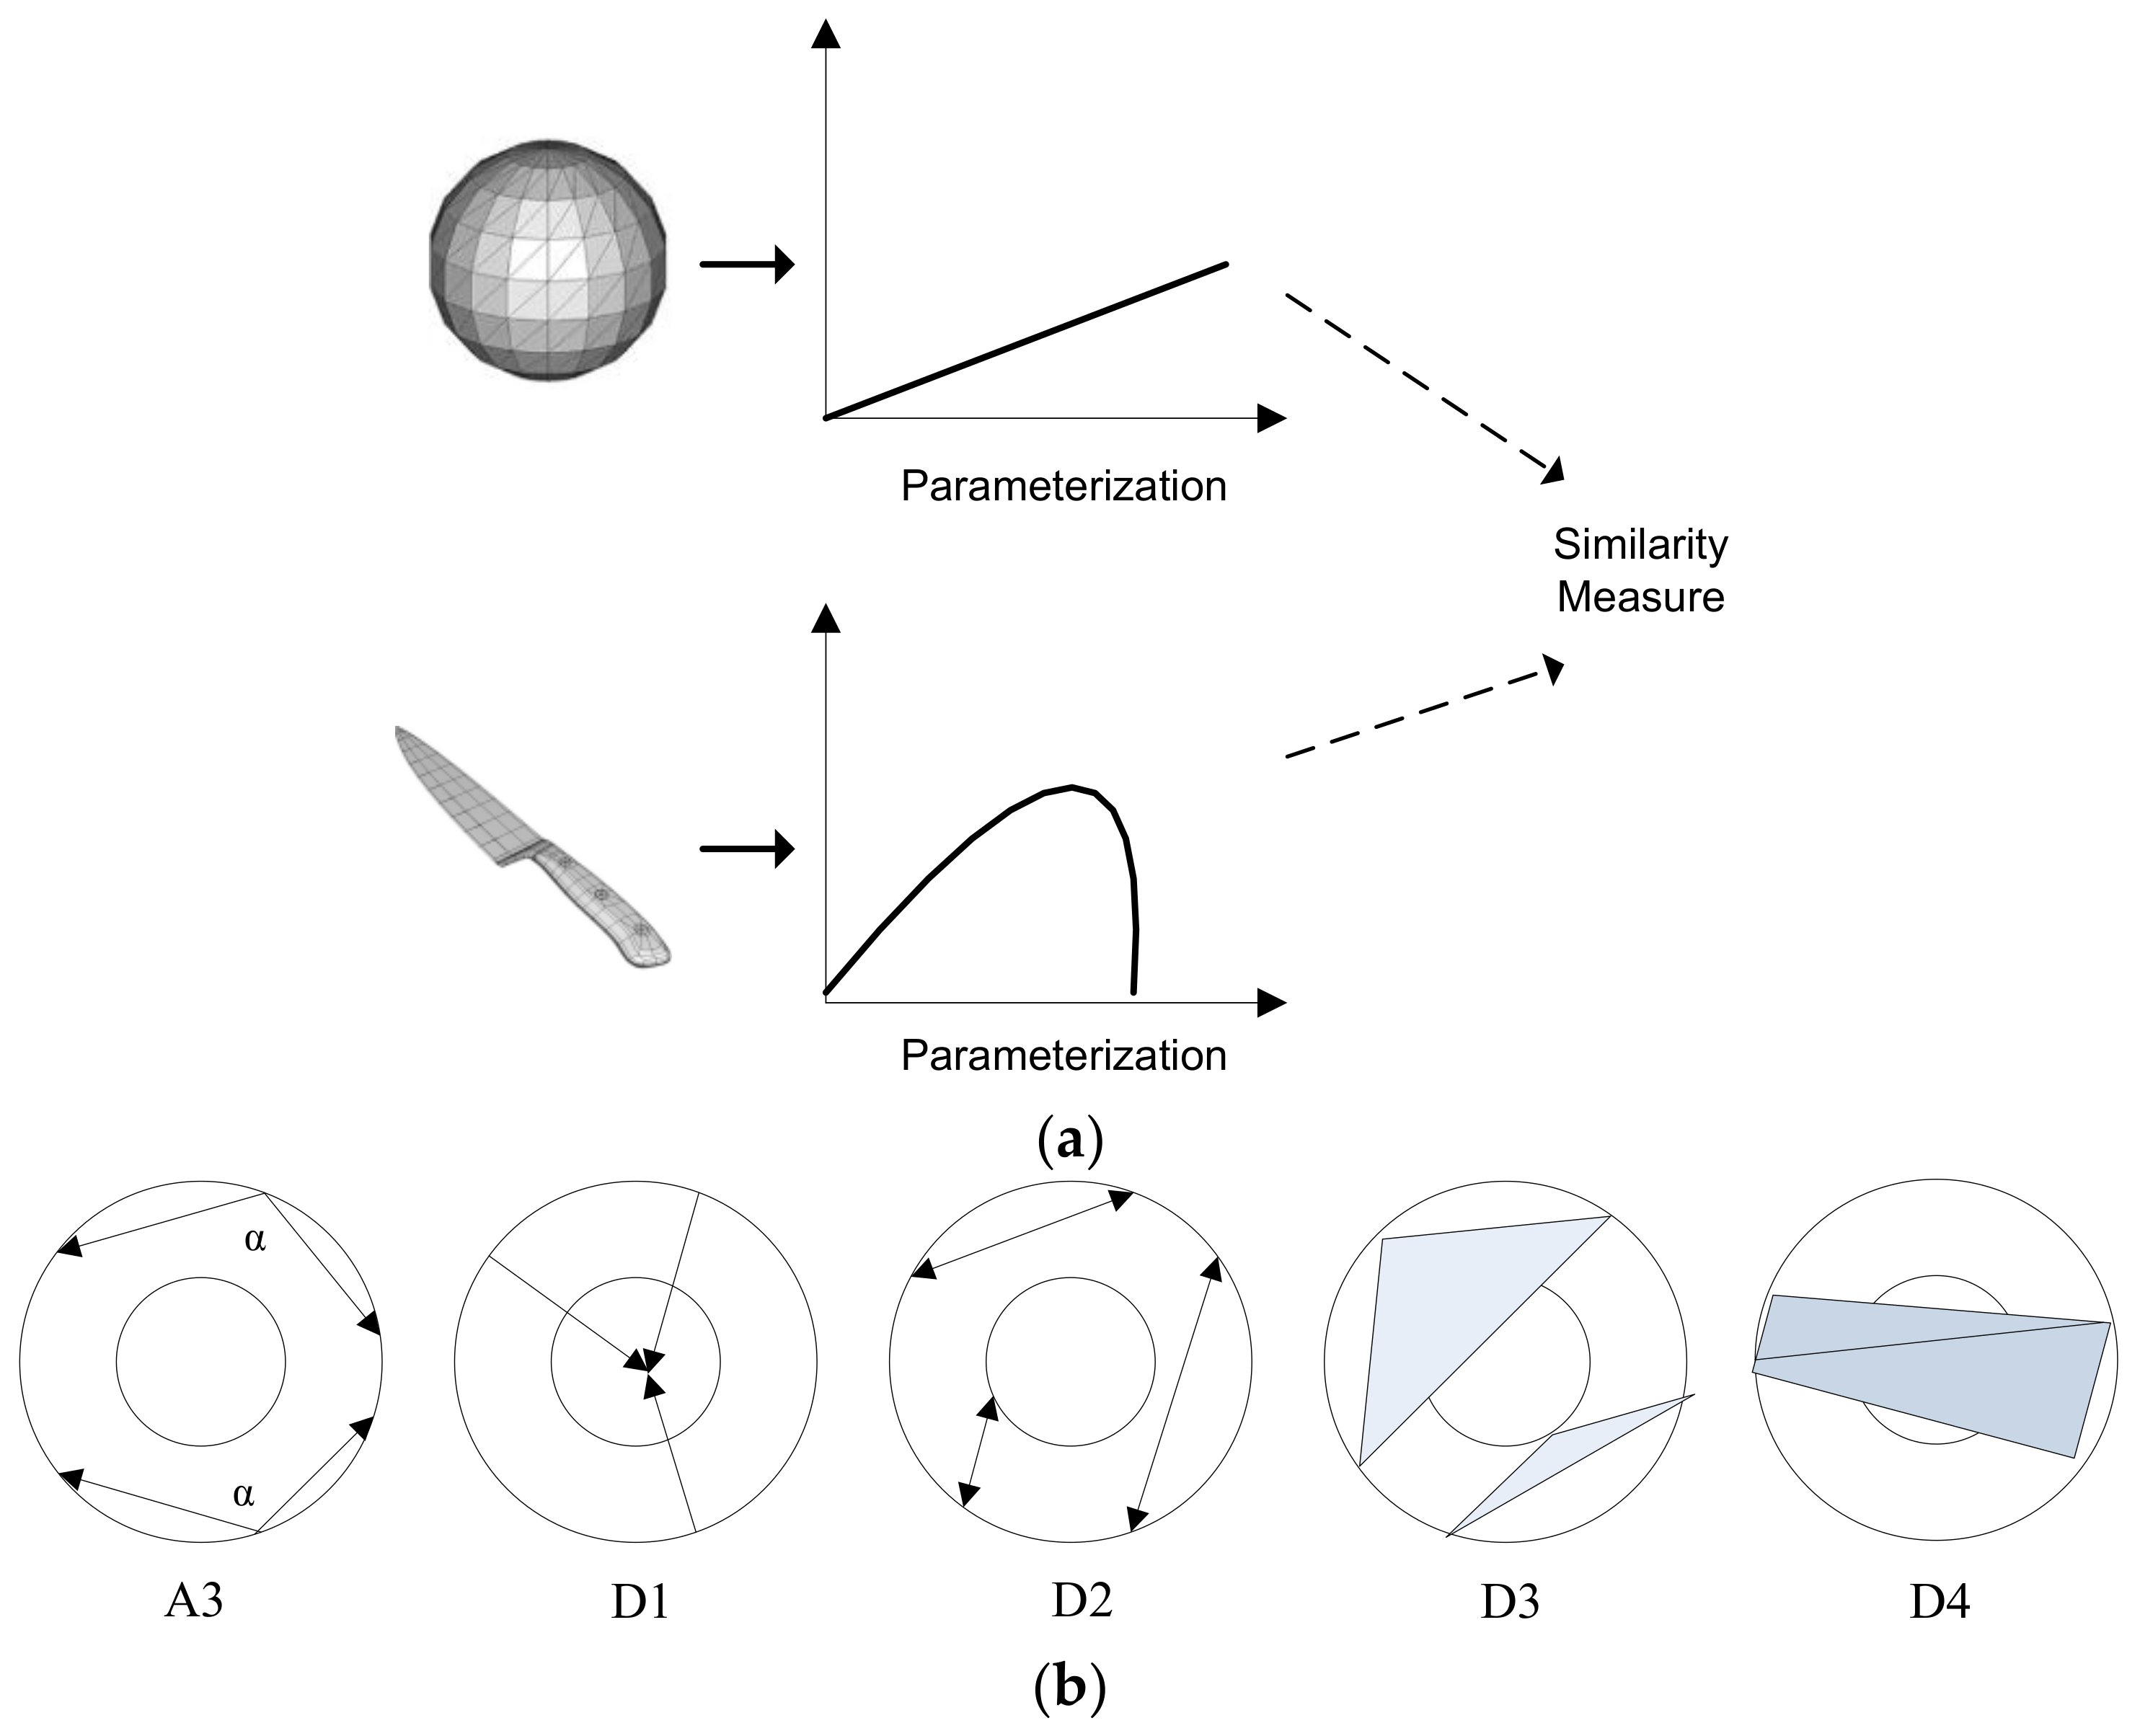
Shape distribution is a probability distribution sampled from a shape function that is measured from the global geometric properties of a 3D model. Shape distribution is used to represent the shape signature of a 3D model. The key idea of shape distribution is to transform an arbitrary 3D model into a parameterized function that can easily be compared with others (see Figure 1a). Shape distributions are computed by shape functions as shown in Figure 1b. There are five types of shape distribution for a 3D model. These shape distributions are first introduced and then investigated through experiments by Osada et al. [19]. It concludes the A3, D1, D2, D3 and D4 shape distributions. They are computed by the A3, D1, D2, D3 and D4 shape functions and described as follows:
- ✓
- A3 shape function: compute the angle between three random points on the surface of a 3D model. The A3 shape distribution of a 3D model is the distribution of a set of angles that is computed from a set of three random points on the surface of a 3D model.
- ✓
- D1 shape function: compute the distance between a fixed point and one random point on the surface of a 3D model. The D1 shape distribution of a 3D model is the distribution of a set of distances that is computed from a fixed point to a set of random points on the surface of a 3D model. Normally, the fixed point is the center points of a 3D model.
- ✓
- D2 shape function: compute the distance between two random points on the surface of a 3D model. The D2 shape distribution of a 3D model is the distribution of a set of distances that is computed from a set of two random points on the surface of a 3D model.
- ✓
- D3 shape function: compute the square root of the area of the triangle between three random points on the surface of a 3D model. The D3 shape distribution of a 3D model is the distribution of a set of square roots that is computed from a set of the area of the triangle between three random points on the surface of a 3D model.
- ✓
- D4 shape function: compute the cube root of the volume of the tetrahedron between four random points on the surface of a 3D model. The D4 shape distribution of a 3D model is the distribution of a set of cube roots that is computed from a set of tetrahedron volumes between four random points on the surface of a 3D model.
Experimental results [19,20] showed that shape distributions are robust to geometric attacks such as rotation, scaling, translation and noise. For example, in Figure 2a, the distance between two random points is not changed if points are rotated or translated. With the same shape function, each type of model is featured by the differential shapes as shown in Figure 2b. In the experiments of Thomas [17], Osada [19] and Levi [20], experimental results showed that the properties of the D2 shape distribution are concise to store, quick to compute, invariant to transforms, insensitive to noise and robust to attacks. Moreover, the D2 shape distribution between model types is clearer than other shape distributions (see Figure 2b). In 3D model matching methods, the accuracy of the D2 shape distribution is the highest. So, we selected and used the D2 shape distribution in the proposed algorithm.
2.3. 3D Triangle Mesh-Based Anti-3D Weapon Model Detection
The input of 3D printing is a 3D triangle mesh [21,22], which is designed by a CAD software. A 3D triangle mesh contains a set of facets. Each facet includes three vertices and a normal vector. Each vertex is presented by three coordinates x, y and z. Figure 3 shows the structure of a 3D triangle mesh. The purpose of the proposed algorithm is to detect anti-3D weapon models from 3D printing models (3D triangle meshes) to prevent the printing of anti-3D weapon models when they are used in 3D printing. Based on the researched results of shape distributions and the recognition ability of CNNs, we selected the D2 shape distribution and used improved CNNs to train the D2 shape distribution in the proposed algorithm. Thus, we have to calculate the D2 shape distribution of 3D triangle meshes and construct D2 vectors before training them by improved CNNs to detect anti-3D weapon models for safe 3D printing.
3. The Proposed Algorithm
3.1. Overview
The proposed algorithm is shown in Figure 4. Facets and vertices are first extracted from the 3D weapon triangle mesh in order to generate N pairs of two random points. The pairs of two random points are randomly selected from points on the surface of 3D triangle mesh including the vertices of the 3D triangle mesh. The N pairs of two random points are then used to compute N distances. The D2 shape distribution of the 3D triangle mesh will be then computed from N distances in order to construct a D2 vector for the training process by improved CNNs. The dimension of a D2 vector is defined by users because the content of the D2 shape distribution is the distribution of Euclidean distances between N pairs of randomly selected points on the surface of a 3D triangle mesh. After data vector construction, D2 vectors are trained by improved CNNs. The structure of these CNNs consists of one convolution layer and neural networks. With the result of the training process, we can detect anti-weapon from 3D triangle meshes for safe 3D printing in order to prevent the printing of anti-3D weapon models.
3.2. D2 Shape Distribution Computation and D2 Vector Construction
The D2 shape distribution of a 3D triangle mesh (a 3D printing model) is the distribution of a set of distances that is computed from a set of two random points on the surface of a 3D triangle mesh model. Figure 5 shows a D2 shape distribution example from a 3D triangle mesh. So, to compute the D2 shape distribution, we have to generate N pairs of two random points on the surface of 3D triangle mesh and then calculate N distances from N pairs. As mention above, a 3D triangle mesh contains a set of triangles. Each triangle includes three vertices. In brief, we consider a 3D triangle mesh where V is a set of vertices; and F is a set of facets; where is formed from . From a set of vertices and a set of facets, we obtain N pairs of two random points:
where are two points which are randomly selected from {V, F}. We then calculate a set of distances: from N pairs of two selected random points, therein is the Euclidean distance between and as shown in Equation (2):
Next, we find the maximum and minimum distances from a set of above distances to determine the value range of distances. Assume that, are the minimum distance and maximum distance respectively. They are determined as shown in Equations (3) and (4):
After finding , we compute the D2 shape distribution of 3D triangle mesh by dividing the value range () into B bins; and count the number of distances that fall in each bin. The average width of each bin and the value range of each bin are calculated as shown in Equations (5) and (6):
Assume that each bin has corresponding distances. Thus, the D2 shape distribution of 3D triangle mesh is represented by B bins and each bin has distances as shown in Equation (7):
If we consider as the representative value of each bin , Equation (7) will be become:
After the D2 shape distribution computation process, we construct a D2 data vector from the histogram of the D2 shape distribution. The number of bins is the number of elements of that D2 vector. Thus, the D2 vector is a set of B elements (see Figure 6) and calculated by Equations (9) and (10). Therein is the number of distances fall in bin .
3.3. D2 Shape Distribution Training by CNNs
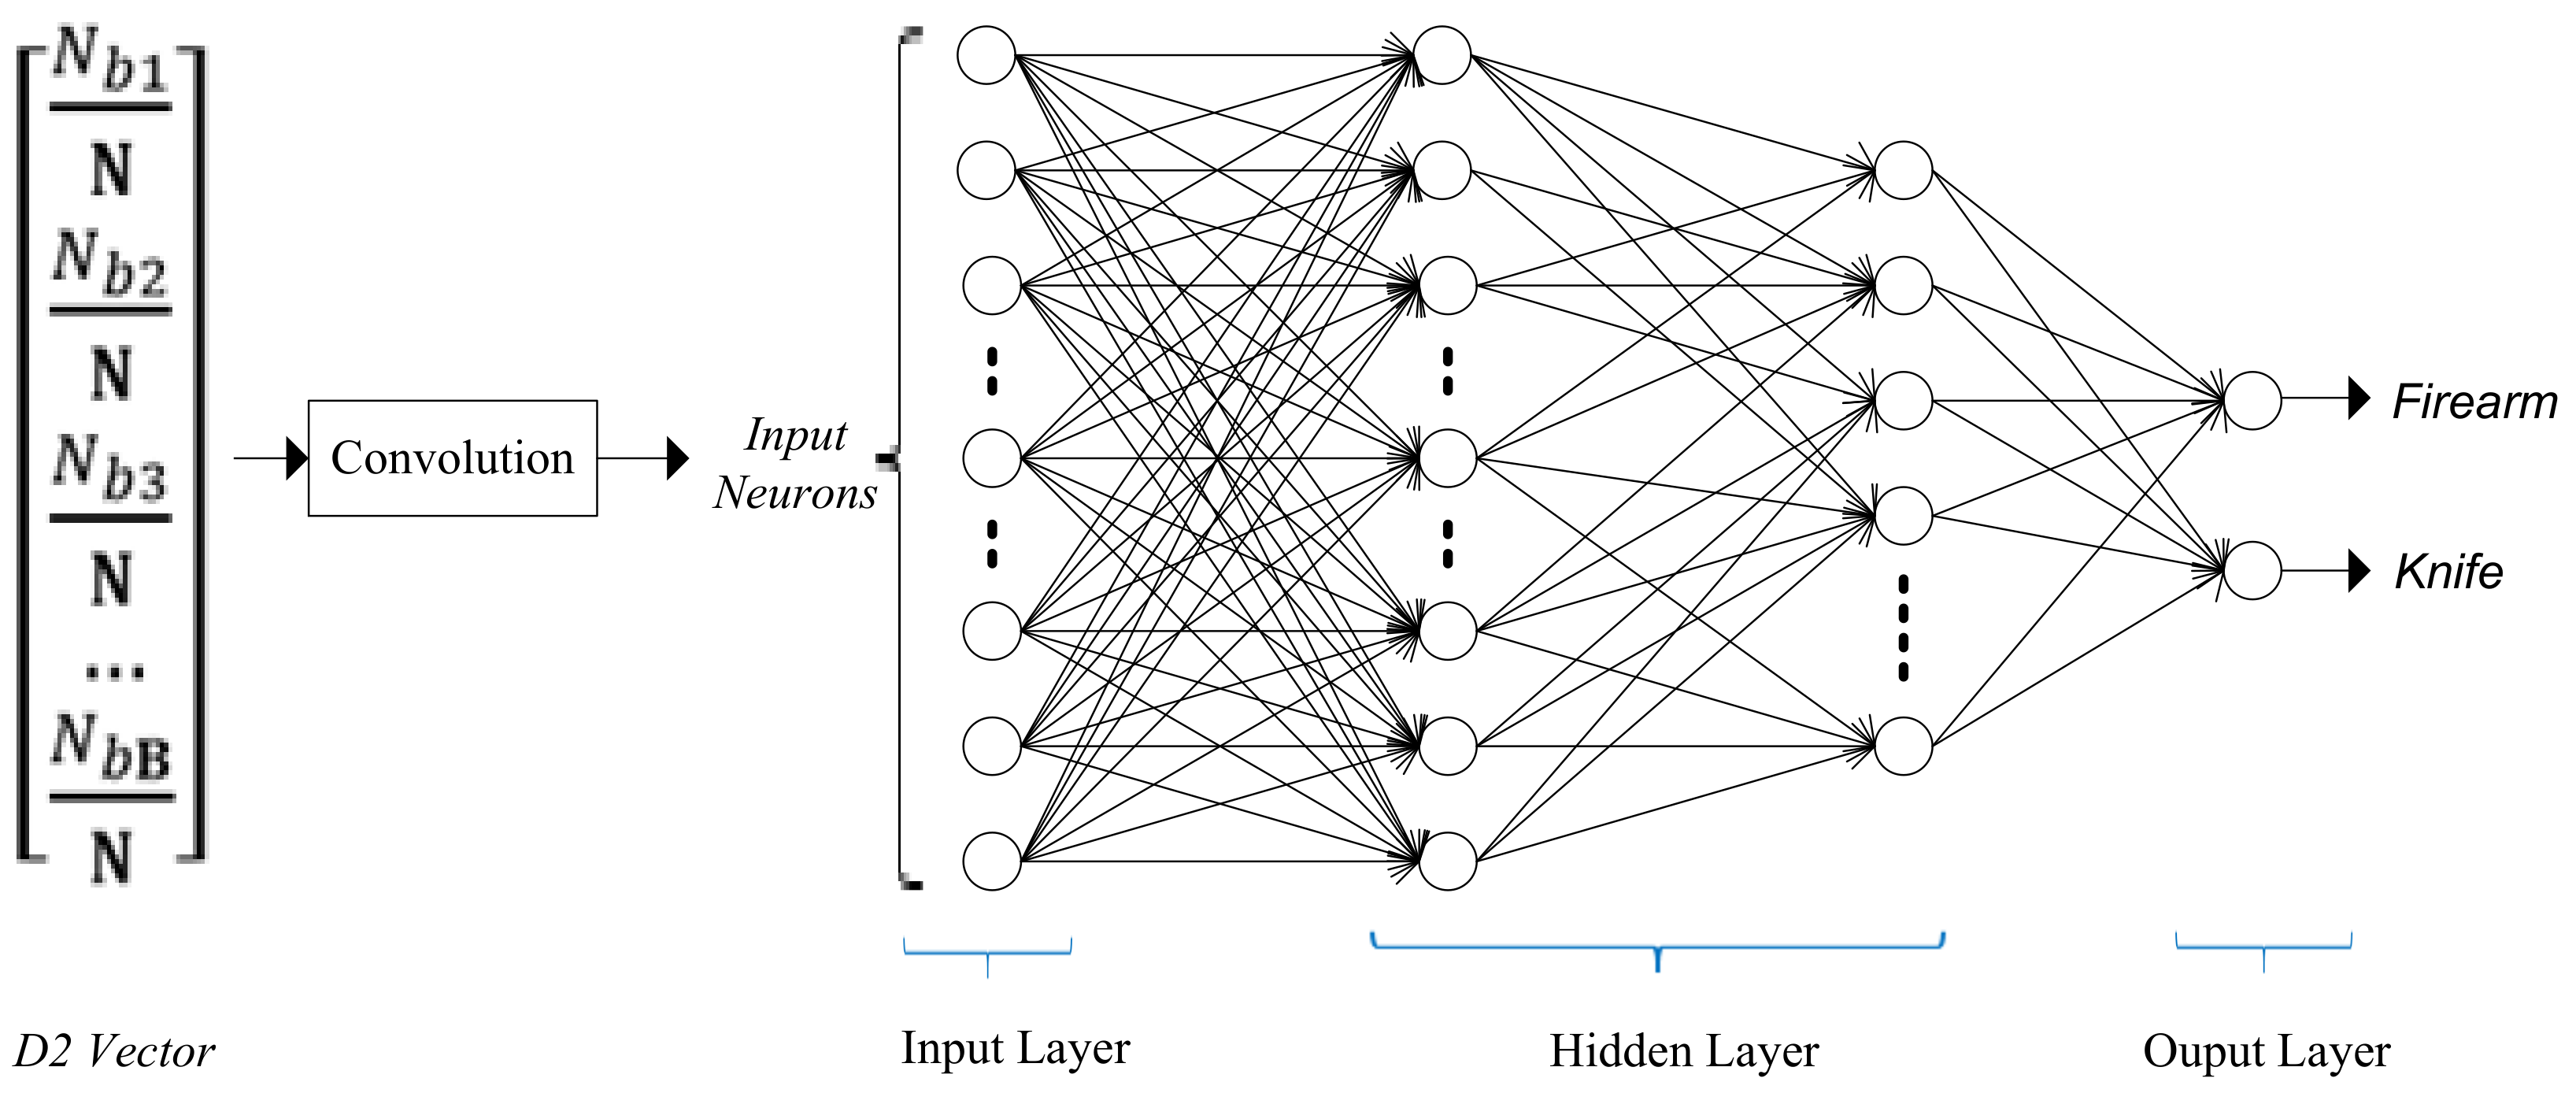
D2 vectors are computed from the dataset of 3D weapon triangle meshes, will be trained by improved CNNs. The structure of these CNNs consists of one convolution layer and a network of neurons (neural networks). The structure of these CNNs in the proposed algorithm is shown in Figure 7. The structure of neural networks consists of two hidden layers. The input of convolution layer is D2 vectors. Each D2 vector is a set of B discrete elements, and the output of convolution layer is input neurons for neural networks. Assume that is the convolution function of convolutional layer, and is the output of the convolution process [23]. The input neurons is computed as shown in Equation (11) where g is the kernel of convolution and m is the length of g:
For the training process by the neural networks, we use the back propagation algorithm [24] to train the input neurons . The back propagation algorithm is separated into four distinct sections: the forward pass, the loss function, the backward pass, and the weight update. During the forward pass, is passed through the whole network. The hyperbolic tangent function is applied as an active function to the hidden layer, and the soft-max function is applied as an active function to the output layer [25]. The loss function is used to compute the error of the output of neural networks. It is computed from the target output and real output. The loss function can be defined in many different ways but a common one is MSE (Mean Squared Error) [26]. Based on the error calculated by MSE function, the neural networks will adjust and update the weights and bias of the hidden layer via the backward pass and weight update process.
4. Experimental Results and Evaluation
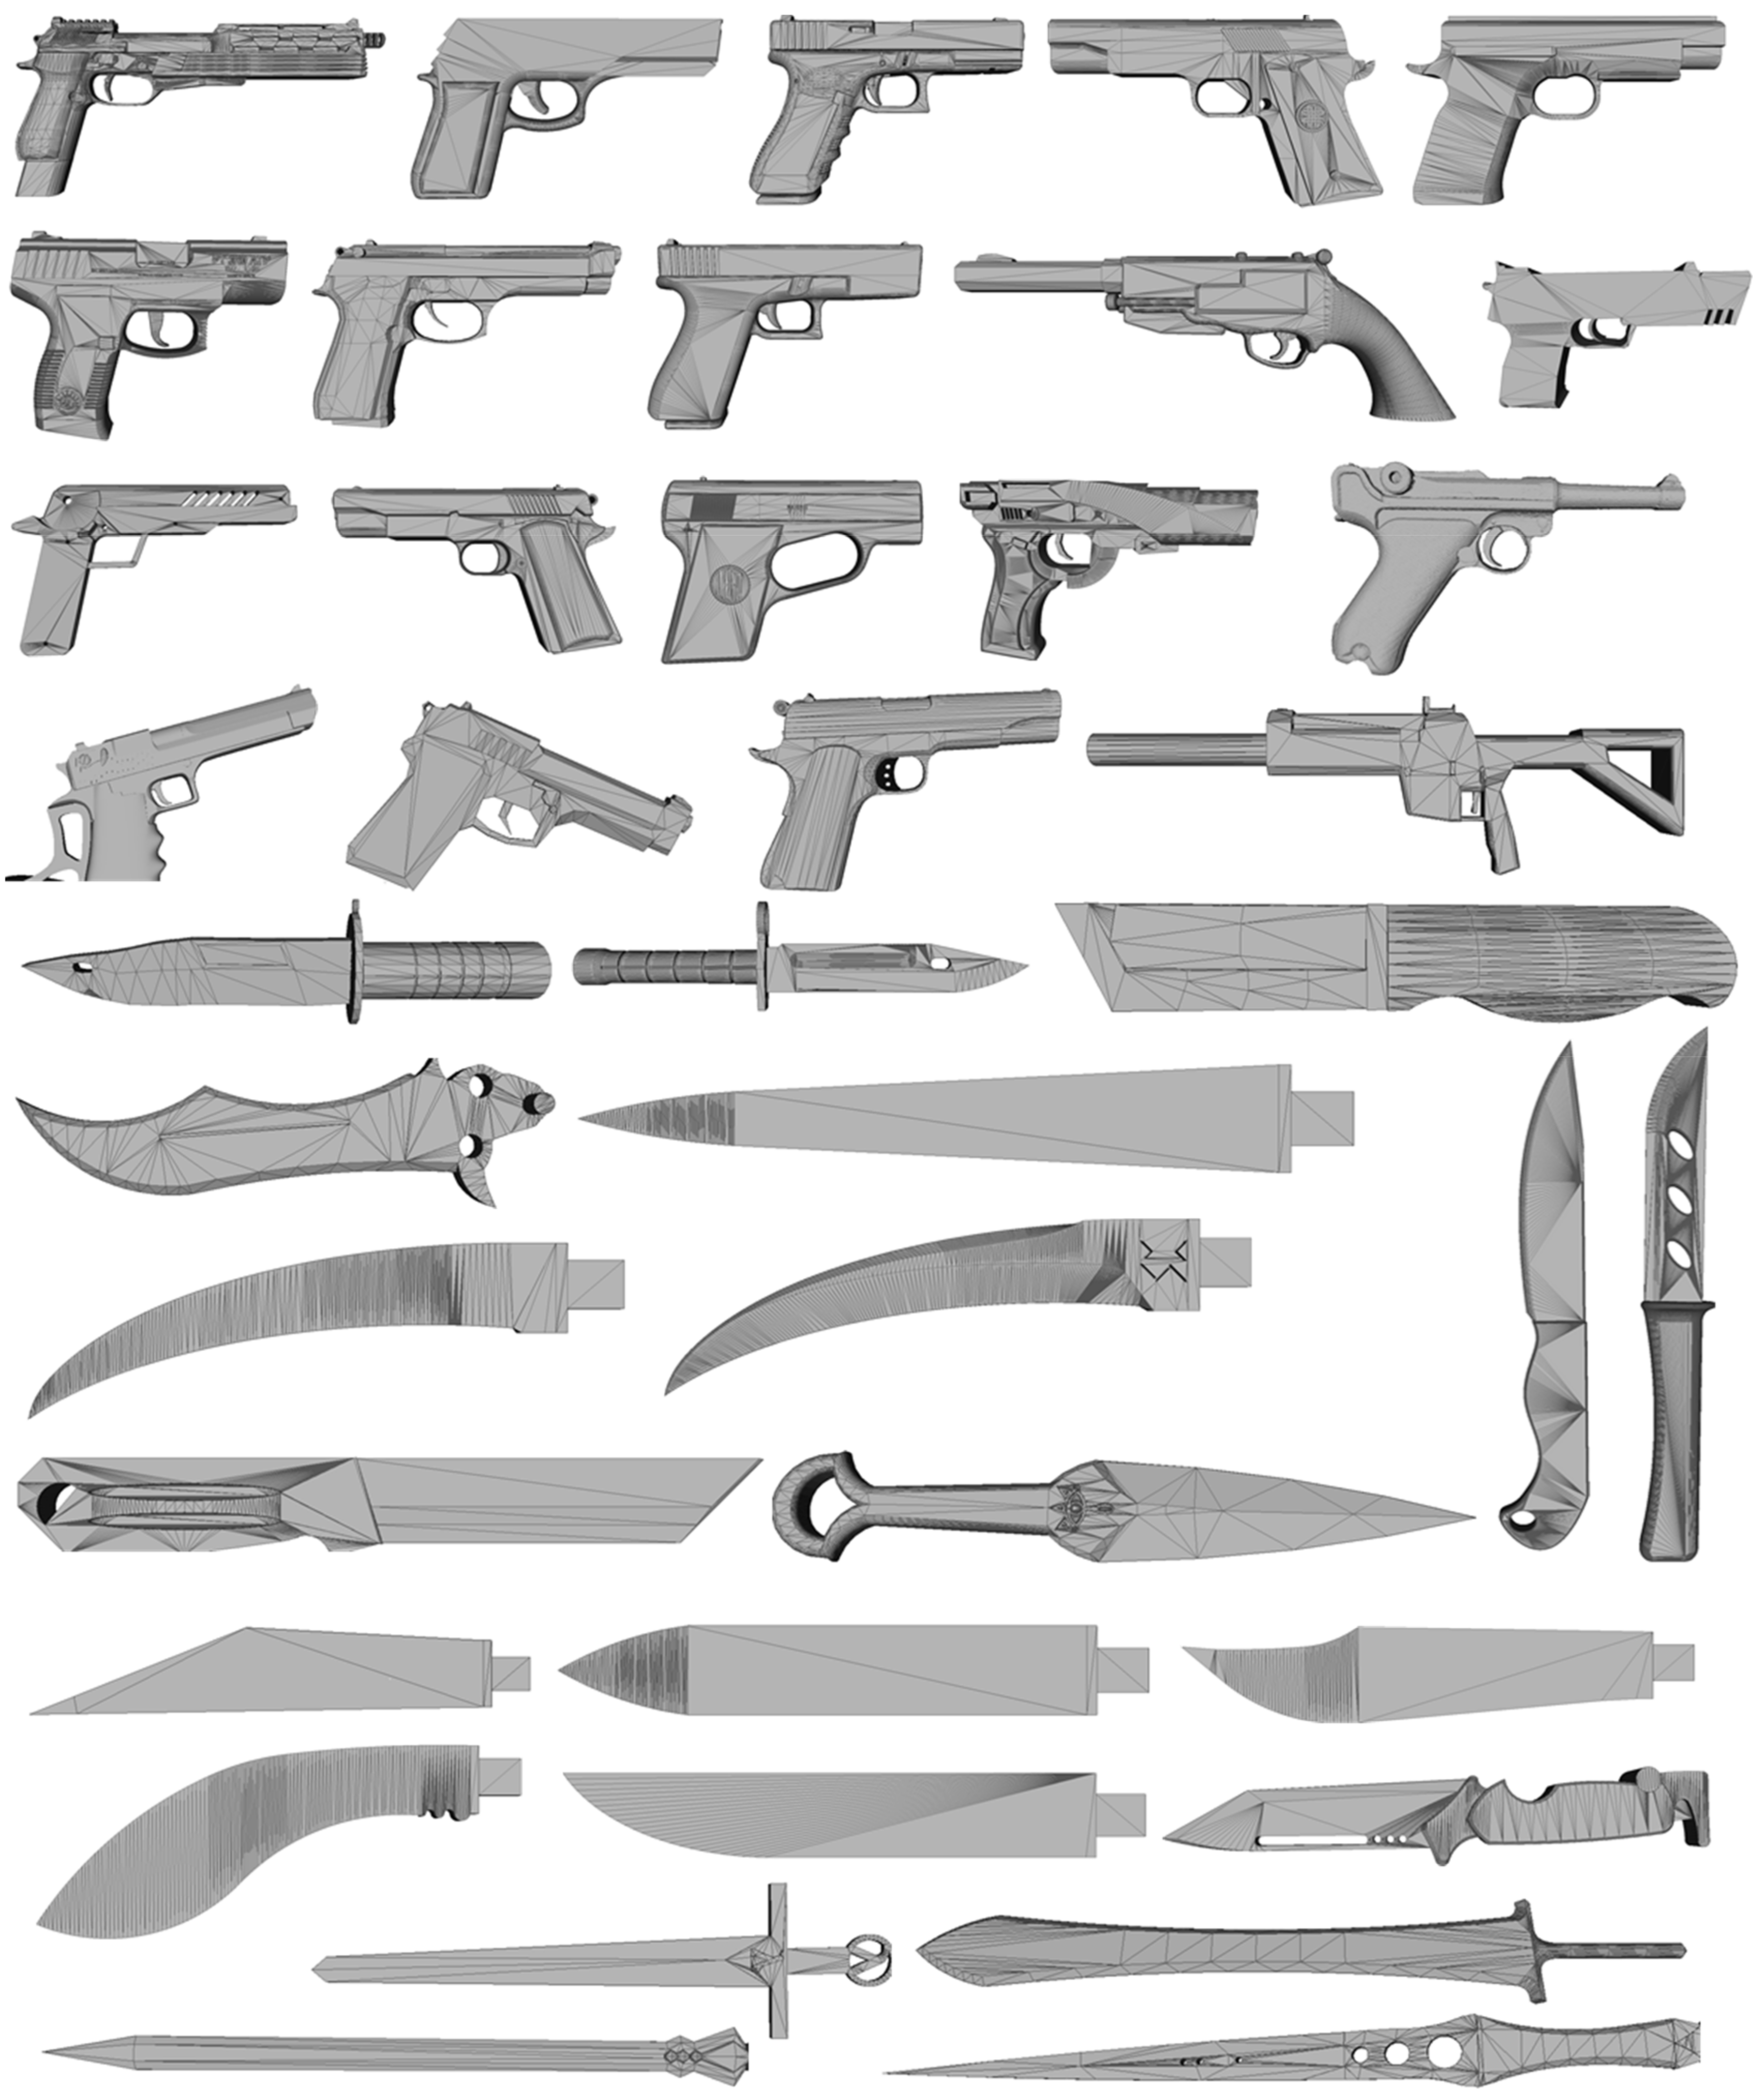
Due to the fact that 3D printers use 3D triangle meshes as input files, we collected 3D weapon triangle meshes and other 3D triangle meshes on the internet for experiments. The format of 3D triangle mesh models is the STL format [21] which is the popular format of 3D triangle mesh. The mentioned weapon objects in this work are firearm and knife, thus we divide datasets into classes for the experimental process. As is well known, there is currently no provider to provide the datasets of 3D triangle mesh models, especially firearms, guns and knives. Thus, we have to collect 3D weapon models from websites such as “thingiverse.com” where they provided free 3D triangle meshes and then we organized them into datasets as shown in Table 1. Figure 8 shows 3D weapon triangle meshes in datasets. To clarify the advantages of the proposed algorithm, we would like to present the experimental results of D2 shape distribution for each type of 3D triangle mesh models in Section 4.1. This section shows the histogram of the D2 shape distribution of 3D triangle mesh models including 3D weapon models and 3D non-weapon models for comparison. In Section 4.2, we show training results with improved CNNs present in Figure 7 in Section 3.3. The performance of the proposed algorithm is shown in Section 4.3. In this section, we will explain the disadvantages of the conventional works and compare the proposed algorithm to the conventional works.
4.1. Experimental Results of D2 Shape Distribution for 3D Triangle Mesh
In this section, we would like to show the experimental results of the D2 shape distribution applied to 3D triangle meshes. In our research, we computed the D2 shape distribution for both 3D weapon triangle meshes and 3D non-weapon triangle meshes to easily compare the difference between the D2 shape distribution of 3D weapon triangle mesh and the D2 shape distribution of 3D non-weapon triangle mesh. As mentioned in Section 3, in order to compute the D2 shape distribution of a 3D triangle mesh, we have to generate N pairs of two random points on the surface of a 3D triangle mesh. In our experiments, we selected 1024 × 1024 pairs of two random points (N = 1024 × 1024) for the D2 shape distribution computation process. After calculating distances from N pairs of two random points, we find the minimum value and maximum value of distances, then divide the value range into 1024 bins (B = 1024) and count the number of distances that fall in each bin. This means the histogram of the D2 shape distribution is presented by 1024 bins, and the D2 vector contains 1024 elements.
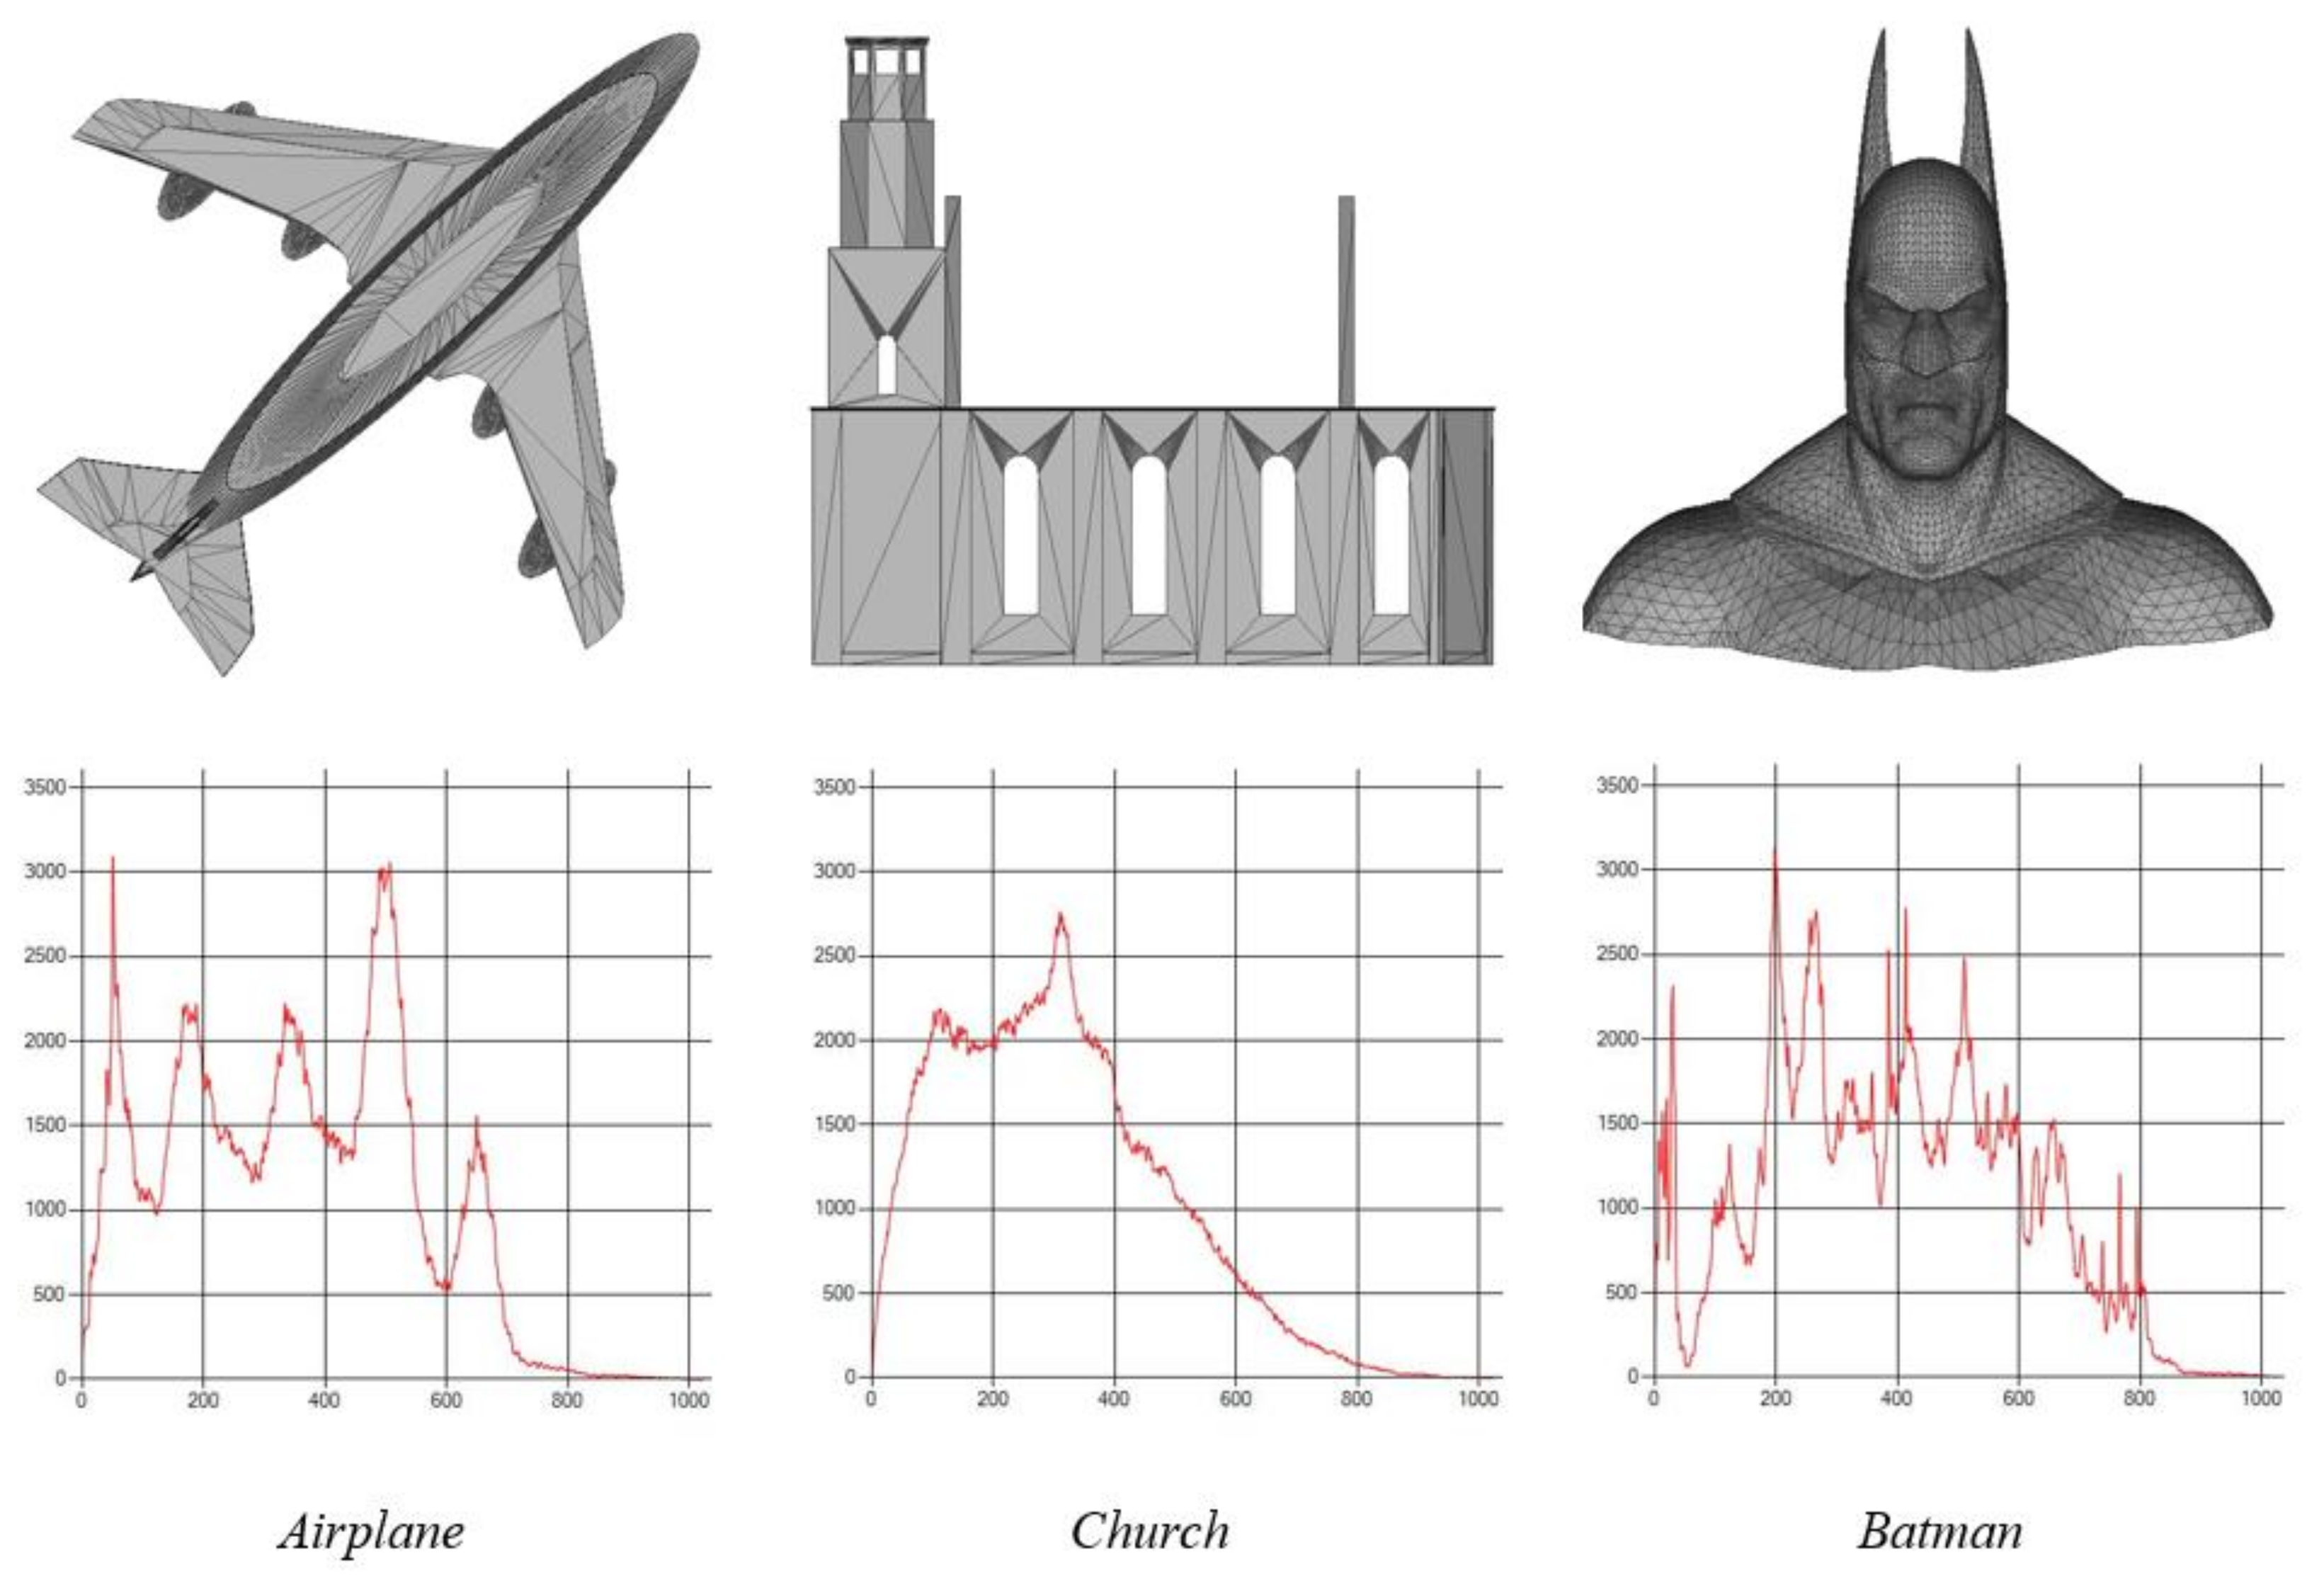
The experimental results of D2 shape distribution for each type of 3D model are shown from Figure 9, Figure 10 and Figure 11. The number of facets in each 3D triangle mesh in each class is different. Figure 9 shows the histogram of the D2 shape distribution of 3D firearm models in class “firearm”. The shape of these models is different and the number of facets in each model is also different. Figure 10 shows the histogram of the D2 shape distribution of 3D knife models in class “knife”. These models also have different shapes and different numbers of facets. We could see that although the number of facets in each 3D triangle mesh is different and the shape of each 3D triangle mesh is also different, the histograms of the D2 shape distribution of 3D triangle meshes in the same class are nonetheless similar (see Figure 9 and Figure 10). The D2 shape distributions of 3D triangle meshes in the same class are only a little different at the top and bottom of histogram graph. This leads to the value of elements in D2 vectors being approximate (refer Figure 6). Thus, it proved that the D2 vector of each 3D triangle mesh in the same class is similar. Additionally, in the same class, if D2 vectors are similar, this will lead the training result to be better. In addition, we also showed the histograms of the D2 shape distribution of 3D non-weapon models to compare to the D2 shape distribution of 3D weapon models. Figure 11 shows the histograms of the D2 shape distribution of 3D non-weapon models. Based on Figure 9Figure 10 and Figure 11, we concluded that their histograms are different from the histograms of the D2 shape distributions of 3D weapon models. This means that the D2 shape distribution of 3D weapon models is different from the D2 shape distribution of 3D non-weapon models. Thus, we could concluded that the D2 vectors of 3D weapon models are always different from the D2 vectors of 3D non-weapon models. Consequently, the D2 shape distribution feature of 3D weapon model is different from the D2 shape distribution feature of 3D non-weapon model, and we can use this feature for other applications related to recognition, classification or matching.
4.2. Training, Testing Results with CNNs
As is known, CNNs are currently applied to 2D images or 2.5D images (depth images). Thus there are many datasets of 2D images that are provided by some researchers or some organizations. This means researchers can easily find the dataset of 2D or 2.5D images. However, in our research, the input is the dataset of special 3D printing models such as firearms and knives. Currently, there is no provider for these datasets. Moreover, the cost of 3D printing models is very expensive and not freely available. Thus, we have to collect 3D weapon models such as firearms and knives, and then organize them into datasets to perform our experiments as shown in Table 1.
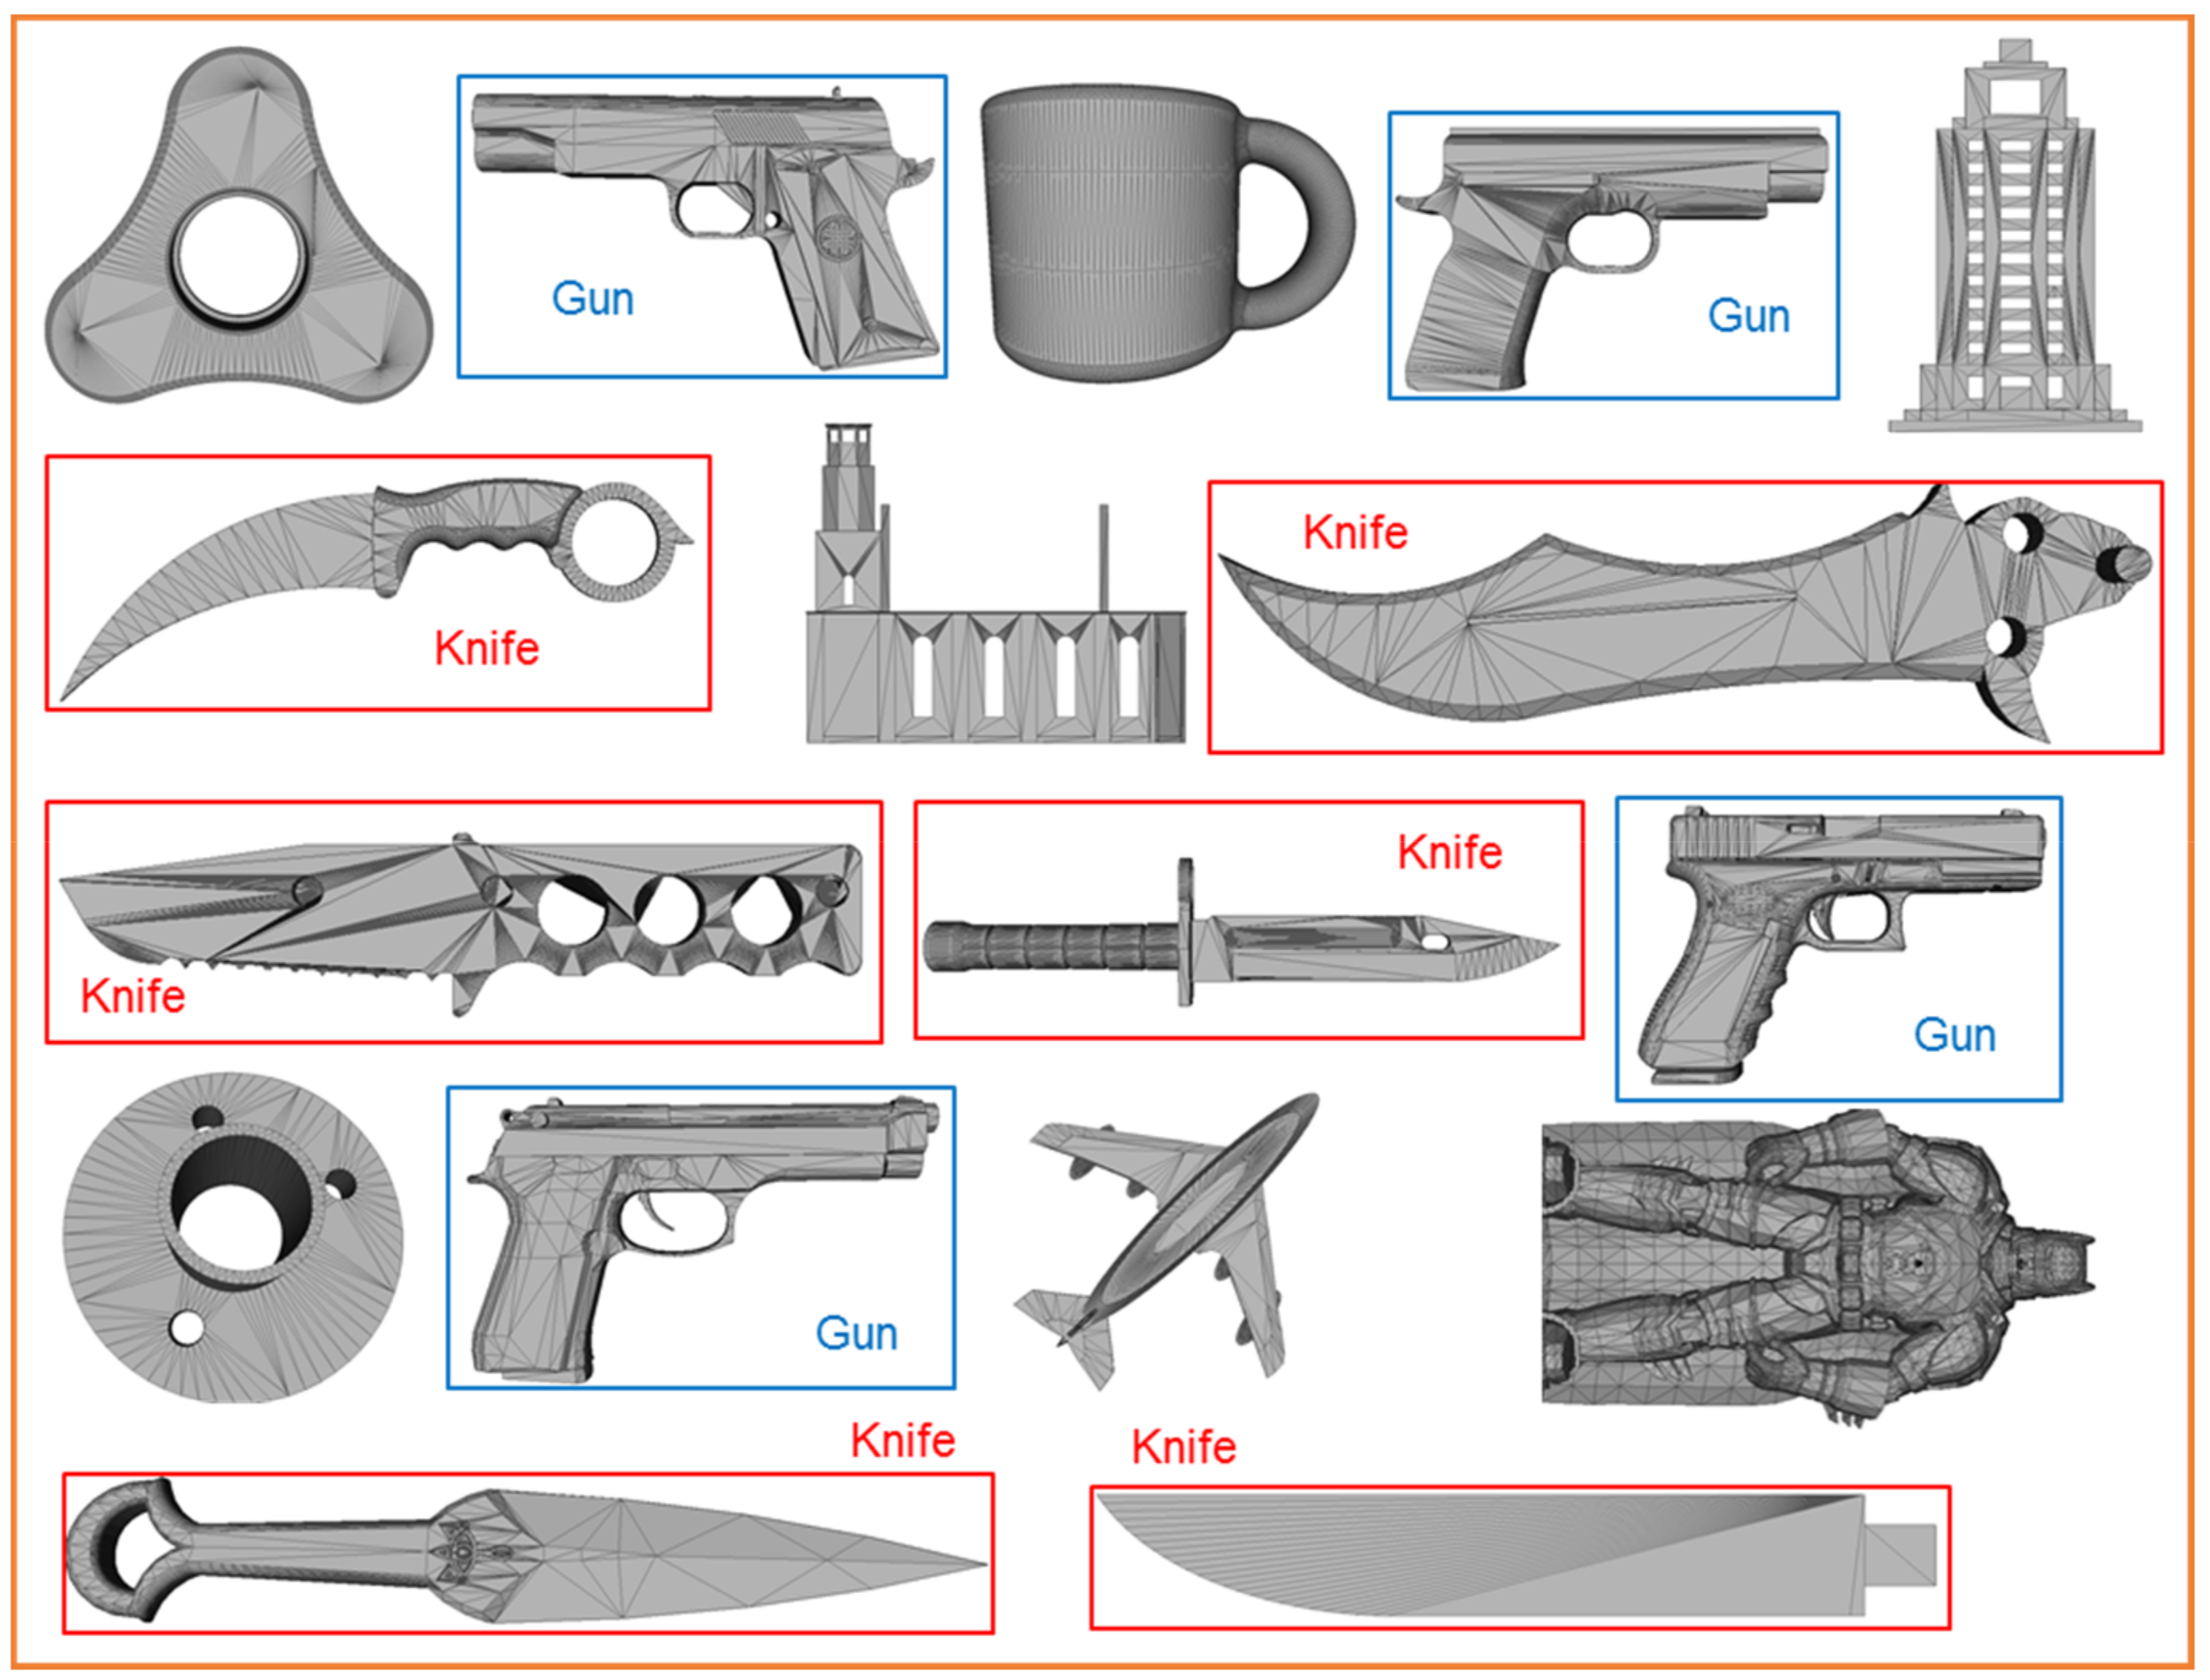
Since the purpose of the proposed algorithm is to be integrated into 3D printer software to prevent the printing of anti-3D weapon models, we only show the structure of CNNs, training and testing results with CNNs, and the accuracy of the proposed algorithm in this part. The input data of CNNs in the proposed algorithm is D2 vectors. Each D2 vector contains 1024 elements. In the convolutional layer, the length of kernel g is 5 (m = 5). Therefore, we design the structure of CNNs as follows: the input layer has neurons, the first hidden layer has 1020 neurons, the second hidden layer has 15 neurons and the output layer has two neurons. Datasets in our experiments are shown in Table 1. Eight percent of each dataset is used for the training process, and the remaining 20% of each dataset is used for the testing process. Training and testing results with each dataset are shown detail in Table 1. Based on Table 1, we concluded that with small datasets the rate of true results is very low. With big datasets the rate of true results will be increased (see Figure 12). This means that if we use a large amount of 3D triangle meshes, we will get high accuracy. The average accuracy of the proposed algorithm is formed from 42.50% to 98.03% with datasets in Table 1. Consequently, we achieved the average accuracy 98.03% with 4000 3D triangle mesh models. We used the core of the proposed algorithm to program a small application. It could detect 3D weapon models such as knives and guns as described in Figure 13.
4.3. Performance Evaluation
As we mentioned in Section 1, until now there is no published research yet to prevent the printing of 3D weapon models in the 3D printing industry. Moreover, we simulated the proposed algorithm by C++ and investigated through experimentation the proposed algorithm on the following system: Intel Core i7-CPU 3.5 GHz; RAM-8 Gigabytes; Windows 7 Microsoft-64 bits. This is a normal system operating on CPU, not working on GPU. Thus, we will not compare the proposed algorithm to the conventional works by the performance of computation time or other parameters. We only evaluate the performance of the proposed algorithm by comparing the accuracy of the proposed algorithm with the accuracy of 3D model matching methods.
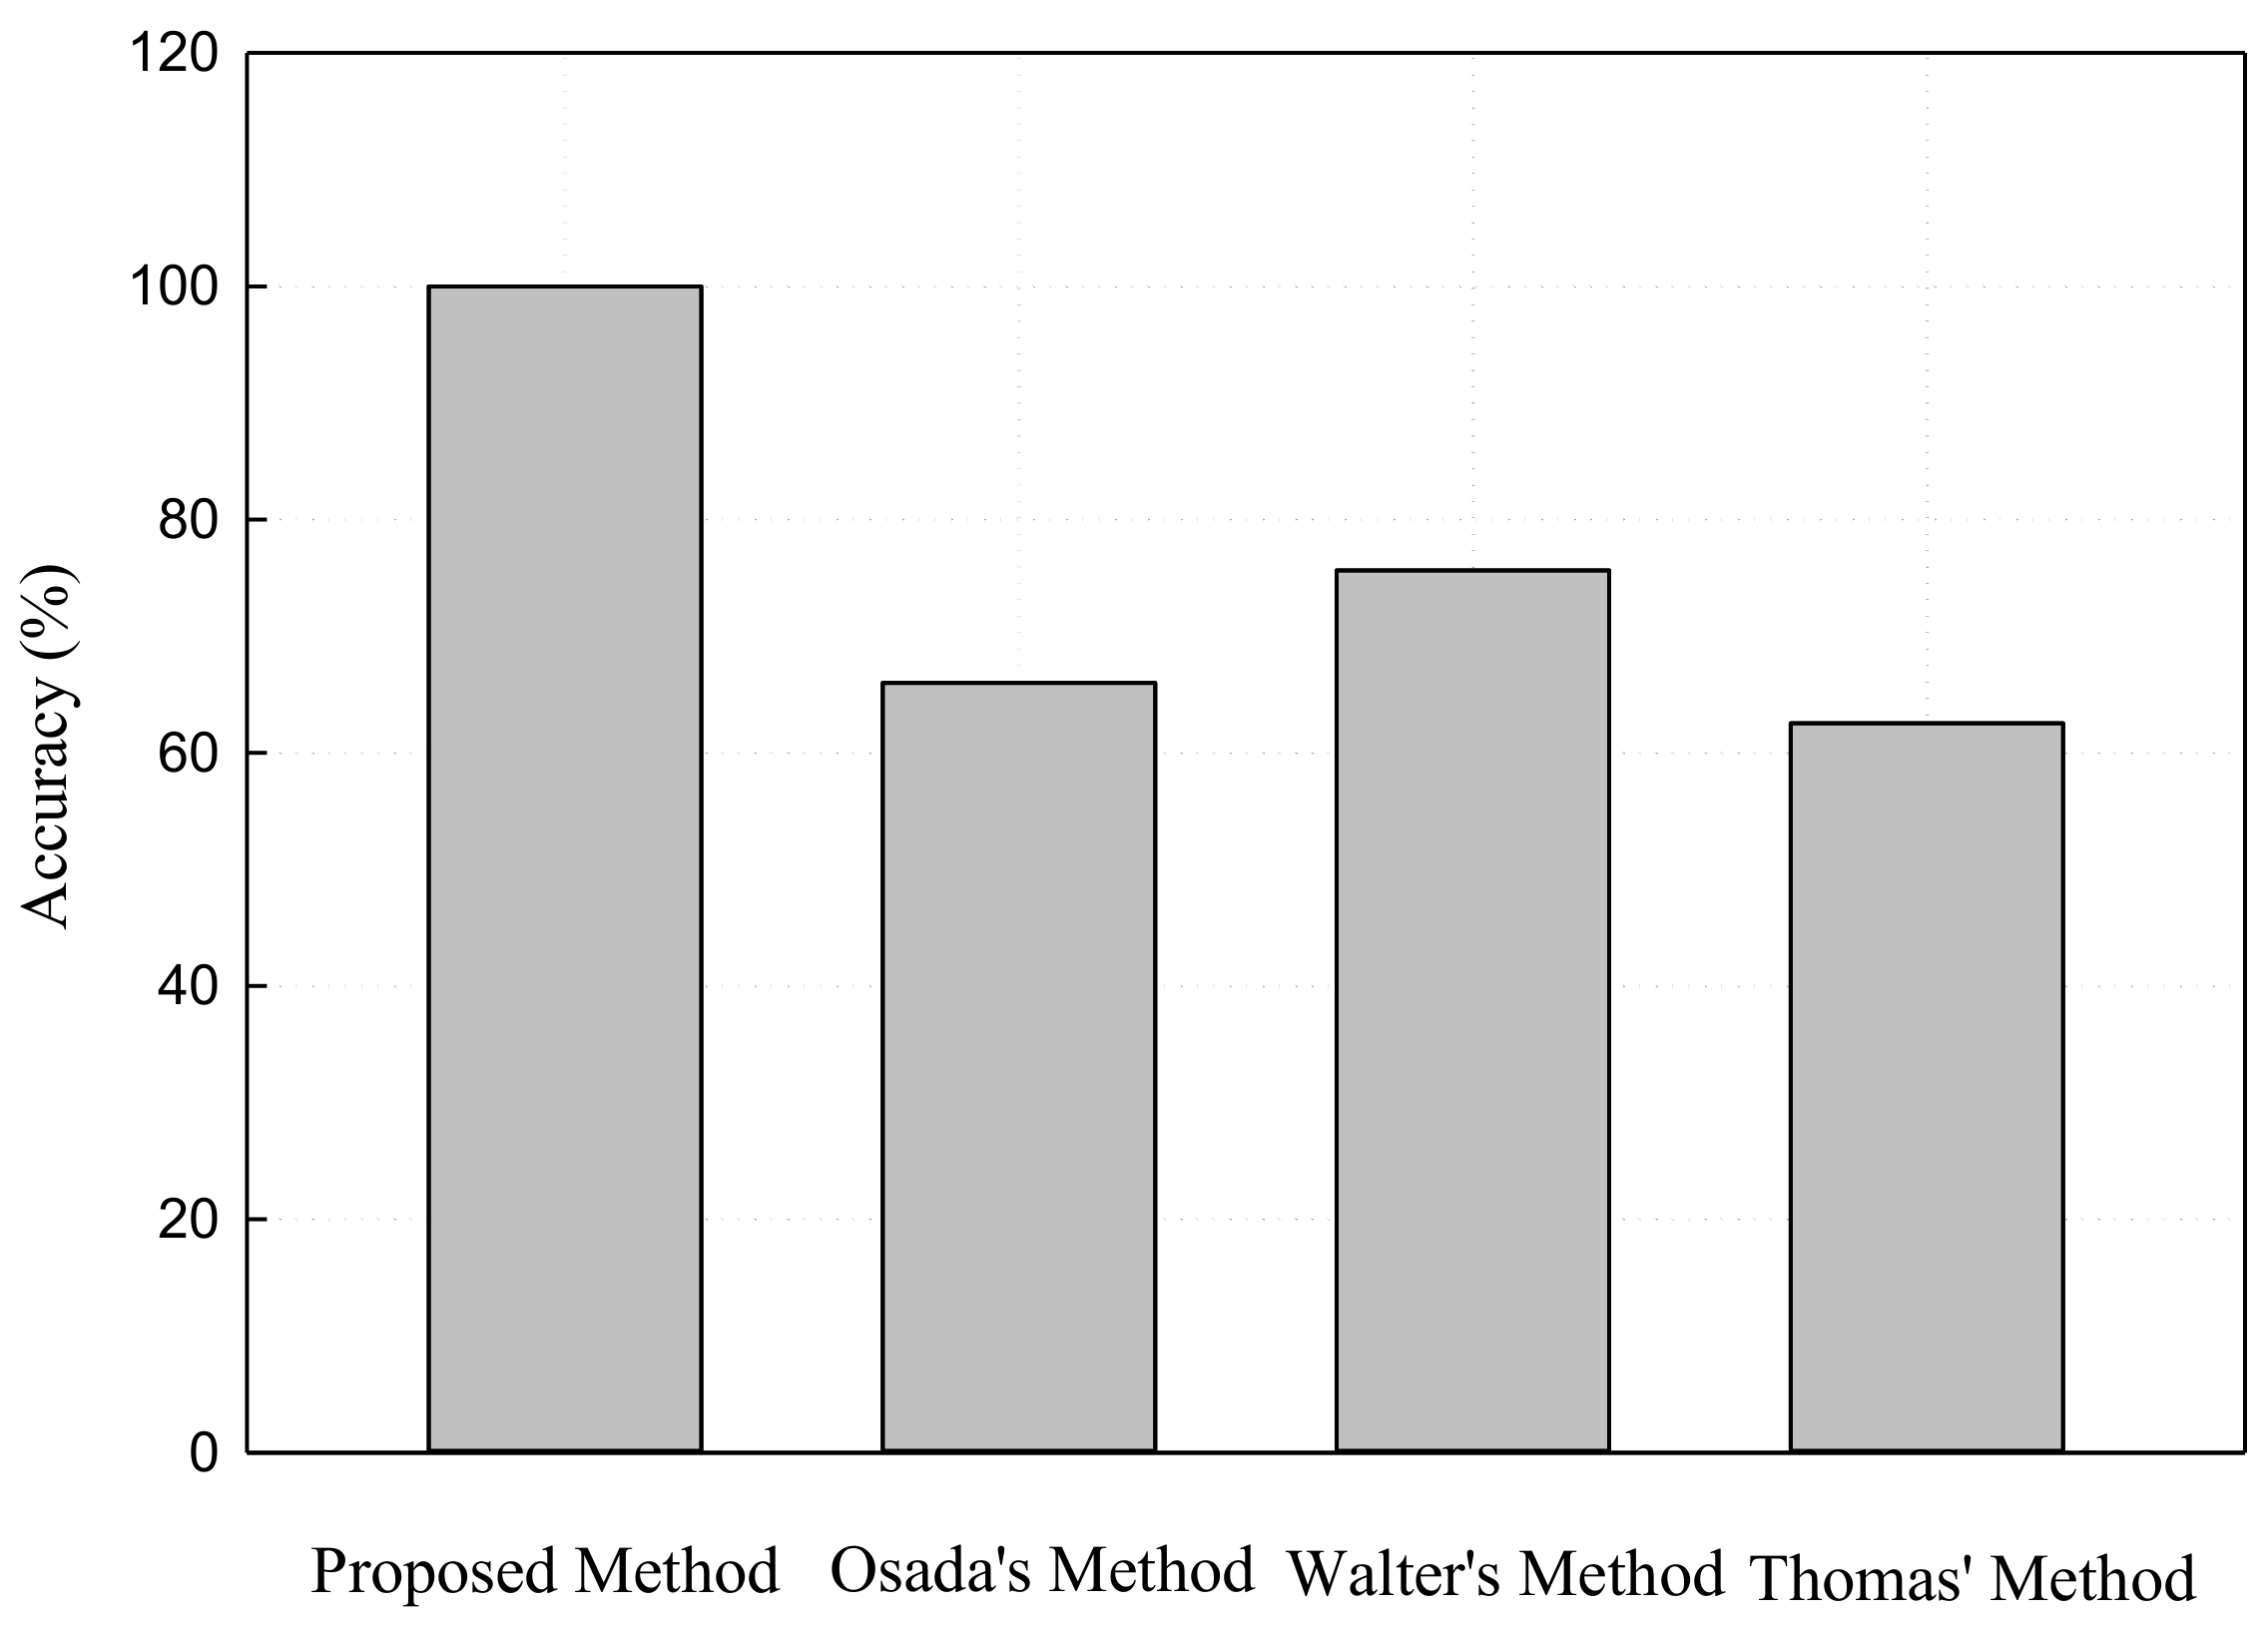
Thomas’ method [17] used the features of a 3D model as text, 2D sketch and 3D shape (he also used D2 shape distribution) to propose a search engine for 3D models. The key content of Thomas’ method is to compute the text, 2D sketch and 3D shape features of an input 3D model and then use these features to query similar 3D models in a database of 3D models. He implemented his method in an experiment with five classes “chair, elf, table, cannon and bunkbed”. He showed retrieval results with queries comprising only text, only 2D sketches, 3D shape and both combined. The average accuracy of this method for 3D shape is 62.54%. In Walter’s method [18], he proposed a 3D model matching method based on depth image. Three-dimensional models in a database are represented by depth images. The input of Walter’s method is a 3D model. The 3D model is then used to generate a depth image by RGB-D sensor and single view. Finally, this depth image is used to query similar 3D models from the database of 3D models. Walter undertook his method with six classes of 3D hammer, mug, airplane, bottle, car and shoe models. He achieved accuracies of 76%, 86%, 85%, 64%, 75% and 68%, respectively. So, the average accuracy of Walter’s method is 75.66%. In Osada’s method [19], he firstly introduced shape distributions such as A3, D1, D2, D3 and D4, and showed the experimental results of shape distributions for 3D polygon mesh to explain the difference between shape functions. Secondly, Osada used shape distributions to implement a search engine for 3D models. The core of this search engine is a 3D model matching method that used shape distributions. Osada implemented all five shape distributions in that search engine and tested with five classes as “chair, animal, cup, car and sofa”. The highest accuracy of this method is 66.00% when it uses D2 shape distribution to query similar 3D model in database. This means D2 shape distribution is the best features in the five shape distributions A3, D1, D2, D3 and D4. In Levi’s method [20], he presented a shape distribution for comparing 3D models. This shape distribution is an improved D2 shape distribution based on the ratio of face areas and the distance between two random points. The disadvantage of Levi’s method is that it did not to show “how many classes were in the experiment” and he did not show the accuracy of method. He only measured some parameters such as nearest neighbor, E-measure and Tiers which are better than in Osada’s method. Finally, he concluded that the improved D2 shape distribution in his method is better than the original D2 shape distribution in Osada’s method. Overall, previous authors used D2 shape distribution to query similar 3D models in the database of 3D models. The accuracy of these methods is low because the D2 feature of 3D models is standardized. In our method, we only used D2 shape distribution to extract and construct the D2 vector of 3D printing models (the feature of 3D printing model). We then trained D2 vectors by improved CNNs. This helps the accuracy of our method to be better than the existing methods. Table 2 describes the difference between our method and the existing methods in detail. The average accuracy of the proposed algorithm is 98.03% after the training and testing processes with a dataset that contains 4000 models. Figure 14 shows the performance of the proposed algorithm compared to the matching methods. Consequently, the accuracy of the proposed algorithm is higher than the accuracy of conventional works.
5. Conclusions
In this paper, we proposed an algorithm to restrict the printing of anti-3D weapon models for safe 3D printing based on the D2 shape distribution and improved CNNs. The main content of the proposed algorithm is to use improved CNNs in order to detect anti-3D weapon models such as firearms and knives. The proposed algorithm recognizes 3D models based on recognizing the D2 shape distribution obtained from the surface of 3D triangle mesh of a 3D object. We selected and used the D2 shape feature based on the previous published studies. Previous researchers concluded that the D2 shape feature is better than other shape features, and our experiments also proved this. Experimental results proved that the proposed algorithm can detect anti-3D weapon models such as firearms and knives with high accuracy. Compared to the conventional works of 3D model matching, the accuracy of the proposed algorithm is higher. The scientific contribution of the proposed algorithm is to show that CNNs could be used not only to recognize 2D shapes but also more complex 3D shapes. Next time, we will improve and collect more models to recognize many types of 3D weapon models. We will continue to expand our research to apply the component of weapons such as the components of guns. Later, we hope to integrate the proposed algorithm into 3D printer software to restrict the printing of anti-3D weapon models.
Acknowledgments
This research was supported by Basic Science Research Program through the National Research Foundation of Korea (NRF) funded by the Ministry of Education, Science and Technology (NRF-2016R1D1A3B03931003 and NRF-2017R1A2B2012456) and also the MSIP (Ministry of Science, ICT and Future Planning), Korea, under the Grand Information Technology Research Center support program (IITP-2016-R71181610050001002) supervised by the IITP (Institute for Information & communications Technology Promotion), he MSIP (Ministry of Science, ICT and Future Planning), Korea, under the Grand Information Technology Research Center support program (IITP-2017-2016-0-00318) supervised by the IITP (Institute for Information & communications Technology Promotion), and Brain Busan 21 (BB21) project.
Author Contributions
In this research activity, all of the authors joined and researched in the data analysis and preprocessing phases, the simulation, the results analysis and discussion, and the manuscript’s preparation. All of the authors have approved the submitted manuscript. All the authors equally contributed to the writing of the paper.
Conflicts of Interest
The authors declare no conflict of interest.
References
- How 3D Printing Works: The Vision, Innovation and Technologies Behind Inkjet 3D Printing; 3D Systems: Rock Hill, CA, USA, 2012; Available online: http://www.officeproductnews.net/sites/default/files/3dWP_0.pdf (accessed on 6 March 2018).
- Lidia, H.A.; Paul, A.J.; Jose, R.J.; Will, H.; Vincent, C.A. White Paper: 3D Printing; Atos: Irving, TX, USA, 2014; Available online: https://atos.net/wp-content/uploads/2016/06/01052014-AscentWhitePaper-3dPrinting-1.pdf (accessed on 6 March 2018).
- Chandra, T.A.; Patel, M.; Singh, P.K. Study of 3D Printing and its Application. Int. J. Res. Adv. Comput. Sci. Eng. 2016, 2, 9–12. [Google Scholar]
- Learn How 3D Printing Is Useful Everywhere. Available online: https://www.sculpteo.com/en/applications/ (accessed on 6 March 2018).
- The Terrifying Reality of 3D-Printed Guns: Devices that ANYONE Can Make Are Quickly Evolving into Deadly Weapons. Available online: http://www.dailymail.co.uk/sciencetech/article-2630473/The-terrifying-reality-3D-printed-guns-Devices-ANYONE-make-quickly-evolving-deadly-weapons.html (accessed on 6 March 2018).
- World Security Alert: Dutch Students Sneak Potentially Deadly 3D Printed Knives into Courtroom. Available online: https://3dprint.com/60530/3d-printed-knives-security/ (accessed on 6 March 2018).
- 3D Printed AR-15 Test Fire. Available online: https://www.youtube.com/watch?v=zz8mlB1hZ-o (accessed on 6 March 2018).
- Songbird 3D Printed Pistol. Available online: https://www.youtube.com/watch?v=1jFjtE7bzeU (accessed on 6 March 2018).
- Gustav, L. Why Should We Care about 3D-Printing and What Are Potential Security Implications; The Geneva Centre for Security Policy: Geneva, Switerland, 2014. [Google Scholar]
- Gerald Walther. Printing Insecurity? The Security Implications of 3D-Printing of Weapons. Sci. Eng. Ethics 2015, 21, 1435–1445. [Google Scholar] [CrossRef]
- Hossein, P.; Omid, S.; Mansour, N. A Novel Weapon Detection Algorithm in X-ray Dual-Energy Images Based on Connected Component Analysis and Shape Features. Aust. J. Basic Appl. Sci. 2011, 5, 300–307. [Google Scholar]
- Mohamed, R.; Rajashankari, R. Detection of Concealed Weapons in X-Ray Images Using Fuzzy KNN. Int. J. Comput. Sci. Eng. Inf. Technol. 2012, 2, 187–196. [Google Scholar] [CrossRef]
- Parande, M.; Soma, S. Concealed Weapon Detection in a Human Body by Infrared Imaging. Int. J. Sci. Res. 2013, 4, 182–188. [Google Scholar]
- Asnani, S.; Syed, D.W.; Ali, A.M. Unconcealed Gun Detection using Haar-like and HOG Features—A Comparative Approach. Asian J. Eng. Sci. Technol. 2014, 4, 34–39. [Google Scholar]
- Kumar, R.; Verma, K. A Computer Vision based Framework for Visual Gun Detection using SURF. In Proceedings of the 2015 International Conference on Electrical, Electronics, Signals, Communication and Optimization, Visakhapatnam, India, 24–25 January 2015; pp. 1–6. [Google Scholar]
- Xu, T. Multi-Sensor Concealed Weapon Detection Using the Image Fusion Approach. Master’s Thesis, University of Windsor, Windsor, ON, Canada, 2016. [Google Scholar]
- Thomas, F.; Patrick, M.; Michael, K.; Chen, J.; Alex, H.; David, D.; David, J. A Search Engine for 3D Models. ACM Trans. Graph. 2002, 5, 1–28. [Google Scholar] [CrossRef]
- Walter, W.; Markus, V. Shape Based Depth Image to 3D Model Matching and Classification with Interview Similarity. In Proceedings of the 2011 IEEE/RSJ International Conference on Intelligent Robots and Systems, Los Angeles, CA, USA, 25–30 September 2011; pp. 4865–4870. [Google Scholar]
- Osada, R.; Thomas, F.; Bernard, C.; David, D. Shape Distributions. ACM Trans. Graph. 2002, 21, 807–832. [Google Scholar] [CrossRef]
- Levi, C.; Ruiz, R.; Huang, Z. A Shape Distribution for Comparing 3D Models; Springer Lecture Note 4351; Springer: Berlin, Germany, 2007; pp. 54–63. [Google Scholar]
- STL Format in 3D Printing. Available online: https://all3dp.com/what-is-stl-file-format-extension-3d-printing/ (accessed on 30 March 2018).
- The Virtual Reality Modeling Language. Available online: http://www.cacr.caltech.edu/~slombey/asci/vrml/ (accessed on 30 March 2018).
- Convolution. Available online: http://mathworld.wolfram.com/Convolution.html (accessed on 30 March 2018).
- Rojas, R. Neural Networks: Chap 7 the Back-Propagation Algorithm; Springer: Berlin, Germany, 1996. [Google Scholar]
- Artificial Neural Networks/Activation Functions. Available online: https://en.wikibooks.org/wiki/Artificial_Neural_Networks/Activation_Functions (accessed on 6 March 2018).
- Mean Squared Error. Available online: https://www.probabilitycourse.com/chapter9/9_1_5_mean_squared_error_MSE.php (accessed on 30 March 2018).
Figure 1.
(a) Shape distribution example; and (b) Shape functions.

Figure 2.
(a) Distance between two random points; and (b) D2 shape distribution of some 3D models.
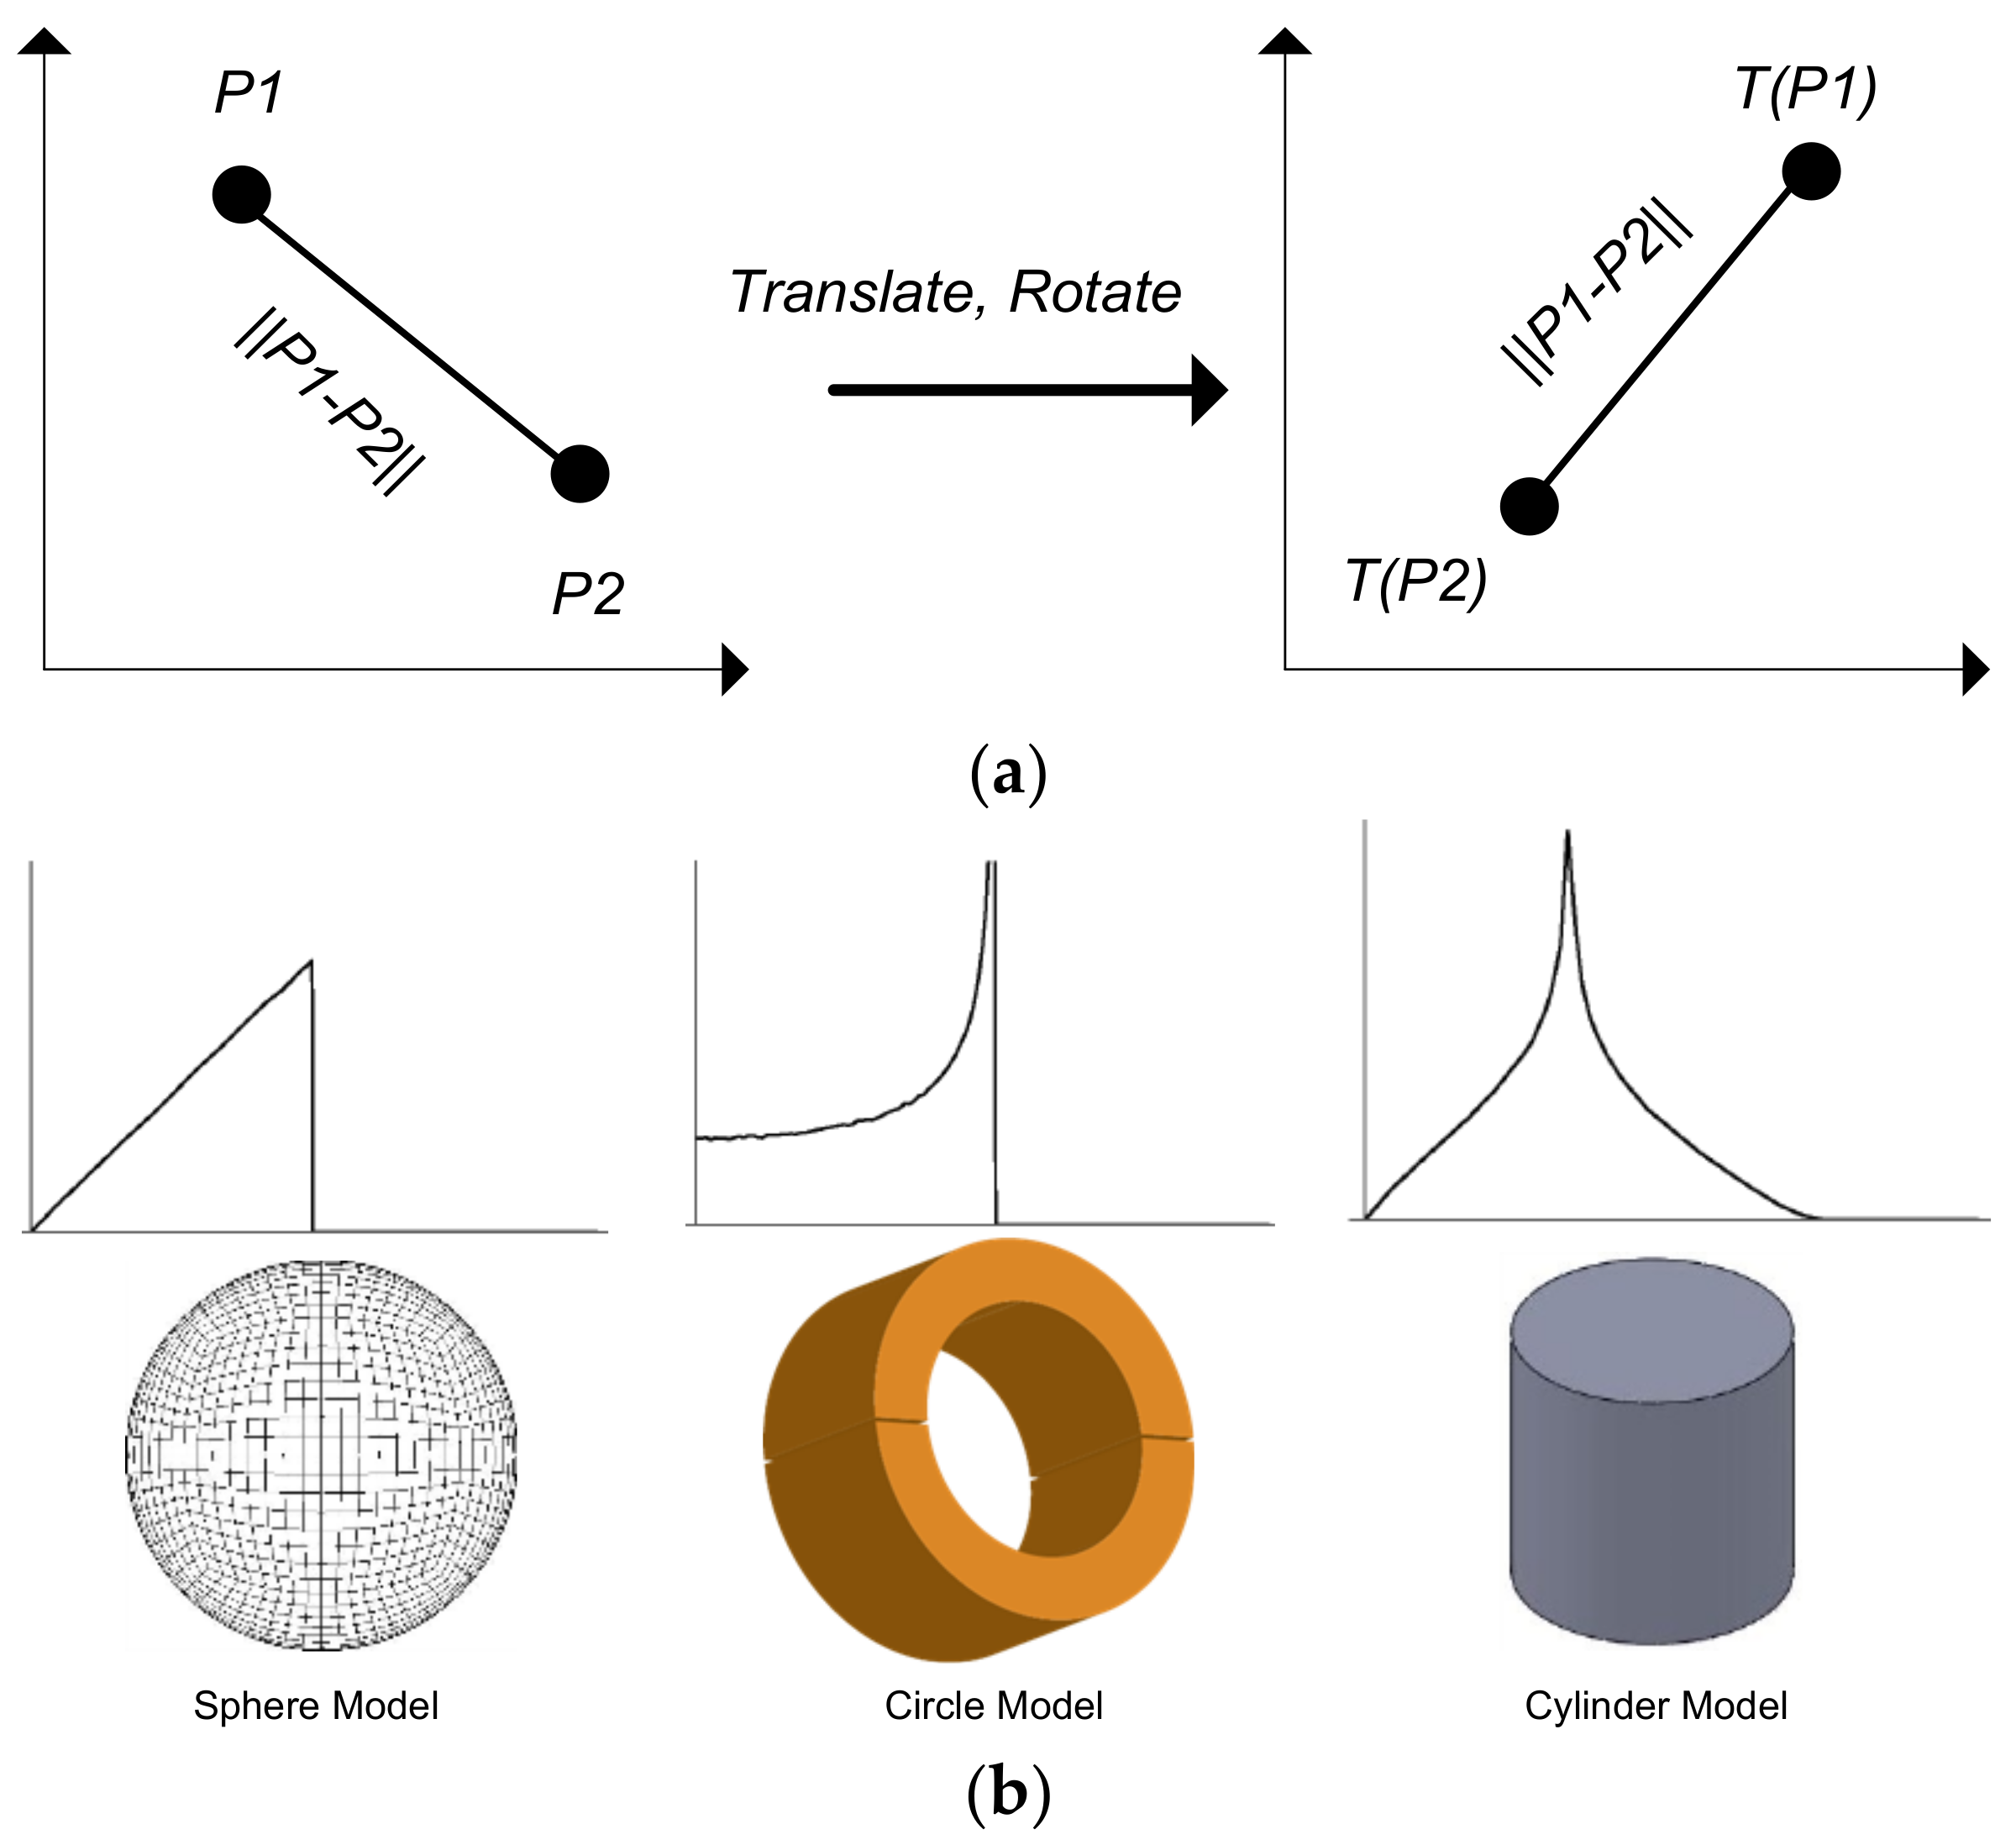
Figure 3.
Structure of a 3D triangle mesh.
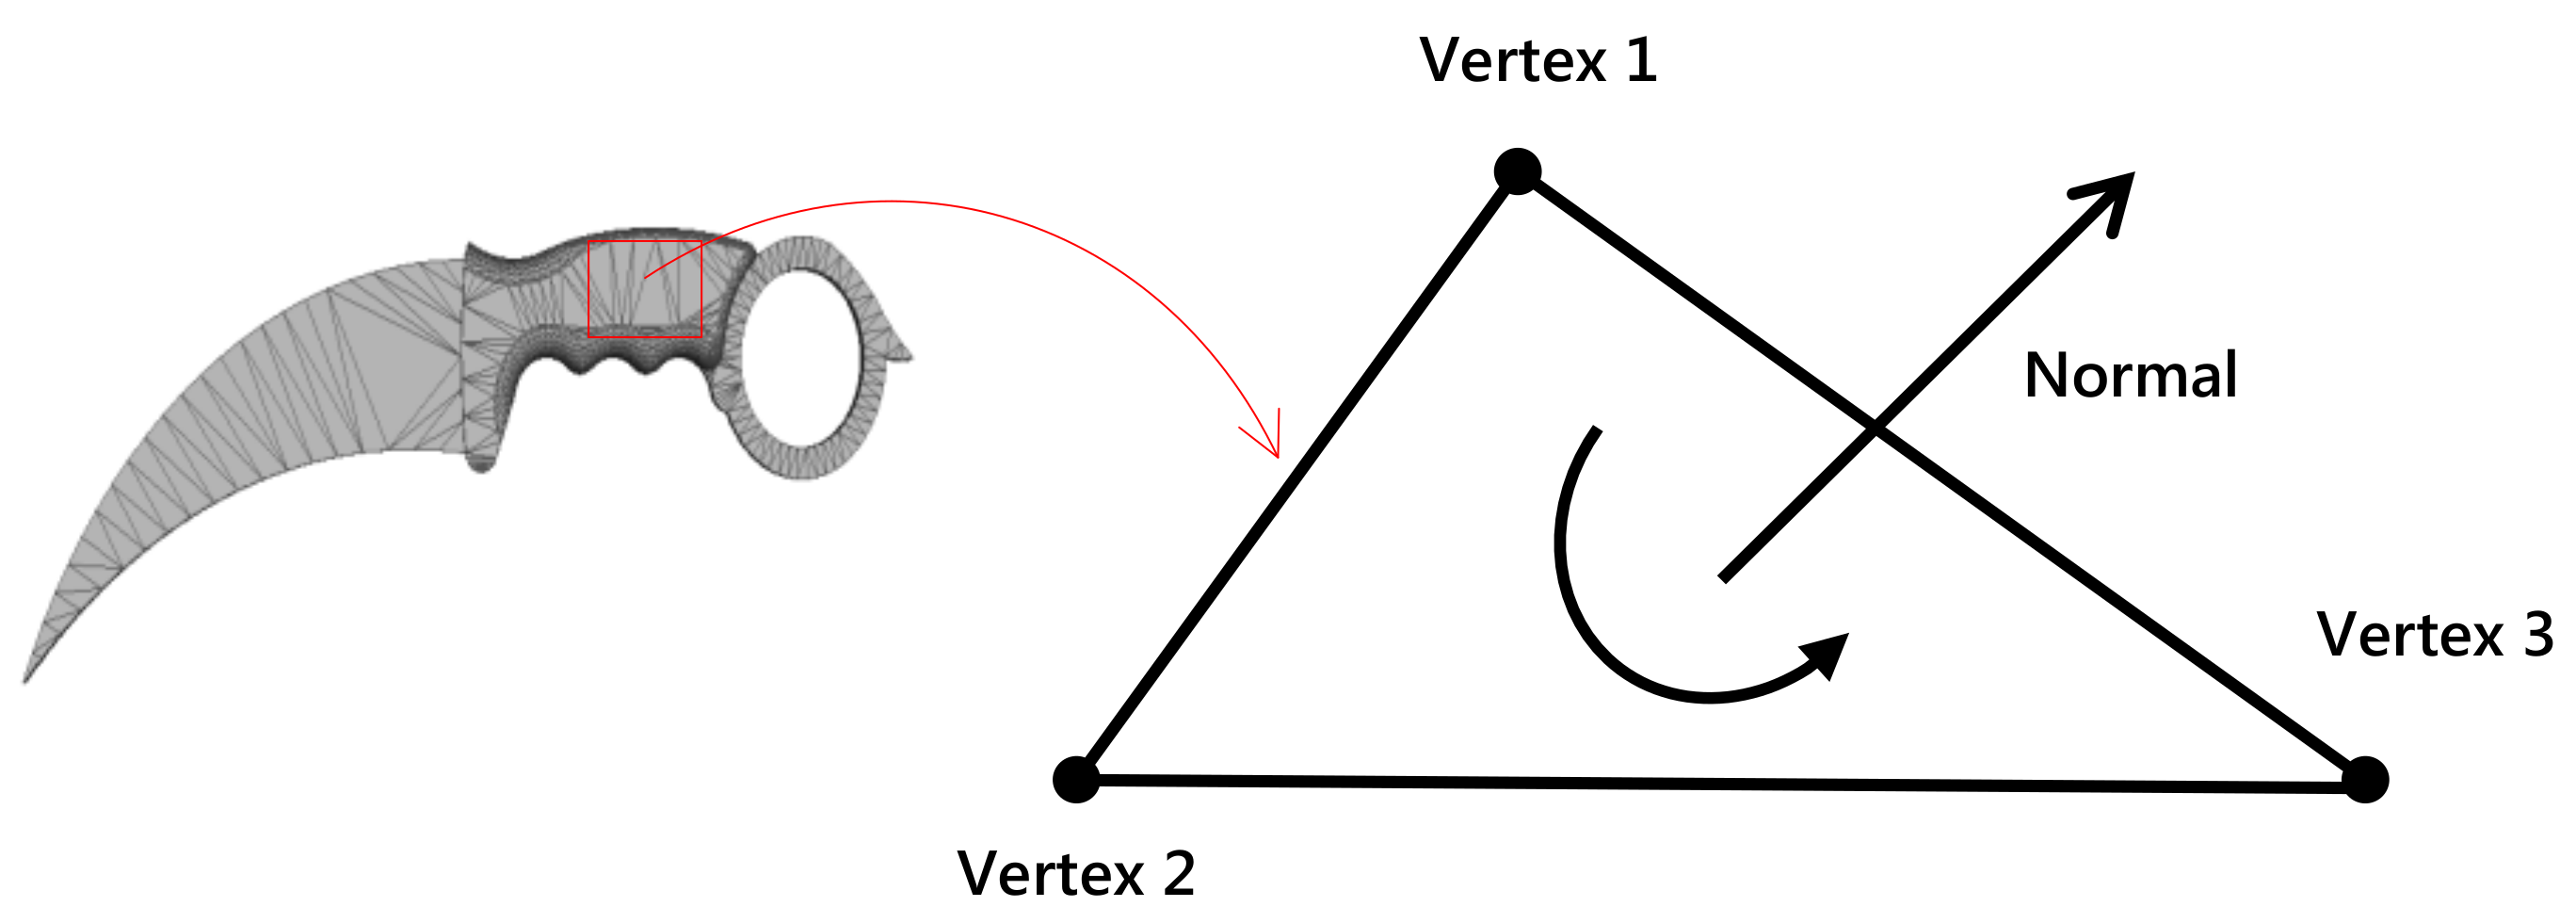
Figure 4.
The proposed algorithm.
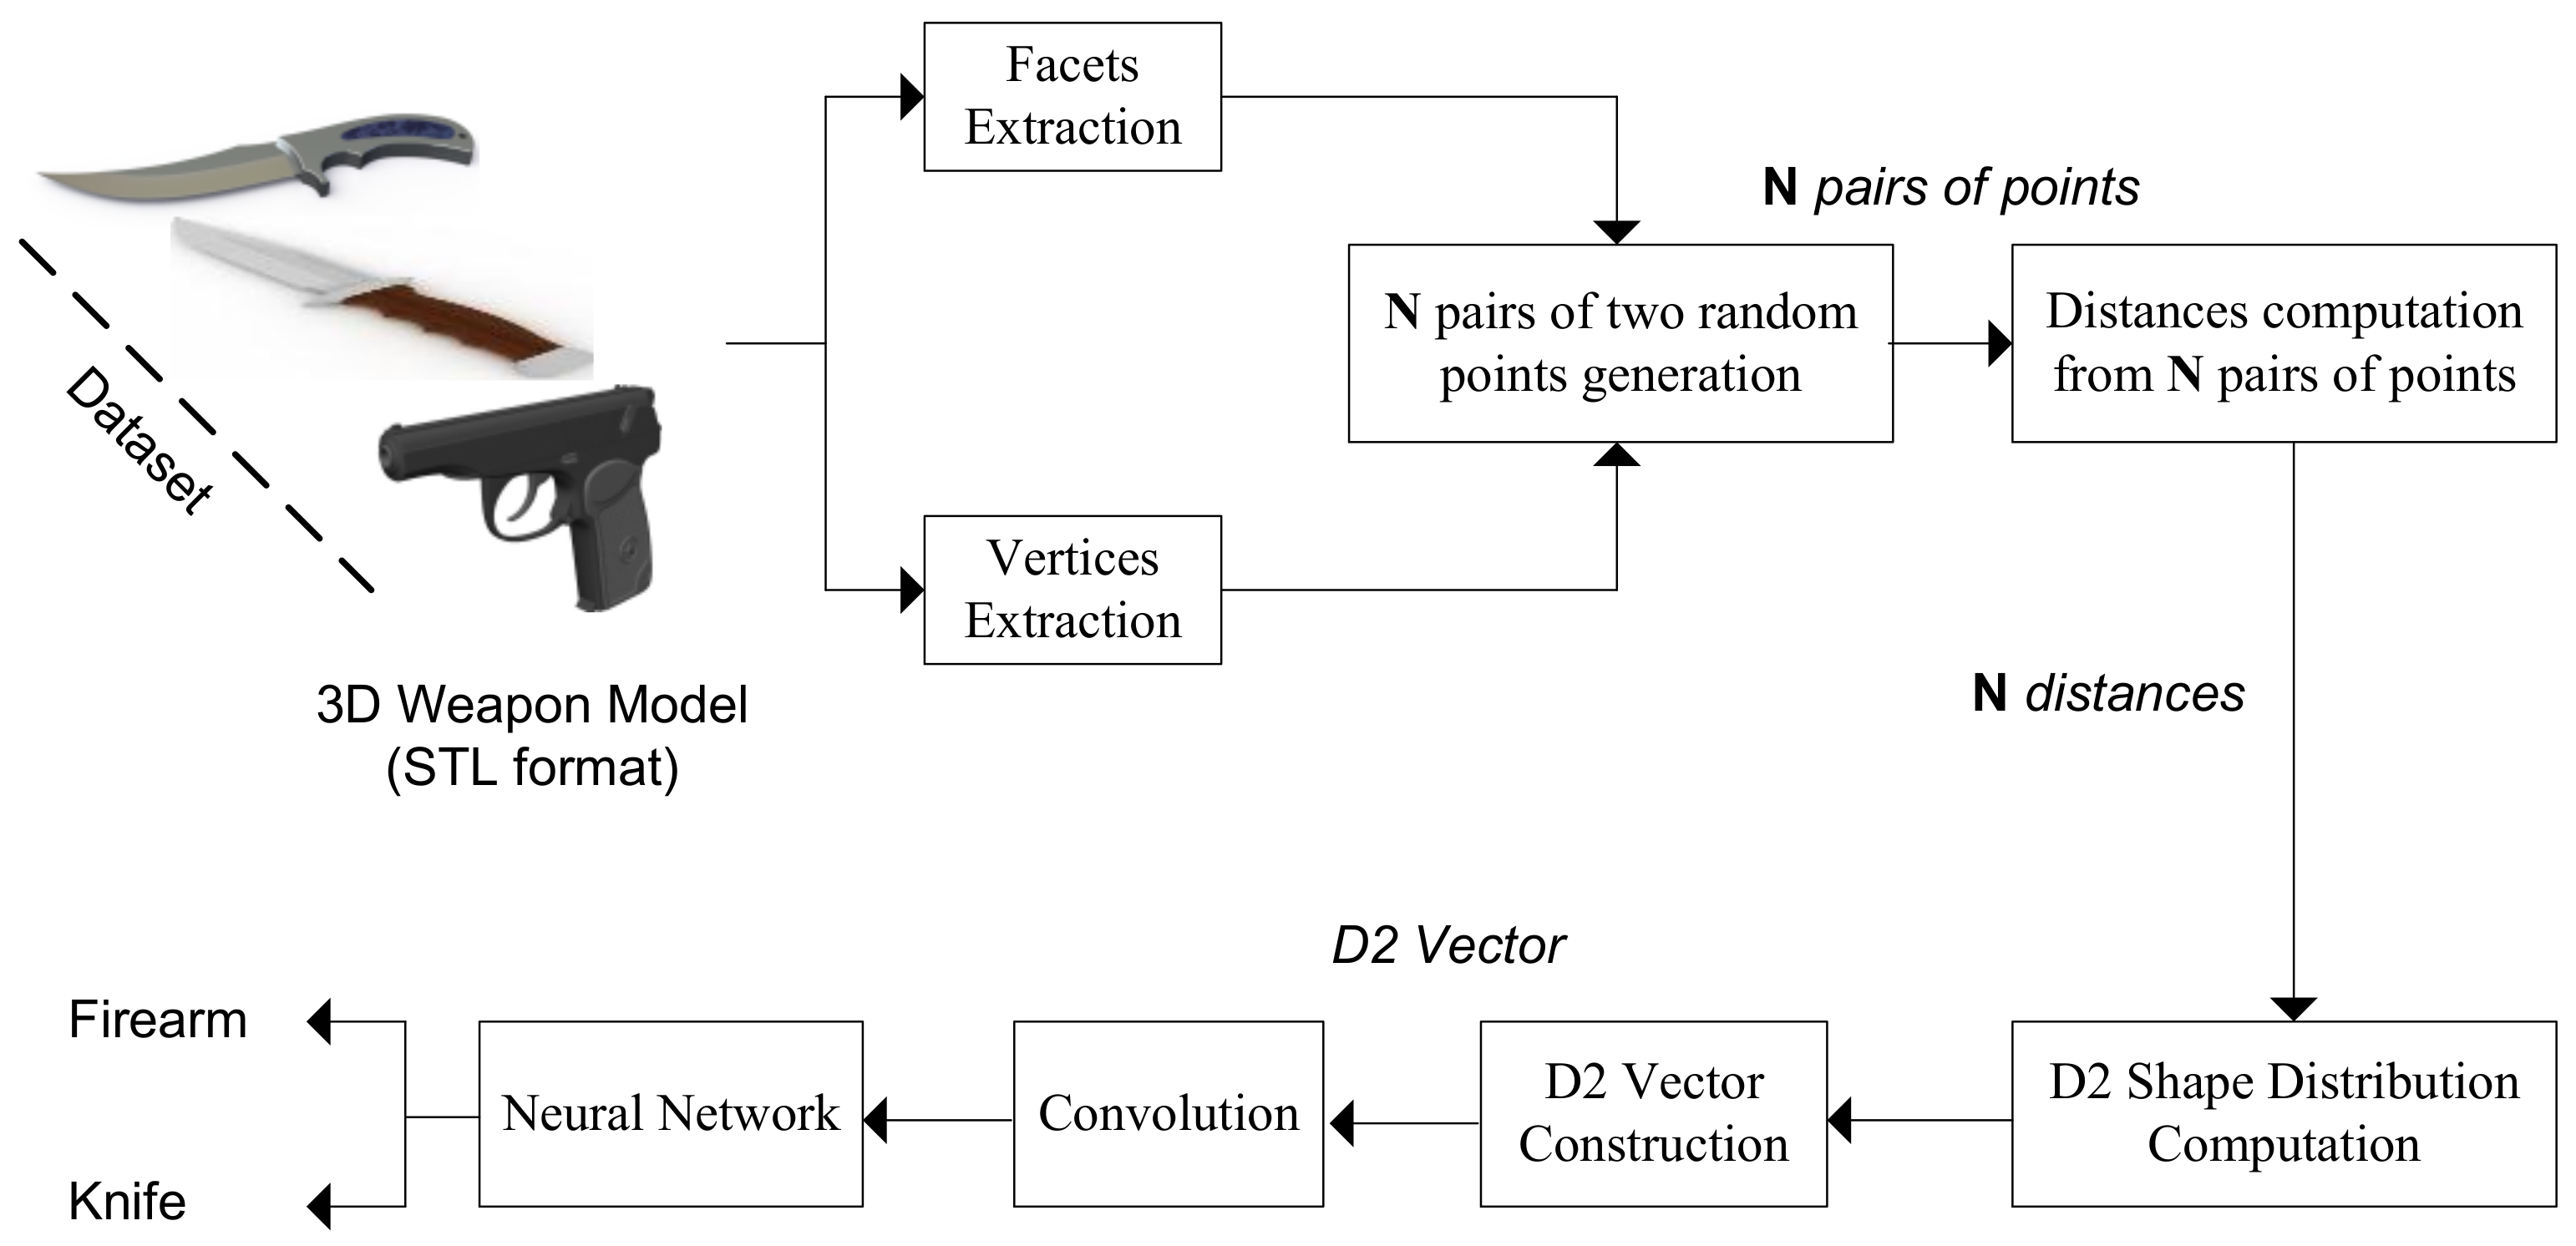
Figure 5.
D2 Shape Distribution Example.
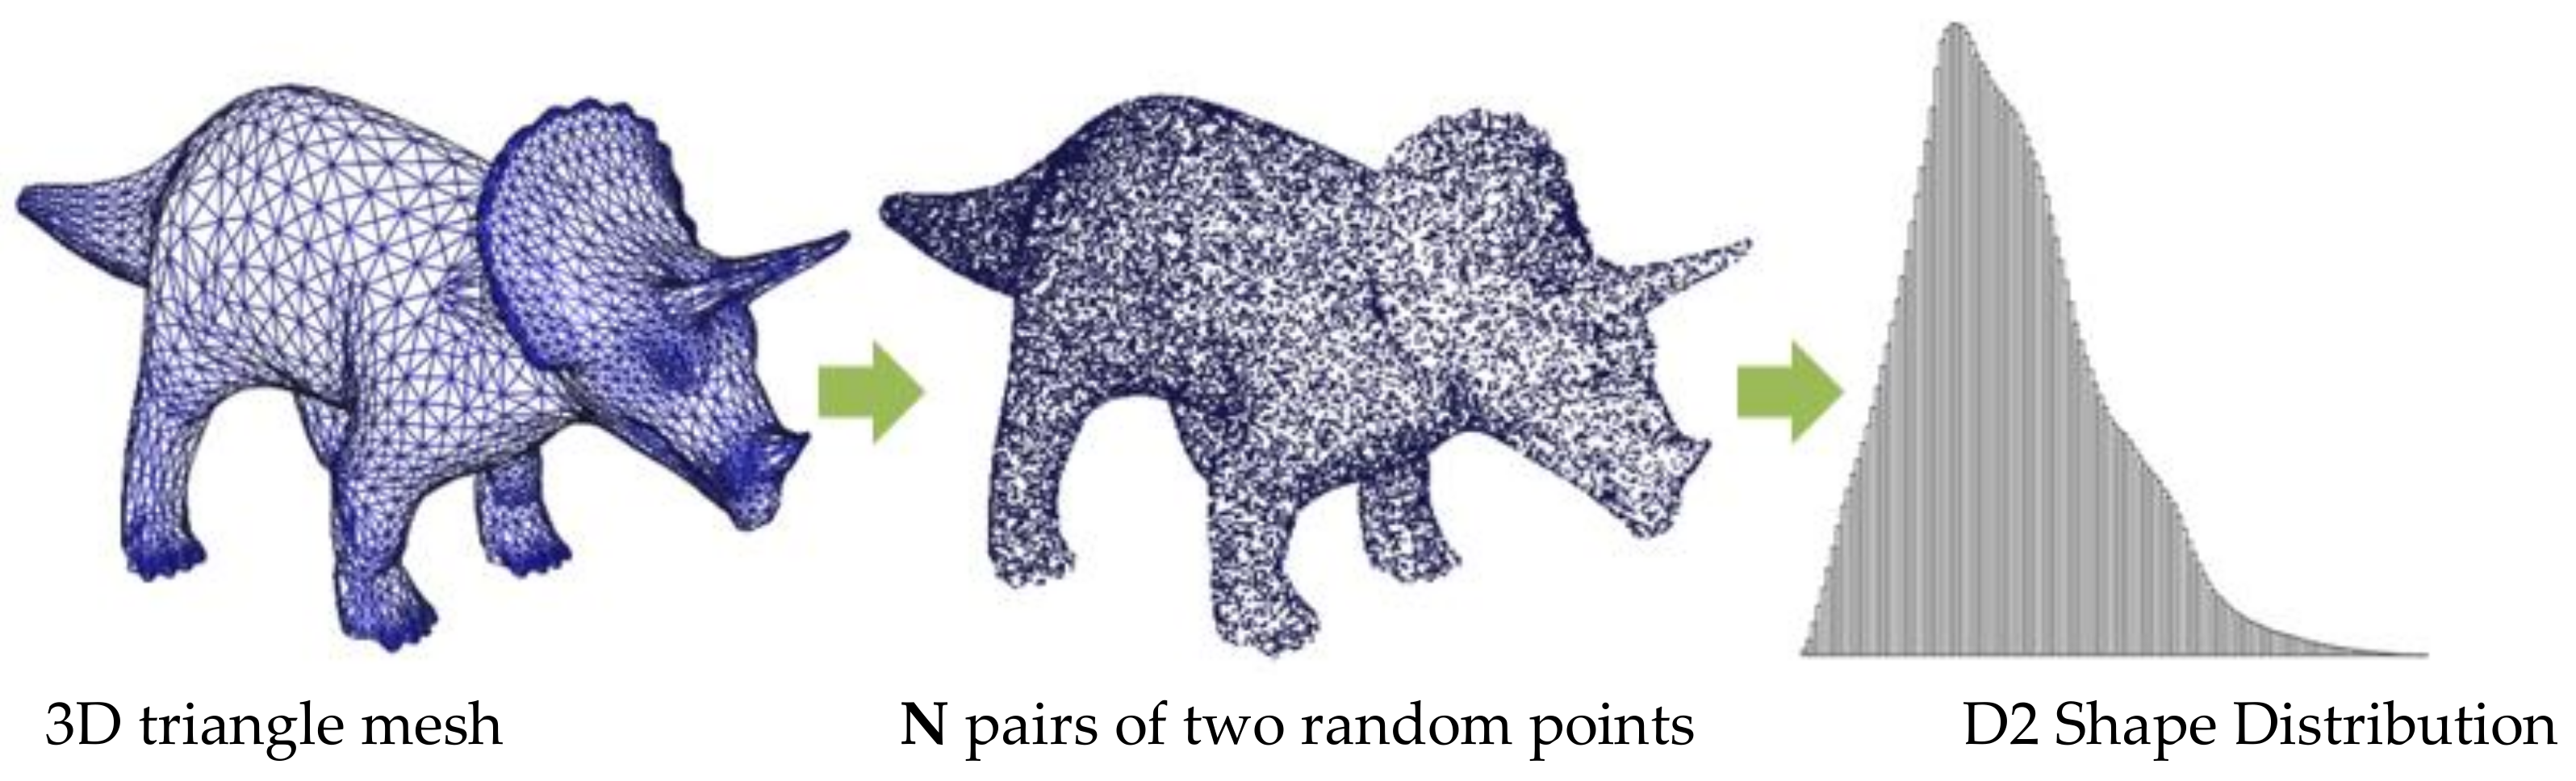
Figure 6.
D2 Vector Construction from D2 Shape Distribution.
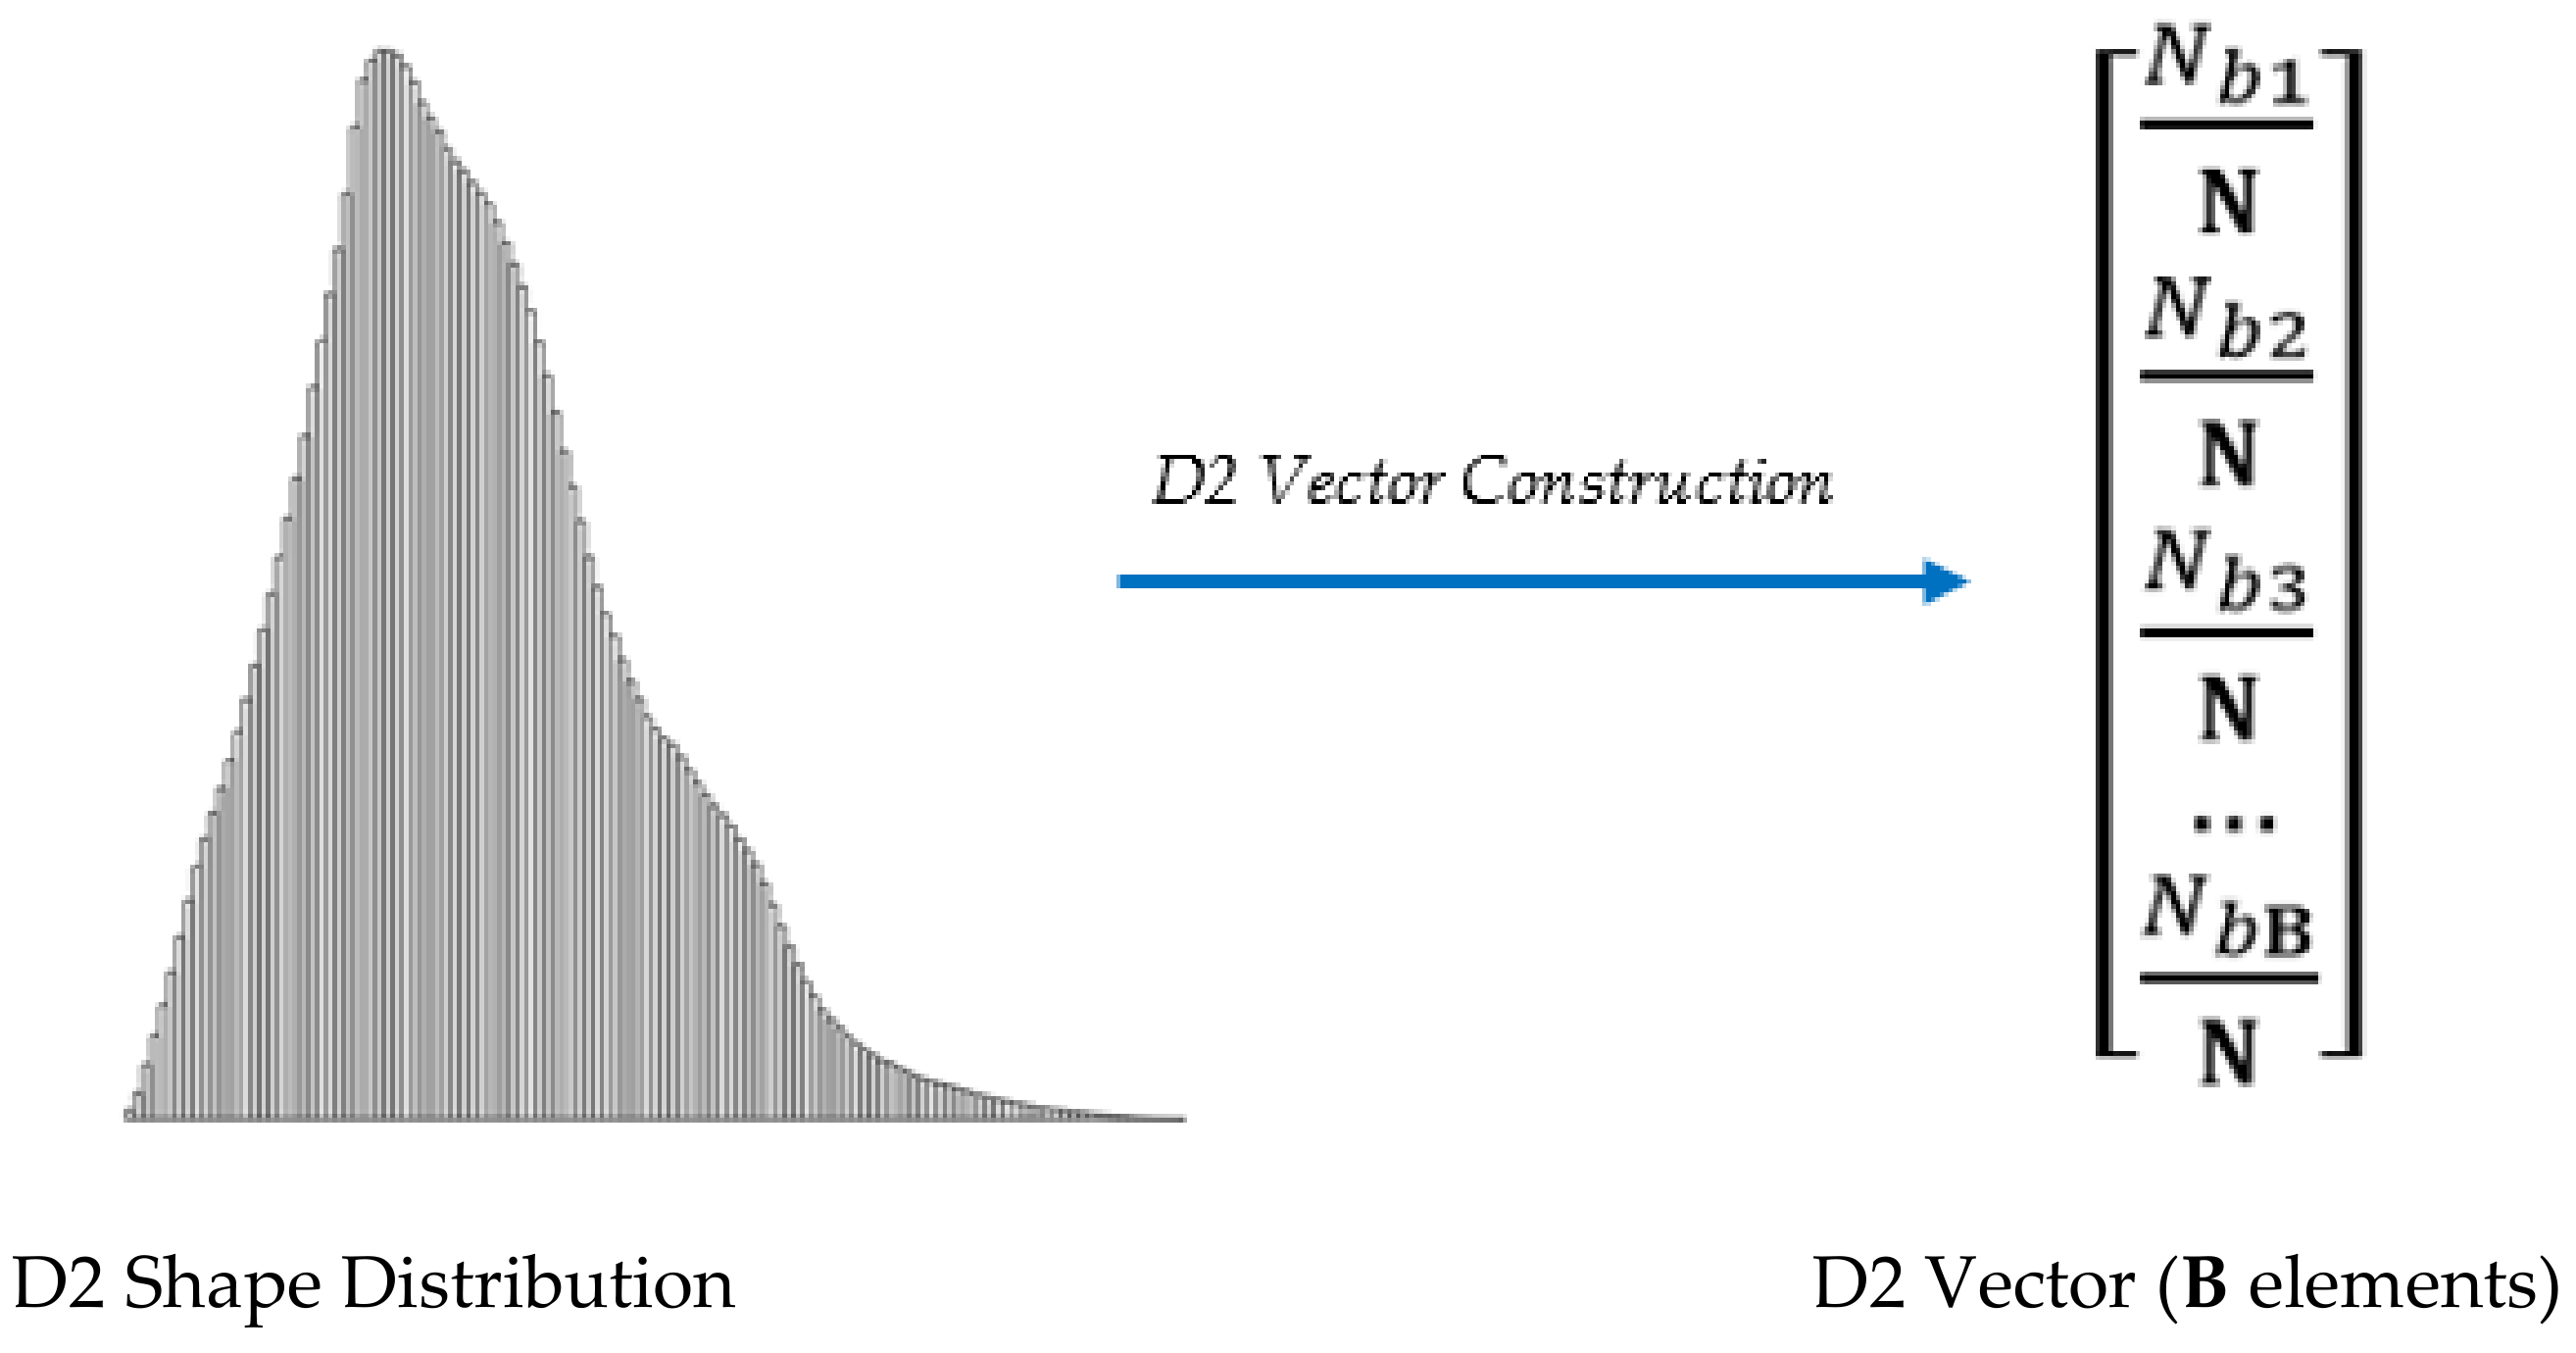
Figure 7.
D2 shape distribution training by convolutional neural networks (CNNs).

Figure 8.
3D weapon triangle meshes from dataset.

Figure 9.
D2 shape distribution of 3D firearm models.
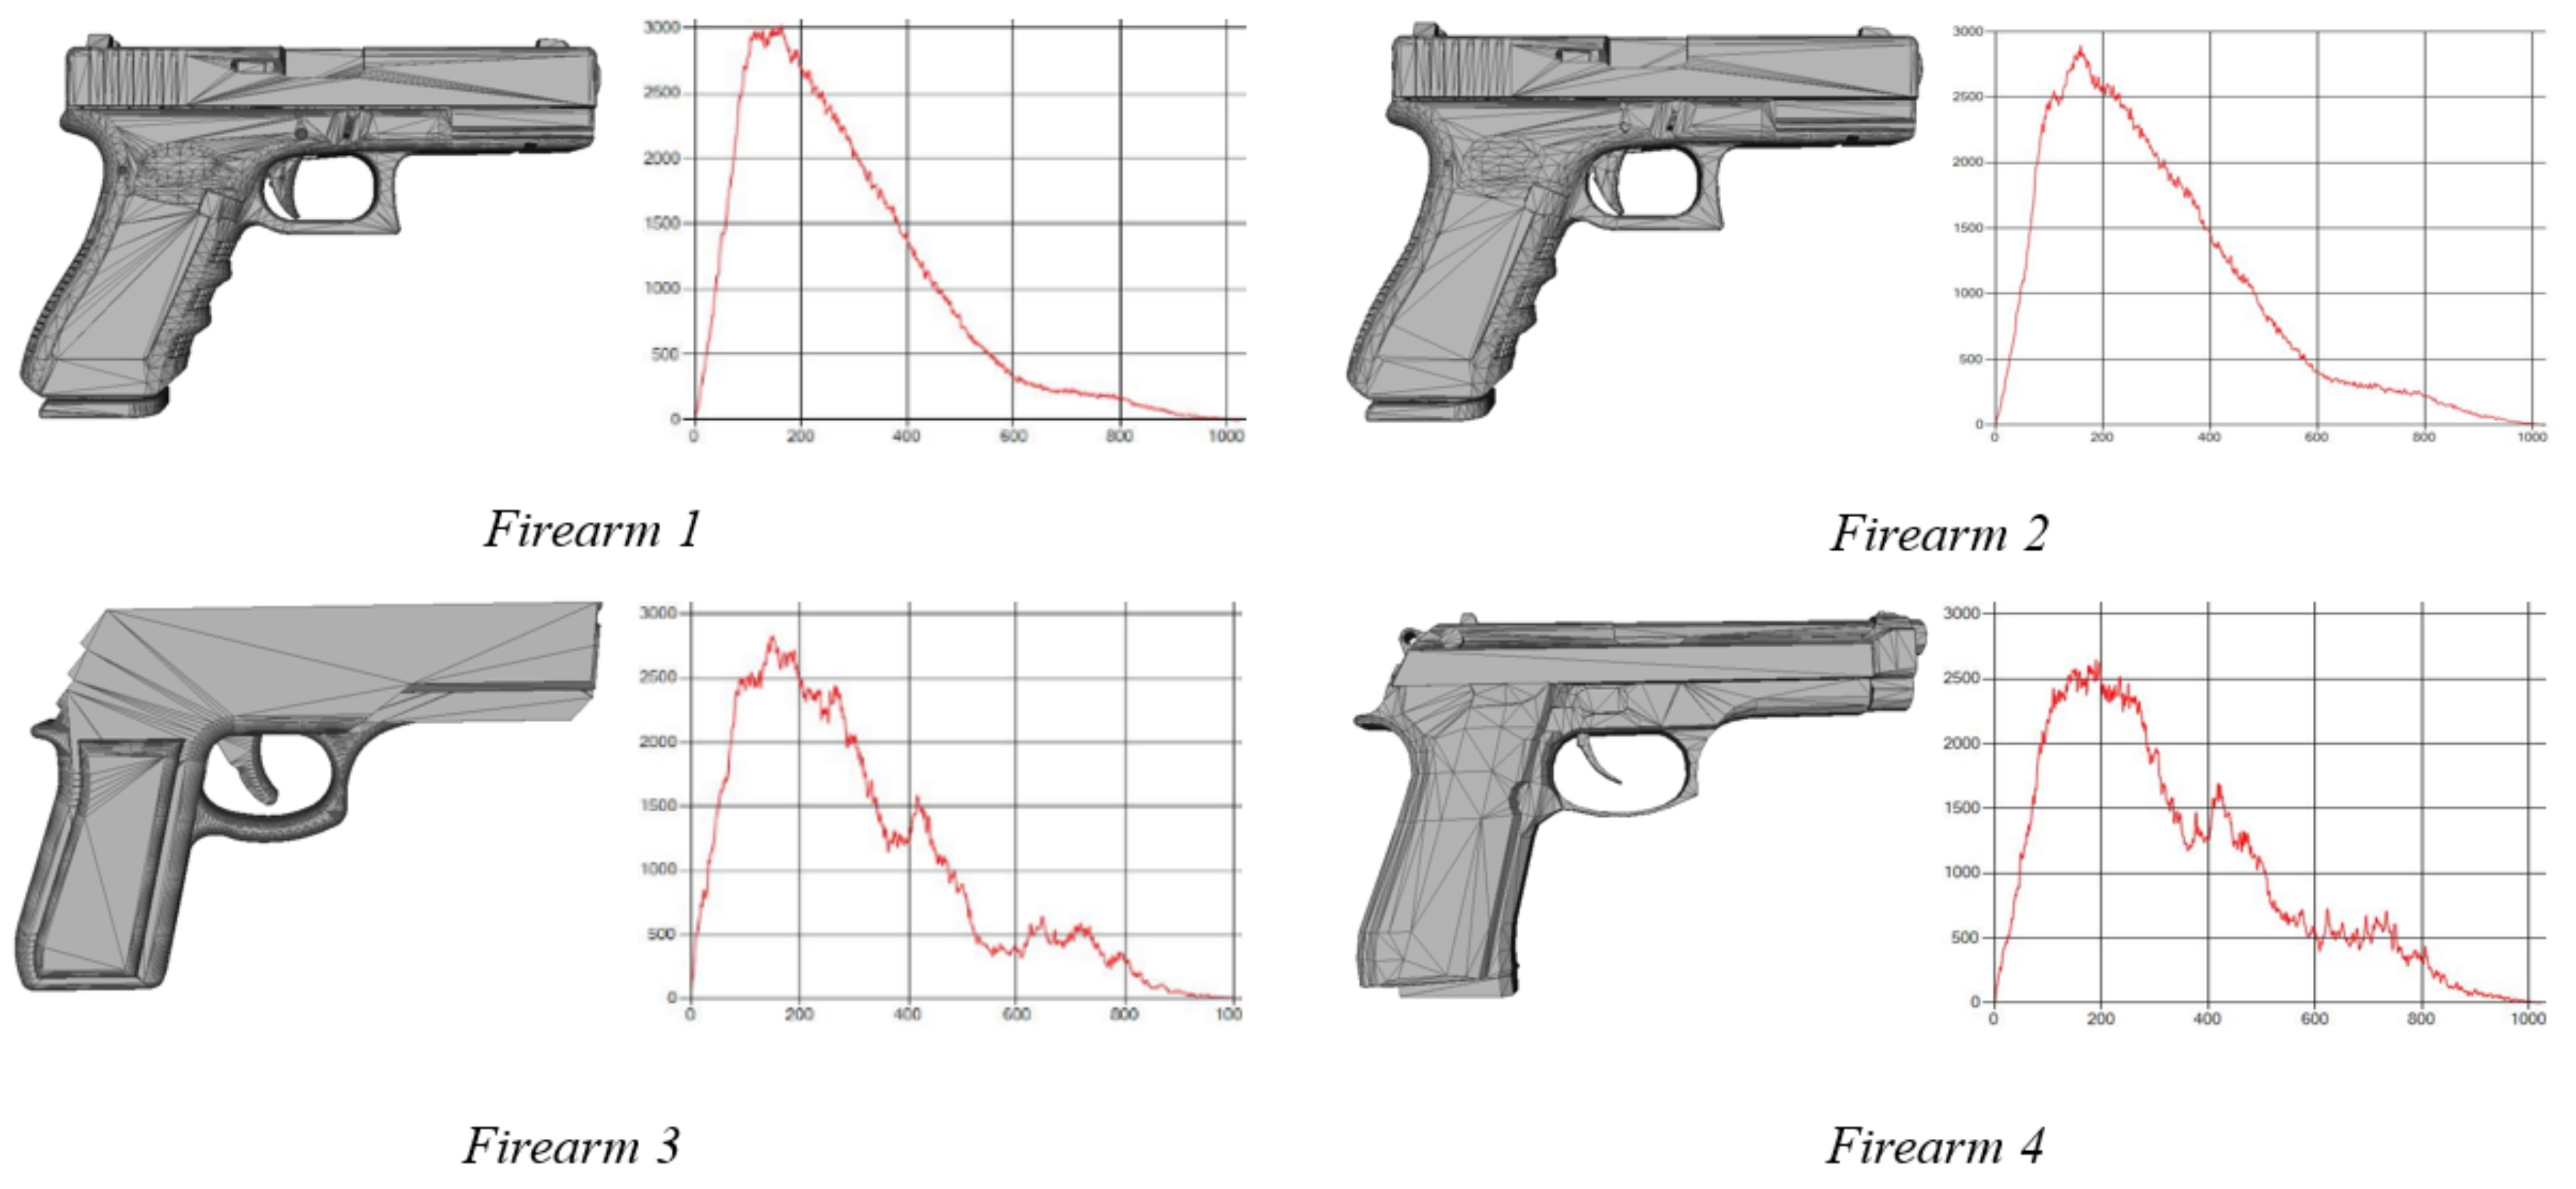
Figure 10.
D2 shape distribution of 3D knife models.
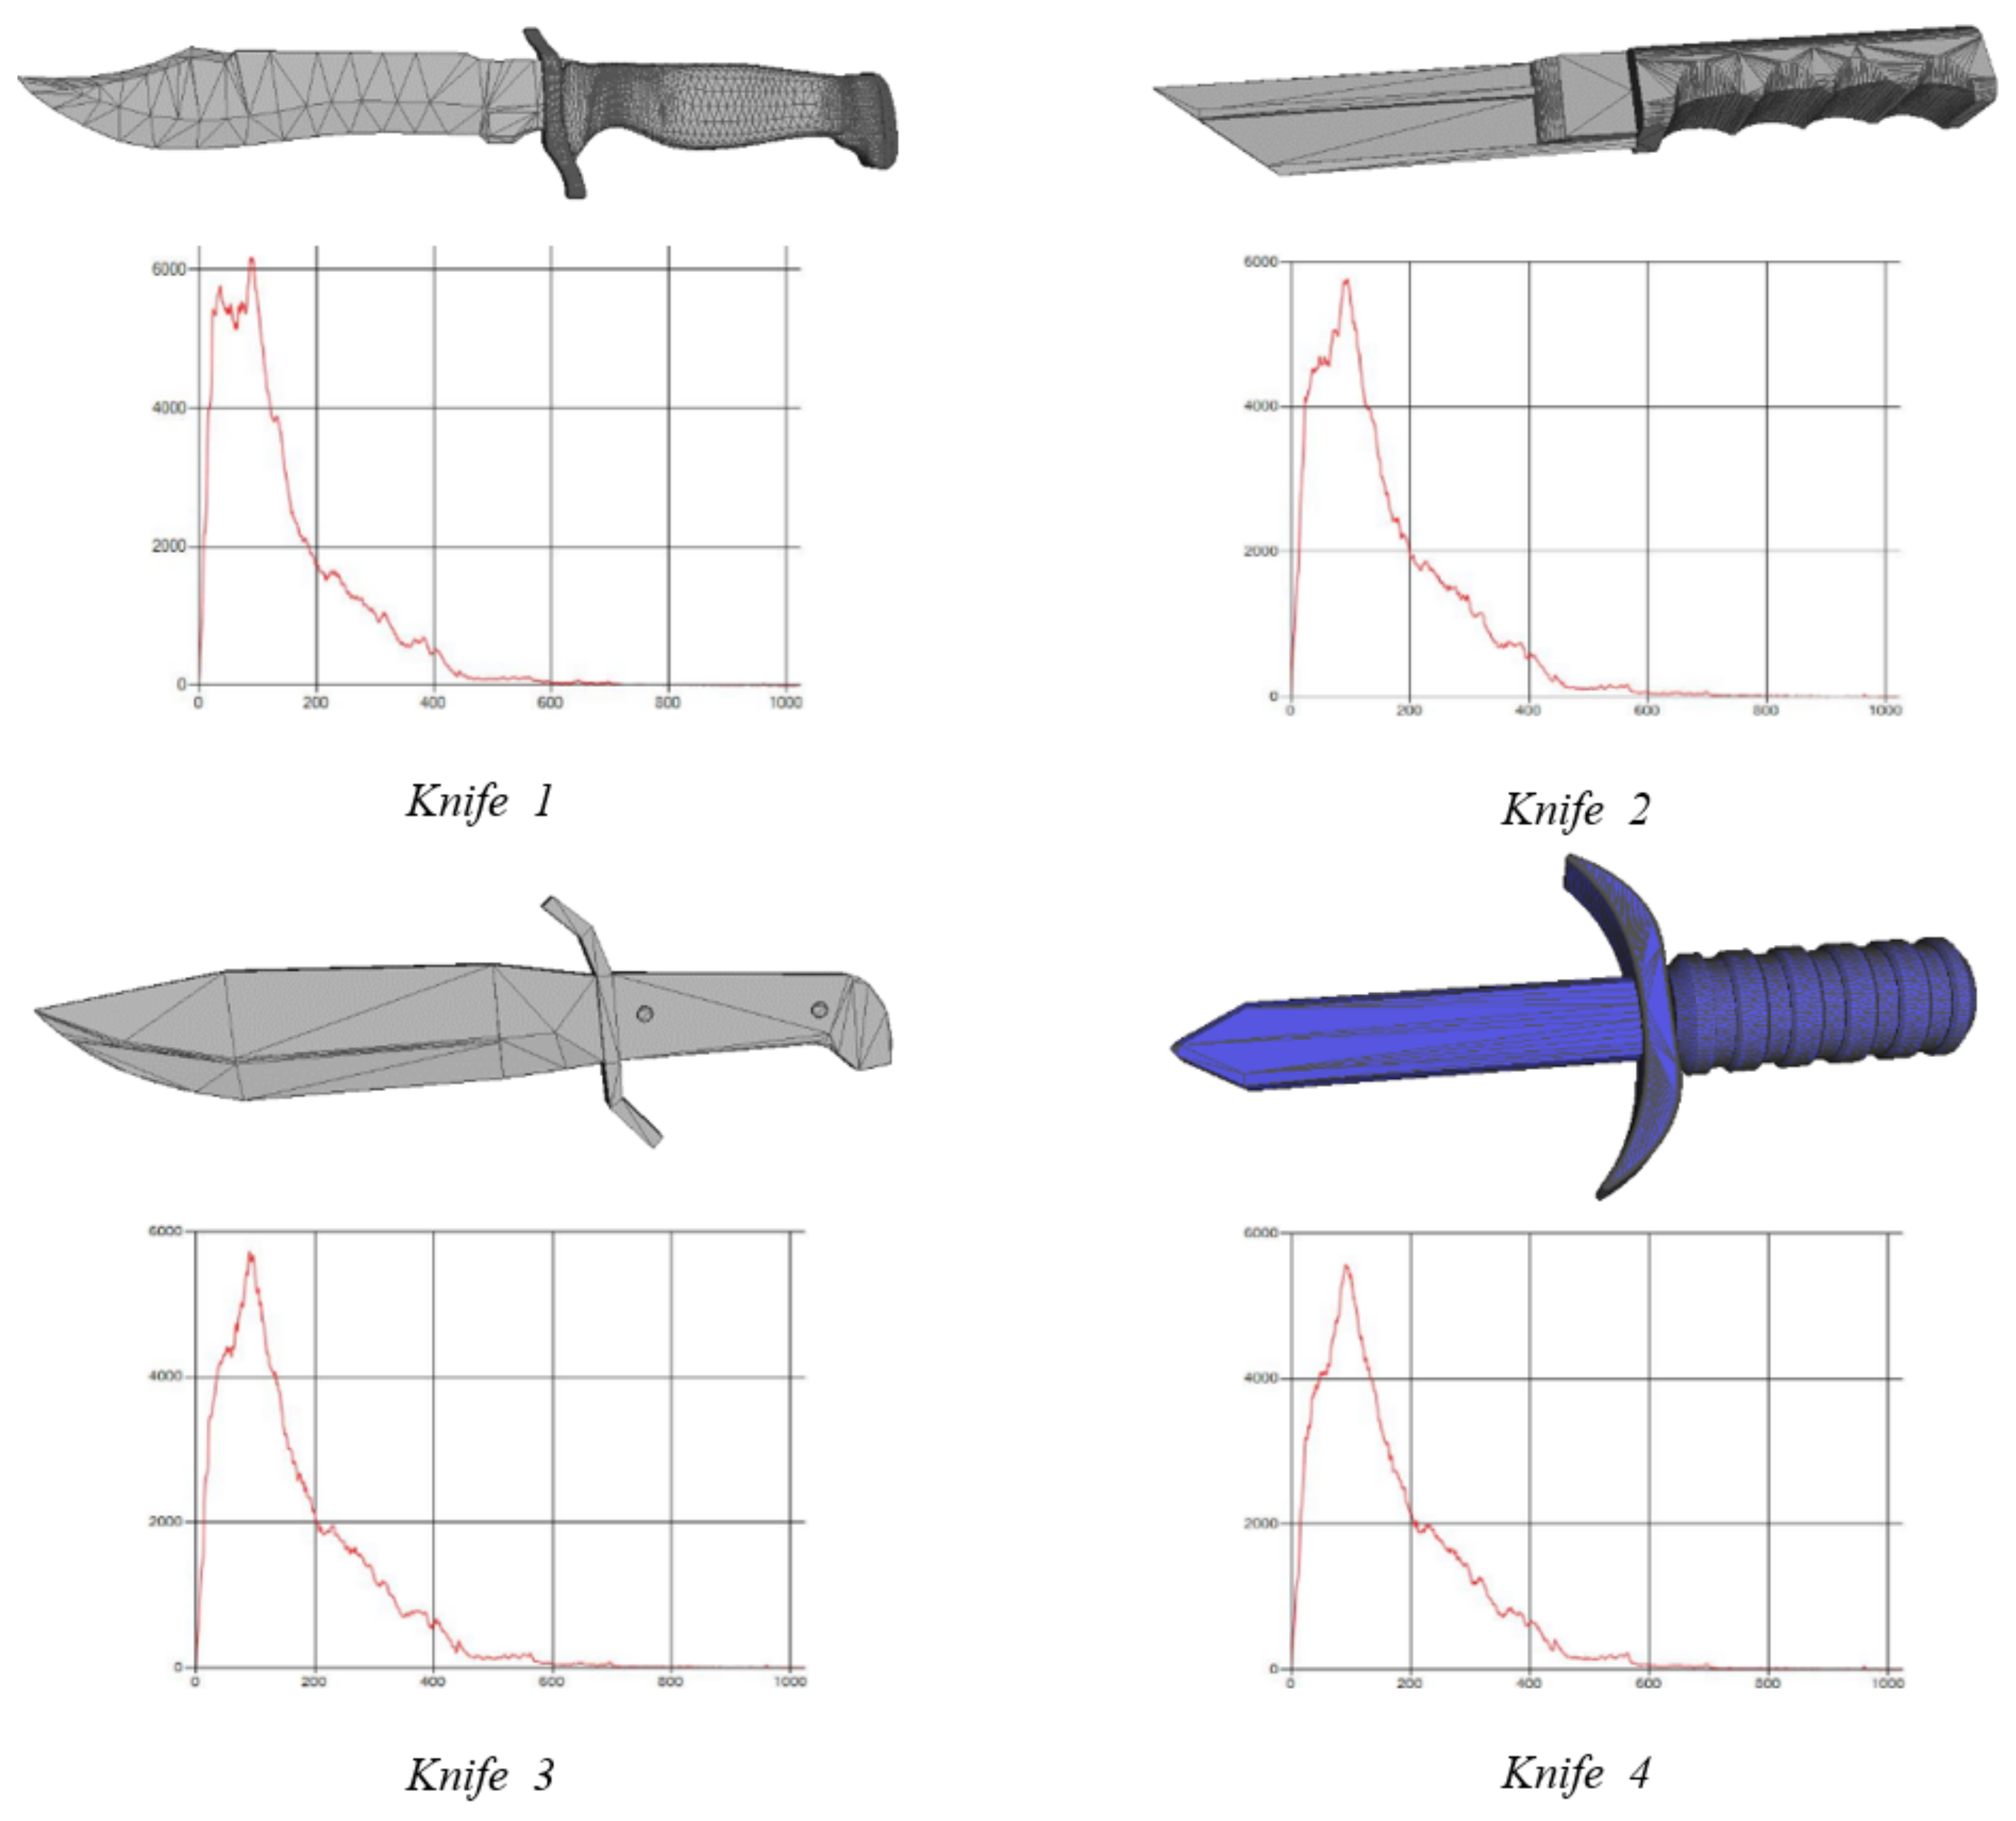
Figure 11.
D2 shape distribution of 3D un-weapon models.

Figure 12.
Training, testing results with CNNs.
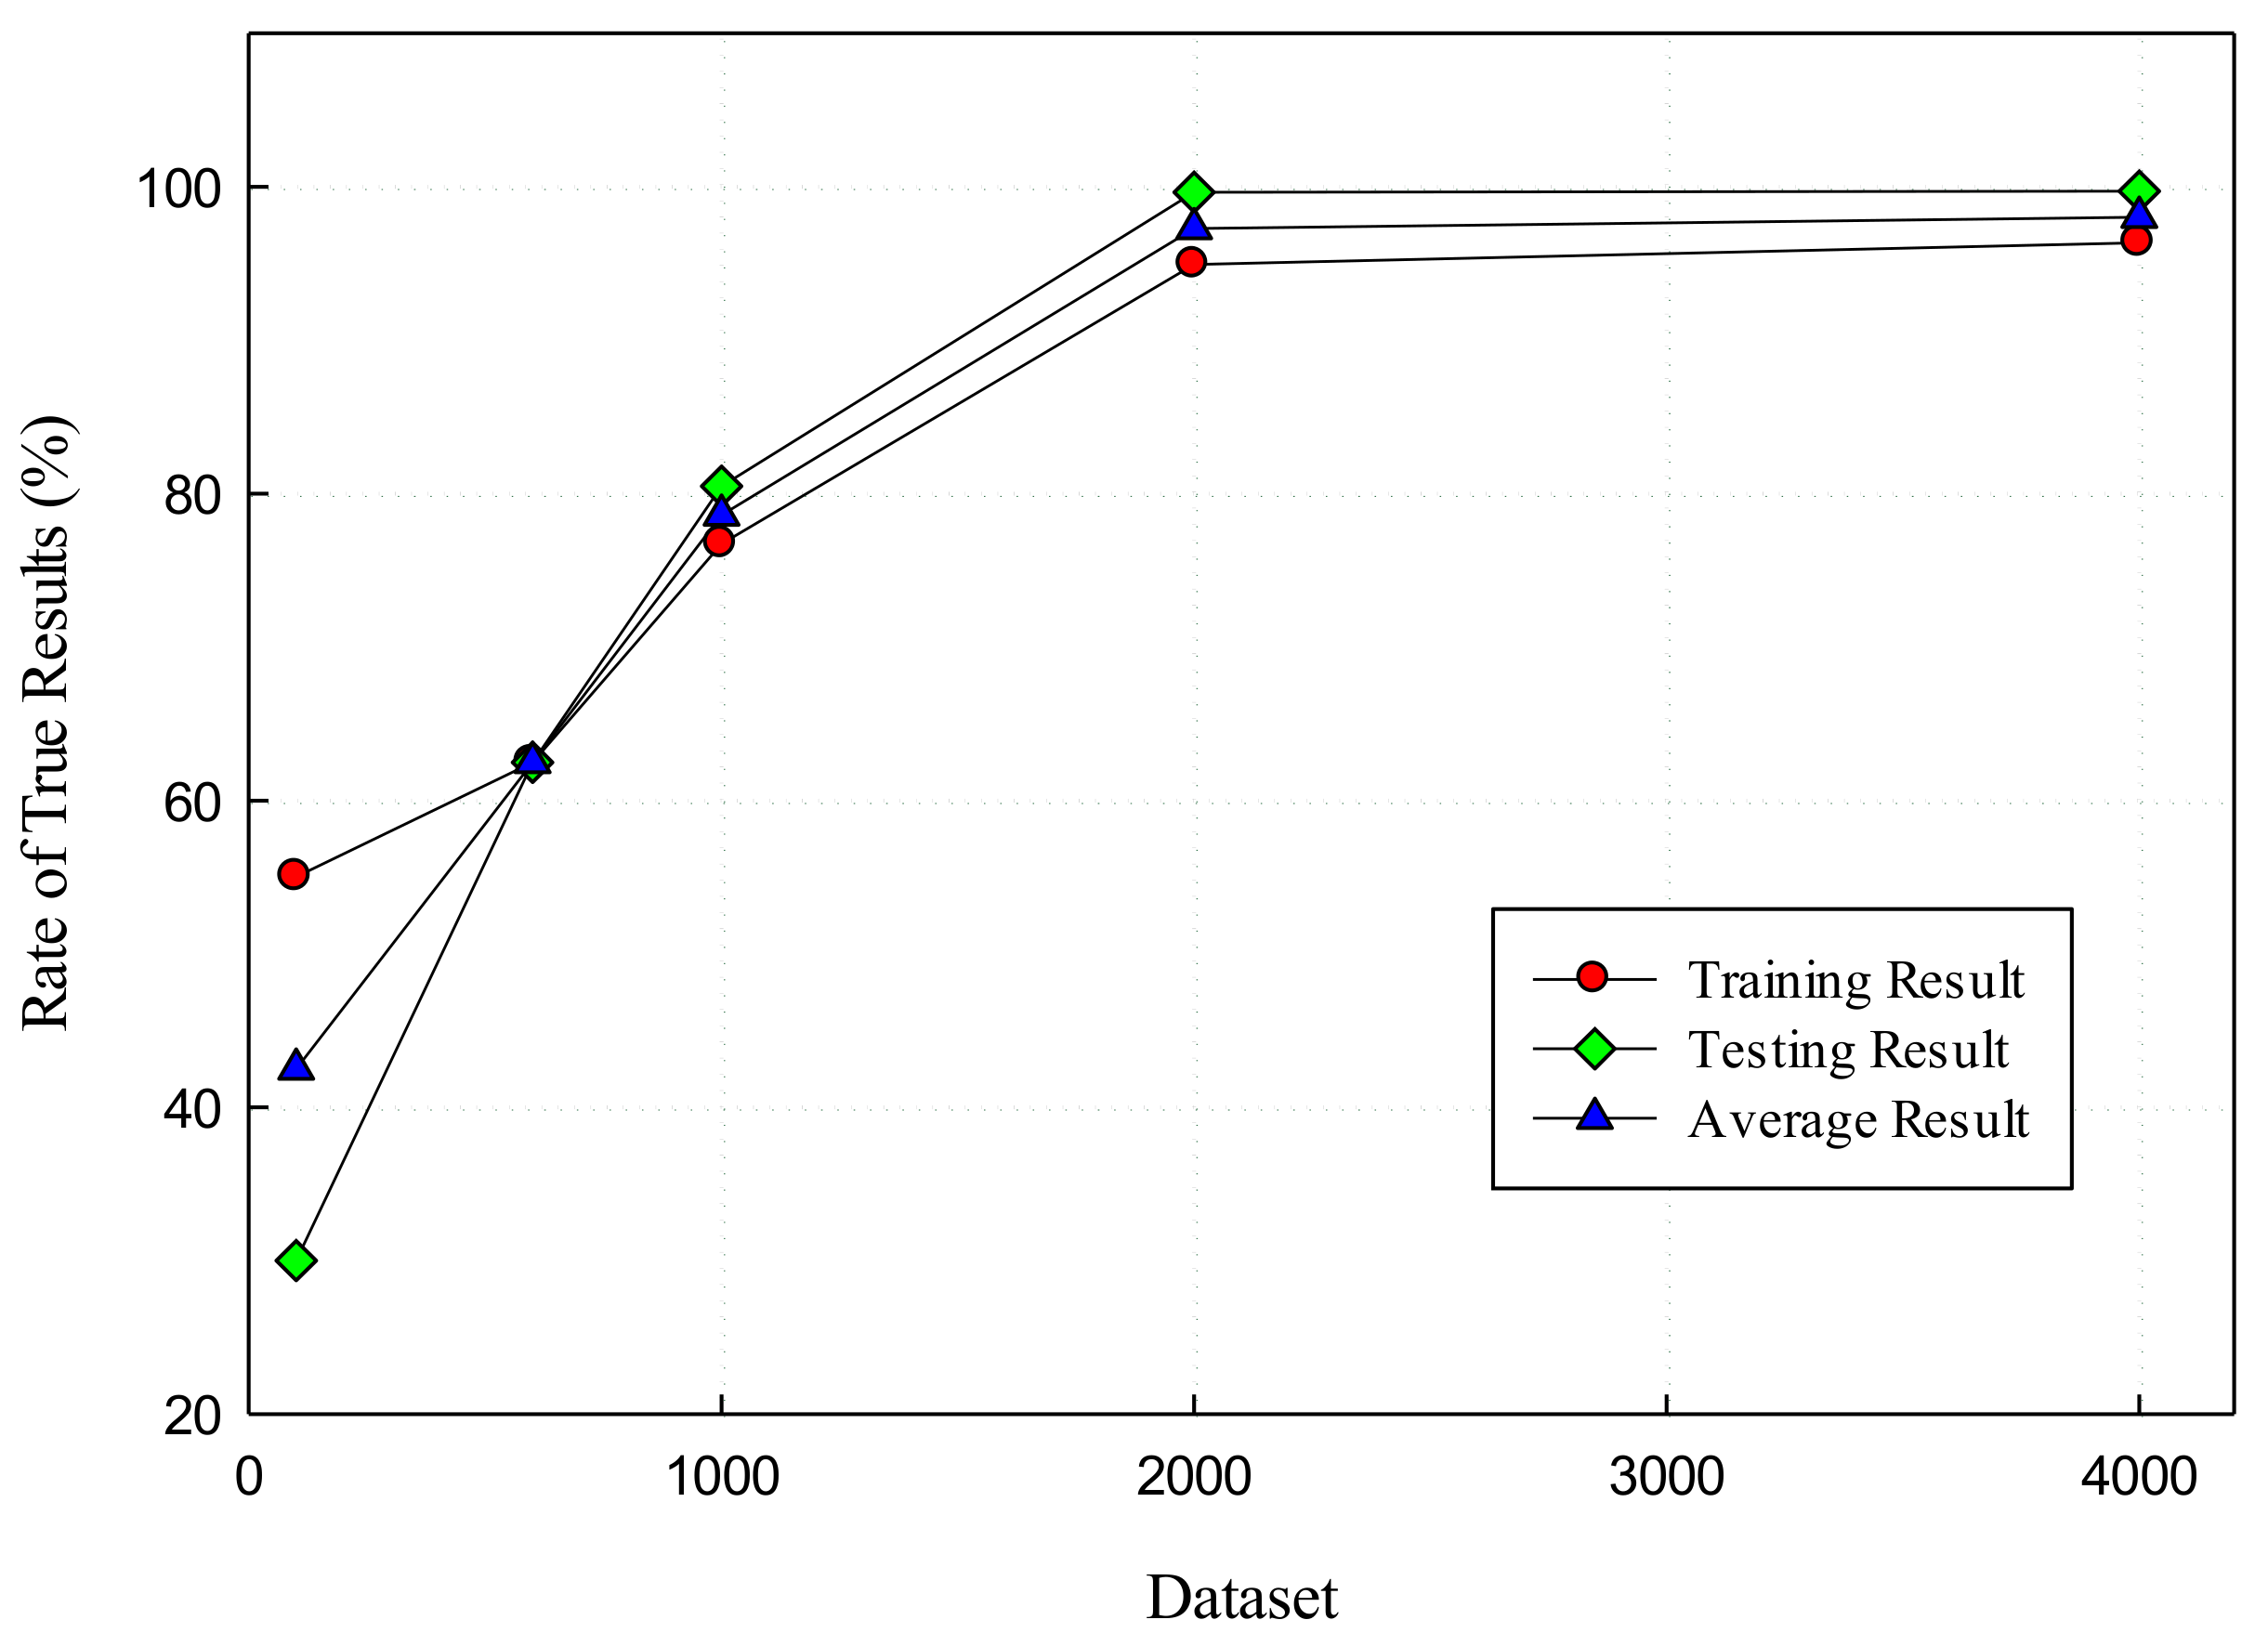
Figure 13.
Results of detection of the proposed algorithm.

Figure 14.
Performance comparison of the proposed method with matching methods.


Table 1.
Experimental Results with CNNs.
| No. | Number of models | Accuracy (%) | ||
|---|---|---|---|---|
| Training | Testing | Average | ||
| Dataset 1 | 100 | 55.00 | 30.00 | 42.50 |
| Dataset 2 | 600 | 62.50 | 62.50 | 62.50 |
| Dataset 3 | 1000 | 76.75 | 80.50 | 78.62 |
| Dataset 4 | 2000 | 94.94 | 99.64 | 97.29 |
| Dataset 5 | 4000 | 96.35 | 99.72 | 98.03 |
Table 2.
Contents of Methods and Accuracy.
| Method No. | Used Features | Test Classes | Accuracy (%) |
|---|---|---|---|
| Thomas’ method | Text, 2D sketch, D2 Shape | Chair, Elf, Table, Cannon, Bunked | 62.54 |
| Walter’s method | Depth Image | Hammer, Mug, Airplane, Bottle, Car, Shoe | 75.66 |
| Osada’s method | D2 Shape | Chair, Animal, Cup, Car, Sofa | 66 |
| Levi’s method | Improved D2 Shape | Unknown (not shown) | Unknown |
| Our method | D2 Shape, improved CNNs | Firearm, Knife | 98.03 |
© 2018 by the authors. Licensee MDPI, Basel, Switzerland. This article is an open access article distributed under the terms and conditions of the Creative Commons Attribution (CC BY) license (http://creativecommons.org/licenses/by/4.0/).
Share and Cite
MDPI and ACS Style
Pham, G.N.; Lee, S.-H.; Kwon, O.-H.; Kwon, K.-R. Anti-3D Weapon Model Detection for Safe 3D Printing Based on Convolutional Neural Networks and D2 Shape Distribution. Symmetry 2018, 10, 90. https://doi.org/10.3390/sym10040090
AMA Style
Pham GN, Lee S-H, Kwon O-H, Kwon K-R. Anti-3D Weapon Model Detection for Safe 3D Printing Based on Convolutional Neural Networks and D2 Shape Distribution. Symmetry. 2018; 10(4):90. https://doi.org/10.3390/sym10040090
Chicago/Turabian StylePham, Giao N., Suk-Hwan Lee, Oh-Heum Kwon, and Ki-Ryong Kwon. 2018. "Anti-3D Weapon Model Detection for Safe 3D Printing Based on Convolutional Neural Networks and D2 Shape Distribution" Symmetry 10, no. 4: 90. https://doi.org/10.3390/sym10040090
Note that from the first issue of 2016, this journal uses article numbers instead of page numbers. See further details here.