Stability Study of Etoricoxib a Selective Cyclooxygenase-2 Inhibitor by a New Single and Rapid Reversed Phase HPLC Method


1
Department of Pharmaceutical Sciences, Faculty of Pharmacy, The University of Jordan, Amman 11942, Jordan
2
Department of Biomedical Engineering, Faculty of Applied Medical Sciences, German Jordanian University, Amman 11180, Jordan
3
Department of Pharmaceutics and Pharmaceutical Technology, Faculty of Pharmacy, The University of Jordan, Amman 11942, Jordan
*
Authors to whom correspondence should be addressed.
Symmetry 2018, 10(7), 288; https://doi.org/10.3390/sym10070288
Submission received: 16 June 2018
/
Revised: 12 July 2018
/
Accepted: 12 July 2018
/
Published: 17 July 2018
Abstract
:Cyclooxygenase-2 (COX-2) is an enzyme responsible for inflammation and pain. Etoricoxib is the most recent selective (COX-2) inhibitor that has a higher COX-2 selectivity than the other COX-2-selective nonsteroidal anti-inflammatory drugs (NSAIDs), which significantly improves its gastric safety profile. The current therapeutic indications of etoricoxib includes the treatment of several painful conditions, such as osteoarthritis, acute gout, ankylosing spondylitis, and rheumatoid arthritis. To the best of found knowledge, no decent method has been reported that can be used for the routine determination of etoricoxib and additives in pharmaceutical suspensions by a single, rapid and cost-effective run of HPLC, using an UV-Vis detector. Earlier reported methods, such as liquid chromatography-mass spectrometry (LC-MS), high performance thin layer chromatography (HPTLC), capillary zone electrophoresis, and ultra performance liquid chromatography (UPLC), are all tedious and time consuming. A reversed phase high performance liquid chromatography (RP-HPLC) was used as a first reported single run method to achieve developed and validated simultaneous determination for sodium saccharin, vanillin, methyl paraben, etoricoxib, and butyl paraben, in prepared oral suspensions of etoricoxib. Reversed phase column of octadecylsilane (ODS) C18 with isocratic mobile phase containing methanol, and phosphate buffer of pH 6 in a ratio of 70:30 (v/v). Celecoxib is used as an internal standard at a detection wavelength of 215 nm. This method separates the analytes in a total running time less than 13 min. Linearity is obtained in the calibration curve for all analytes with a R2 value of > 0.999. Furthermore, beta-cyclodextrin (β-CD) and 2-hydroxypropyl-β-cyclodextrin (HP-β-CD) were added, either alone or combined, to prevent the crystal formation, and any unpleasant taste of etoricoxib in oral formulations. After testing both HP-β-CD and β-CD at 3% w/w for each, the results showed that HP-β-CD is more efficient in preventing the crystal formation of etoricoxib in suspensions at room temperature than β-CD is.
1. Introduction
Cyclooxygenase-2 is an enzyme responsible for inflammation and pain. Etoricoxib is the most recent selective (COX-2) inhibitor that has a higher COX-2 selectivity than the other COX-2-selective nonsteroidal anti-inflammatory drugs (NSAIDs). This selectivity greatly improved its gastric safety profile [1], however etoricoxib has was clinically associated with an increased risk of heart failure and ischemic stroke [2,3]. Etoricoxib (5-chloro-2-(6-methylpyridin-3-yl)-3-(4-methylsulphonylphenyl)pyridine) is used in the treatment of several painful conditions, such as osteoarthritis, acute gout, rheumatoid arthritis, joint stiffness ankylosing spondylitis, and acute postoperative pain in adults [4,5].
Liquid and suspension dosage forms, in particular, are useful in pediatrics, geriatrics and in cases where the capability to swallow is compromised due to injury, disability, or nasogastric feedings. However, etoricoxib showed a transformation to less crystalline structure in its solid dispersion. This may cause a significant and deleterious change in the particle size distribution, dissolution rate of drug particles, physical stability, and bioavailability of the product [6]. The use of the most stable polymorphic form of the drug substance, and the addition of the proper additives, makes sure that the drug polymorphic form and particle size distribution remain constant on storage [7,8,9]. Etoricoxib consists of four anhydrous polymorphic forms (Forms I, II, IV, and V), and a physically stable hemihydrate form at ambient conditions (32% RH) [10]. The fifth anhydrous polymorph, form III, is metastable. The anhydrous crystalline forms are non-hygroscopic, but all convert to the hemihydrate form when they come into contact with water. The amorphous form initially converts to Form III in water, followed by conversion to the hemihydrate [10]. A combination of excipients might be tested according to their ability to prevent the crystal growth of etoricoxib and consequently improve the dosage form stability.
Additionally, etoricoxib was analyzed using different techniques which varied in complexity, purpose and methodology. Results from high pressure liquid chromatography (HPLC), and capillary zone electrophoresis methods were used for the determination of etoricoxib in drug substance and its formulations [11,12,13,14,15]. Results from high pressure liquid chromatography with combined mass spectrometry (HPLC-MS/MS) and ultra-performance liquid chromatography (UPLC) were also used for the simultaneous determination of etoricoxib and its degradation products [16,17,18]. Results from multiple HPLC-Fluorescence, high pressure liquid chromatography-ultra violet (HPLC-UV) and liquid chromatography combined with mass spectrometry (LC-MS/MS) analytical methods were used for the estimation of etoricoxib in biological samples such as human plasma [16].
However, no method used was able to be used for routine determination of etoricoxib and additives in drug suspensions in a single HPLC-UV run. Hence, another goal of this study was to develop a new and rapid reversed phase HPLC method for the separation and analysis of etoricoxib with common suspension additives. Subsequently, this method was validated according to the guidelines of the International Council on Harmonization (ICH).
2. Materials and Methods
2.1. Chemicals and Materials
Sodium hydroxide (Scharlau Chemie, Spain) and potassium dihydrogen phosphate (Carlo Erba Reagents-SdS, Spain) were used in the preparation of phosphate buffer. Methanol, HPLC grade (Fisher Chemical, Loughboroug, UK), was used in HPLC mobile phase preparation. Excipients of etoricoxib suspension included: Vanillin and ascorbic acid, which were purchased from Acros (Geel, Belgium); sodium saccharin, aspartame and sucralose, gifted from TQ Pharma (Amman, Jordan); and methyl paraben and propyl paraben, which were gifted from the Pharma International (Jordan). Moreover, butyl paraben was used in the formula and purchased from Sigma-Aldrich (St. Louis, MO, USA). Etoricoxib was purchased from TQ Pharma (Jordan), and celecoxib (Laboratory Rasayan, Anand, India) was gifted from SANA Pharma (Amman, Jordan) and used as an internal standard. Carboxymethylcellulose sodium (BDH Laboratory Supplies, Poole, UK) and xanthan gum were gifted from TQ Pharma (Jordan) and used as suspending agents. Propylene glycol (Fisher Chemical) was used to dissolve the preservatives, including methyl and butyl paraben. The β-CD gifted from TQ Pharma (Jordan) and HP-βCD purchased from International Specialty Products (Cologne, Germany) were used as inclusion/stability agents in the suspension formulation.
2.2. Instruments
HPLC analyses were conducted on Shimadzu HPLC System (Kyoto, Japan) equipped with LC-20AT pump and SPD-20A UV-Vis detector, using a reversed phase column with specifications, including: Octadecylsilane (ODS) as a packing material; C18 as a stationary phase; 5 µm particle size; 200 mm length; and 4.6 mm diameter (Hypersil-Keystone, Thermo Scientific, (Waltham, MA, USA). The instrument was operated under an isocratic elution, with UV detection set at wavelength of 215 nm. Mobile phase was prepared by mixing HPLC grade methanol and phosphate buffer, pH 6.0 in the ratio of 70:30 followed by filtration through nylon membrane filter, Ø = 0.45 µm from Agela Technologies (Torrance, CA, USA), then degassed by sonication (Rocker, New Taipei City, Taiwan) for 30 min. The injection volume was 20 μL and the mobile phase rate was 0.8 mL/min. Before being used, the mobile phase was filtered by using membrane filters from Agela technologies (USA) and sonicated for 30 min by using a sonicator. A mixer (Janke & Kunkel IKA-Werke GmbH & CO., Breisgau, Germany); and a homogenizer (IKA ULTRA-TURRAX, Breisgau, Germany) were used in preparing the suspension formulae. Particle size analysis of the etoricoxib powder and suspension was performed at TQ Pharma using Mastersizer 2000 (Malvern Instruments, Malvern, UK). Optical Photomicroscope (Nickon, Tokyo, Japan) was used to observe the formation of etoricoxib crystal growth.
2.3. Samples Preparation for the Recovery Study
In this study, the accuracy was represented and determined by a recovery experiment, which was performed at different the percentage concentrations of 25–150%. The recovered amount of drug, sweetening agent, flavor and preservatives were determined. Considering this, each single dose of 5 g from the prepared formula of the suspension contains 60 mg etoricoxib, 25 mg sodium saccharine, 25 mg vanillin, 6.5 mg methyl paraben and 2.5 mg butyl paraben in addition to sodium carboxymethyl cellulose (Na. CMC), xanthan gum and β-CD, which were not analyzed in the method because of their deficiency for chromophores.
Samples of the recovery test were prepared by introducing 5 g from the selected formula without tested compounds, (i.e., Etoricoxib, sweetening agent, flavor, and preservatives) into 50 mL volumetric flask. Solutions, containing the required amounts of etoricoxib, preservatives, sweetening agent and flavor in methanol and representing 25%, 50%, 75%, 100%, 125%, or 150% of each, were added. The final volume for each recovery sample was adjusted up to 50 mL with methanol then sonicated for 10 min. Subsequently, the samples were centrifuged for 20 min at 5000 rpm. Volume of 25 mL of the supernatant from each sample was introduced in 100 mL volumetric flask, mixed with 15 mg of celecoxib (internal standard), and diluted to the volume with methanol.
The final solution of 100% of each analyte contains 300, 125, 125, 32.5 and 12.5 μg/mL of etoricoxib, sodium saccharin, vanillin, methyl paraben and butyl paraben respectively. The all six samples were analyzed by HPLC in triplicates. The percentage recovery of each compound was determined by comparing its response with the corresponding standard solution.
2.4. Samples Preparation for the Linearity Test
Linearity was demonstrated by preparing and analyzing the standard solutions at different concentrations for etoricoxib, sweetening agents, flavors and preservatives. From the plot of peak areas versus analyte concentrations, the coefficient of correlation, the intercept, and the slope were calculated.
The stock solution was prepared by dissolving the following ingredients in 100 mL HPLC grade methanol: 500 mg of either sodium saccharine or aspartame, 500 mg vanillin, 130 mg methyl paraben, 50 mg butyl paraben and 1200 mg etoricoxib. Subsequently, 0.5 mL, 1 mL, 2 mL, 3 mL, 4 mL, 5 mL, 6 mL, and 7 mL from the stock solution were taken and 15 mg celecoxib (internal standard) was added to each aliquot. Each solution was then diluted to 100 mL with methanol.
2.5. Samples Preparation for Robustness Test, Lower Limit of Detection (LLOD) and Lower Limit of Quantification (LLOQ)
Analytical method robustness was examined by small changes in the method parameters, such as altering the mobile phase pH, flow rate, column temperature, and changes in mobile phase composition. The following solution was prepared in 100 mL HPLC grade methanol: 500 mg sodium saccharine, 500 mg vanillin, 130 mg methyl paraben, 50 mg butyl paraben and 1200 mg etoricoxib. A volume of 4 mL of the solution was taken and 15 mg of the internal standard celecoxib was added. The sample was then analyzed by changing one single parameter at a time. Slight changes of the robustness parameters were tested at a time. LLOD and LLOQ were determined by adopting the following equations:
where, δ is the standard deviation of the response and S the slope of the calibration curve. Calibration curves were constructed from the HPLC assay of the standard solutions, from which the LLOQ and LLOD were calculated using the above equations, in accordance with ICH guidelines (2005) [19,20].
LLOQ = 10δ/S
LLOD = 3.3δ/S
2.6. Samples Preparation for Selectivity
The selectivity of the method was determined by running group of blank samples containing all the suspension ingredients except the tested one in each time. Chromatograms emphasized that each retention time is selective for the tested analyte and there is no interference from the other ingredients. The specificity of the developed method was assessed by performing a forced degradation study of samples prepared according to the procedure in Section 2.3. Two solutions were prepared and heated at 80 °C for 1 h. One of the solutions contained a few drops of a concentrated HCl solution, while the other contained a few drops of NaOH (40% w/v). A third solution was prepared contained a few drops of H2O2 (30% w/v). The purity of ingredient peaks was tested by a purity test of photodiode array detector. The purity indices of the results were above the purity threshold limit (>0.996). This confirms the purity of the chromatographic peaks from the analyte degradation products.
2.7. Method Preparation of the Formula
The formula was prepared by mixing xanthan gum with carboxymethyl cellulose (CMC), and then gradually added to 100 mL water until a homogenous viscous mixture was obtained. Cyclodextrins then added with 50 mL water. Subsequently, methyl paraben and butyl paraben were dissolved in 1.5 mL propylene glycol with aid of a sonicator. To form the suspension base, all resulted solutions were mixed with solution of sodium saccharine and vanillin dissolved together in 50 mL water. Finally, etoricoxib was wetted with 25 mL of purified water, and added gradually to the suspension base and stirred until a uniform consistency was obtained. The final weight of the suspension was adjusted with purified water up to 300 g and stirred well.
2.8. Samples Preparation for Particle Size Analysis
Particle size analysis of the etoricoxib powder and suspension was performed at TQ Pharma using Mastersizer 2000. The samples were introduced directly into the equipment after dispersion in water. For each sample, three runs were performed to determine the volume based diameters, and finally the average was calculated as the mean value of the individual runs. A photomicroscope was first used to observe if any crystal growth formation occurred. Then, the formation of crystals was observed for etoricoxib powder and suspensions stored at room temperature for 3 months.
3. Results and Discussion
3.1. HPLC Analytical Method Development
The main objective of this study was to develop an accurate, validated, reproducible, and a robust reversed-phase high performance liquid chromatography (RP-HPLC) method for the determination of the drug, etoricoxib, and its additives, preservatives, flavors sand sweetening agents, in suspension dosage form, in a single run.
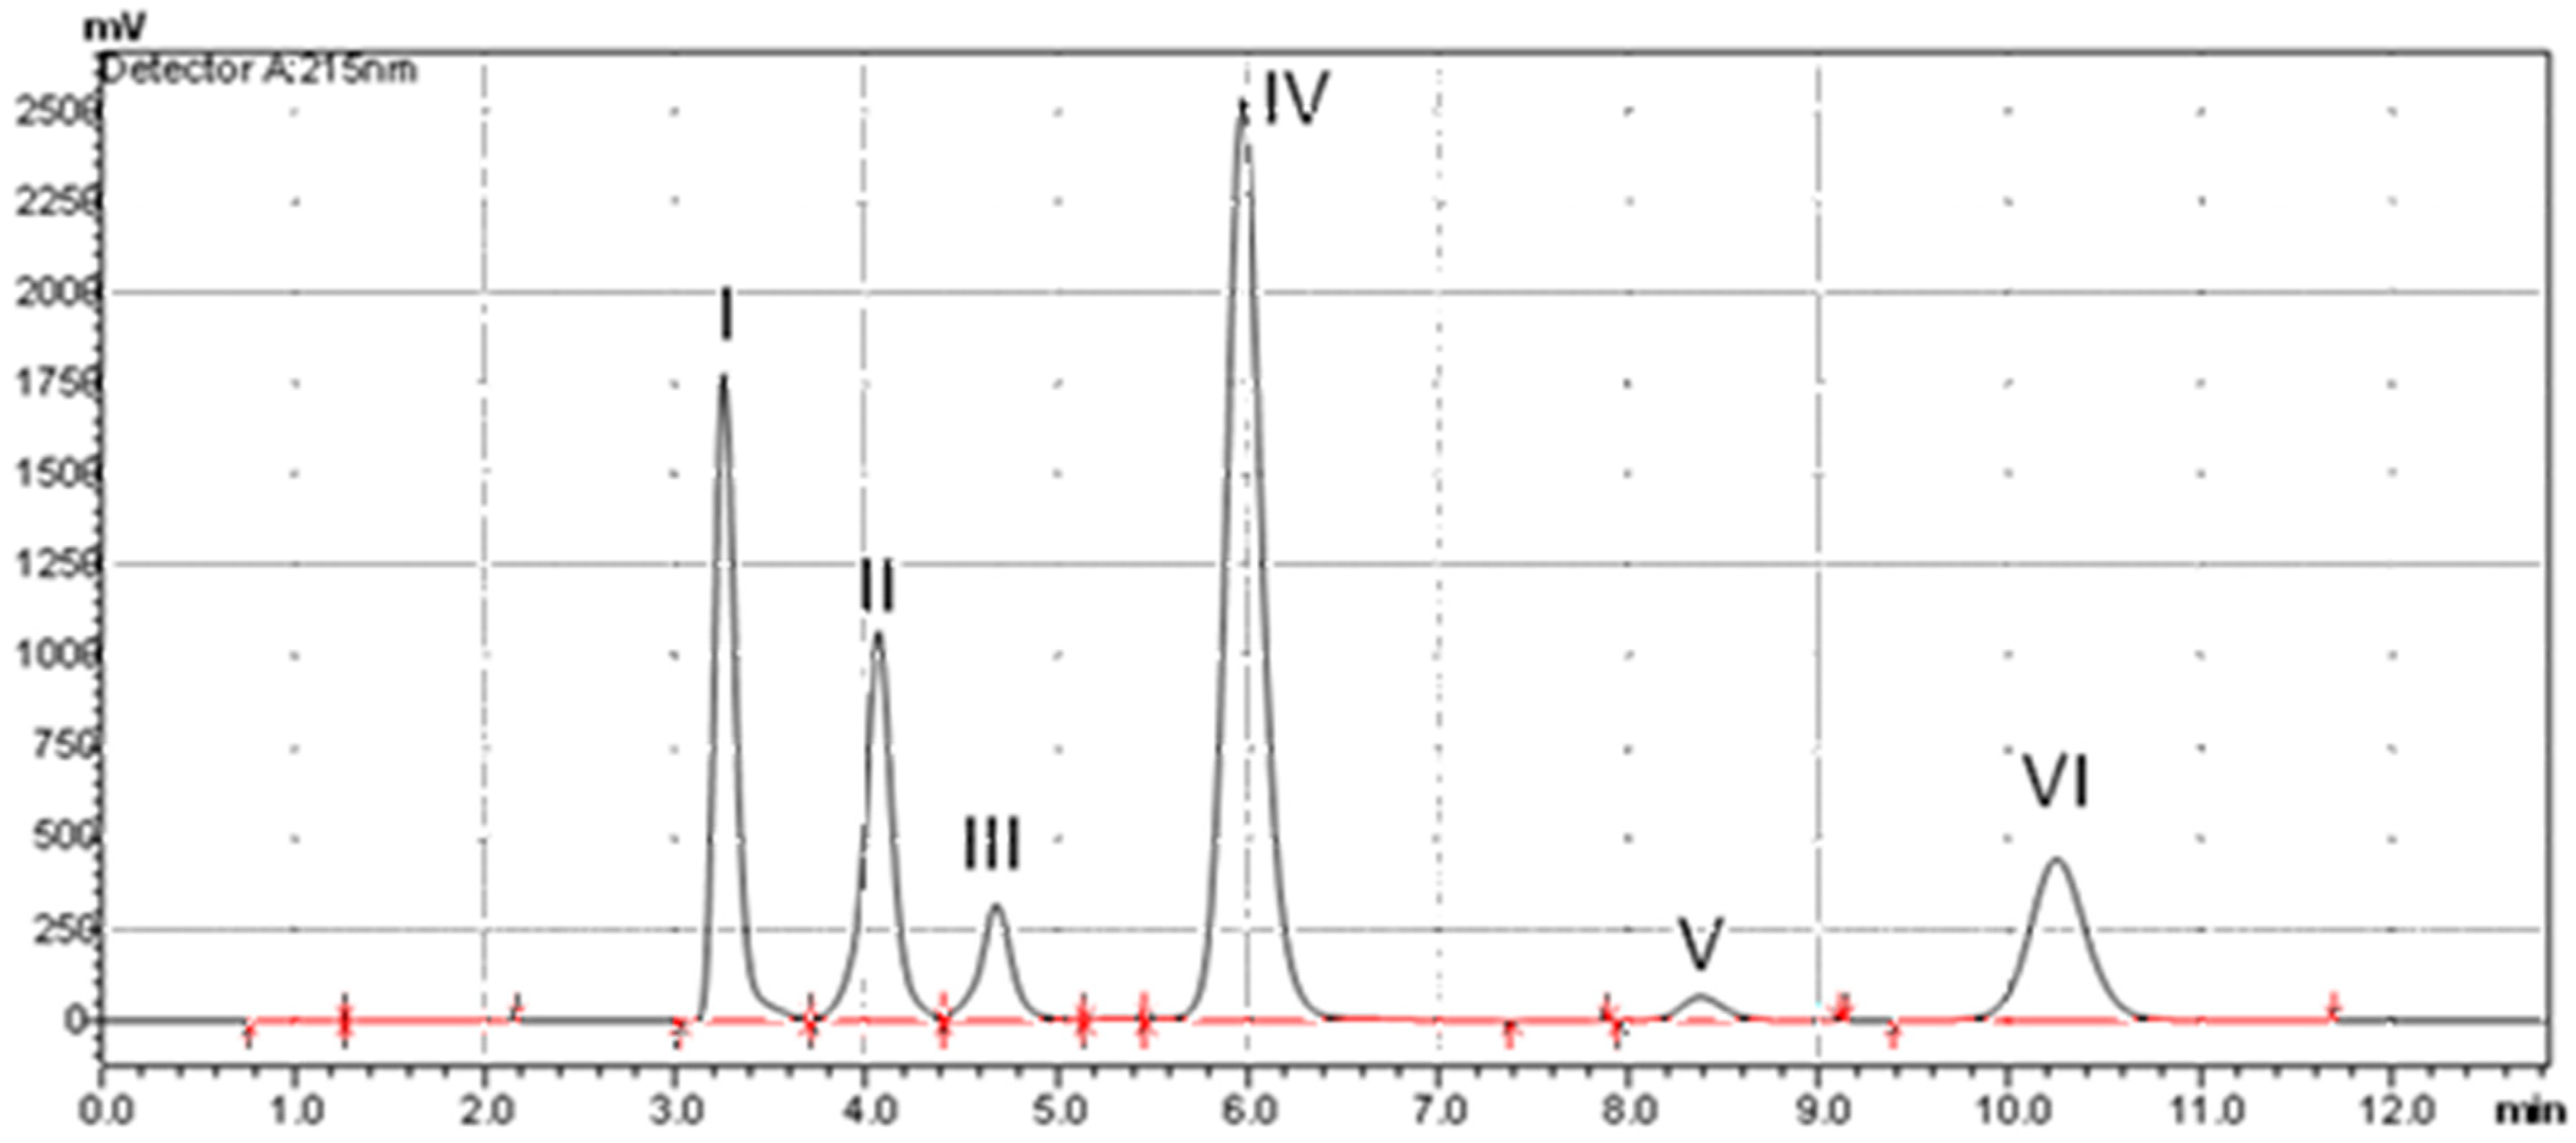
Optimization of method parameters was required to achieve good separation. These parameters included the choice of stationary phase (column), mobile phase composition, and detection wavelength and flow rate. A reversed phase column (C18) was used in the development of our method. One of the main parameters that effected the retention of compounds on the stationary phase was the partition coefficient of the analyte. Partition coefficient, as represented by Log P, is a measure of the hydrophobicity of compounds. On a RP column, compounds with lower Log P values will be eluted faster and compounds with higher Log P values will be retained longer. The elution profiles for etoricoxib and additives (Figure 1) correlate the Log P values of the components of the formula (Table 1).
Compounds were eluted in order of increasing log P, so that compounds with a lower log P value had a shorter retention time (e.g., sodium saccharin in both formulas in Figure 1, and Table 1). In addition, compounds with higher Log P value had a longer retention time (e.g., butyl paraben), and the internal standard celecoxib. Log P is not the only factor influencing elution from the column; however, analytes with active functional groups with their ionization status may interact with the stationary phase resulting in lower or higher retention times.
The optimal mobile phase composition was found to be methanol and phosphate buffer of pH 6 in the ratio of 70:30 v/v. Etoricoxib is a weak basic drug with an estimated pKa of 4.6. In order to achieve an acceptable retention of etoricoxib on a reversed phase (RP) column, it should be partially ionized or unionized, so that it can achieve higher interaction with the stationary phase. According to Henderson-Hasselbalch equation, this is achieved when pH is <pKa. However, such a pH would be too low for other components of the suspension with higher pKa values (methyl paraben pKa 8.87and butyl paraben pKa 8.79). A pH value of 6 is an intermediate value at which etoricoxib and parabens show acceptable retention and good resolution. Thus, significant retention of these compounds is expected to be observed in reversed phase columns with better chance of resolution.
This is also in accordance with the resolution equation, which is directly proportional to the number of theoretical plates, selectivity, and capacity factor. Since sodium saccharin is a sodium salt, it will be presented, as the only analyte here, in its ionized form in aqueous solution due to its acidic sulfimide group. The retention time of this ionized form will be influenced by the pH of the mobile phase. The compound will only be sufficiently retained on the HPLC column in its unionized form, i.e., in the saccharin form, which has a pKa value of 1.6. In spite of the fact that the retention of sodium saccharin is not significant in comparison with other analytes at pH 6, the selectivity factor between it and other analytes was increased and raised to better chance for resolution. Similarly, but to a lesser extent, vanillin (pKa 7.4) will be effected by the pH of the mobile phase, rendering vanillin in partially ionized form due to its acidic phenol group.
Aqueous solubility and the presence of polar functionalities are other factors can affect the retention time of the analytes sodium saccharin and vanillin are more water soluble compounds than etoricoxib with its basic pyridine group, and parabens with its acidic phenol group, and have multiple polar entities, thus they are expected to be eluted first from RP column.
Several flow rate options (0.7–0.9 mL/min) were tested. The optimum flow rate was found to be 0.8 mL/min with an injection volume 20 μL. The choice of this flow rate, together with the abovementioned chromatographic conditions, can be justified by the good symmetry of the peaks and adequate retention times of etoricoxib and other additives. The detection wavelength was set as a compromise between the sensitivity and selectivity for each analyte. Thus, 215 nm was selected as an optimal wavelength since it produced a reasonable sensitivity for all analytes and provided acceptable signal to noise ratio.
Taking into consideration the above points, the reversed phase HPLC method with isocratic elution of the mobile phase, consisting of phosphate buffer and methanol, was selected as a starting chromatographic system because of its cost-effectiveness, and good initial separation for components of etoricoxib suspensions.
3.2. HPLC Analytical Method Validation
This method validation is according to the ICH guidelines [21]. Accuracy, linearity, precision, range, specificity, LLOD, LLOQ, and robustness the main characteristics of the HPLC analytical method were validated only for formula #1, as mentioned above.
3.2.1. Linearity
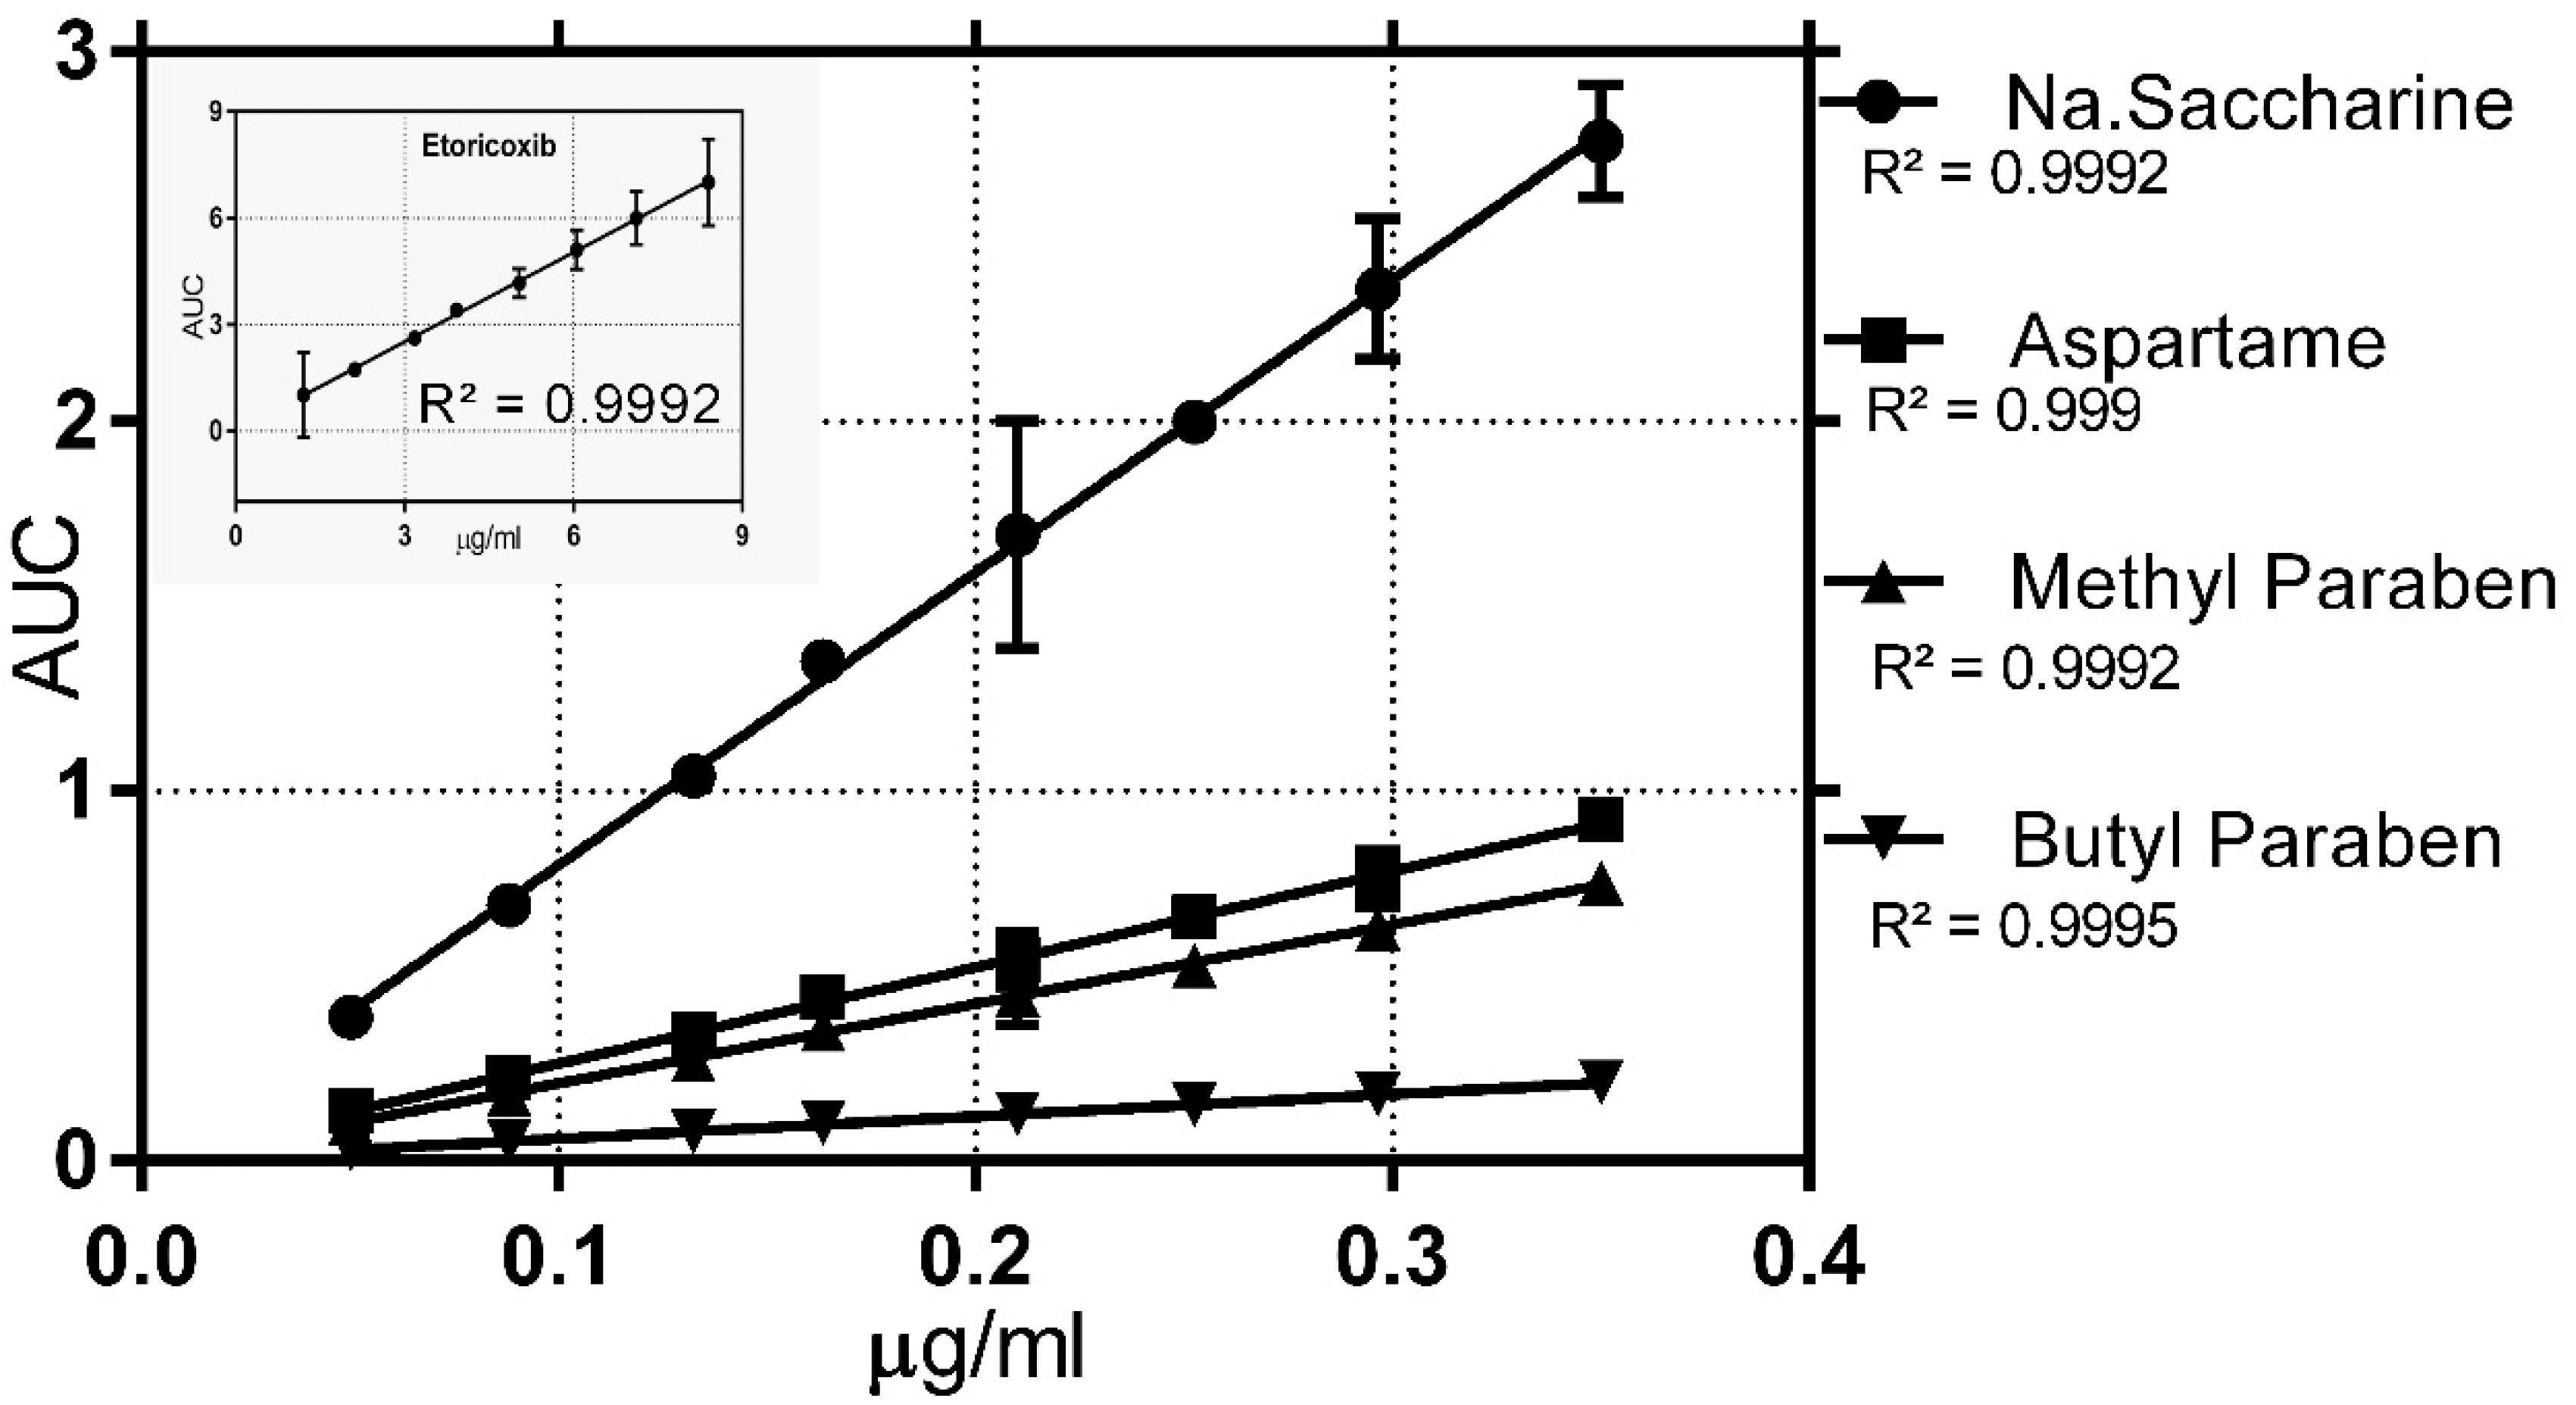
The linearity of an analytical procedure is its capability, within a given range, to gain test results that are directly proportional to the concentration of analyte in the sample [21]. The linearity of the proposed HPLC analytical method was determined by making triplicate injections, at each concentration, of the solution preparations of etoricoxib and the other additives. Each of the solution preparations were spiked with an internal standard of celecoxib, and then injected into the column. The calibration curves of the analytes are shown in (Figure 2). The data showed excellent linearity (R2 > 0.999) between the peak area and the concentration for each analyte. Since the intercepts shown were not equal to zero, we wanted to see if there was a significant difference between each intercept and the zero value. For this, two tailed Student’s T-tests were performed. The p-value obtained for y-intercepts >0.05 showed that there is no significant difference between each of the intercepts and zero point.
3.2.2. Accuracy (Recovery)
Accuracy of an analytical procedure is defined as the closeness of agreement between the value that is found and the value that is accepted, either as a conventional true value or an accepted reference value [21]. Accuracy of the developed HPLC method was evaluated in terms of percent mean recovery studies at six different concentrations (25%, 50%, 75%, 100%, 125% and 150%), each done in triplicate. The percentage of mean analyte (drug or other ingredients) recovered, when known amounts of standard analyte were added to the formula samples and subjected to proposed HPLC method. Percentage mean recovery, standard deviation (SD) and relative standard deviation (RSD) were calculated. The results that were obtained showed that the proposed HPLC analytical method was accurate, as the recovery values were in the range 98.79–101.77%.
3.2.3. Precision
Precision of an analytical procedure is defined as the closeness of agreement (degree of scatter) between a series of measurements gained from multiple sampling of the same homogenous sample, under the prescribed conditions [21].
The HPLC analytical method precision was demonstrated by calculating the percent relative standard deviation (%RSD) of the 25%, 50%, 75%, 100%, 125% and 150% recoveries of the samples used to determine accuracy (recovery). Since most of the calculated percentage RSD values are <2%, this means that the proposed HPLC analytical method is precise.
3.2.4. Range
The range of an analytical procedure is defined as the interval between the upper and lower concentrations of analyte in the sample (including these concentrations) for which it has been demonstrated that the analytical procedure has a suitable level of linearity, accuracy and precision [21]. According to the linearity, accuracy (recovery), and precision results, the assay range of 25–150% is considered validated for etoricoxib, sodium saccharin, vanillin, methyl paraben and butyl paraben.
3.2.5. Specificity
Specificity of an analytical procedure is defined as the ability to assess, unequivocally, the analyte in the presence of components that may be expected to be present. Specificity in HPLC suggests that a given analyte peak is indeed the desired analyte structure and is 100% pure [21]. The HPLC analytical method specificity was affirmed by demonstrating that for the peak of each analyte, there was no interfering peak from the diluent or other components of the preparation. This was accomplished by comparing chromatograms of individual analytes with the combined analytes and according to the purity results from photodiode detection.
3.2.6. LLOD and LLOQ
The limit of detection is the lowest analyte concentration that produces a response detectable above the noise level of the system, and the limit of quantification is the lowest level of analyte that can be accurately and precisely measured [21]. LLOD and LLOQ for etoricoxib and the excipients sodium saccharin, vanillin, methyl paraben, and butyl paraben were calculated according to Equations (1) and (2) in the Experimental Section. The results shown in (Table 2) indicated that both LLOD and LLOQ are below the concentration of each component in sample solution.
3.2.7. Robustness
According to the ICH Guidelines, “robustness of the HPLC analytical method is determined by small deliberate changes in some of its parameters which include the flow rate, wavelength, and pH of the buffer used in the mobile phase and the mobile phase ratio. If measurements are susceptible to variations in analytical conditions, the analytical conditions should be suitably controlled or a precautionary statement should be included in the procedure” [21].
Table 3 shows the effect of variations of each of HPLC parameters on the retention time of the analytes. The results show that the fluctuation of the flow rate produced the highest variation, with a percentage RSD value around 13%.
The pH of the mobile phase is of great importance, as it influences the degree of ionization of analytes—hence their retention value as shown earlier in this section. Ideally, the pH of the mobile phase buffer should be within 2 pH units from the analyte of interest, so that small changes in pH will not drastically change the ionization ratio [22]. Four buffer systems with different pH values (pH 4, 5.5, 6.0 and 6.5) were tested. These results showed that these pH values did not drastically affect the retention times of the analytes, and the variations as represented by %RSD were below 5%. Similarly, mobile phase polarity may also affect the interaction between the analyte and the stationary phase. However, in this study mobile phase variations did not show major effect on the retention time as represented by %RSD values (<5%). Thus, small changes in mobile phase components and pH of the buffer did not change largely the interaction between the analytes and the RP stationary phase. Subsequently, the robustness with respect to the effect of these parameters on the resolution and the response were evaluated.
Table 4 shows the robustness of the method with respect to the resolution. This includes the effect of small changes in the method, such as altering the mobile phase pH, flow rate, changes in mobile phase composition, and wavelength. It was observed that there were not many changes in the resolutions of analytes. The resolution of vanillin/methyl paraben, however, was the most sensitive to changes in the analytical method because of the closeness of their retention times. The mobile phase ratio 68/32 improved the resolution better than the selected 70/30 ratio. The total run of chromatogram increased from 13 min (using 70/30 ratio) to 15 min (using 68/32 ratio), indicating that more amount of mobile phase was consumed which was considered not preferable in terms of cost and time effectiveness reasons. In addition, pH 6 allowed for the best resolution among different components and was considered optimal (Table 4).
The response, presented as the ratio of the peak area of the analyte to the peak area of the internal standard of contents of the solution preparation, was not adversely affected by the flow rate changes as evident from the low value of %RSD (<5.00%). This indicated that the proposed HPLC analytical method is robust with respect to the changes in the flow rate 0.7–0.9 mL/min. Variations in detector’s wavelength significantly affected the response of methyl paraben and butyl paraben (%RSD > 10.0 %), but it did not affect the response of either sodium saccharin, vanillin or etoricoxib (%RSD < 5.00%). Increasing wavelength by 2 nm had a more pronounced effect on the response of methyl paraben and butyl paraben, due to the drop in the UV absorptivity of both analytes at 217 nm, while decreasing wavelength by 2 nm did not have this effect. Thus, it is recommended to strictly control the wavelength of the detector during the assay of the suspensions containing methyl paraben or butyl paraben, which will not be a problem since most HPLC instruments provide well-controlled UV detector. Variations in pH of the mobile phase affected significantly the response of methylparaben (%RSD > 10.0%), while it did not affect the response of either sodium saccharin, vanillin, etoricoxib or butyl paraben (%RSD << 5.00%). Increasing the pH by 0.5 had a more pronounced effect on the response of methyl paraben because it could be slightly ionized at higher pH due to the formation of phenolate anion, which has higher UV absorptivity leading to higher response. On the contrary, decreasing the pH of the mobile phase by 0.5 did not have this effect. Thus, it is recommended to strictly control the pH of the mobile phase during the assay of the suspensions containing methyl paraben. The response of all the analytes was not adversely affected by the mobile phase component ratio changes as evident from the low value of %RSD (<5.00%) indicating that the proposed HPLC analytical method is robust with respect to the small changes in the mobile phase component ratio. Such small changes in the polarity of the mobile phase did not affect the degree of interaction between the analytes and the stationary phase of RP column.
3.3. Crystal Growth of Etoricoxib Suspensions
A short-term physical stability study was performed to evaluate the comparative stabilization efficiency of different concentrations of β-CD and HP-β-CD, which were used in the formulation of etoricoxib suspensions. Cyclodextrins have been added to the formulations as a taste masking agent and a crystal growth inhibitor. During the physical stability study of the formulation having no cyclodextrins, crystal growth as indicated by an increase of particle size was observed (Table 5). Photomicroscope images indicated that the increase of particle size of etoricoxib was due to the crystal growth but not due to agglomeration. The particle size distribution of etoricoxib powder was found different from that of etoricoxib suspension as shown in (Table 5) because the methods of measurement were different.
Etoricoxib powder was measured by the dry dispersion method while the suspension was measured by the wet dispersion method. It is interesting to note that the rate of crystal growth was almost constant within two weeks of the experiment at room temperature as indicated by the value of D (0.9) in microns.
It was reported that the crystal growth of drug particles in suspensions might be due to nucleation and particle growth. This observation justified the need of additional crystal growth inhibitor to overcome the problem by providing steric barrier since xanthan gum and Na. CMC alone were not able to completely inhibit crystal growth of etoricoxib.
For concentrations of either β-CD or HP-β-CD as low as 1% w/w, crystal growth of etoricoxib in suspensions were observed after 2 month. At higher concentrations of cyclodextrins, β-CD was found less effective than HP-β-CD in inhibiting crystal growth of etoricoxib in suspensions after 3 month storage at room temperature.
β-CD was required to be added in a concentration of 5% w/w in order to be effective, while HP-β-CD was effective at 3% w/w. When either 5% w/w of β-CD or 3% w/w or more of HP-β-CD was used in suspensions as crystal growth inhibitors, no significant increase of particle size occurred.
β-CD or HP-β-CD molecules via formation of inclusion complexes solubilize drugs, which lead to the stabilization of supersaturated drug solutions resulting in inhibition of nucleation and crystal growth [23]. Furthermore, it can be explained that HP-β-CD was more efficient than β-CD because it interacted more strongly with etoricoxib due to its higher solubility in water.
4. Conclusions
A new and rapid reversed phase HPLC method was developed, and validated, for simultaneous separation and determination of etoricoxib, preservatives, and flavors in a suspension dosage form. The method is precise, linear, accurate, sensitive, specific, and reproducible. The method could be utilized as a pharmaceutical routine quality control method of etoricoxib suspension dosage form.
Within the three months of testing HP-β-CD proved to be more effective than β-CD at 3% w/w in inhibiting the crystal growth of etoricoxib in its suspension formulations at room temperature. The β-CD should be added at 5% w/w to produce the same inhibitory effect on crystal growth.
Author Contributions
M.A. planned and supervised the research work, relevant analysis and validation. He also prepared the manuscript draft, and its final version. M.S. carried out the lab work and wrote the procedures. W.A.-Z. processed the figures, and participated in writing and editing the entire final manuscript draft, linguistically and scientifically. K.A. looked after the formulation of suspension and testing of crystal growth generation.
Funding
The Deanship of Academic Research at the University of Jordan funded this study. The project/grant number of (55/2009/2010).
Acknowledgments
We wish to thank the Deanship of Academic Research at the University of Jordan for supporting and funding this project.
Conflicts of Interest
The authors declare no conflict of interest.
References
- Cochrane, D.; Jarvis, B.; Keating, G. Etoricoxib. Drugs 2002, 62, 2637–2651. [Google Scholar] [CrossRef] [PubMed]
- Arfè, A.; Scotti, L.; Varas-Lorenzo, C.; Nicotra, F.; Zambon, A.; Kollhorst, B.; Schink, T.; Garbe, E.; Herings, R.; Straatman, H. Non-steroidal anti-inflammatory drugs and risk of heart failure in four European countries: Nested case-control study. BMJ 2016, 354. [Google Scholar] [CrossRef] [PubMed]
- Park, K.; Bavry, A.A. Risk of stroke associated with nonsteroidal anti-inflammatory drugs. Vasc. Health Risk Manag. 2014, 10, 25–32. [Google Scholar] [PubMed]
- Moraes, B.M.; do Amaral, B.C.; Morimoto, M.S.; Vieira, L.G.; Perazzo, F.F.; Carvalho, J.C. Anti-inflammatory and analgesic actions of etoricoxib (an NSAID) combined with misoprostol. Inflammopharmacology 2007, 15, 175–178. [Google Scholar] [CrossRef] [PubMed]
- Clarke, R.; Derry, S.; Moore, R.A. Single dose oral etoricoxib for acute postoperative pain in adults. Cochrane Database Syst. Rev. 2014. [Google Scholar] [CrossRef] [PubMed] [Green Version]
- Suhagia, B.N.; Patel, H.M.; Shah, S.A.; Rathod, I.; Parmar, V.K. Preparation and characterization of etoricoxib-polyethylene glycol 4000 plus polyvinylpyrrolidone K30 solid dispersions. Acta Pharm. 2006, 56, 285–298. [Google Scholar] [PubMed]
- Kulshreshtha, A.K.; Singh, O.N.; Wall, G.M. Pharmaceutical Suspensions: From Formulation Development to Manufacturing; Springer: New York, NY, USA, 2009. [Google Scholar]
- Aulton, M.E. Pharmaceutics: The Science of Dosage Form Design; hurchill Livingstone: London, UK, 2002. [Google Scholar]
- Clas, S.D.; Crocker, L.S.; McCauley, J.A.; Davies, I.; Dalton, C. Polymorphic, Amorphous and Hydrated Forms of 5-Chloro-60-methyl-3-[4-(methylsulfonyl)phenyl]-2,30-bipyridine. U.S. Patent 6,441,002, 27 August 2002. [Google Scholar]
- Dalton, C.R.; Clas, S.D.; Singh, J.; Khougaz, K.; Bilbeisi, R. Investigating the hydrate conversion propensity of different etoricoxib lots. J. Pharm. Sci. 2006, 95, 56–69. [Google Scholar] [CrossRef] [PubMed]
- Patel, B.S.H.; Shah, S.; Rathod, I. Determination of Etoricoxib in Pharmaceutical Formulations by HPLC Method. Indian J. Pharm. Sci. 2007, 69, 703–705. [Google Scholar] [CrossRef]
- Dalmora, S.L.; Mda, S.S.; da Silva, L.M.; Macedo, R.O.; Barth, T. Validation of a capillary zone electrophoresis method for the comparative determination of etoricoxib in pharmaceutical formulations. J. Sep. Sci. 2008, 31, 169–176. [Google Scholar] [CrossRef] [PubMed]
- Shah, N.J.; Shah, S.J.; Patel, D.M.; Patel, N.M. Development and Validation of HPTLC Method for the Estimation of Etoricoxib. Indian J. Pharm. Sci. 2006, 68, 788–789. [Google Scholar] [CrossRef]
- Narajji, C.; Karvekar, M.D. Method development and validation for simultaneous estimation of Paracetamol and Etoricoxib in pharmaceutical dosage form by RP-HPLC method. Der Pharma Chem. 2011, 3, 7–12. [Google Scholar]
- Syal, P.K.; Sahoo, M.; Ingale, K.D.; Ingale, S.S.; Choudhari, V.P.; Kuchekar, B.S. Development and validation of a RP-HPLC-PDA method for simultaneous estimation of Drotaverine and Etoricoxib in tablet and its application for dissolution studies. Der Pharma Chem. 2010, 2, 93–102. [Google Scholar]
- Hartman, R.; Abrahim, A.; Clausen, A.; Mao, B.; Crocker, L.S.; Ge, Z. Development and Validation of an HPLC Method for the Impurity and Quantitative Analysis of Etoricoxib. J. Liq. Chromatogr. Relat. Technol. 2003, 26, 2551–2566. [Google Scholar] [CrossRef]
- Likhar, A.; Wadodkar, S.G.; Gupta, K.R. Application of Stability Indicating HPLC Method for Quantitative Determination of Etoricoxib and Paracetamol in Pharmaceutical Dosage Form. Eurasian J. Anal. Chem. 2010, 5, 218–226. [Google Scholar]
- Vora, D.N.; Kadav, A.A. Separation of Etoricoxib and Its Degradation Products in Drug Substance Using UPLC. Eurasian J. Anal. Chem. 2007, 2, 151–158. [Google Scholar]
- Shabir, G.A. Validation of high-performance liquid chromatography methods for pharmaceutical analysis: Understanding the differences and similarities between validation requirements of the US Food and Drug Administration, the US Pharmacopeia and the International Conference on Harmonization. Drug Dev. Ind. Pharm. 2003, 987, 57–66. [Google Scholar]
- Ermer, J. Validation in pharmaceutical analysis. Part I: An integrated approach. J. Pharm. Biomed. Anal. 2001, 24, 755–767. [Google Scholar] [CrossRef]
- ICH Harmonised Tripartite Guideline. Validation of Analytical Procedures: Text and Methodology, Q2 (R1); ICH: Geneva, Switzerland, 2005; Volume 1. [Google Scholar]
- McCalley, D.V. Rationalization of retention and overloading behavior of basic compounds in reversed-phase HPLC using low ionic strength buffers suitable for mass spectrometric detection. Anal. Chem. 2003, 75, 3404–3410. [Google Scholar] [CrossRef] [PubMed]
- Sohi, H.; Sultana, Y.; Khar, R.K. Taste masking technologies in oral pharmaceuticals: Recent developments and approaches. Drug Dev. Ind. Pharm. 2004, 30, 429–448. [Google Scholar] [CrossRef] [PubMed]
Figure 1.
Peaks in order from left: Sodium saccharine (I), vanillin (II), methyl paraben (III), etoricoxib (IV), butyl paraben (V) and the internal standard celecoxib (VI).
Figure 1.
Peaks in order from left: Sodium saccharine (I), vanillin (II), methyl paraben (III), etoricoxib (IV), butyl paraben (V) and the internal standard celecoxib (VI).

Figure 2.
High pressure liquid chromatography (HPLC) linearity curves of etoricoxib and other formula additives. (The error bars on the calibration graph data for etoricoxib are magnified 10 times to appear on this small-scale curve).
Figure 2.
High pressure liquid chromatography (HPLC) linearity curves of etoricoxib and other formula additives. (The error bars on the calibration graph data for etoricoxib are magnified 10 times to appear on this small-scale curve).


Table 1.
Experimental Log P, pKa and retention times of suspension components (analytes).
| Compound | Log P | pKa | Retention Time in Minutes |
|---|---|---|---|
| Sodium saccharin | −0.96 | 1.6 | 3.26 |
| Vanillin | 1.21–1.35 | 7.38 | 4.10 |
| Methyl Paraben | 1.91 | 8.87 | 4.69 |
| Etoricoxib | 2.79 | 4.60 | 5.98 |
| Butyl Paraben | 3.50 | 8.79 | 8.38 |
| Celecoxib | 3.90 | 10.70 | 10.25 |
Table 2.
Lower Limit of Detection (LLOD) and Lower Limit of Quantification (LLOQ) in μg/mL of sodium saccharin, vanillin, methyl paraben and butyl paraben.
Table 2.
Lower Limit of Detection (LLOD) and Lower Limit of Quantification (LLOQ) in μg/mL of sodium saccharin, vanillin, methyl paraben and butyl paraben.
| Analyte | LLOD (μg/mL) | LLOQ (μg/mL) | Conc. of Each Analyte in Sample Solution (μg/mL) |
|---|---|---|---|
| Sodium saccharin | 8.18 | 27.28 | 125 |
| Vanillin | 6.86 | 22.87 | 125 |
| Methyl Paraben | 3.34 | 11.13 | 32.5 |
| Etoricoxib | 5.08 | 16.94 | 300 |
| Butyl Paraben | 0.73 | 2.44 | 12.5 |
Table 3.
Effect of variations of HPLC parameters on the retention time of the analytes expressed as mean ± standard deviation in minutes.
Table 3.
Effect of variations of HPLC parameters on the retention time of the analytes expressed as mean ± standard deviation in minutes.
| Variable | Sodium Saccharin | Vanillin | Methyl Paraben | Etoricoxib | Butyl Paraben |
|---|---|---|---|---|---|
| Flow rate: 0.7–0.9 mL/min Optimum: (0.8 mL/min) | 3.30 ± 0.431 mL/min | 4.17 ± 0.532 mL/min | 4.72 ± 0.590 mL/min | 5.26 ± 0.746 mL/min | 8.38 ± 1.044 mL/min |
| Mobile Phase: 68/32–72/28 Optimum: 70/30 | 3.22 ± 0.037 mL/min | 4.03 ± 0.0774 min/min | 4.62 ± 0.149 min/min | 5.85 ± 0.400 min/min | 8.07 ± 0.895 mL/min |
| pH: 4–6.5 Optimum: pH 6.0 | 3.04 ± 0.058 mL/min | 4.09 ± 0.074 mL/min | 4.66 ± 0.066 mL/min | 5.87 ± 0.187 mL/min | 8.07 ± 0.370 mL/min |
Table 4.
Robustness data expressed as resolution between adjacent peaks: Sodium saccharin /vanillin (1), vanillin/methyl paraben (2), methyl paraben/etoricoxib (3), etoricoxib/butyl paraben (4) and butyl paraben/celecoxib (5).
Table 4.
Robustness data expressed as resolution between adjacent peaks: Sodium saccharin /vanillin (1), vanillin/methyl paraben (2), methyl paraben/etoricoxib (3), etoricoxib/butyl paraben (4) and butyl paraben/celecoxib (5).
| Items | 1 | 2 | 3 | 4 | 5 |
|---|---|---|---|---|---|
| Optimum HPLC parameters | 1.25 | 0.95 | 1.72 | 3.43 | 2.49 |
| Flow rate: 0.8 mL/min | |||||
| Mobile phase: 70:30 | |||||
| pH: 6.0 | |||||
| Wavelength at 215 nm | |||||
| Flow rate 0.7 mL/min | 1.52 | 0.51 | 1.91 | 3.84 | 2.62 |
| Flow rate 0.9 mL/min | 1.35 | 0.7 | 1.39 | 2.78 | 1.91 |
| Mobile phase 68:32 | 1.31 | 1.02 | 1.93 | 3.71 | 3.11 |
| Mobile phase 72:28 | 1.25 | 0.86 | 1.35 | 2.55 | 1.54 |
| Wavelength at 213 nm | 1.36 | 0.79 | 1.57 | 3.14 | 2.62 |
| Wavelength at 217 nm | 1.24 | 0.79 | 1.79 | 3.37 | 2.47 |
| pH 4 | 1.39 | 0.72 | 1.37 | 2.79 | 1.57 |
| pH 5.5 | 1.22 | 0.88 | 1.44 | 2.57 | 1.66 |
| pH 6.5 | 1.01 | 1.03 | 1.62 | 2.88 | 2.63 |
Table 5.
Particle size analysis of etoricoxib powder and etoricoxib 1.2% w/w suspension without cyclodextrins kept at room temperature for two weeks.
Table 5.
Particle size analysis of etoricoxib powder and etoricoxib 1.2% w/w suspension without cyclodextrins kept at room temperature for two weeks.
| Sample | Method | D(0.1) *, μm | D(0.5) *, μm | D(0.9) *, μm |
|---|---|---|---|---|
| Etoricoxib, powder | Dry Dispersion | 0.81 | 3.1 | 10.1 |
| Suspension, initial | Wet Dispersion | 3.4 | 7.1 | 16.8 |
| Suspension, 48 h | Wet Dispersion | 3.9 | 10.0 | 62.1 |
| Suspension, 72 h | Wet Dispersion | 4.3 | 12.0 | 88.3 |
| Suspension, 96 h | Wet Dispersion | 10.1 | 52.5 | 113.4 |
| Suspension, 336 h | Wet Dispersion | 52.4 | 140.7 | 326.9 |
* D (0.1), D (0.5), D (0.9): percentage of sample below this particle size as 10, 50 and 90% respectively.
© 2018 by the authors. Licensee MDPI, Basel, Switzerland. This article is an open access article distributed under the terms and conditions of the Creative Commons Attribution (CC BY) license (http://creativecommons.org/licenses/by/4.0/).
Share and Cite
MDPI and ACS Style
Alzweiri, M.; Sallam, M.; Al-Zyoud, W.; Aiedeh, K. Stability Study of Etoricoxib a Selective Cyclooxygenase-2 Inhibitor by a New Single and Rapid Reversed Phase HPLC Method. Symmetry 2018, 10, 288. https://doi.org/10.3390/sym10070288
AMA Style
Alzweiri M, Sallam M, Al-Zyoud W, Aiedeh K. Stability Study of Etoricoxib a Selective Cyclooxygenase-2 Inhibitor by a New Single and Rapid Reversed Phase HPLC Method. Symmetry. 2018; 10(7):288. https://doi.org/10.3390/sym10070288
Chicago/Turabian StyleAlzweiri, Muhammad, Mariam Sallam, Walid Al-Zyoud, and Khaled Aiedeh. 2018. "Stability Study of Etoricoxib a Selective Cyclooxygenase-2 Inhibitor by a New Single and Rapid Reversed Phase HPLC Method" Symmetry 10, no. 7: 288. https://doi.org/10.3390/sym10070288
Note that from the first issue of 2016, this journal uses article numbers instead of page numbers. See further details here.