Article

Intrasession Reliability of the Tests to Determine Lateral Asymmetry and Performance in Volleyball Players

by
Mario Iglesias-Caamaño
,
Javier Carballo-López
,
Tania Álvarez-Yates
,
Alba Cuba-Dorado
and
Oscar García-García
*
Laboratory of Sports Performance, Physical Condition and Wellness, Faculty of Education and Sport Sciences, University of Vigo, 36005 Pontevedra, Spain
*
Author to whom correspondence should be addressed.
Symmetry 2018, 10(9), 416; https://doi.org/10.3390/sym10090416
Submission received: 15 June 2018 / Revised: 14 September 2018 / Accepted: 16 September 2018 / Published: 19 September 2018
(This article belongs to the Special Issue Symmetry-Related Activity in Mid-Level Vision)

Abstract

:
The development of lateral asymmetries in athletes could have an influence on performance or injuries. The aim of this study was to determine the within-day reliability of the symmetry tests and the performance tests, and explore the relationship between them. Eighteen male volleyball players (18.1 ± 2.1 years) participated in this study. Seven lateral symmetry assessments were used, namely: lateral symmetry through tensiomyography (LS), active knee extension (AKE), Y-balance test (YBT), muscular electrical activity in attack jump (MEA-AJ), single-leg squat jump (SLSJ), triple hop test for distance (THTD), and bilateral maximum repetition in leg press (1RMSL); and three volleyball performance tests, namely: the T-test, counter-movement jump (CMJ), and attack jump (AJ). Three in-day measurements were taken from each volleyball player after the recovery was completed. The reliability was calculated through the intraclass correlation coefficient and the coefficient of variation, and the relationship was calculated through Pearson’s bivariate correlation coefficient (p < 0.05). The results indicate that AKE, YBT, and LS are the symmetry tests with increased reproducibility. THTD correlates positively with the AKE test and 1RMSL test, and a greater symmetry in the YBT correlates with a greater performance in the CMJ and AJ performance tests. In conclusion, AKE, LS, and YBT are the best tests to determine, with reliability, the asymmetries in volleyball players, and a greater symmetry in the YBT seems to influence the height of bilateral vertical jump.

1. Introduction

Most athletes show a preference for one side of their body when they perform a voluntary motor task. This primary use of a hand or a foot for a given motor skill is known as lateral preference [1] and is associated to the functional specialization of the right or left hemispheres [2].
There are several tests to determine the dominance in the lower limbs, which show that the dominant leg is not always the skillful one. This varies depending on the action to be performed, and in many cases, no differences between dominant (D) and non-dominant (ND) limbs are found [3].
As a result of this preference, lateral asymmetries can be developed, leading to differences of strength, power, stiffness, or joint range of movement (ROM) between the muscles on both sides of the athlete’s body. These appear by the different actions of sports where there is a unilateral prevalence, such as changes in direction, jumps, hits, and throws [4,5], creating specific sport adaptations and entailing an overuse of a certain structures. Even in bilateral exercises, the generation of forces can be notably different between the lower extremities [6].
The development of asymmetries due to the high level of specialization in sports can lead to certain risks. Some studies suggest that a difference in leg strength may be a risk factor for musculoskeletal injuries [7,8]. A difference in legs strength of 15% in knee flexors is related to an increase in “non-contact injuries” [7]. Other studies have determined that differences of more than 10% are considered an injury risk factor [9,10]. Therefore, this bilateral force measurement can determine which athletes have a higher probability of suffering injuries during training sessions and competitions.
On the other hand, the influence that a different application of forces between limbs could have on the decrease in performance has been addressed previously in the scientific literature. It has been determined that a bilateral deficit of force or power of 10% did not affect the jump height [11], while other works conclude that the difference between limbs has no relevance in performance when not exceeding 10–15% [12]. In addition, studies carried out to measure strength in isokinetic conditions [13] concluded that the contralateral force of the knee extensors are not associated with jumping performance.
In this sense, volleyball is a sport that demands explosive actions (250–300 actions per game) with 50–60% jumping, 27–33% attacks, and 12–16% landing [10]. These actions are performed by the most skilled side of the body. Specifically, the jump is done with the drive of the two legs together, but opposite to the forward attack arm, to favor the hip–trunk rotation and to perform a greater force hitting the ball [14]. On the other hand, there is an eccentric landing action within each jump, with an involvement in the creation of these lateral decompensations, where 40% of the landing actions are performed on one leg [15]. All of this seems to indicate that this sport could generate lateral asymmetries that could affect the jumping or ball hitting performance.
Several test batteries have been proposed for the evaluation of bilateral musculoskeletal asymmetries in the lower limbs [16,17,18,19]. The isokinetic tests are the most common assessments to determine asymmetries, which quantify the bilateral asymmetries of the most specific muscle groups, such as the quadriceps extensors and the flexors [20]. An additional test that is used is the counter-movement vertical jump or single-leg hop for distance, which present the difficulty that the force production is not measured directly and the performance is influenced by other factors [17]. Finally, the vertical jump in the force platform is another of the tests that is mostly used [16].
However, it seems that there is no consensus on which of these tests are the most appropriate to determine the lateral asymmetry in sports practice. Each test evaluates a different manifestation of strength or flexibility, and requires specific equipment. Other tests, such as those performed in isokinetic conditions, do not represent the mechanical performance model of most sports activities, such as the closed kinetic chain, rapid muscle actions, and multi-joint [21]. In this sense, it is necessary that the test that is to be performed is linked to the nature of the athlete’s movement, as these vary depending on the direction in which the force is applied [4].
In view of the above results, it seems appropriate to explore the use of a battery of specific tests to assess the lateral symmetry in well-trained volleyball players. The aim of this study is, firstly, to determine the relative and absolute within-day reliability of the tests that make up the battery. Secondly, to explore the relationships that may exist between the tests used to evaluate lateral symmetry. Finally, we intend to explore the relationship that may exist between the lateral symmetry assessment tests and the performance evaluation tests in volleyball.

2. Materials and Methods

2.1. Participants

Eighteen well-trained volleyball male players (four hitters, two liberos, five setters, three opposites, and four middles) with an average age of 18.1 ± 2.1 years, 180.8 ± 9.1 cm in height, 72.9 ± 8.3 kg of body weight, 10.1 ± 3.5% of body fat, and 62.9 ± 7.1 kg of muscle mass (BC-601 Bioimpedenace Analyser Tanita®, Tokyo, Japan) participated in this study.
All of the athletes were volunteers and signed the informed consent prior to the investigation, after receiving and reading the description of the tests to be performed as well as their possible risks. In the case of being under age, informed consent was signed by their parents or legal guardians. The coach and the club’s directors of the players were also informed, who gave their approval to the evaluation protocol. This research has followed the ethical principles of the Declaration of Helsinki (64 Ed. 2013) and the Data Protection Act 15/1999 of Spain. The protocol has been approved by the Ethical Research Committee of the Faculty of Education and Sports Sciences of the University of Vigo (Spain).

2.2. Experimental Design

To determine the tests’ reliability, a selective design of repeated measurements within-day has been used following a descriptive strategy [22]. In fact, three in-day measurements were taken from each volleyball player after the recovery was completed. Only in the bilateral maximum repetition in leg press (1RMSL) test was a single measurement taken, because the protocol suggests not making another maximum effort until after 72 h.
To determine the relationship between the symmetry tests and the relationship between these and the performance ones, a correlational design has been used, following an associative strategy [22]. The best value of the three measurements taken was used to analyze the possible relationships between the tests. The evaluation of the symmetry and performance tests was done within the volleyball players’ competition season, where they competed weekly (four training sessions and the competition match). All of the evaluations were performed after a complete recovery day.
The battery of tests consisted of a total of ten tests, the following seven are related to muscle asymmetries assessment: lateral symmetry by tensiomyography (LS), active knee extension (AKE), Y-balance test (YBT), muscular electrical activity in attack jump (MEA-AJ), single-leg squat jump (SLSJ), triple hop test for distance (THTD), and bilateral maximum repetition in leg press (1RMSL), and the following three tests are related to sports performance in volleyball: T-test, counter-movement jump (CMJ), and attack jump (AJ). The tests to evaluate muscle asymmetry have previously shown their usefulness in determining lateral symmetry in athletes of different disciplines, including volleyball [23,24,25,26]. Similarly, the selected performance tests have already been routinely used and indicated as valid in previous investigations in volleyball players [27,28,29].
The players were previously familiar with each of the tests, which were carried out in two different sessions, organized following the indications of Baechle and Earle [30]. In the first session, the LS by TMG, the AKE, the YBT, and the T-test were carried out, while in the second session, the THTD, the CMJ, the MEA-AJ, the AJ, the SLSJ, and 1RMSL tests were performed. All of the players performed the tests in this order.

2.3. Procedure

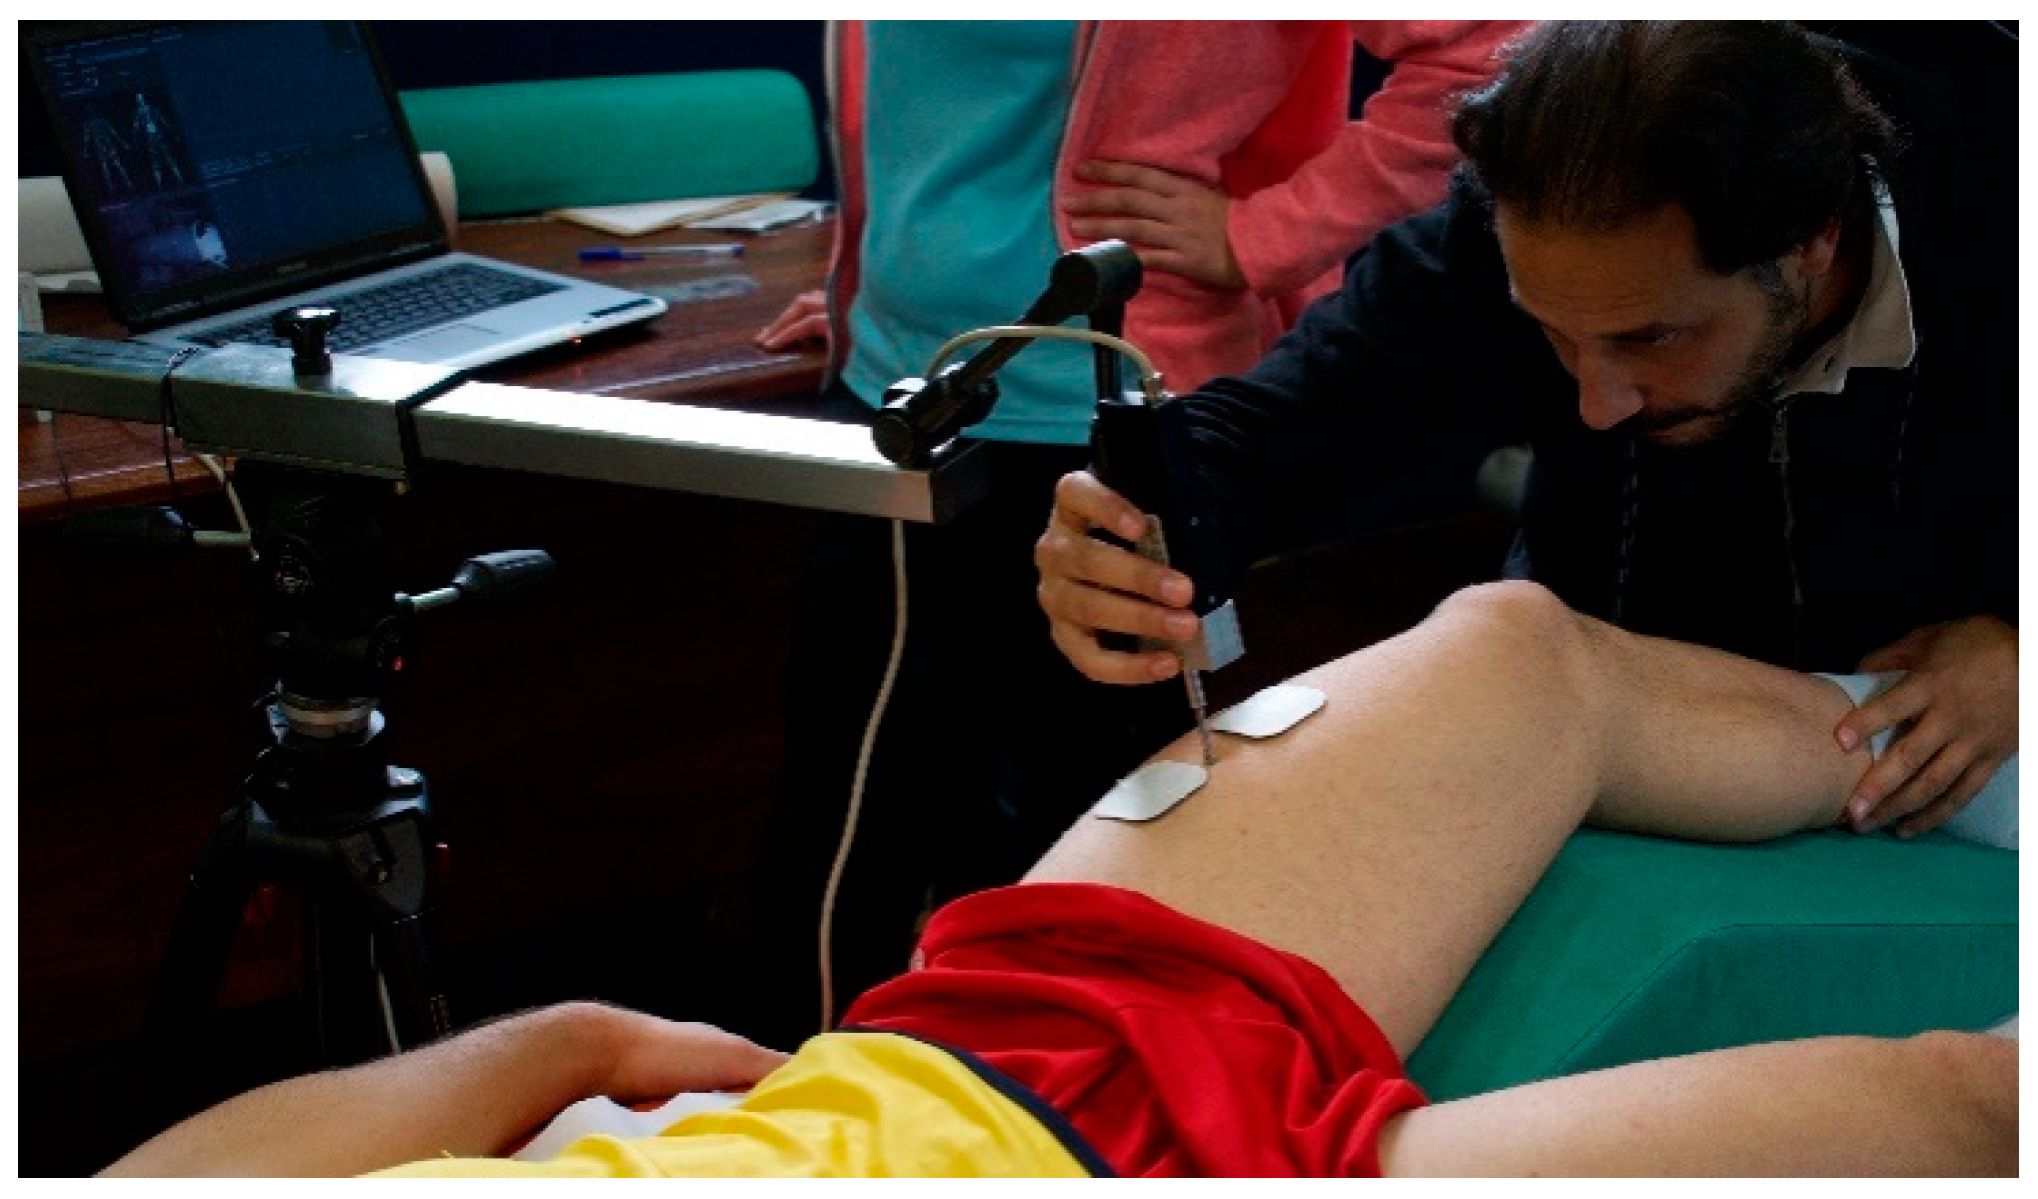
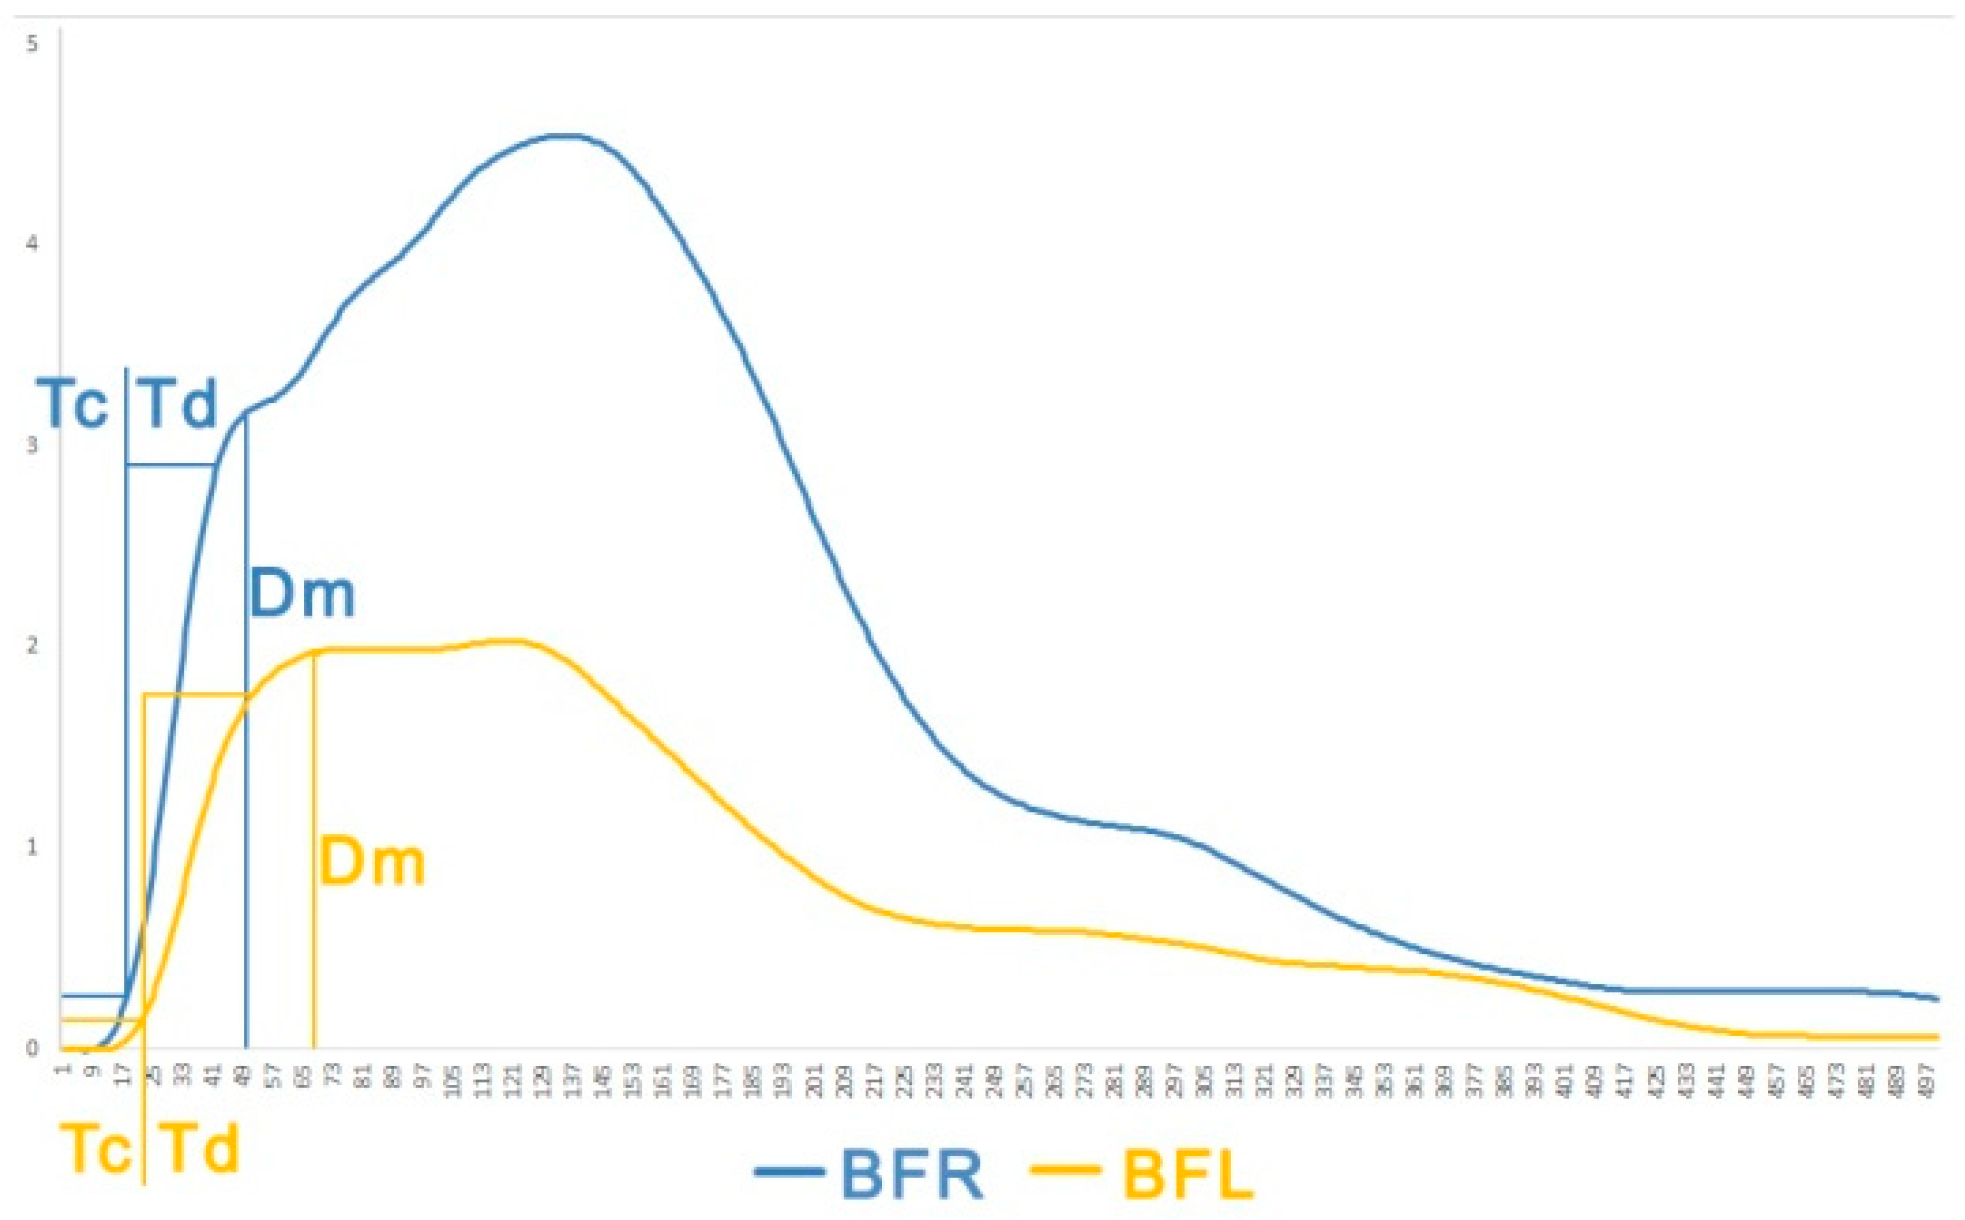
2.3.1. Tensiomyography (TMG)

TMG was used to measure the radial muscle belly displacement of the biceps femoris (BF) and rectus femoris (RF) in both of the limbs. The TMG assessments were performed following the protocol described by García-García et al. [31,32]. The BF was measured with the subject in the prone position, with the knee joint fixed at a 15° knee flexion angle by means of a specially designed wedge cushion. The RF was measured in the supine position, with the knee joint fixed at a 40° knee flexion angle, once again by means of a wedge cushion designed for that purpose.
The measures of radial muscle belly displacement were acquired by means of a digital displacement transducer (GK 30, Panoptik d.o.o., Ljubljana, Slovenia) set perpendicular to the thickest part of the muscle belly. For BF the measures were taken at the midpoint of a line between the fibula head and the ischial tuberosity; for RF the measures were taken on the anterior aspect of the thigh, midway between the superior border of the patella, and the anterior superior iliac spine. The self-adhesive electrodes (5 × 5 cm, Cefar-Compex Medical AB Co., Ltd., Malmö, Sweden) were placed symmetrically at a distance of 5 cm from the sensor (Figure 1). Electrical stimulation was applied with a pulse duration of 1 ms and an initial current amplitude of 30 mA, which was progressively increased in 10 mA steps until reaching 110 mA (maximal stimulator output). The electrical stimulus was produced by a TMG-S2 (EMF-FURLAN and Co. d.o.o., Ljubljana, Slovenia) stimulator. Of the nine curves recorded for each athlete, only the curve with the highest maximum radial displacement was included in the analysis for each muscle assessment.
Each measurement recorded the following parameters: maximum radial muscle belly displacement (Dm) in mm, contraction time (Tc) as the time in ms from 10% to 90% of Dm, delay time (Td) as the time in ms from onset to 10% of Dm, and sustain time (Ts) as the time in ms between 50% of Dm on both the ascending and descending sides of the curve. The data of these variables were used to calculate the percentages of lateral symmetry (LS) of each muscle evaluated, using the algorithm implemented by the TMG-BMC tensiomyography® software, as follows:
L s = 0.1 · min ( T D r · T D l ) max ( T D r · T D l ) + 0.6 · min ( T C r · T C l ) max ( T C r · T C l ) + 0.1 · min ( T S r · T S l ) max ( T S r · T S l ) + 0.2 · min ( D M r · D M l ) max ( D M r · D M l )    
where “r” corresponds to the right, “l” to the left, “min” to the minimum, and “max” to the maximum.

2.3.2. Active Knee Extension (AKE)

AKE was used to measure the hamstring flexibility symmetry, based on angular measurements (in degrees) achieved by the extension of the knee with the hip flexed [24]. The athlete was placed on a stretcher in the decubitus supine position with one leg extended and the opposite leg placed with a hip flexion of 90°, fixed by an evaluator with the ankle in a neutral position. From this position, the athlete began a progressive knee extension maintaining the hip flexion until he manifested pain or discomfort, or a pelvic retroversion was detected by the evaluator.
To measure the flexion angle, two expert evaluators used a digital goniometer (Baseline® Absolute Axis 360°, Fabrication Enterprises, Inc., White Plains, NY, USA) using anatomical references for the placement of the goniometer arms on the external malleolus, the external femoral condyle, and the trochanter of the femur. The evaluation was carried out without any previous warm-up.
The asymmetry was calculated through the following formula [33]:
  ( s t r o n g   l e g w e a k   l e g ) / s t r o n g   l e g × 100

2.3.3. Y-Balance Test (YBT)

This test was used to evaluate the symmetry of the dynamic balance of the lower limbs of the volleyball players, which has an inter- and intra-observer reliability of 0.85 and 0.82, respectively [23].
The YBT has a support platform from which three wooden blocks split, to be moved inside a wooden lane marked in cm. These lanes are placed on three axes, the anterior and the other two (posteromedial and posterolateral) at 135° from the first from both sides (Y Balance Test Kit™, Functionalmovement.com, Danville, VA, USA). Prior to the evaluation, the length (cm) of the two lower limbs of the athlete [34] was measured in the decubitus supine position on a stretcher, by means of an anthropometric tape measure (Seca 203, Hamburg, Germany), and the length was taken from the anterior superior iliac crest to the internal malleolus.
Once measured, the players were placed barefoot, with one foot on the support platform (dominant leg) and with their hands fixed on the hips, trying to reach as far as possible with the other foot on the three axes, in the following order: anterior, posterolateral, and posteromedial. For the measurement to be valid, the wooden blocks cannot be hit or leaned on, the hands should not loose contact with the hips, and at the end of the movement the athlete must return to the starting position in a balanced and controlled manner, to continue and follow the to the next axis [35].
As has been suggested [19], three valid measurements were made for each axis, and the athletes performed two practice measures in addition to the video viewing in the previous days.
To compare both limbs, these measures were normalized following the following formula:
( d i s t a n c e   o b t a i n e d   o n   a n   a x i s / r e l a t i v e   l e n g t h   o f   t h e   l i m b ) × 100
Subsequently, the composite score (CS) of each leg was calculated, applying the following equation:
( m a x i m u m   l e n g t h   o f   t h e   t h r e e   d i s t a n c e s ) / ( 3 · l e n g t h   o f   t h e   l i m b )
With this CS, the asymmetries between the legs were calculated, and the asymmetry between the previous distances was also checked, as a distance greater than 4 cm has been classified as risk of “contactless injury” [34].

2.3.4. T-Test

The T-test is a performance test to measure the agility that is developed in the following four planes: anterior, posterior, and both laterals. It was performed following a standardized version [36], in which the athletes begin from the base of a “T”, run to touch the front cone (10 m), then moving to their right (5 m), without crossing their feet at any time, touch the cone and move to their left to touch the opposite cone (10 m); then, return to touch the center cone again, and move backwards until they reached the starting point. Prior to carrying out this test, five minutes of individual warm-up was performed by each player. The times were measured in seconds using Polifemo Photocells (Microgate Corporation, Bolzano, Italy, Software version 1.10.19.01).

2.3.5. Triple Hop Test for Distance (THTD)

This test has been used to establish the lateral symmetry of the horizontal displacement reactive force. THTD has achieved excellent reproducibility values (intraclass correlation coefficient [ICC] 0.95) in physically active youngsters [26].
It consists of performing three horizontal impulses, trying to achieve the longest possible length on one leg, and then with the other (randomly chosen by the athlete). The hands should be fixed on the hips and the landing position should be maintained during the 2–3 s pause. The distance reached was measured in meters, from the tip of the foot at the starting moment to the heel (of the foot) at the landing moment of the third jump, comparing both legs with the use of the following formula [33]:
( s t r o n g   l e g w e a k   l e g ) / s t r o n g   l e g × 100  

2.3.6. Counter-Movement Jump (CMJ)

This test has been used to determine the flight time of the reactive force, but in a vertical displacement. It was designed by Bosco [28] and presents good validity and reliability with an ICC of 0.98 and coefficient of variation (CV) of 2.8% [37]. The test consists of performing a rapid flexion–extension of the legs with the minimum pause between the eccentric and concentric phase of the muscle contraction, with a free knee flexion to maximize the jump height [38]. The athlete must keep his hands on his hips at all times, and during the landing must actively seek the floor with his legs extended. Prior to the assessment, they were allowed to perform two jumps to facilitate their activation.
The CMJ evaluation was carried out on a contact platform (CHRONOJUMP Boscosystem®, Barcelona, Spain). The best flight time (s) was chosen from the three jumps performed, calculated by the CHRONOJUMP software (v. 1.7.0 for Windows, CHRONOJUMP Boscosystem®, Barcelona, Spain) [39]. The asymmetry was calculated with the following formula [33]:
  ( s t r o n g   l e g w e a k   l e g ) / s t r o n g   l e g × 100  

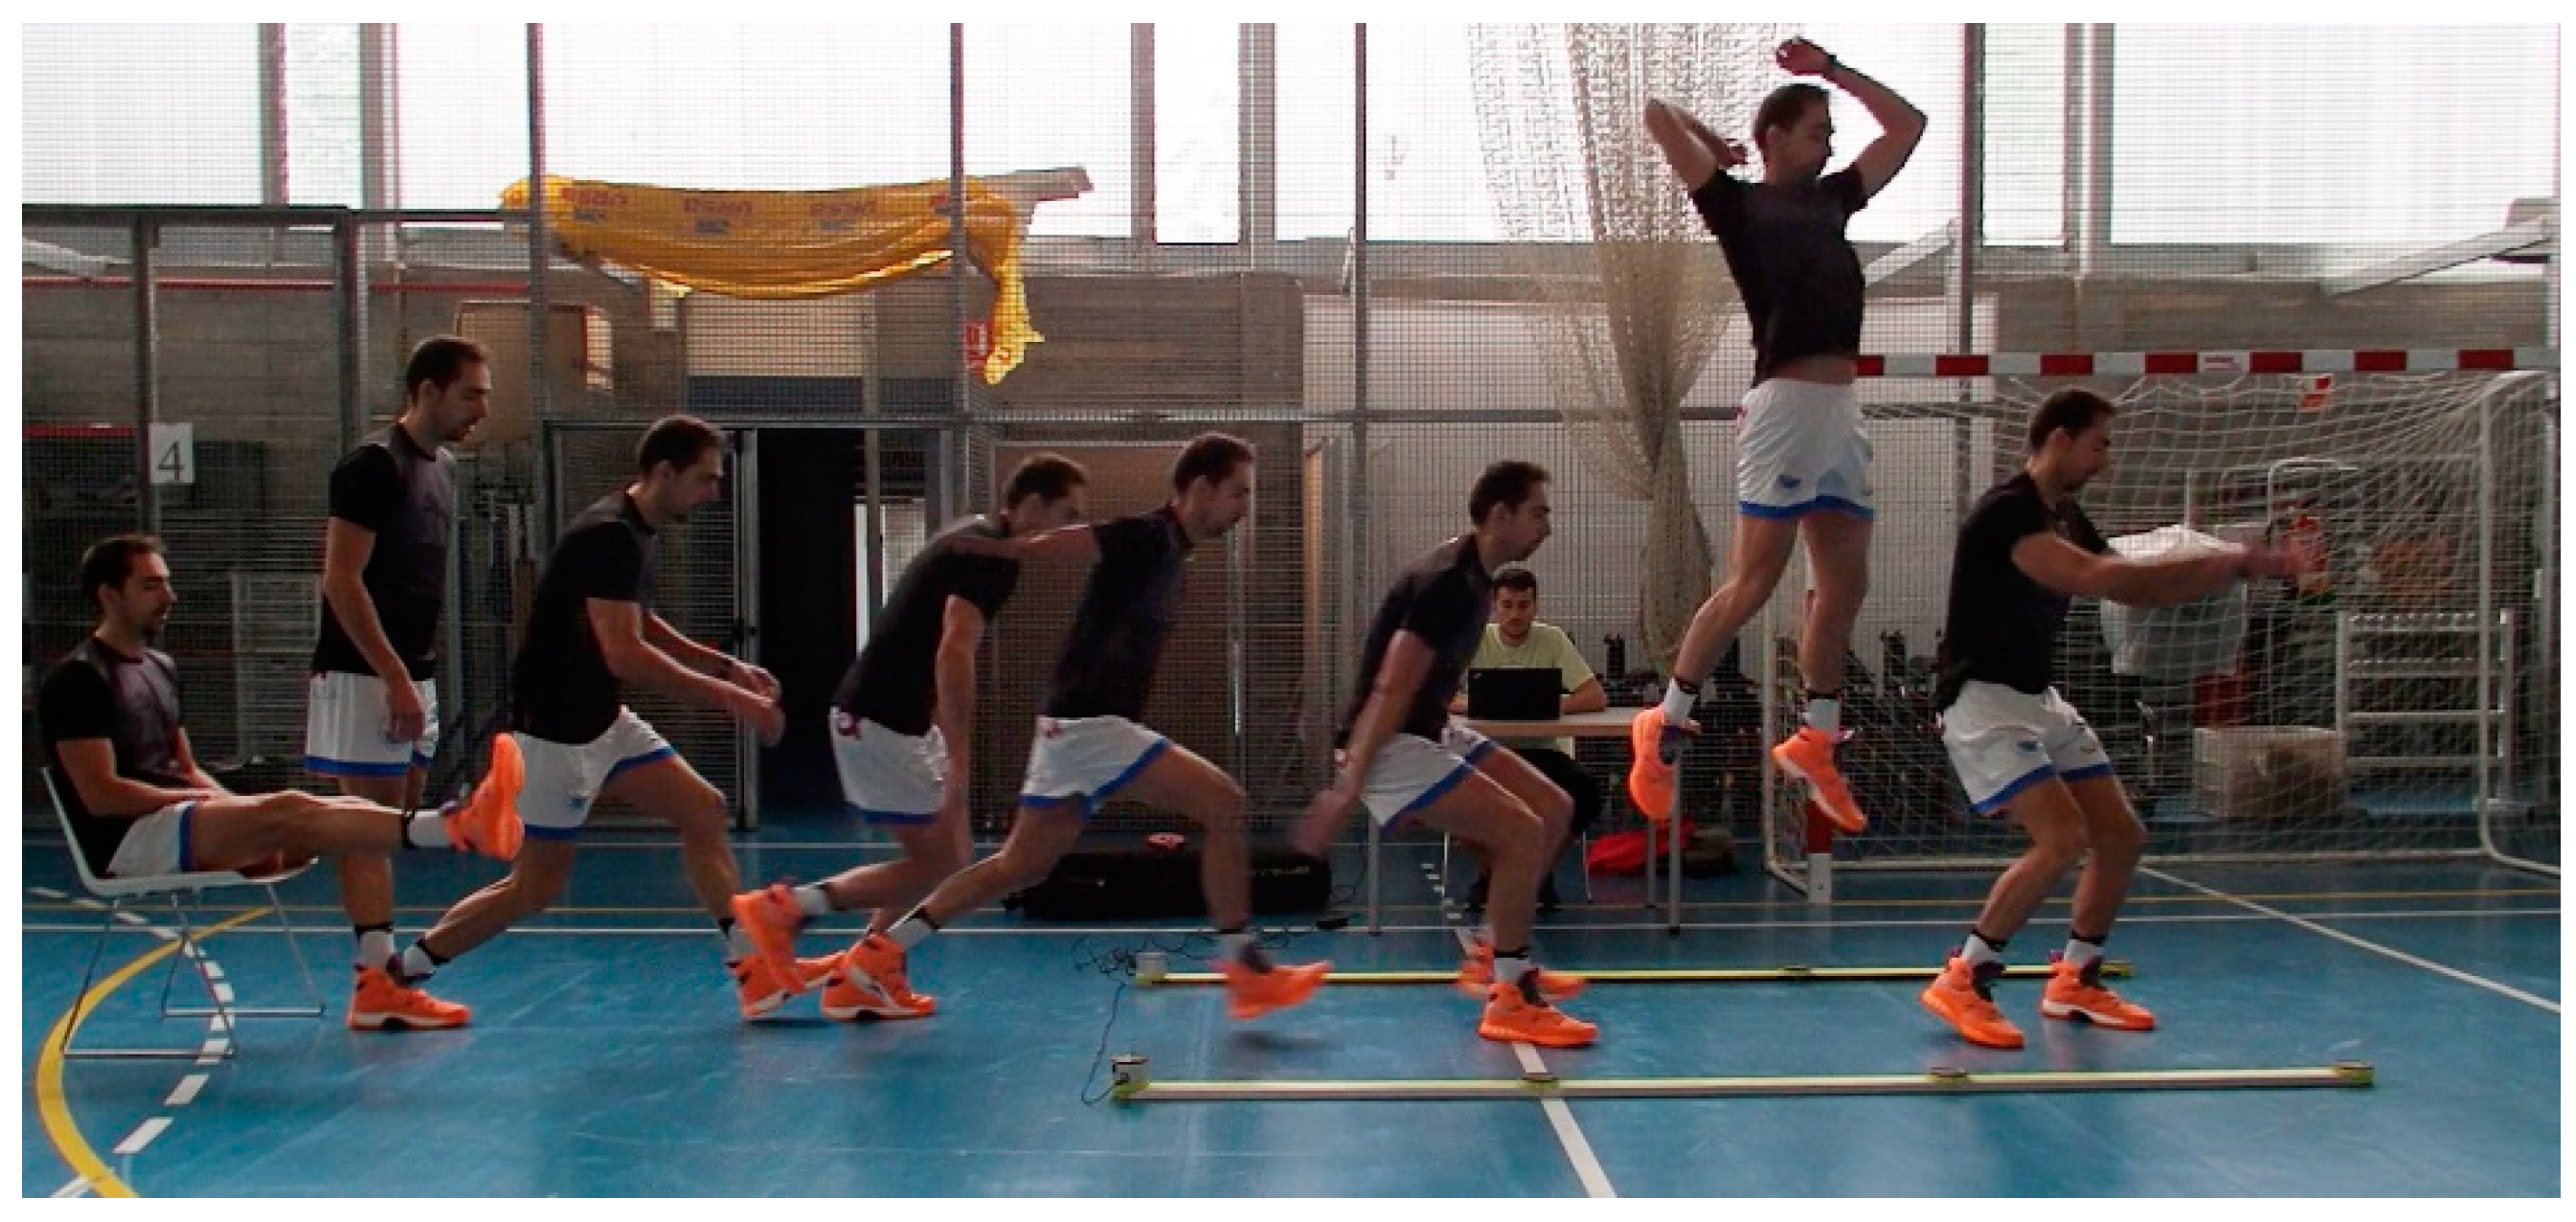
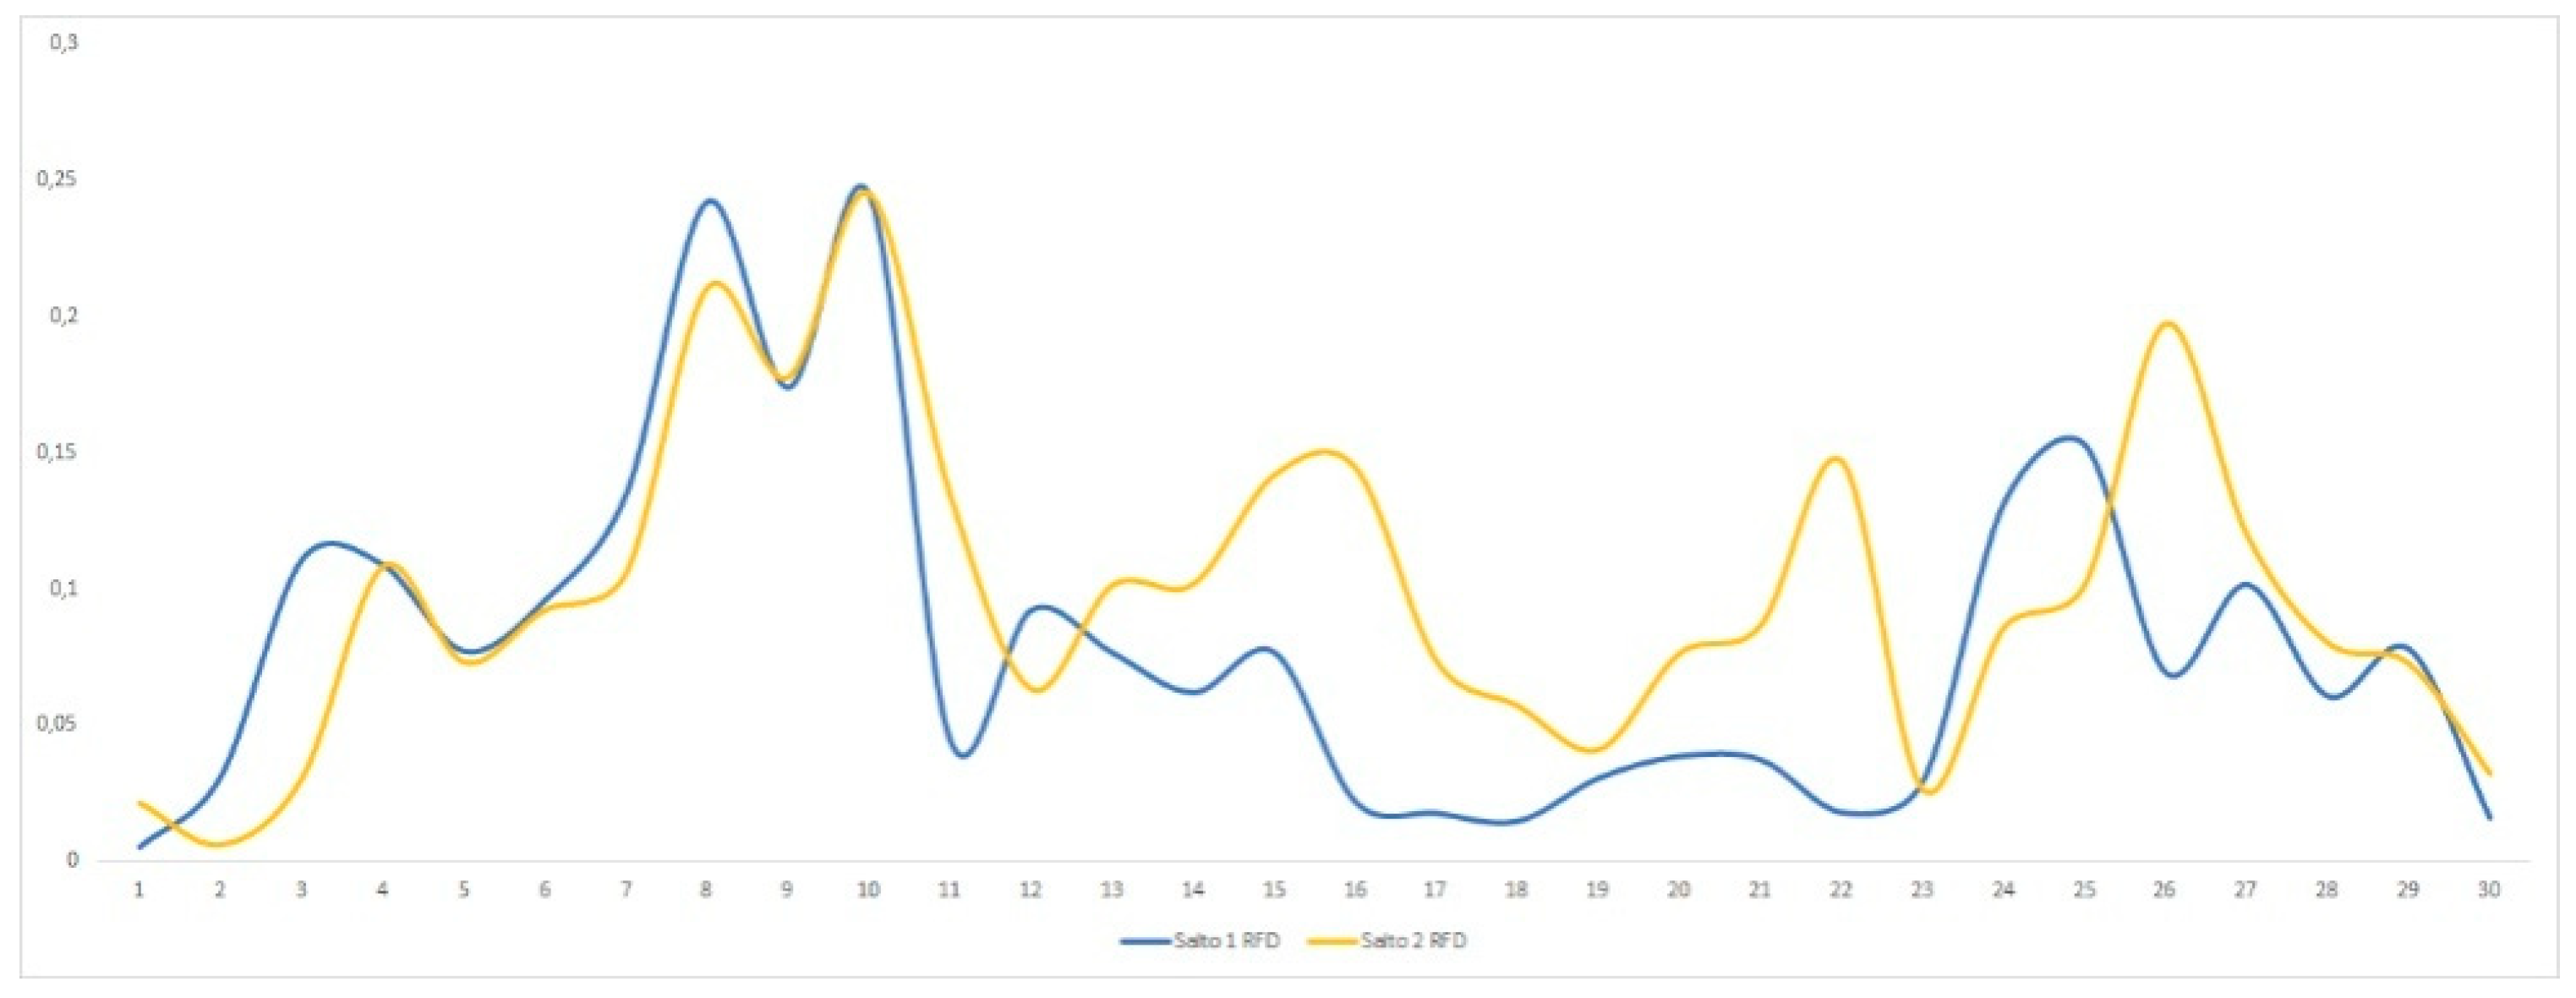
2.3.7. Attack Jump (AJ)

The AJ [29] is a performance test performed on an Optojump™ Next system of photoelectric cells (Microgate Corporation, Bolzano, Italy) that measures the contact time to the ground and the flight time, using optical system measurements consisting of a transmitting and receiving bar, with an accuracy of 1/1000 s. The flight time (Tf) and the gravity acceleration (g) were automatically used by the Optojump™ Next software (v.1.12.1. for Windows, Microgate Corporation, Bolzano, Italy) to calculate the vertical height (h) of the jump.
  h = T f 2 × g 8  
The reliability of the Optojump™ system in different jump tests has been proven to be excellent, with an ICC of 0.982 to 0.989 and a low coefficient of variation (2.7%) [40].
The jump is performed by taking a first step out of the Optojump™ 3 m Kit corridor formed by six interface bars (three RX bars that have interface and 30 mm of resolution, and three TX bars without interface and 10 mm of resolution) to enter into it with the second and third step, making the volleyball jump with the armed arm and simulating the hit of the ball at the highest point of the jump, and finally landing inside the the Optojump™ corridor, as shown in Figure 2. The asymmetry was calculated based on this parameter, using the following formula [33]:
  ( s t r o n g   l e g w e a k   l e g ) / s t r o n g   l e g × 100  

2.3.8. Muscular Electrical Activity during the Attack Jump (MEA-AJ)

To collect the data referring to the muscle electrical activity in the biceps femoris (BF) and rectus femoris (RF) of both legs during the attack jump, the electromyography (EMG) bioPLUX wireless system (Plux Wirelees Biosignals, Lisbon, Portugal) together with the placement of the emgPLUX sensors to the conductive adhesive hidrogel electrodes (30 mm, Meditrace-Kendall, Covidien IIc, Mansfield, MA, USA) were used. The EMG bioPLUX is a device that collects and digitizes the signals from the sensors, and transmits via Bluetooth to the computer, where they are visualized in real time. It has four analogic channels with a sampling frequency of 1000 Hz, with 12 bits of resolution, a range of ±1.5 mV, and a bandwidth of 25–500 Hz. The data collection was carried out with the OpenSignals revolution software (Plux Wirelees Biosignals, Lisbon, Portugal).
The placement of the electrodes followed the same guidelines as in the TMG in both muscles, but the distance of 5 cm between electrodes was shortened to 1 cm [41].
The data processing was carried out with software developed ad hoc, based on Excel (Microsoft®, v.16.13.1). In this program, we have included the parameters by which the graphs will be filtered.
For this purpose, the attack jump was divided into three phases [42]. The take-off phase, which was defined from the moment the player makes the last step before the jump until the last foot leaves the ground. From that moment, the flight phase begins until the first foot comes in contact with the ground, this starts the landing phase, and finishes at the moment the athlete ends the eccentric braking phase of the jump. Once the start and end of the electrical activity has been determined, the root mean square (RMS) has been calculated on the uncorrected filtered graph that measures the power of the electromyography signal [43].
In order to calculate the RMS in each phase of the attack jump (take-off, flight, and landing) each jump was recorded by a video camera (Olympus Stylus SP-100EE, Tokyo, Japan) at 240 Hz, and the images of the jumps were synchronized with the electromyography signal graph. This test was performed simultaneously to the AJ, following a protocol initiated by sitting in a relaxed position, and then a strong and rapid contraction of the rectus femoris of the dominant leg was performed. Once it was done, the player got up and performed the AJ as described above.
The asymmetry was calculated in each muscle, using the following formula [33]:
  ( s t r o n g   l e g w e a k   l e g ) / s t r o n g   l e g × 100  

2.3.9. Single-Leg Squat Jump (SLSJ)

This test has been used to establish the lateral symmetry of the explosive force, determined by the measurement of the average propulsive velocity of displacement (m/s) in a vertical jump. A vertical jump on one leg was performed in a Multipower (TECHNOGYM®, Cesena, CF, Italy), starting from a 90° knee angle [44]. To determine the knee angle, the athletes started from a seated position, previously marked with a digital goniometer (Baseline® Absolute Axis 360°, Fabrication Enterprises, Inc., White Plains, NY, USA). The athletes had to move a guided bar with a weight equal to 50% of their body weight, and were instructed to place their foot close to the center of the mass projection, but always with the hip in a horizontal position. For that, the non-performing leg remained separated from the floor, with the hip flexed and the knee semi-extended throughout the execution. At the signal, the athletes had to perform a concentric contraction at the highest possible speed, with the order to “try to jump”. The average propulsive velocity of the displacement (m/s) was determined through a Linear Encoder (CHRONOJUMP Boscosystem®, Barcelona, Spain).
Previously, the player was allowed to perform two jumps with each leg, to place himself and so the evaluator could adjust his placement and angulation. The asymmetry was calculated using the following formula [33]:
  ( s t r o n g   l e g w e a k   l e g ) / s t r o n g   l e g × 100  

2.3.10. Bilateral Maximum Repetition in Leg Press (1RMSL)

This test has been used to establish the lateral symmetry of the concentric maximum force, determined in kilograms. To determine the maximum strength, the protocol of Baechle and Earle [30] was followed by eliminating the warm-up with light loads, so as not to create accumulated fatigue from the previous tests. The players sat themselves in the Leg Press ARTIS® (TECHNOGYM®, Cesena, CF, Italy) with one leg resting on the platform (close to the midline of the body projection) and with the opposite leg as symmetric as possible, but without being in contact with the platform, in order to develop strength with the hip aligned. The athletes were expressly forbidden to cross the free leg behind the assed leg at the time of performing the force. The athletes were placed at an initial knee angle of 90°, assessed with a digital goniometer (Baseline® Absolute Axis 360°, Fabrication Enterprises, Inc., White Plains, NY, USA), and from this position, the platform was pushed until reaching the full knee extension.
The asymmetry was calculated according to the following [33]:
  ( s t r o n g   l e g w e a k   l e g ) / s t r o n g   l e g × 100  

2.4. Statistical Analysis

The relative reliability was calculated through intraclass correlation coefficient (ICC) analysis using single measurement, two-way mixed effects model, and absolute agreement. Generally, it is considered that a value less than 0.5 is an indicator of poor reliability, values between 0.5 and 0.75 indicate moderate reliability, values between 0.75 and 0.9 indicate good reliability, and values greater than 0.9 indicate excellent reliability [45]. The coefficient of variation (CV) was used as a measure of absolute reproducibility.
The application of the Shapiro–Wilk test, in conjunction with the Lilliefors test, showed that the sample distribution was normal, linear, and homoscedastic. To relate the variables of symmetry with each other and also with the performance variables, the Pearson’s bivariate correlation coefficient was used. An alpha level of p < 0.05 was considered statistically significant. All of the data were analyzed using SPSS v19.0 for Windows (SPSS Inc., Chicago, IL, USA).

3. Results

As it can be seen in Table 1, the relative and absolute within-day reliability of the symmetry and performance variables have been analyzed (all except for 1RMSL). Th test–retest reliability of the symmetry tests, AKE test, and LS (obtained through Tensiomyography) show an excellent relative and absolute reproducibility in both legs. Figure 3 shows the graph obtained from the two BF time–displacement curves, of the right and left leg, appreciating the athlete’s neuromuscular difference between both, because the BF of the right leg shows a greater maximum radial muscle belly displacement, as well as a greater reaction and contraction time than the left leg. For YBT, the relative reliability is moderate to excellent in both of the lower limbs, and the absolute reliability is good to excellent. Specifically, the posterolateral axis of the YBT presents the best relative and absolute reliability. In this line, the SJ test presents a moderate to excellent relative reproducibility in the right leg, and good to excellent in the left leg, but with a lower absolute reproducibility than the other symmetry tests.
On the other hand, THTD and RMS, obtained by EMG, have a lower relative reproducibility (poor to good in the right leg, and moderate to excellent in the left leg in THTD test, and poor to excellent in the right leg, and poor to good in the left leg) than the other tests of symmetry and an acceptable absolute reproducibility (under CV) in THT test, while the CV in RMS is very large, showing an insufficient absolute reproducibility.
In terms of performance tests, the T-test, CMJ, and AJ all have a low CV, which indicates excellent absolute reproducibility, and the CMJ also has a moderate to excellent relative reproducibility. However, the T-test and the AJ obtain a test–retest reliability poor to excellent for AJ, and poor to good for the T-test.
When establishing the possible relationships between the different measures of symmetry, the RMS variable by EMG was discarded, because of its very poor absolute reproducibility and relative poor to good reproducibility. This can be seen in the Figure 4, where there is a superposition of two RMS graphs of the rectus femoris of the same athlete, where the difficulty of reproducibility of this tool can be appreciated.
Among the measures of lateral symmetry, a moderate negative correlation was found between the anterior symmetry of the YBT and the symmetry in THTD (r = −0.57; p = 0.01), between the YBT CS and THTD (r = −0.61; p = 0.007), and between the lateral symmetry of the biceps femoris and the symmetry values of 1RMSL (r = −0.59; p = 0.03). In addition, a moderate positive correlation was found between the symmetry values of the THTD and the symmetry values of the AKE (r = 0.50; p = 0.03), and the symmetry values of 1RMSL (r = 0.65; p = 0.01).
Finally, when relating the asymmetry measurements of the different tests and the performance tests, a moderate negative correlation was found between the performance in the AJ (flight time) and the symmetry in the THTD (r = −0.58; p = 0.01). In addition, a moderate positive correlation was found between the performance in the AJ (flight time) and the composite score (CS) of the YBT of the right leg (r = 0.57; p = 0.02) and of the left leg (r = 0.57; p = 0.02). The performance in CMJ has also correlated positively and moderately with the composite score (CS) of the YBT of the right leg (r = 50; p = 0.03) and of the left leg (r = 0.45; p = 0.05). Finally, the performance in the T-test has correlated in a moderate negative way with the composite score (CS) of the YBT of the left leg (r = −0.47, p = 0.03).
Logically, a moderate negative correlation was also found between the performance in the T-test and the performance in the AJ (flight time) (r = −0.65; p = 0.006) and the performance in CMJ (r = −0.55; p = 0.01).

4. Discussion

The main findings of this research are that, from the designed battery, the AKE, the YBT, and the LS obtained through TMG are the symmetry tests with the better relative and absolute reproducibility. Among the performance tests, the CMJ obtained the best values. On the other hand, a greater lateral symmetry in the THTD test seems to also indicate a greater lateral symmetry in the AKE and in the 1RMSL, as it correlates positively with both. Finally, a greater symmetry in the composite score of the YBT in both legs seems to indicate a higher performance in the CMJ and in the AJ tests.
The LS obtained through TMG has been used as a measure of symmetry in cyclists [46] and in beach volleyball players [23], but unfortunately in none of these works has the reproducibility of this particular variable been addressed. The relative and absolute reproducibility over which the LS is calculated have shown high values [47], which seems to corroborate the results of the excellent reproducibility obtained in this test.
In addition, the AKE test has obtained excellent reproducibility results. However, the values obtained by sports medicine students [25], where the ICC was 0.87 (0.58–0.97) in the D and 0.81 (0.41–0.94) in the ND limb, and those obtained by students on a sports rehabilitation course with ICC 0.76 (0.39–0.90) [48], are inferior. This may be due to the fact that the samples used by these authors were not well trained athletes, so the characteristic strength training of volleyball players would imply better values in dynamic flexibility, as the ROM is a multidimensional factor [49]. Specifically, this better performance in the AKE test would come from a better intra- and inter-muscular coordination in the volleyball players. Another possible explanation is that volleyball players´ work at wide knee joint angles because of their defensive position, where the center of gravity is very low and close to the ground, needing a more stable muscle control. However, this is only a hypothesis that should be still checked.
The SLSJ and the YBT are the following symmetry tests with better reproducibility. In the YBT case, it shows a good to excellent reproducibility (ICC between 0.74–0.88 and a CV less than 10% in all its variables). The results obtained by Shaffer et al. [34] in the subjects between 16–35 years, without recent injuries in lower limbs or spine, and with an ICC between good and excellent (0.80–0.91), are in line with our results for volleyball players. However, those obtained by Linek et al. [35] in young soccer players (average age of 15.6 years) with a moderate to good ICC (0.57–0.82) indicate a lower reproducibility, which could point out that the reproducibility of the YBT could be influenced by the population under study. On the other hand, the SLSJ presents a greater reproducibility in the left leg (ICC 0.92 and CV 12.3%) than in the right leg (ICC 0.83 and CV 14.1%). A reasonable explanation is that the sample players have dominance of the RH, so their left leg is more stable, which would imply a better application of force with less disturbance, thus giving greater stability in the measure [50].
The THTD is the symmetry test with lower reproducibility, with poor reproducibility in the right leg (ICC 0.48 and CV 8.5%), but good in the left (ICC 0.76 and CV 8.7%). This contrasts with the excellent reproducibility found in university students of different sports, both collective and individual sports, with ICC 0.95 (0.92–0.97) [51]. The low reproducibility of the right leg could be again because of the dominance of RH, which makes the left leg the more stable, as this is the take-off limb with which the players of this sample preferably perform the attack jump hitting the ball with their right hand, which is consistent with the findings of Loturco et al. [52]. The test with the lowest reproducibility is the EMG-AJ. This low reproducibility could be due to the low activation and relaxation control of the players, or to the choice of the RMS calculation times. Further studies will be necessary to be able to determine the EMG-AJ reliability.
Among the performance tests, the CMJ has the highest reproducibility (ICC 0.87 and CV 4.4%), although it is lower that what Markovic et al. [37] found in young students (19.6 ± 2.1 years with ICC 0.98 and CV 2.8%). This difference could be due to the difficulty for volleyball players to jump with their hands fixed on their hips, because their mechanical performance model requires a coordinated movement of the arms. On the contrary, the reproducibility of the AJ (ICC 0.82 and CV 2.8%) has obtained identical values to those reported by Sattler et al. [53] in volleyball players (CV 2.8%) following the same procedure. Finally, in the T-test, we have obtained significantly lower values (ICC 0.65 and CV 2.4%) to those found by Raya et al. [54] in the American Military Navy (ICC 0.98), or those reported by Munro et al. [55] in students of 22.3 ± 3.7 years of age (ICC 0.82). This moderate reproducibility could be due to the fact that the T-test, in the way that it has been made, does not faithfully reproduce the movement of the volleyball players, as the distances at a high speed are lower in this sport. A possible solution would be modifying the distances between the cones to adapt them to the mechanical performance model of volleyball.
As previously mentioned, it seems that evaluating the lateral asymmetry is relevant to estimate the injury risks or to determine a greater or lesser sport performance. However, from our knowledge, only the work of Loturco et al. [52] has studied the relationship that may exist between different tests to assess bilateral symmetry.
In this sense, the results of the symmetry tests have shown certain discrepancies. It seems logical that there is a positive relationship of symmetry between the THTD and the 1RMSL (r = 0.65; p = 0.01), as in both, we evaluate the dynamic muscular strength. Specifically, the THTD evaluates the elastic–explosive force and the 1RMSL the maximum neuromuscular force, so a greater asymmetry in 1RMSL is related to a greater asymmetry in THTD, and vice versa. In fact, it was determined in young athletes (20.0 ± 1.2 years) that the muscle mass asymmetry of the lower limbs (on which the ability to produce strength in the 1RM test depends) was at least partially responsible for the force and power asymmetries [56].
The positive relationship found between the THTD and the AKE flexibility test (r = 0.50, p = 0.03) also seems logical, indicating that the players with the greatest difference between strength and power in the lower limbs are those that also show the greatest differences between the dynamic hamstring flexibility of both legs. This finding still needs a reasonable explanation that could go in line with the needs to maintain a functional symmetry between the strength developed by the quadriceps and the hamstrings (H/Q ratio), understood as the functional capacity of the knee joint and the balance between the agonists and antagonists muscles [57]. In particular, it would be more appropriate to use the functional H/Q ratio, defined as the percentage ratio between the peak force of the knee flexors during an eccentric contraction and the peak of the quadriceps force during a concentric contraction (H.ecc/Q.con) [58].
Less logical and lacking reasonable explanations are the negative interrelationships found between the anterior YBT and the THTD, or between the LS of the BF and the 1RMSL. However, the few interrelationships found in this work are, to some extent, in line with the findings of Loturco et al. [52], who, using an isokinetic test, did not find contralateral differences between the parameters derived from the TMG and the unilateral jumps. This suggests that a single diagnostic test for symmetry should not be used. In summary, we are dealing with symmetry measurements with parameters that evaluate different conditional capacities, which makes it difficult to find interrelationships between them.
A priori, it would be expected that a good number of interrelationships between the symmetry tests and performance tests would be found, as well as better performances the more symmetrical the athlete is [59], such as in sprints and jumps [59,60]. However, some authors [11,52,61] have not found a significant influence of bilateral asymmetries on performance, or at least not if these are less than 15% in jump actions [59]. Our results indicate that a greater lateral symmetry in the THTD test is related to a lower AJ (r = −0.58, p = 0.01), which is not easily explained. In the basic technique of the volleyball attack jump, the take-off is done with both feet at the same time [15], suggesting that there should be a better performance in the AJ the more symmetrical the player is, which is the opposite of what our results have shown.
On the contrary, some logical interrelations were found, which indicate that a higher performance in the CMJ and the AJ tests is related to a greater symmetry of the CS of the YBTD test. There is no doubt that balance is a necessary quality to be able to express force. This implies that a greater stability of the lower limbs would produce a greater force transmission capacity to the ground by the lower limbs of the volleyball players [62], which would have a clear influence on the height reached in the jump, or in the flight time, as we have found in this case.
Balance, on the other hand, is the most important predictor in lateral movements [63], in such a way that a deficit in this coordinative capacity would have some influence on agility. In this sense, our findings indicate that a greater symmetry in the CS of the YBT of the left leg (greater balance of the left leg) is related to a better performance in the T-test (less time to carry out the test), which suggests that the balance has some influence on the volleyball players’ performance.
Finally, the moderate negative interrelation found between the performance tests logically indicates that a shorter time spent in the T-test is related to a longer flight time in AJ (r = −0.65; p = 0.006). The same happens between the T-test and the flight time of the CMJ (r = −0.55; p = 0.01). This may be because all of these tests require the same type of muscle fibers, IIx.
According to our knowledge, this is the first research that addresses the problem of muscle symmetry using a large battery compose of ten tests that covers all of the conditional capacities of the volleyball player, trying to determine which tests can provide better information to detect muscle asymmetries. However, there is no doubt that the findings obtained with this work should be taken with prudence. In the first place, the number of participants limits the generalizability of the results, which in itself was not the aim of this work. It would also be necessary to include more athletes from other volleyball teams, which would allow us to use the type of mechanical performance model as a factor of discrimination. In addition, years of experience should also be taken into account as a factor that gradually, because of specialization, can increase lateral asymmetry. Although, Seminati et al. [64] determined that the most trained subjects showed the highest level of kinematic symmetry during running, so perhaps the performance lever factor is more appropriate than simply the years of experience.
On the other hand, it seems necessary to refine the evaluation in several tests. The T-test could be more suited to the performance model of each sport, or the EMG-AJ test. where it seems appropriate to explore another way of adjusting the EMG signal to the player’s movement and determining more concrete phases to calculate the RMS of the biosignal. Finally, establishing the compensation training experience (strength and flexibility) as an inclusion or exclusion criteria will allow for having a more homogeneous profile of the players.

5. Conclusions

In conclusion, the testing of the bilateral symmetry test battery, together with the performance tests, indicate that the bilateral symmetry tests of AKE, LS (obtained through tensiomyography), and YBT have a better relative and absolute reproducibility than the rest of the studied tests. This would allow us to establish the bilateral symmetry with reliability, in terms of mobility, dynamic flexibility, and the contractile properties of the muscular structures analyzed. On the bilateral symmetry tests of force production, a greater symmetry in the THTD seems to also indicate a greater lateral symmetry in 1RMSL, so both could be included in the bilateral force symmetry evaluation model. Finally, a greater symmetry in the composite score of the YBT in both legs seems to indicate a higher performance in the CMJ and in AJ test, that is, it seems that performance in the bilateral vertical jump tests, in volleyball players, is influenced by the lower limbs’ stability at the moment of force application.

Author Contributions

Conceptualization, M.I.-C. and O.G.-G.; investigation, M.I.-C., J.C.-L., A.C.-D., and O.G.-G.; methodology, M.I.-C., T.Á.-Y., A.C.-D., and O.G.-G.; resources, J.C.-L. and T.Á.-Y.; software, J.C.-L.; supervision, O.G.-G.; writing—original draft, M.I.-C., T.Á.-Y., and O.G.-G.

Funding

This research received no external funding.

Conflicts of Interest

The authors declare no conflict of interest.

References

  1. Serrien, D.J.; Ivry, R.B.; Swinnen, S.P. Dynamics of hemispheric specialization and integration in the context of motor control. Nat. Rev. Neurosci. 2006, 7, 160–166. [Google Scholar] [CrossRef] [PubMed]
  2. Hebbal, G.V.; Mysorekar, V.R. Evaluation of Some Tasks Used for Specifying Handedness and Footedness. Percept. Mot. Skills 2006, 102, 163–164. [Google Scholar] [CrossRef] [PubMed]
  3. De Ruiter, C.J.; de Korte, A.; Schreven, S.; de Haan, A. Leg dominancy in relation to fast isometric torque production and squat jump height. Eur. J. Appl. Physiol. 2010, 108, 247–255. [Google Scholar] [CrossRef] [PubMed] [Green Version]
  4. Hewit, J.K.; Cronin, J.B.; Hume, P.A. Asymmetry in multi-directional jumping tasks. Phys. Ther. Sport 2012, 13, 238–242. [Google Scholar] [CrossRef] [PubMed]
  5. Menzel, H.J.; Chagas, M.H.; Szmuchrowski, L.A.; Araujo, S.R.S.; de Andrade, A.G.P.; de Jesus-Moraleida, F.R. Analysis of Lower Limb Asymmetries by Isokinetic and Vertical Jump Tests in Soccer Players. J. Strength Cond. Res. 2013, 27, 1370–1377. [Google Scholar] [CrossRef] [PubMed]
  6. Newton, R.U.; Gerber, A.; Nimphius, S.; Shim, J.K.; Doan, B.K.; Robertson, M.; Pearson, D.R.; Craig, B.W.; Häkkinen, K.; Kraemer, W.J. Determination of functional strength imbalance of the lower extremities. J. Strength Cond. Res. 2006, 20, 971–977. [Google Scholar] [CrossRef] [PubMed]
  7. Knapik, J.J.; Bauman, C.L.; Jones, B.H.; Harris, J.M.; Vaughan, L. Preseason strength and flexibility imbalances associated with athletic injuries in female collegiate athletes. Am. J. Sports Med. 1991, 19, 76–81. [Google Scholar] [CrossRef] [PubMed]
  8. Yamamoto, T. Relationship between hamstring strains and leg muscle strength. A follow-up study of collegiate track and field athletes. J. Sports Med. Phys. Fitness 1993, 33, 194–199. [Google Scholar] [PubMed]
  9. Bond, C.W.; Cook, S.B.; Swartz, E.E.; Laroche, D.P. Asymmetry of lower extremity force and muscle activation during knee extension and functional tasks. Muscle Nerve 2017, 56, 495–504. [Google Scholar] [CrossRef] [PubMed]
  10. Mattes, K.; Wollesen, B.; Manzer, S. Asymmetries of Maximum Trunk, Hand, and Leg Strength in Comparison to Volleyball and Fitness Athletes. J. Strength Cond. Res. 2018, 32, 57–65. [Google Scholar] [CrossRef] [PubMed]
  11. Yoshioka, S.; Nagano, A.; Hay, D.C.; Fukashiro, S. The effect of bilateral asymmetry of muscle strength on jumping height of the countermovement jump: A computer simulation study. J. Sport Sci. 2010, 28, 209–218. [Google Scholar] [CrossRef] [PubMed]
  12. Meylan, C.M.P.; Nosaka, K.; Green, J.; Cronin, J.B. Temporal and kinetic analysis of unilateral jumping in the vertical, horizontal, and lateral directions. J. Sport Sci. 2010, 28, 545–554. [Google Scholar] [CrossRef] [PubMed]
  13. Schons, P.; Da Rosa, R.G.; Fischer, G.; Berriel, G.P.; Fritsch, C.G.; Nakamura, F.Y.; Baroni, B.M.; Peyré-Tartaruga, L.A. The relationship between strength asymmetries and jumping performance in professional volleyball players. Sport Biomech. 2018, 36, 1–12. [Google Scholar] [CrossRef] [PubMed]
  14. Wagner, H.; Pfusterschmied, J.; Tilp, M.; Landlinger, J.; von Duvillard, S.P.; Müller, E. Upper-body kinematics in team-handball throw, tennis serve, and volleyball spike. Scand. J. Med. Sci. Sports 2014, 24, 345–354. [Google Scholar] [CrossRef] [PubMed]
  15. Leporace, G.; Praxedes, J.; Pereira, G.R.; Chagas, D.; Pinto, S.; Batista, L.A. Ativação muscular do quadril e do joelho em duas aterrissagens realizadas por atletas do sexo masculino. Rev. Bras. Med. Esporte 2011, 17, 324–328. [Google Scholar] [CrossRef] [Green Version]
  16. McGrath, T.M.; Waddington, G.; Scarvell, J.M.; Ball, N.B.; Creer, R.; Woods, K.; Smith, D. The effect of limb dominance on lower limb functional performance—A systematic review. J. Sports Sci. 2016, 34, 289–302. [Google Scholar] [CrossRef] [PubMed]
  17. Bishop, C.; Turner, A.; Jarvis, P.; Chavda, S.; Read, P. Considerations for Selecting Field-Based Strength and Power Fitness Tests to Measure Asymmetries. J. Strength Cond. Res. 2017, 31, 2635–2644. [Google Scholar] [CrossRef] [PubMed]
  18. Impellizzeri, F.M.; Rampinini, E.; Maffiuletti, N.; Marcora, S.M. A Vertical Jump Force Test for Assessing Bilateral Strength Asymmetry in Athletes. Med. Sci. Sports Exerc. 2007, 39, 2044–2050. [Google Scholar] [CrossRef] [PubMed] [Green Version]
  19. Sekiya, I.; Muneta, T.; Ogiuchi, T.; Yagishita, K.; Yamamoto, H. Significance of the single-legged hop test to the anterior cruciate ligament-reconstructed knee in relation to muscle strength and anterior laxity. Am. J. Sports Med. 1998, 26, 384–388. [Google Scholar] [CrossRef] [PubMed]
  20. Croisier, J.L.; Crielaard, J.M. Isokinetic exercise and sports injuries. Rev. Med. Liege 2001, 56, 360–368. [Google Scholar] [PubMed]
  21. Sattler, T.; Sekulic, D.; Esco, M.R.; Mahmutovic, I.; Hadzic, V. Analysis of the association between isokinetic knee strength with offensive and defensive jumping capacity in high-level female volleyball athletes. J. Sci. Med. Sport 2015, 18, 613–618. [Google Scholar] [CrossRef] [PubMed]
  22. Ato, M.; López, J.J.; Benavente, A. A classification system for research designs in psychology. Anal. Psicol. 2013, 29, 1038–1059. [Google Scholar] [CrossRef]
  23. Rodríguez Ruiz, D.; Escudero, Q.; Esther, M.; Rodríguez Matoso, D.; Sarmiento Montesdeoca, S.; Losa Reyna, J.; Guerra, S.; De, Y.; Perdomo Bautista, G.; Manso, G.; et al. The tensiomyography used for evaluating high level beach volleyball players. Rev. Bras. Med. Esporte 2012, 18, 95–99. [Google Scholar] [CrossRef]
  24. Gajdosik, R.; Lusin, G. Hamstring Muscle Tightness. Phys. Ther. 1983, 63, 1085–1088. [Google Scholar] [CrossRef] [PubMed]
  25. Mohammadi, V.; Hilfiker, R.; Jafarnezhadgero, A.A.; Jamialahmadi, S.; Karimizadeh Ardakani, M.; Granacher, U. Relationship between Training-Induced Changes in the Star Excursion Balance Test and the Y Balance Test in Young Male Athletes. Ann. Appl. Sport Sci. 2017, 5, 31–38. [Google Scholar] [CrossRef]
  26. Bolgla, L.A.; Keskula, D.R. Reliability of lower extremity functional performance tests. J. Orthop. Sports Phys. Ther. 1997, 26, 138–142. [Google Scholar] [CrossRef] [PubMed]
  27. Gabbett, T.; Georgieff, B. Physiological and anthropometric characteristics of Australian junior national, state, and novice volleyball players. J. Strength Cond. Res. 2007, 21, 902–908. [Google Scholar] [CrossRef] [PubMed]
  28. Bosco, C.; Luhtanen, P.; Komi, P.V. A simple method for measurement of mechanical power in jumping. Eur. J. Appl. Physiol. Occup. Physiol. 1983, 50, 273–282. [Google Scholar] [CrossRef] [PubMed]
  29. Sattler, T.; Sekulic, D.; Hadzic, V.; Uljevic, O.; Dervisevic, E. Vertical jumping tests in volleyball: Reliability, validity, and playing-position specifics. J. Strength Cond. Res. 2012, 26, 1532–1538. [Google Scholar] [CrossRef] [PubMed]
  30. Baechle, T.R.; Earle, R.W. ; National Strength & Conditioning Association (US). Essentials of Strength Training and Conditioning; Human Kinetics: Champaign, IL, USA, 2008; ISBN 9781492501626. [Google Scholar]
  31. García-García, O.; Serrano-Gómez, V.; Hernández-Mendo, A.; Tapia-Flores, A. Assessment of the in-season changes in mechanical and neuromuscular characteristics in professional soccer players. J. Sports Med. Phys. Fitness 2016, 56, 714–723. [Google Scholar] [PubMed]
  32. García-García, O.; Cancela-Carral, J.M.; Martínez-Trigo, R.; Serrano-Gómez, V. Differences in the contractile properties of the knee extensor and flexor muscles in professional road cyclists during the season. J. Strength Cond. Res. 2013, 27, 2760–2767. [Google Scholar] [CrossRef] [PubMed]
  33. Bishop, C.; Read, P.; Lake, J.; Chavda, S.; Turner, A. Inter-Limb Asymmetries: Understanding how to Calculate Differences from Bilateral and Unilateral Tests. Strength Cond. J. 2018. [Google Scholar] [CrossRef]
  34. Shaffer, S.W.; Teyhen, D.S.; Lorenson, C.L.; Warren, R.L.; Koreerat, C.M.; Straseske, C.A.; Childs, J.D. Y-balance test: A reliability study involving multiple raters. Mil. Med. 2013, 178, 1264–1270. [Google Scholar] [CrossRef] [PubMed]
  35. Linek, P.; Sikora, D.; Wolny, T.; Saulicz, E. Reliability and number of trials of Y Balance Test in adolescent athletes. Musculoskelet. Sci. Pract. 2017, 31, 72–75. [Google Scholar] [CrossRef] [PubMed]
  36. Miller, M.G.; Herniman, J.J.; Ricard, M.D.; Cheatham, C.C.; Michael, T.J. The Effects of a 6-Week Plyometric Training Program on Agility. J. Sports Sci. Med. 2006, 5, 459–465. [Google Scholar] [PubMed]
  37. Markovic, G.; Dizdar, D.; Jukic, I.; Cardinale, M. Reliability and factorial validity of squat and countermovement jump tests. J. Strength Cond. Res. 2004, 18, 551–555. [Google Scholar] [CrossRef] [PubMed]
  38. Thomas, C.; Comfort, P.; Dos’Santos, T.; Jones, P.A. Determining Bilateral Strength Imbalances in Youth Basketball Athletes. Int. J. Sports Med. 2017, 38, 683–690. [Google Scholar] [CrossRef] [PubMed]
  39. De Blas, X.; Padullés, J.M.; López del Amo, J.L.; Guerra-Balic, M. Creation and Validation of Chronojump-Boscosystem: A Free Tool to Measure Vertical Jumps. Rev. Int. Cienc. Deporte 2012, 8, 334–356. [Google Scholar] [CrossRef] [Green Version]
  40. Glatthorn, J.F.; Gouge, S.; Nussbaumer, S.; Stauffacher, S.; Impellizzeri, F.M.; Maffiuletti, N.A. Validity and reliability of Optojump photoelectric cells for estimating vertical jump height. J. Strength Cond. Res. 2011, 25, 556–560. [Google Scholar] [CrossRef] [PubMed]
  41. Perotto, A.; Delagi, E.F.; Iazzetti, J.; Morrison, D. Anatomical Guide for the Electromyographer: The Limbs and Trunk; Charles C Thomas. LTD: Springfield, IL, USA, 2005; ISBN 978-0-398-08649-7. [Google Scholar]
  42. Cerrato, D.V.; Andrés, J.M.P.; Frutos, J.B. Mechanics of the spike execution in volleyball. Mov. Hum. 2013, 5, 33–51. [Google Scholar]
  43. Fukuda, T.Y.; Echeimberg, J.O.; Pompeu, J.E.; Garcia Lucareli, P.R.; Garbelotti, S.; Gimenes, R.O.; Apolinario, A. Root Mean Square value of the electromyographic signal in the isometric torque of the quadriceps, hamstrings and brachial biceps muscles in female subjects. J. Appl. Res. 2010, 10, 32–39. [Google Scholar]
  44. Kockum, B.; Heijne, A.I.-L.M. Hop performance and leg muscle power in athletes: Reliability of a test battery. Phys. Ther. Sport 2015, 16, 222–227. [Google Scholar] [CrossRef] [PubMed]
  45. Koo, T.K.; Li, M.Y. A Guideline of Selecting and Reporting Intraclass Correlation Coefficients for Reliability Research. J. Chiropr. Med. 2016, 15, 155–163. [Google Scholar] [CrossRef] [PubMed] [Green Version]
  46. García-García, O.; Hernández-Mendo, A.; Serrano-Gómez, V.; Morales-Sánchez, V. Application of the generalizability theory of tensiomyography analysis of professional cyclists route. Rev. Psicol. Deporte 2013, 22, 53–60. [Google Scholar]
  47. Martín-Rodríguez, S.; Loturco, I.; Hunter, A.M.; Rodríguez-Ruiz, D.; Munguia-Izquierdo, D. Reliability and Measurement Error of Tensiomyography to Assess Mechanical Muscle Function: A Systematic Review. J. Strength Cond. Res. 2017, 31, 3524–3536. [Google Scholar] [CrossRef] [PubMed]
  48. Norris, C.M.; Matthews, M. Inter-tester reliability of a self-monitored active knee extension test. J. Bodyw. Mov. Ther. 2005, 9, 256–259. [Google Scholar] [CrossRef]
  49. Moras, G. Amplitude of Joint Movement and Its Assessment: The Flexometric Test; University of Barcelona: Barcelona, Spain, 2003. [Google Scholar]
  50. Bermejo, J.; Palao, J.M.; Valadés, D. Analysis of volleyball spike in female elite players. AGON Int. J. Sport Sci. 2013, 3, 22–32. [Google Scholar]
  51. Haitz, K.; Shultz, R.; Hodgins, M.; Matheson, G.O. Test-retest and interrater reliability of the functional lower extremity evaluation. J. Orthop. Sports Phys. Ther. 2014, 44, 947–954. [Google Scholar] [CrossRef] [PubMed]
  52. Loturco, I.; Pereira, L.; Kobal, R.; Abad, C.; Komatsu, W.; Cunha, R.; Arliani, G.; Ejnisman, B.; de Castro Pochini, A.; Nakamura, F.; et al. Functional Screening Tests: Interrelationships and Ability to Predict Vertical Jump Performance. Int. J. Sports Med. 2018, 39, 189–197. [Google Scholar] [CrossRef] [PubMed]
  53. Sattler, T.; Hadžić, V.; Dervišević, E.; Markovic, G. Vertical jump performance of professional male and female volleyball players: Effects of playing position and competition level. J. Strength Cond. Res. 2015, 29, 1486–1493. [Google Scholar] [CrossRef] [PubMed]
  54. Raya, M.A.; Gailey, R.S.; Gaunaurd, I.A.; Jayne, D.M.; Campbell, S.M.; Gagne, E.; Manrique, P.G.; Muller, D.G.; Tucker, C. Comparison of three agility tests with male servicemembers: Edgren Side Step Test, T-Test, and Illinois Agility Test. J. Rehabil. Res. Dev. 2013, 50, 951–960. [Google Scholar] [CrossRef] [PubMed]
  55. Munro, A.G.; Herrington, L.C. Between-Session Reliability of Four Hop Tests and the Agility T-Test. J. Strength Cond. Res. 2011, 25, 1470–1477. [Google Scholar] [CrossRef] [PubMed] [Green Version]
  56. Bell, D.R.; Sanfilippo, J.L.; Binkley, N.; Heiderscheit, B.C. Lean Mass Asymmetry Influences Force and Power Asymmetry During Jumping in Collegiate Athletes. J. Strength Cond. Res. 2014, 28, 884–891. [Google Scholar] [CrossRef] [PubMed] [Green Version]
  57. Aagaard, P.; Simonsen, E.B.; Trolle, M.; Bangsbo, J.; Klausen, K. Isokinetic hamstring/quadriceps strength ratio: Influence from joint angular velocity, gravity correction and contraction mode. Acta Physiol. Scand. 1995, 154, 421–427. [Google Scholar] [CrossRef] [PubMed]
  58. Rosario, D.; Nikos, A.; Jaymin, B.; Mehul, P.; Bojan, B.; Marko, J.; Paolo, A.; Andrea, L. Asimmetrie nel rapporto quadricipite/ischio crurali e sue correlazioni con lesioni muscolari. Una analisi retroattiva della letteratura. Ital. J. Sports Rehabil. Posturol. 2018, 6, 1151–1167. [Google Scholar]
  59. Lockie, R.G.; Callaghan, S.J.; Berry, S.P.; Cooke, E.R.A.; Jordan, C.A.; Luczo, T.M.; Jeffriess, M.D. Relationship Between Unilateral Jumping Ability and Asymmetry on Multidirectional Speed in Team-Sport Athletes. J. Strength Cond. Res. 2014, 28, 3557–3566. [Google Scholar] [CrossRef] [PubMed]
  60. Bailey, C.; Sato, K.; Alexander, R.; Chiang, C.-Y.; Stone, M.H. Isometric force production symmetry and jumping performance in collegiate athletes. J. Treinol. 2013, 2, 1–5. [Google Scholar] [CrossRef] [Green Version]
  61. Carpes, F.P.; Mota, C.B.; Faria, I.E. On the bilateral asymmetry during running and cycling—A review considering leg preference. Phys. Ther. Sport 2010, 11, 136–142. [Google Scholar] [CrossRef] [PubMed]
  62. Giatsis, G.; Kollias, I.; Panoutsakopoulos, V.; Papaiakovou, G. Biomechanical Differences in Elite Beach-Volleyball Players in Vertical Squat Jump on Rigid and Sand Surface. Sport Biomech. 2004, 3, 145–158. [Google Scholar] [CrossRef] [PubMed]
  63. Sekulic, D.; Spasic, M.; Mirkov, D.; Cavar, M.; Sattler, T. Gender-specific influences of balance, speed, and power on agility performance. J. Strength Cond. Res. 2013, 27, 802–811. [Google Scholar] [CrossRef] [PubMed]
  64. Seminati, E.; Nardello, F.; Zamparo, P.; Ardigò, L.P.; Faccioli, N.; Minetti, A.E. Anatomically asymmetrical runners move more asymmetrically at the same metabolic cost. PLoS ONE 2013, 8, e74134. [Google Scholar] [CrossRef] [PubMed] [Green Version]
Figure 1. Volleyball player in the supine position with the knee joint fixed at 40° knee flexion angle for the evaluation of knee extensors. Positioning of the tensiomyography electrodes and sensor on the rectus femoris.
Symmetry 10 00416 g001
Figure 2. Sequence of the different phases of the attack jump in the Optojump™.
Symmetry 10 00416 g002
Figure 3. Lateral symmetry by tensiomyography graph of both of an athlete’s biceps femoris, where the absolute differences between the maximum radial displacement (Dm), contraction time (Tc), and delay time (Td) of the right and left leg can be viewed. Biceps femoris of the right leg shows a greater maximum radial muscle belly displacement, as well a greater reaction and contraction time than the left leg.
Symmetry 10 00416 g003
Figure 4. Superposition of two root mean square graphs of the rectus femoris of two-flight time measurement of a same athlete.
Symmetry 10 00416 g004
Table 1. Intraclass correlation coeficients (ICC), confidence interval, and coefficient of variations (CV) of six symmetry tests and three performance tests.
TestIntraclass Correlation95% Confidence IntervalCV (%)
Symmetry Test
YBT 1Anterior RH 20.7480.525-0.8917.3
Posterolateral RH 30.8470.641-0.9415.2
Posteromedial RH 40.8160.642-0.9228.2
Anterior LH 50.7570.550-0.8949.9
Posterolateral LH 60.8810.758-0.9513.6
Posteromedial LH 70.7800.581-0.9055.4
AKE 8Right0.9320.855-0.9722.6
Left0.9260.849-0.9691.7
THTD 9Right0.4890.197-0.7518.5
Left0.7610.518-0.9038.7
SLSJ 10Right0.8320.642-0.93914.1
Left0.9220.817-0.97312.3
LS by TMG0.9850.973-0.9923.8
MEA-AJ 11RMSRH 12Take-off 130.6970.443-0.84738.2
Flight 140.4560.107-0.70560.3
Landing 150.8220.652-0.91440.6
RMSLH 16Take-off 130.7510.529-0.87630.6
Flight 140.102-0.270-0.452128.8
Landing 150.6560.380-0.82578.5
Performance test
T-test0.6590.222-0.8722.4
CMJ 170.8700.730-0.9484.4
AJ 180.8230.244-0.9502.8
1 Y-Balance Test; 2 anterior plane with right leg; 3 posterolateral plane with right leg; 4 posteromedial plane whit right leg; 5 anterior plane with left leg; 6 posterolateral plane with left leg; 7 posteromedial plane with left leg; 8 active knee extension; 9 triple hop test for distance; 10 single-leg squat jump; 11 muscular electrical activity during the attack jump; 12 root mean square right leg; 13 take-off phase; 14 flight phase; 15 landing phase; 16 root mean square left leg; 17 counter-movement jump; 18 attack jump.

